

Summary
Synaptic connections undergo activity-dependent plasticity during development and learning, as well as homeostatic re-adjustment to ensure stability. Little is known about the relationship between these processes, particularly in vivo. We addressed this with novel quantal resolution imaging of transmission during locomotive behavior at glutamatergic synapses of the Drosophila larval neuromuscular junction. We find that two motor input types – Ib and Is – provide distinct forms of excitatory drive during crawling and differ in key transmission properties. While both inputs vary in transmission probability, active Is synapses are more reliable. High frequency firing “wakes up” silent Ib synapses and depresses Is synapses. Strikingly, homeostatic compensation in presynaptic strength only occurs at Ib synapses. This specialization is associated with distinct regulation of postsynaptic CaMKII. Thus, basal synaptic strength, short-term plasticity and homeostasis are determined input-specifically, generating a functional diversity that sculpts excitatory transmission and behavioral function.
eTOC Blurb
Newman et al. bring quantal resolution imaging of synaptic transmission to the intact behaving animal and discover that short-term synaptic plasticity and synaptic homeostasis differ between inputs onto a common postsynaptic target to create diversity in drive for locomotor behavior.
Introduction
The transfer of information between neurons throughout the nervous system relies on communication across inherently unreliable chemical synapses. Synaptic communication is further complicated by the fact that individual neurons can receive inputs from many functionally diverse neurons (Atwood and Karunanithi, 2002; O’Rourke et al., 2012). Even synapses formed by one presynaptic neuron and one or more postsynaptic target neurons can vary greatly in neurotransmitter release, postsynaptic sensitivity and plasticity (Atwood and Karunanithi, 2002; Branco and Staras, 2009; Pelkey and McBain, 2007). Additionally, postsynaptic cells are not passive receivers of information but can produce retrograde signals, including homeostatic signals that modulate synaptic release (Branco et al., 2008; Frank et al., 2006; Jakawich et al., 2010; Paradis et al., 2001; Petersen et al., 1997). The mechanisms that regulate diversity in transmission at individual synapses are not well understood, nor are their relationships to the plasticity and homeostatic mechanisms that adjust synaptic strength. In particular, it is unclear whether retrograde signaling is input- or synapse-specific and able to maintain input-context amongst diverse convergent synapses (Branco and Staras, 2009; Turrigiano, 2012).
The Drosophila larval neuromuscular junction (NMJ) is a model system for studying glutamatergic transmission, with pre- and postsynaptic molecular machinery similar to that of central excitatory synapses in vertebrates, while also possessing activity-dependent adjustments in synaptic strength, including short- and long-term plasticity, as well as homeostatic plasticity (Budnik and Ruiz-Cañada, 2006). Two morphologically distinct glutamatergic motor neurons— larger type Ib and smaller type Is—converge onto most of the larval body wall muscles used for locomotion (Atwood et al., 1993; Hoang and Chiba, 2001; Jia et al., 1993; Kurdyak et al., 1994; Lnenicka and Keshishian, 2000). There is evidence that the transmission properties of these inputs differ (Kurdyak et al., 1994; Lnenicka and Keshishian, 2000; Lu et al., 2016), thus providing a powerful system for investigating the role of input- and synapse-specificity in the regulation of basal synaptic strength, plasticity, and homeostasis. In addition, there is great heterogeneity, in that both the basal release probability (Pr) of evoked release and the frequency of spontaneous release differ greatly between synapses of the same Ib axon (Peled and Isacoff, 2011; Peled et al., 2014). We set out to understand how plasticity and homeostasis function in a diverse pool of synapses and to determine whether synaptic homeostasis operates globally or has input-specificity.
To address these questions requires high-resolution, high-speed analysis of function at many synapses simultaneously. Quantal resolution measurement of excitatory transmission through Ca2+-permeant glutamate receptors (GluRs) has been achieved by imaging chemical or genetically-encoded Ca2+ indicators (GECIs) in the postsynaptic cell (Cho et al., 2015; Guerrero et al., 2005; Lin and Schnitzer, 2016; Melom et al., 2013; Muhammad et al., 2015; Peled and Isacoff, 2011; Peled et al., 2014; Reese and Kavalali, 2015, 2016; Siegel and Lohmann, 2013). We generated a vastly improved postsynaptically targeted GECI based on GCaMP6f. When expressed in Drosophila larval muscle “SynapGCaMP6f” enables quantal imaging without voltage clamping. We combined SynapGCaMP6f with an optical platform that immobilizes larvae without anesthetics to measure synaptic transmission simultaneously at hundreds of Ib and Is synapses in the intact, behaving animal.
Our quantal imaging makes it possible to connect the elementary properties of transmission at single synapses, to the synaptic drive that is generated by convergent synaptic inputs, to the operation of muscle groups in large parts of the animal, and finally to behavior. Our observations show that basal synaptic strength, short-term plasticity and, most strikingly, synaptic homeostasis are input-specific, diversifying excitatory transmission and behavioral output.
Results
Distinct synaptic activity at Ib and Is synapses during locomotion
Most muscles in the Drosophila NMJ are innervated by two glutamatergic motor neurons (MNs), the morphologically distinct type Ib (big) and Is (small) MNs (Atwood et al., 1993). Patch clamp recordings in the ventral nerve cord (VNC) suggest that these MNs have different firing patterns and intrinsic electrophysiological properties (Choi et al., 2004; Schaefer et al., 2010). However, MN activity and synaptic release dynamics in the behaving animal are not known. To understand these differences, we constructed a new postsynaptically-targeted GECI, SynapGCaMP6f (MHC-CD8-GCaMP6f-Sh), based on GCaMP6f (Chen et al., 2013). We generated transgenic animals that express SynapGCaMP6f in all body wall muscles throughout development, where it is targeted to the plasma membrane and postsynaptic density, as done earlier (Guerrero et al., 2005; Peled and Isacoff, 2011; Peled et al., 2014). Similar to the previous postsynaptically-targeted GECIs, SynapGCaMP6f does not affect NMJ health or function, as determined by the muscle resting membrane potential (w1118 −64.3±3.6 mV n = 4; w1118;+;SynapGCaMP6f/+ −68.1±2.4 mV n = 5; p = 0.45 Student’s t-test), muscle input resistance (w1118 6.47±0.36 MΩ n = 4; w1118;+;SynapGCaMP6f/+ 5.36±0.47 MΩ n = 5; p = 0.16 Student’s t-test), excitatory postsynaptic potential (EPSP) amplitude (0.1 Hz; w1118 35.3±2.5 mV n = 4; w1118;+;SynapGCaMP6f/+ 40.0±2.0 mV n = 5; p = 0.23 Student’s t-test), or excitatory postsynaptic current (EPSC) amplitude (0.1 Hz; w1118 87.4±5.4 nA n = 4; w1118;+;SynapGCaMP6f/+ 95.9±8.2 nA n = 5; p = 0.43 Student’s t-test).
To measure synaptic transmission in vivo, we designed a transparent PDMS microchip that allows for restricted crawling motion of unanesthetized wild-type (WT) SynapGCaMP6f-expressing larvae (Figures 1A, 1B and S1A). Under wide-field epifluorescence imaging, we observed repeated bouts of increased SynapGCaMP6f fluorescence associated with bidirectional, peristaltic waves of body wall muscle contraction in the postsynaptic surround of the Ib and Is axon terminals and throughout the surface of the muscle (Figures 1C–D; Supplemental Movie 1). The waves of muscle contraction were similar to those documented previously in freely moving larvae (Heckscher et al., 2012), although in our case the restrictive chamber prevents larvae from translating, thus allowing for extended observations of individual NMJs. We focused on dorsal muscles 1, 2, 9 and 10 in the anterior segments (Figure 1E), each of which receives input from a distinct Ib MN (MN-1b, MN-2b, MN-9b and MN-10b, respectively) and a common Is MN (MNISN-Is) (Hoang and Chiba, 2001). SynapGCaMP6f imaging unambiguously differentiates Ib and Is NMJs by activity patterns and respectively high and low basal fluorescence (Figures 1F and S1B–D; Supplemental Movie 2), as Is postsynapses have significantly less subsynaptic reticulum (SSR) and less postsynaptic density protein disks-large (Dlg) (Atwood et al., 1993; Lahey et al., 1994), a protein that clusters SynapGCaMP6f to the postsynaptic density. Consistent with previous electrophysiological data in dissected larvae, with the central nervous system intact (Knodel et al., 2014; Kurdyak et al., 1994; Lu et al., 2016; Schaefer et al., 2010), both Ib and Is synapses were active during muscle contraction (Figure 1G). This fluorescence activity resembled that seen in the dissected preparation in response to electrical stimulation of the motor nerve, which triggers an action potential (AP) and evokes synchronous transmitter release (and postsynaptic Ca2+ rise) along the length of the Ib NMJ (Guerrero et al., 2005; Melom et al., 2013; Peled and Isacoff, 2011; Peled et al., 2014) (Supplemental Movie 2). As expected for a single common presynaptic MN (MNISN-Is), the Is synapses in this muscle group had a high degree of correlation, whereas the four Ib NMJs were more weakly correlated, suggesting coordination in upstream input to the dorsally projecting Ib MNs (Figure S1E).
Figure 1. In vivo SynapGCaMP6f synaptic imaging at Ib and Is NMJs during restrained locomotion.
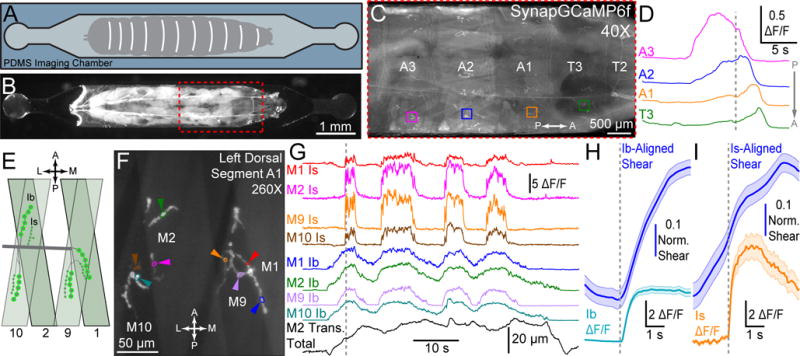
(A) Schematic of live larval imaging chamber.
(B) Wandering third instar larva mounted in imaging chamber.
(C) SynapGCaMP6f fluorescence increases at synapses as a contraction wave propagates along the body (A: anterior, P: posterior)
(D) ΔF/F traces during P-A wave in four segments of larva in (C). Gray dotted line indicates frame in (C).
(E) Schematic of NMJs on dorsal muscles of the larva (A: anterior, P: posterior, M: medial, L: lateral).
(F) Higher magnification dorsal Ib and Is NMJs.
(G) Single bouton ΔF/F traces and translation data (for muscle 10) for example in (F). Dotted line indicates frame in (F).
(H–I) Mean ΔF/F (± SEM) and mean time-locked shearing (± SEM) at onset of synaptic activity in Ib (H) and Is (I) NMJs respectively. Vertical gray dashed line indicates alignment time (Ib: n = 157 activity bouts from 51 NMJs; Is: n = 80 bouts from 42 NMJs; data from 14 larvae).
While both motor inputs were engaged during crawling, Ib synaptic activity was more closely associated with muscle translation (Figure 1G and Figure S1B–D) and initiation of local muscle contraction (Figure 1H). Additionally, Ib synaptic activity was more tightly correlated with the muscle-wide fluorescence increases triggered by Ca2+ elevation during the contraction of the muscle (Figure S1F) (see Methods). Ib synaptic transmission rose more gradually than did Is (Figure 2A), which engaged later in contraction bouts (Figure 2B), with maximal activity occurring concurrently (Figure 2C). The spatially (Figures 2D–E) and temporally integrated Ib ΔF/F activity (Figure 2F) was ~6-fold greater than Is activity at the same target muscle (Figures 2F–G), partially due to ~2.5-fold longer active times of Ib synapses (Figure 2H). These observations indicate that Ib synaptic inputs drive larger rises in local postsynaptic Ca2+ and are primarily responsible for generating muscle contraction.
Figure 2. MN drive during restrained locomotion is dominated by the Ib input.
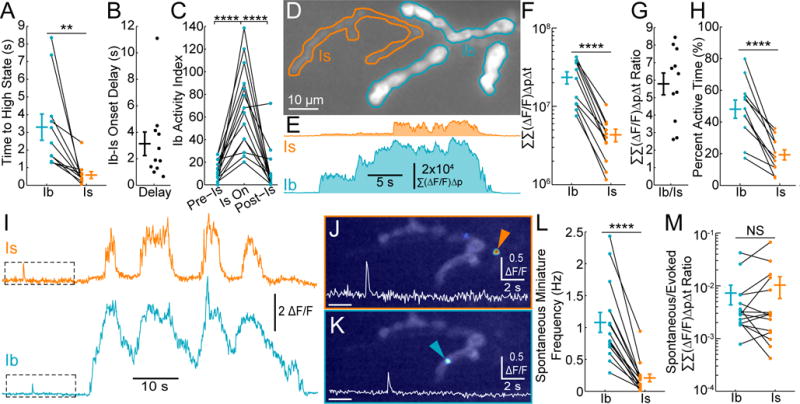
(A) Mean delay between initiation of synaptic activity and the high activity state during multiple independent activity bouts. Each point represents the average delay for a single larva. (n = 11 larvae)
(B) Ratio of the delay between the start of Ib activity and Is activity for each of the larvae in (A)
(C) Activity index for individual Ib NMJs before, during, and after synchronous activity at the convergent Is NMJ (n = 14 Ib NMJs from 13 larvae)
(D) Example of in vivo SynapGCaMP6f fluorescence for a Ib-Is pair (Ib, blue; Is, orange).
(E) Summated ΔF/F over entire NMJ (Σ(ΔF/F)Δp) versus time where p indicates each pixel.
(F) Total synaptic transmission (ΣΣ,(ΔF/F)ΔpΔi) for Ib and Is pairs (n = 11 Ib-Is pairs from 11 larvae).
(G) Total synaptic transmission (ΣΣ(ΔF/F)ΔpΔt) ratio for each of the Ib-Is pairs in (F).
(H) Percent of total time in active state (synchronous activity at multiple synapses).
(I) Mean ΔF/F activity for single release sites (same as Figure 1G). Example spontaneous release events locations and traces are highlighted in (J) and (K).
(J–K) Peak ΔF/F image superimposed on baseline fluorescence for spontaneous quantal event examples in (I). Insets are higher resolution mean ΔF/F traces.
(L) In vivo spontaneous event frequency (n = 15 NMJs from 6 larvae).
(M) Total synaptic transmission (ΣΣ(ΔF/F)ΔpΔt) ratio of all spontaneous events versus MN-active periods (n = 15 NMJs from 6 larvae).
Values are Mean ± SEM. Comparisons made with Mann-Whitney test (F, M) Student’s t-test (A, H, L), or one-way ANOVA with Tukey’s post hoc test (C). ** p < 0.01, **** p < 0.0001 or NS not significant.
In addition to the long lasting, axon-wide bouts of activity at Ib and Is synapses, similar to burst stimulation in the dissected preparation (Peled et al., 2014), we also detected small, brief, asynchronous, low frequency fluorescent events in both NMJs during periods of muscle relaxation (Figures 2I–K and S2A–H; Supplemental Movie 3). These are consistent with spontaneous quantal “miniature” events detected at the dissected larva in macropatch recordings (Karunanithi et al., 2002; Nguyen and Stewart, 2016) or imaging (Cho et al., 2015; Melom et al., 2013; Muhammad et al., 2015; Peled and Isacoff, 2011; Peled et al., 2014) as well as imaging in cultured neurons (Reese and Kavalali, 2015, 2016). These spontaneous events had larger amplitudes at Is synapses (Figure S2C–H), but were more frequent at Ib synapses (Figure 2L, S2C, F). Spontaneous release has been proposed to play a role in synapse regulation and development (Choi et al., 2014; Frank et al., 2006; Kavalali, 2015; Saitoe et al., 2001) and may represent a substantial fraction of total synaptic release, especially at low Pr central synapses (Chadderton et al., 2004). However, by comparing the total activity integral (Σ(ΔF/F)ΔpΔt) of spontaneous events with that of synchronous MN-driven events, we find that spontaneous transmission at both inputs represents a very small fraction (<1%) of the total postsynaptic Ca2+ signal (Figure 2M and S2I). These calculations may miss some low amplitude spontaneous events but their small size would mean a minimal impact compared to the large and sustained evoked events. This suggests that spontaneous transmission may have a larger role in development and plasticity at synapses with low evoked transmission.
Taken together, these results demonstrate that SynapGCaMP6f enables quantal resolution, quantitative imaging of synaptic activity in vivo, and that during restrained behavior, AP-evoked synchronous release represents the vast majority of synaptic transmission. In addition, Ib and Is synapses provide distinct forms of synaptic input, with Ib synaptic activity being the dominant, muscle-contracting input during crawling behavior.
Spontaneous quantal transmission at Ib and Is synapses
To understand the physiological differences between transmission at Ib and Is synapses, we performed high-resolution optical quantal analysis in the semi-dissected larval fillet preparation, in which we removed the brain and imposed AP firing patterns by electrical stimulation of the nerve containing the Ib and Is axons. Despite the large difference in SynapGCaMP6f baseline fluorescence (Figures 3A and S3A), confocal imaging of SynapGCaMP6f at muscle 4 provided a robust readout of spontaneous, quantal synaptic transmission in the absence of nerve stimulation at both Ib and Is synapses (Figure 3B–E; Supplemental Movie 4). As in the intact preparation (Figures S2C–H), spontaneous events were larger in amplitude at Is postsynapses (Figures 3F–G and S3B–E), but had nearly identical kinetics (Figures S3E–F), consistent with the kinetics observed in neurons in response to single APs (Chen et al., 2013). Imaging combined with electrophysiology (Supplemental Movie 5) enabled identification of the site of origin of the miniature EPSP (mEPSP) electrical events (Figures 3H and S3B–D). These measurements demonstrated that, just as they produce larger fluorescent events (Ib mean: 0.57±0.01 ΔF/F; Is mean: 0.95±0.02 ΔF/F), mEPSPs are also 56% larger at Is synapses (Ib mean: 0.42±0.008 mV; Is mean: 0.66±0.002 mV) (Figures 3I–J and S3D), in agreement with focal extracellular electrode studies and the finding that Is terminals have larger synaptic vesicles (Karunanithi et al., 2002; Nguyen and Stewart, 2016). Optical quantal amplitudes at both inputs showed identical and linear sensitivities to extracellular Ca2+ (Figure S3G). Additionally, SynapGCaMP6f responses could be attributed to GluRs, as depletion of Ca2+ stores with thapsigargin had no effect on spontaneous event amplitudes (Figures S3H–I) and voltage steps to activate voltage-gated Ca2+ channels failed to produce any change in SynpGCaMP6f fluorescence (Figures S3J–M). Together, these data indicate that SynapGCaMP6f provides a robust, quantitative, report of glutamate release at the NMJ.
Figure 3. Ib and Is synapses differ in optical quantal size and spontaneous release rate.
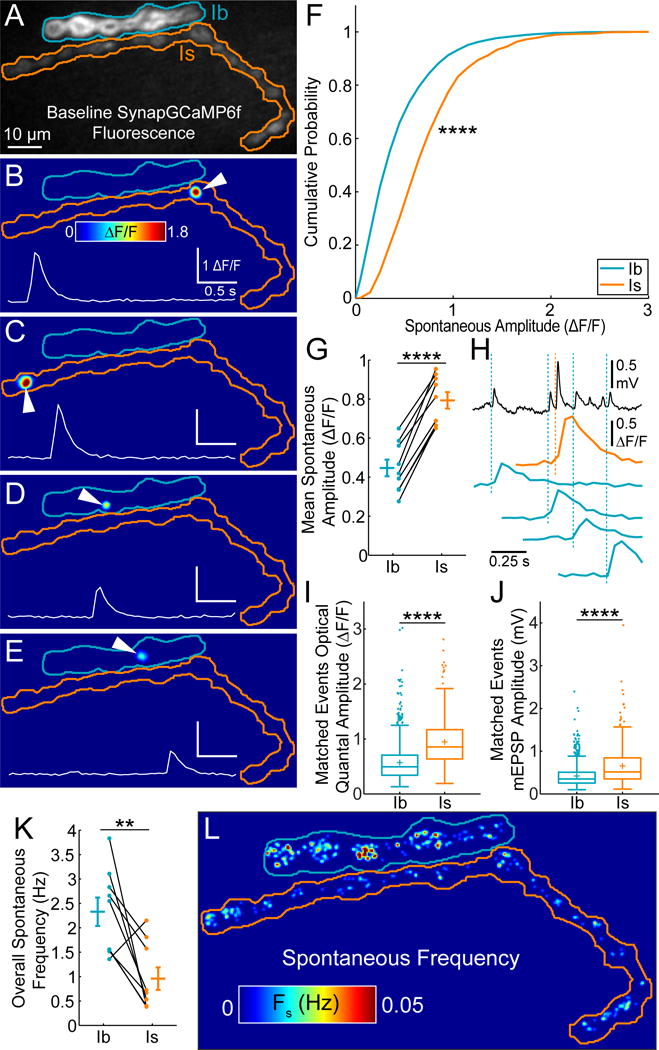
(A) Baseline SynapGCaMP6f fluorescence in fillet preparation at a WT NMJ with Ib (blue) and Is (orange) NMJ borders highlighted.
(B–E) Example spontaneous events at Ib and Is NMJs. Insets: mean ΔF/F for synapses indicated with white arrowheads.
(F) Cumulative probability for pooled spontaneous event maximum amplitudes from multiple NMJs (Ib n = 9 NMJs, 2515 pooled events; Is n = 9 NMJs, 1035 pooled events; no electrophysiology).
(G) Mean spontaneous event peak amplitude. Each point is average for one NMJ (n = 9 NMJ pairs; no electrophysiology).
(H) Electrical mEPSPs (top, black trace) with matched optical quantal events at Ib (blue) and Is (orange) NMJs.
(I) Boxplot for pooled optical quantal amplitudes with matched mEPSPs (different data from (F) and (G)) (+ indicates mean).
(J) Boxplot for pooled mEPSP amplitudes of all the matched events in (I) (+ indicates mean).
(K) Overall total spontaneous release frequencies by NMJ. (n = 9 NMJ pairs)
(L) Locations of spontaneous quantal events during 120s of imaging without motor neuron stimulation. Color scale is local spontaneous frequency (Fs).
Values are Mean ± SEM. Comparisons made with Kolmogorov-Smirnov test (F), Student’s t-test (G, K) or Mann-Whitney test (I, J). ** p < 0.01, **** p < 0.0001 or NS not significant.
In further agreement with our in vivo analysis (Figure 2L), the global frequency of spontaneous transmission was lower at the Is input (Figures 3K and S3N). We have previously demonstrated that at single Ib synapses, the local spontaneous release frequency (FS) is highly variable (Peled et al., 2014). We observed heterogeneous Fs at both Ib and Is synapses (Figure 3L), with similar average values for individual animals (Figure S3O), but slightly different distributions when single synapses were pooled from multiple larvae (Figure S3P). Thus, the difference in global spontaneous release between these two inputs is due to the significantly smaller number of spontaneously active synapses in the Is axon (Figure S3Q). Following optical recording of transmission, we immunostained for Bruchpilot (Brp), a Drosophila ELKS/CAST homolog, which forms the central T-bar structure of the motor axon active zone cytomatrix (Kittel et al., 2006). We found Is axon terminals to have significantly lower Brp puncta densities (Figures S3R–T) (Paul et al., 2015), consistent with their lower global Fs. Additionally, the amount of Brp was similar at Is and Ib synapses (Figures S3U–V), consistent with recent super-resolution microscopy measurements (Ehmann et al., 2014), and the portion of Brp-containing synapses that participated in spontaneous release was similar (Figure S3W).
Thus, spontaneous release occurs at similar rates in individual Is and Ib synapses, evokes larger responses at Is synapses, and, because of the higher synapse density and larger area of Ib terminal axons, is considerably more frequent overall at Ib inputs.
Ib and Is synapses differ in basal evoked transmission
To measure basal evoked release, we performed optical quantal analysis simultaneously at Ib and Is inputs during low frequency (0.1 Hz) stimulation of the nerve containing both Ib and Is axons (Figures S4A–E; Supplemental Movie 6). This enabled us to construct cumulative activity maps of the Pr throughout both NMJs (Figures 4A–B). We matched these maps to presynaptic Brp puncta from post hoc immunostaining (Figures 4C–F) and found that AP-responsive sites were more numerous at Ib synapses (Figure S4F), yet only accounted for approximately half of the Brp puncta in both axons (Figure S4G). This indicates that a large fraction of synapses at both inputs are either silent or have very low Pr.
Figure 4. Basal transmission more reliable at Is synapses.
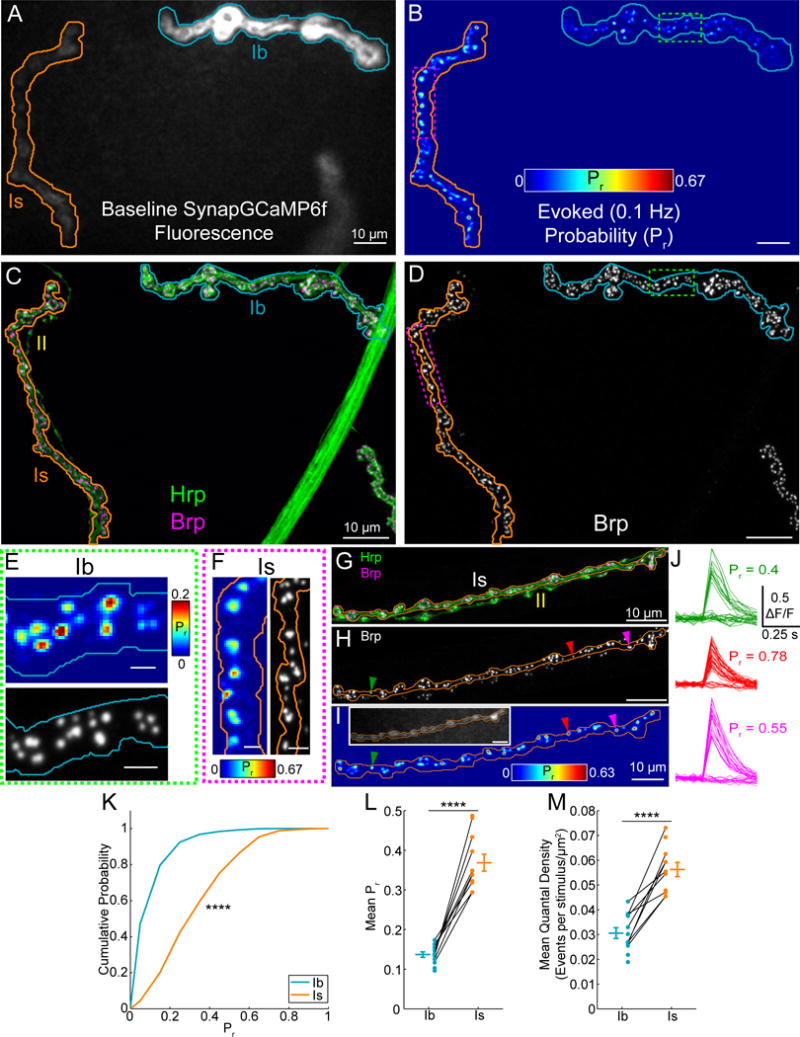
(A) Baseline SynapGCaMP6f fluorescence at a WT NMJ (Ib, blue; Is, orange).
(B) Cumulative AP-evoked quantal release location heatmap (200 trials at 0.1 Hz). Color scale is local Pr.
(C) Maximum intensity projection for neuron (Hrp, green) and Brp (magenta) immunofluorescence (Ib, blue; Is, orange; regions correspond to imaged areas A–B).
(D) Isolated maximum intensity projection for Brp immunofluorescence.
(E–F) High magnification comparison of quantal activity spatial distribution and Brp puncta for a Ib region (E) (green box indicated in B and D) and a Is region (F) (magenta box indicated in B and D). Scale bars 2 μm.
(G–J) AP-evoked quantal behavior of single synapses. (G) Example Is NMJ (Hrp, green; Brp, magenta; axon border, orange; type II axon, yellow). (H) Brp image corresponding to (G). (I) Cumulative AP-evoked quantal release location heatmap (200 trials at 0.1 Hz) from (G) and (H). Inset shows baseline SynapGCaMP6f fluorescence. Color scale is local Pr. (J) ΔF/F traces for synapses indicated with arrows in (H) and (J) during 40 stimulation trials. Pr = # responses/# trials at individual sites.
(K) Pooled cumulative probability distribution for 0.1 Hz evoked Pr at all active synapses (Ib n = 995 and Is n = 413 sites).
(L) Mean 0.1 Hz evoked Pr by NMJ (Ib n = 12 and Is n = 11 NMJs with 9 NMJ pairs).
(M) Mean quantal density for NMJs in (L) (quantal content normalized to imaged NMJ area). Values are Mean ± SEM. Comparisons made with Kolmogorov-Smirnov test (K) and Student’s t-test (L and M). **** p < 0.0001 or NS not significant.
Transmission at single synapses was all-or-none, alternating between failures and responses that were similar in amplitude to spontaneous quantal events (Figures 4G–J). Therefore, this method provides a direct readout of single release site Pr from the fraction of APs that evoke release at a given active site (Figure 4J). Active synapses of both Ib and Is axons were broadly distributed in basal Pr (Figures 4B and 4K), although Is variability was lower at individual NMJs (Figure S4H) and average Pr was significantly higher (Figures 4K–L). Average Pr values at both inputs are consistent with recent electrophysiological estimates (Lu et al., 2016). Despite the lower synaptic density at Is NMJs (Figure S4F), the high Pr resulted in a higher quantal density (imaged area-normalized quantal content) (Figure 4M), a metric that we chose because of its ability to accurately distinguish differences in release at low Pr synapses (see Methods). As with spontaneous transmission, AP-evoked events were larger at Is synapses (Figures S4I–O, see also Methods). Finally, cross-correlation comparisons between maps of evoked and spontaneous release sites (Figures S4P–V) revealed a low spatial correlation at both Ib and Is synapses (Ib: 0.31±0.03 n = 7 NMJs; Is: 0.33±0.3 n = 9 NMJs; p = 0.79 Student’s t-test), indicating that synapses are specialized for either spontaneous or evoked release in both axons, as found earlier at Ib synapses (Peled et al., 2014).
Thus, while active synapses of both Ib and Is inputs are broadly heterogeneous and specialized for either spontaneous or evoked release, and both contain a large fraction of silent synapses, Is active synapses have an ~2–3-fold higher Pr. This difference in release exists despite the fact that Brp, whose level is correlated to Pr within the Ib input (Peled et al., 2014), is present in similar amounts at Is and Ib synapses. This suggests that an additional mechanism of regulation differentiates between basal glutamate release reliability at Is and Ib inputs.
Homeostatic plasticity is input-specific
Homeostatic plasticity at the fly NMJ stabilizes synaptic strength over a wide range of timescales (Davis and Müller, 2015). Removal of the GluRIIA subunit with a GluRIIA null mutation (GluRIIASP16) reduces mEPSP amplitudes (quantal size), but EPSP amplitudes remain constant, indicating a retrograde homeostatic signal that increases presynaptic release to compensate for the decreased sensitivity to glutamate (Petersen et al., 1997). Given the striking differences during in vivo and basal transmission between Ib and Is inputs, we next asked whether homeostatic compensation occurs similarly at the two inputs.
GluRIIA larvae expressing SynapGCaMP6f had no detectable GluRIIA expression at either Ib or Is postsynapses (Figures S5A–B), but baseline SynapGCaMP6f fluorescence was unchanged (Figure S5C), consistent with normal postsynaptic development. Electrophysiological analysis of mEPSPs and compound EPSCs indicated that presynaptic homeostatic compensation is intact in the presence of SynapGCaMP6f (Figures S5D–H). As expected, the GluRIIA mutation reduced the amplitude of spontaneous optical events at both Ib and Is NMJs (Figures 5A–D). We performed optical quantal analysis of basal transmission under low frequency (0.1 Hz) MN stimulation (Figures S5I–L). Analysis of both inputs showed that there was no difference between GluRIIA and WT in terms of the normalized variability of Pr (Figure S5M), the density of active synapses (Figure S5N) or the density of Brp puncta (Figure S5O). However, GluRIIA had a significantly higher quantal density per stimulus and single-synapse Pr in the Ib input (Figures 5E–H). In striking contrast, there was no difference in quantal density or Pr in the Is input (Figures 5E–H). We found no relationship between the Pr of Is synapses and that synapse’s distance to the nearest Ib synapse (Figures S5Q–R), suggesting that the retrograde homeostatic signal was highly specific for the Ib input and did not affect Is synapses, even when they were located nearby on the surface of the muscle. Furthermore, even when we reduced the Pr of Is synapses to WT Ib levels by reducing extracellular Ca2+, we observed no compensation in presynaptic strength at Is synapses (Figures S5S–V). Thus, the homeostatic increase in evoked release is mediated by an increase in transmission reliability, which takes place selectively at Ib synapses.
Figure 5. Homeostatic plasticity is input-specific.
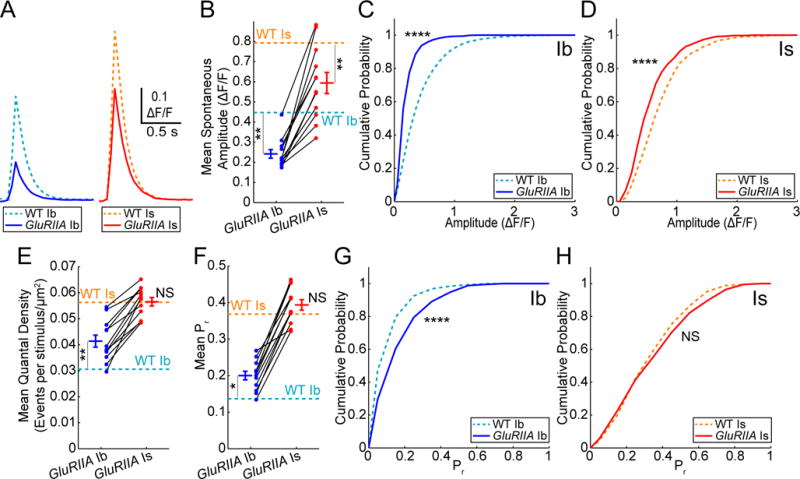
(A) Mean ΔF/F waveforms for pooled and aligned spontaneous events in WT and GluRIIA animals (WT Ib n = 9 NMJs, 2515 events; WT Is n = 9 NMJs, 1035 events; GluRIIA Ib n = 12 NMJs, 1470 events, GluRIIA Is n = 12 NMJs, 590 events).
(B) Mean spontaneous event amplitudes at each NMJ (**** GluRIIA Ib versus GluRIIA Is).
(C–D) Cumulative probability for pooled spontaneous event maximum amplitudes at WT and GluRIIA Ib NMJs (C) and Is NMJs (D).
(E) GluRIIA quantal density by NMJ (GluRIIA n = 12 NMJ pairs; *** GluRIIA Ib versus GluRIIA Is).
(F) GluRIIA mean 0.1 Hz evoked Pr by NMJ (**** GluRIIA Ib versus GluRIIA Is).
(G–H) Cumulative probability for pooled 0.1 Hz evoked single synapse Pr at WT and GluRIIA Ib NMJs (G) and Is NMJs (H). (GluRIIA Ib n = 1146 sites; GluRIIA Is n = 585 sites). Data in (B–H) are from Figure 3 and Figure 4 and presented here for comparison. Values are Mean ± SEM. Comparisons made with Kolmogorov-Smirnov test (C, D, G, and H), one-way ANOVA with Tukey’s post hoc test (B, E, and F). * p < 0.05, ** p < 0.01, *** p < 0.001, **** p < 0.0001 or NS not significant.
Relationship between homeostasis and input-specific short-term plasticity
Having seen that homeostatic compensation in basal transmission strength occurs exclusively at Ib synapses, we asked how compensation affects short-term plasticity during the kind of AP bursts in MNs that occur during fictive locomotion (Knodel et al., 2014; Lu et al., 2016). Two-electrode voltage clamp recording, during simultaneous stimulation of WT, SynapGCaMP6f-expressing Ib and Is MNs at 1–20 Hz with 1.5 mM Ca2+ saline (HL3, with 25 mM Mg2+) to simulate native haemolymph (Stewart et al., 1994), showed a depression in compound EPSC amplitude (Figure 6A), which was identical to the extent of depression observed in the absence of SynapGCaMP6f expression (Figure S6A). While quantal density per stimulus was stable at 0.1 Hz (Figure S6B), global ΔF/F optical analysis during stimulation at 1–10 Hz showed depression at Is NMJs and stimulation at ≥ 5 Hz showed facilitation at Ib NMJs (Figures 6B and S6C–E and Supplemental Movie 7). Analysis of the ΔF/F signals at individual synapses during a 5 Hz stimulation showed that it is possible to identify quantal events despite the stimulus interval being shorter than the complete decay of the SynapGCaMP6f signal because of the low single-synapse Pr (Figure S6F). To quantify the overall changes in synaptic activity during stimulus trains, we calculated the change in quantal density per stimulus during the bursts (Figures S6G–I and K). At 5 Hz the Ib input facilitated by nearly 100%, while the Is input depressed by ~20% (Figures 6C–E).
Figure 6. Short-term synaptic plasticity and influence of homeostatic signaling on plasticity are input-specific.
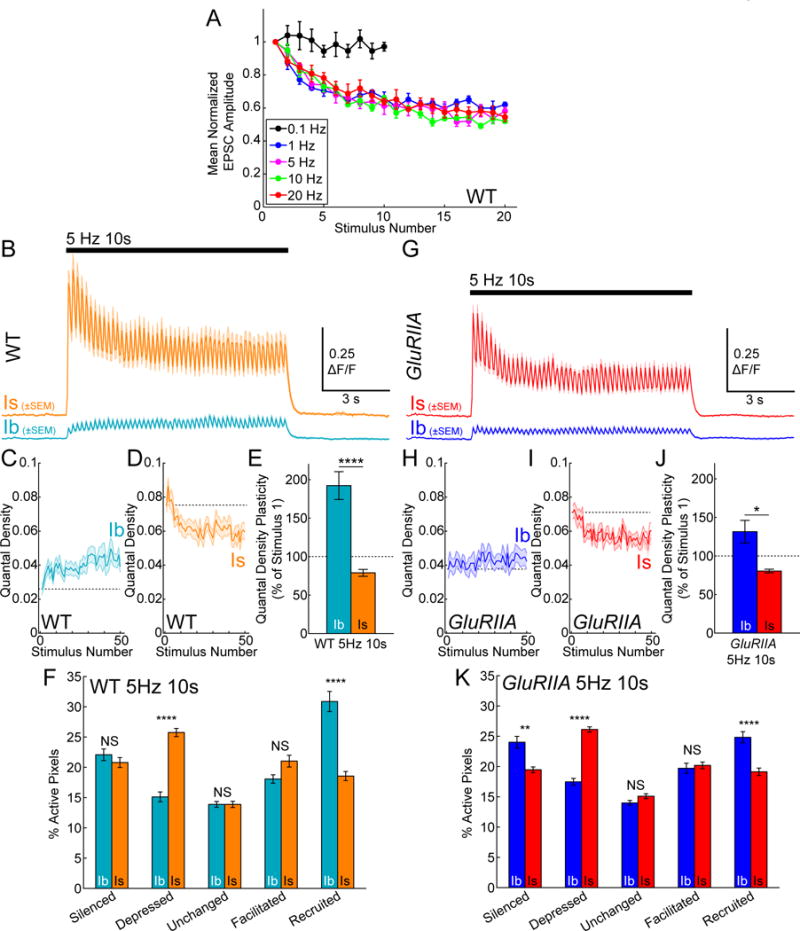
(A) Mean normalized (to stimulus 1) EPSC amplitudes for WT larvae at several frequencies and aligned by stimulus number (0.1 Hz n = 5, 1 Hz n = 5, 5 Hz n = 4, 10 Hz n = 5, 20 Hz n = 5 muscles).
(B) WT mean ΔF/F for entire NMJ areas during a 10 s, 5 Hz train (Ib, blue; Is, orange; n = 13 NMJ pairs).
(C–D) WT mean quantal density (area normalized quantal content in events per stimulus per μm2) at Ib (C) and Is (D) NMJs during a 10 s, 5Hz stimulus from (B). Dotted line aligned to value at first stimulus.
(E) Mean quantal density plasticity (mean of final five responses divided by first response during 10 s 5 Hz train) for WT NMJs in (B).
(F) Single pixel plasticity WT NMJs in (B). Values are percent of active pixels. Pixels classified by difference in activity between first 25 and last 25 stimuli.
(G) GluRIIA mean ΔF/F trace for entire NMJ area during a 10 s, 5 Hz train (GluRIIA Ib, dark blue; GluRIIA Is, red; n = 11 NMJ pairs).
(H–I) GluRIIA mean quantal density at Ib (H) and Is (I) NMJs during a 10 s, 5Hz train from (G). Dotted line is aligned to the value at the first stimulus.
(J) Mean quantal density plasticity for GluRIIA NMJs during 10 s at 5 Hz in (G) (** WT Ib versus GluRIIA Ib; NS WT Is versus GluRIIA Is).
(K) Single pixel plasticity for GluRIIA NMJs in (G). (WT Ib versus GluRIIA Ib Recruited **, otherwise all same class, cross-genotype comparisons NS) Mean ± SEM indicated. Comparisons made with one-way ANOVA with Tukey’s post hoc test (E and J) and also one-way ANOVA with Tukey’s post hoc test within each classification group but between NMJ class and genotype (F and K). ** p < 0.01, **** p < 0.0001 or NS not significant.
Given the heterogeneity in Pr between synapses at both Ib and Is NMJs (Figures 4K and S4H), we wondered whether the basal properties of a synapse (e.g. whether it has high or low Pr or is silent) determine its tendency to depress or facilitate. To address this, we categorized quantal responses for each pixel within Is and Ib NMJs during trains of stimulation at 5 Hz. By comparing the second half of a train to the first half, we identified pixels as either unchanged, facilitated, depressed, silenced or recruited (Figures 6F and S6K–M). Reflecting the overlapping basal Pr distributions (Figure 4K), Ib and Is inputs had similar percentages of pixels that were silenced, facilitated, or unchanged during the train, but pixels that were recruited from a silent state were ~70% more abundant at Ib inputs, whereas pixels that were depressed (but not silenced) were ~70% more abundant at Is inputs (Figure 6F). The sites that fell into the different categories were highly intermingled spatially (Figure S6L). These results suggest that depression at Is inputs is primarily an outcome of a tendency of synapses to decline in Pr but remain active, while facilitation at Ib inputs is primarily an outcome of the recruitment of silent synapses.
Having identified different classes of synapses based on basal transmission and short-term plasticity in WT larvae, we next asked how these synapse subtypes contribute to Ib-specific homeostatic compensation in GluRIIA larvae. First, we observed that quantal density depression at the Is input was normal in GluRIIA (WT Is depresses to 78.9±5% and GluRIIA Is depresses to 80.5±2%; p = 0.996) (compare Figures 6G, 6I and 6J to Figures 6B, 6D and 6E). However, Ib inputs in GluRIIA showed significantly less global facilitation in quantal density during stimulation at 5 Hz compared to WT (WT Ib facilitated to 192.3±18% and GluRIIA Ib facilitated to 131.6±15%; p = 0.006). This reduction in global facilitation was due to a reduction in the number of silent sites that were recruited during the 5 Hz train (WT Ib 30.9±1.7% versus GluRIIA Ib 24.8±0.92%; p = 0.004). These data, coupled with higher single-synapse basal Pr (Figures 5F–G), similar basally active synapse densities (Figure S5N) and similar active zone densities (Figure S5O), suggest that homeostatic signaling at Ib inputs compensates for decreased postsynaptic sensitivity by both increasing the reliability of active synapses and reducing recruitment of silent sites during high frequency activity.
Input-specific homeostasis at Ib synapses is independent of Is release
We have shown above that, during locomotor behavior, the Is input provides a relatively small percentage of the total synaptic drive (Figures 2F–G). However, its larger quantal size (Figures 3F–G) and higher Pr (Figures 4K–L) means that the Is input can still provide a significant depolarization and influx of Ca2+ into the muscle over a range of AP frequencies (see Figures 6B and S6C–E). We therefore asked whether loss of Is transmission would trigger homeostatic compensation at the Ib input that innervates the same muscle. Because we could not selectively block GluRs at Is postsynapses, we turned to presynaptic disruption of transmission by expressing the tetanus toxin light chain (TeTxLC), which blocks AP-evoked transmitter release through proteolysis of synaptobrevin 2 (Sweeney et al., 1995). We targeted UAS-TeTxLC expression specifically to Is inputs using either RN2-Gal4 (Fujioka et al., 2003) that drives expression in a single Is MN (MNISN-Is), a single Ib MN (MN1-Ib) (Figures 7A–B) and a single interneuron in each hemisegment or ShakB-Gal4 to drive expression primarily in Is MNs (data not shown) (Takizawa et al., 2007).
Figure 7. Homeostatic plasticity is input-autonomous.
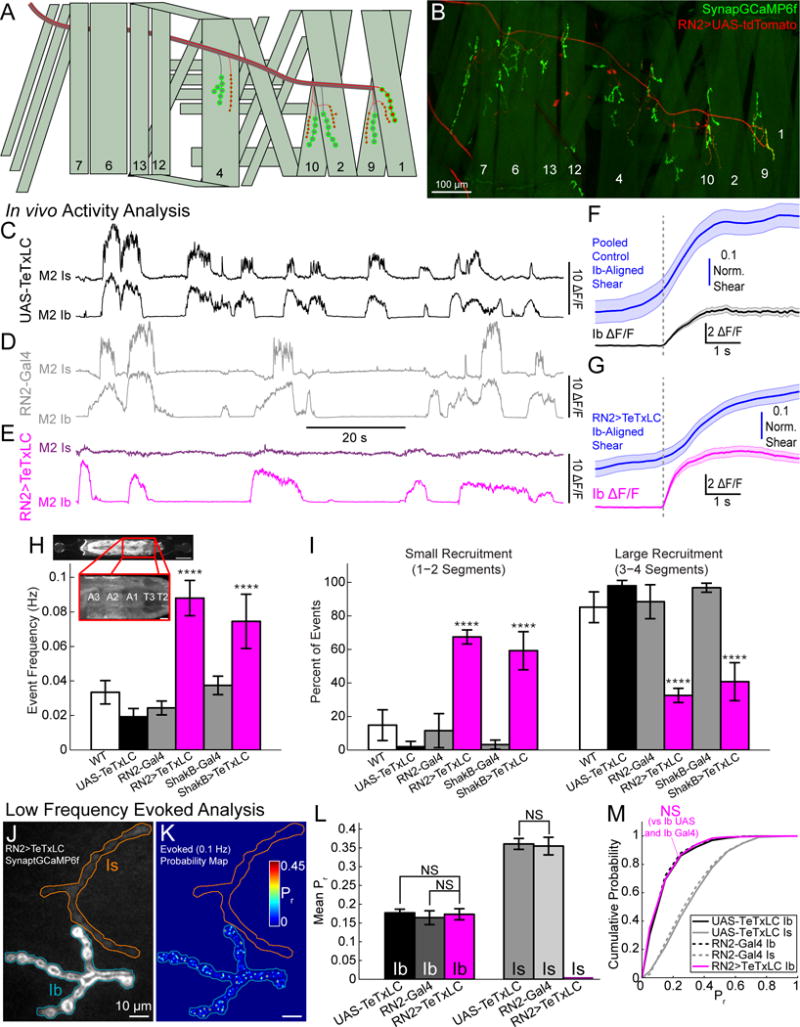
(A) Schematic showing expression pattern of RN2-Gal4 (red).
(B) Multiple stitched maximum intensity projections of SynapGCaMP6f and RN2>UAS-tdTomato.
(C–E) Representative in vivo activity at M2 Ib and Is NMJs in a UAS-TeTxLC larva (C) (black; also Figure S7A), a RN2-Gal4 larva (D) (gray; also Figure S7B), and a RN2>TeTxLC larva (E) (magenta; also Figure S7C).
(F–G) Ib NMJ mean ΔF/F (± SEM) and mean time-locked NMJ shearing associated with the onset of Ib synaptic activity in control (F) (UAS-TeTxLC and RN2-Gal4 were pooled) or RN2>TeTxLC (G) NMJs. The activity start time used for alignment is indicated by the vertical gray dashed line. M1-Ib NMJ data were excluded from this analysis in the RN2>TeTxLC animals due to their expression of TeTxLC. (pooled control, n = 46 activity bouts from 38 NMJs, 9 larvae; RN2>TeTxLC, n = 125 bouts from 84 NMJs, 14 larvae).
(H) Frequency of segment-wide SynapGCaMP6f activity within segments T2-A3 in WT (n = 10 larvae), UAS-TeTxLC (n = 10 larvae), RN2-Gal4 (n = 10 larvae), and RN2>TeTxLC (n = 10 larvae), ShakB-Gal4 (n = 10 larvae) and ShakB>TeTxLC (n = 10 larvae). Inset illustrates the imaged area. Significance (****) was found between either RN2>TeTxLC or ShakB>TeTxLC and all controls but not between TeTxLC expressing groups.
(I) Percent of continuous activity in (H) that spanned either 1–2 segments (left) or 3–4 segments (right). Similarly, in both sets, significance (****) was found between either RN2>TeTxLC or ShakB>TeTxLC and all controls but not between TeTxLC expressing groups.
(J) Baseline fluorescence of RN2>TeTxLC larva (Ib, blue; Is, orange).
(K) RN2>TeTxLC cumulative AP-evoked quantal release location heatmap (200 trials at 0.1 Hz) Color scale corresponds the local Pr.
(L) Mean 0.1 Hz evoked Pr by NMJ for UAS-TeTxLC (Ib n = 6; Is n = 6 NMJs), RN2-Gal4 (Ib n = 6; Is n = 6 NMJs), and RN2>TeTxLC (Ib n = 6; Is n = 6 NMJs; no AP-responsive Is sites).
(M) Cumulative probability for 0.1 Hz evoked Pr at pooled synapses for UAS-TeTxLC (Ib n = 667; Is n = 242 sites), RN2-Gal4 (Ib n = 642; Is n = 377 sites), and RN2-Gal4> TeTxLC (Ib n = 653 sites).
Mean ± SEM indicated. Comparisons were made using one-way ANOVA with Tukey’s post hoc test (H, I, and L) or Kruskal-Wallis with Tukey’s post hoc tests for pooled data (M). **** p < 0.0001 or NS not significant.
As expected, in vivo SynapGCaMP6f imaging of dorsal muscles 1, 2, 9, and 10 showed that larvae expressing UAS-TeTxLC under RN2-Gal4 had a complete lack of Is activity, while Ib activity remained intact (Figures 7C–E and S7A–D; Supplemental Movie 8). In the semi-dissected preparation, low frequency MN stimulation failed to evoke transmission from MNISN-Is and MN1-Ib, but not MNSNb/d-Is (a ventral projecting Is MN that does not express the Gal4) or any other Ib synapse (Figures S7E–G). SynapGCaMP6f fluorescence and optical quantal sizes were unaffected by Is-TeTxLC expression at either input (Figures S7H–I), with only a subtle decrease in spontaneous transmission rate being observed in the TeTxLC-expressing Is NMJ (Figure S7J). Thus, expression of TeTxLC specifically eliminates evoked transmitter release from Is inputs. Interestingly, although loss of Is evoked activity left muscle contraction intact (Figures 7F–G), intersegmental wave activity was elevated using both selective MN Gal4 lines (Figure 7H) and an increased number of waves failed to propagate through multiple segments (Figure 7I), suggesting a role for Is transmission in large-scale muscle coordination during locomotion.
Having found a driver for TeTxLC that selectively eliminates evoked transmission at Is inputs, we could now turn to muscles whose Is evoked activity was eliminated and examine the basal transmission properties of its paired Ib input. Strikingly, we found no change in Ib basal single-synapse Pr or quantal density in the Is-specific TeTxLC larvae (Figures 7J–M and S7K). In addition, high frequency stimulation also revealed normal Ib plasticity in the absence of Is transmission (Figures S7L–O). Thus, there is no change of transmission at Ib synapses when the excitatory drive to a muscle is reduced by elimination of transmission from the nearby convergent Is input. In other words, homeostatic upregulation at Ib synapses is specifically responsive only to loss of postsynaptic glutamate sensitivity at its own Ib postsynapse.
Reduction in postsynaptic CaMKII activity selectively enhances Ib presynaptic release
Reduction in postsynaptic CaMKII activity has been shown to boost transmitter release, suggesting that homeostatic signaling is triggered by reduced activation of CaMKII following a reduction in Ca2+ influx when GluRIIA-containing GluRs are removed (Haghighi et al., 2003). This led us to ask whether homeostatic compensation occurs exclusively at Ib presynapses because Ib postsynapses reach much higher internal Ca2+ levels during locomotion (Figures 2E–F). As a first test of this idea, we asked whether Ib and Is postsynapses differ in levels of activated CaMKII by staining WT SynapGCaMP6f NMJs with an antibody against the active (phosphorylated) form of CaMKII (pCaMKII) (Figures S8A–E). Consistent with earlier work, which showed that is CaMKII enriched at postsynapses (Koh et al., 1999), we observed strong staining surrounding both Ib and Is axons, which overlapped with GluRIIA puncta more closely than it did with presynaptic Brp puncta (Figures 8A–C and S8B–E). These observations indicate strong postsynaptic localization of active CaMKII at both inputs, near the site of transmission-evoked Ca2+ influx. Interestingly, the total integrated pCaMKII values were 2.5 to 6-fold higher at Ib inputs compared to Is inputs that innervated the same muscle (Figures 8G–H). This difference in pCaMKII is similar to the difference we observed in integrated Ca2+ influx in vivo (Figure 2G). Consistent with the proposed relationship between GluRIIA and postsynaptic CaMKII, total pCaMKII levels were lower in GluRIIA, but only at Ib postsynapses (Figures 8D–H).
Figure 8. Inhibition of postsynaptic CaMKII only increases Ib release.
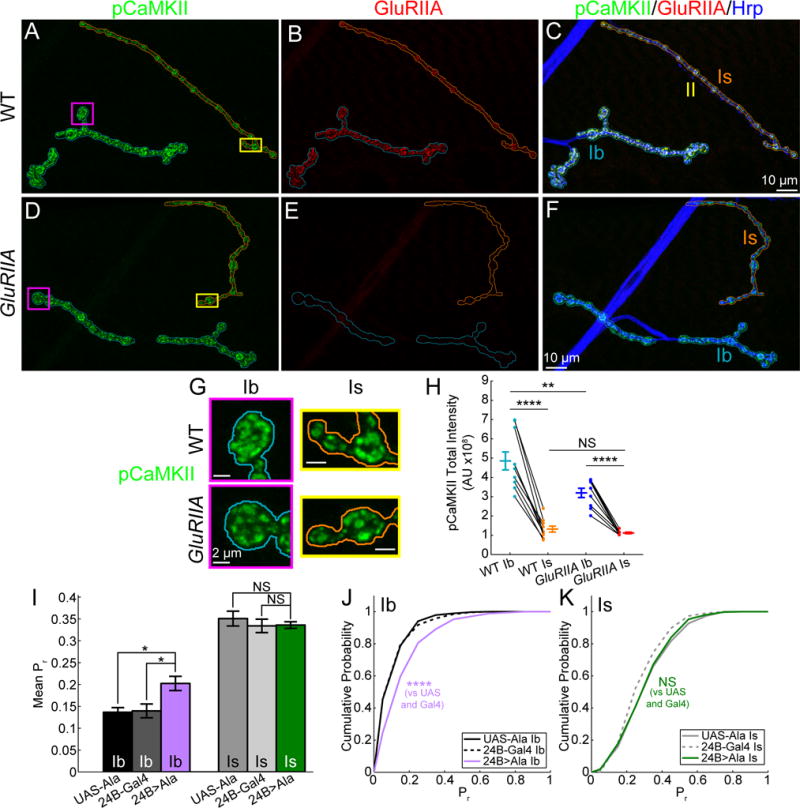
(A–F) Maximum intensity projections of pCaMKII (A, D), GluRIIA (B, E), and Hrp (merged images of all three channels in C and F) antibody labeling for WT (A–C) and GluRIIA (D–F) larvae (Ib, blue; Is, orange).
(G) Representative bouton maximum intensity projections of pCaMKII labeling for Ib (magenta) and Is (yellow) NMJs in WT (top) and GluRIIA (bottom) from (A–F).
(H) Total integrated pCaMKII intensity for WT and GluRIIA Ib and Is maximum intensity projections.
(I) Mean 0.1 Hz evoked Pr by NMJ for UAS-Ala (Ib, n = 8; Is n = 8 NMJs), 24B-Gal4 (Ib, n = 8; Is n = 8 NMJs), and 24B>Ala (Ib, n = 9; Is n = 9 NMJs)
(J–K) Cumulative probability for pooled 0.1 Hz evoked single synapse Pr for UAS-Ala (Ib, n = 869; Is, n = 414 sites), 24B-Gal4 (Ib, n = 792; Is, n = 339 sites), and 24B>Ala (Ib, n = 717; Is, n = 427 sites) for Ib (J) and Is (K) NMJs.
Mean ± SEM indicated. Comparisons made with one-way ANOVA with Tukey’s post hoc test (H and I) or Kruskal-Wallis with Tukey’s post hoc tests for pooled data (J and K). * p < 0.05, ** p < 0.01, **** p < 0.0001 or NS not significant.
The above observations suggest that homeostatic compensation only occurs at the Ib input because GluRIIA only reduces CaMKII activity at Ib postsynapses. This selectivity may reflect a nonlinear relationship between the spatio-temporal rise in internal Ca2+ and CaMKII activation (Stratton et al., 2013). The experiments left unresolved whether Is postsynapses would be capable of generating the homeostatic signal if CaMKII activity was reduced. To address this, we turned to a method for inhibiting CaMKII activity throughout the postsynaptic muscle using the CaMKII inhibitory peptide, UAS-Ala (Griffith et al., 1993), under the control of the muscle-specific 24B-Gal4 (Luo et al., 1994). The CaMKII inhibitory peptide had no effect on baseline SynapGCaMP6f fluorescence (Figure S8F) or evoked fluorescent event amplitudes (Figure S8G). Additionally, similar to GluRIIA, there was no change the density of active synapses (Figure S8H) or the variability in Pr (Figure S8I) at either input. Thus, most aspects of synaptic function were normal, putting us in position to ask how CaMKII inhibition affects transmitter release. We found that postsynaptic expression of the CaMKII inhibitory peptide increased both the single-synapse Pr (Figures 8I–J) and quantal density per stimulus at Ib synapses (Figure S8J), similar to the effect of the GluRIIA mutation. In striking contrast, the CaMKII inhibitory peptide had no effect on either Pr or quantal density at Is synapses (Figures 8I, 8K and S8J).
Together, these observations indicate that the Ib postsynapse signals more strongly to the homeostatic machinery in response to reduced CaMKII activity and, moreover, reacts with a larger decline in CaMKII activity in response to loss of excitatory drive. The upshot is that homeostatic compensation occurs exclusively at the Ib input that dominates locomotor drive (see Figures 1 and 2).
Discussion
The relationship between in vivo synaptic activity and the homeostatic mechanisms that stabilize synaptic function has remained unclear. In this report, we present a new optical reporter of excitatory synaptic transmission, combined with novel imaging of a live, intact and behaving organism that enables us to relate synaptic activity at multiple targets simultaneously throughout an animal in vivo, to synaptic activity at synapses formed on a common postsynaptic cell by two convergent input types, Ib and Is. These techniques are sensitive enough to detect single quantal events, while tracking neurotransmitter release from hundreds of synapses simultaneously. Moreover, we are able to obtain a direct measure of the Pr at individual synapses of both inputs from optical failure analysis. Using these methods, we have investigated short-term plasticity and the homeostatic regulation of synaptic reliability. We find that both activity-dependent forms of synapse regulation as well as basal synaptic transmission are controlled differentially in the two input types (see Figure S8K), reflecting the discrete physiological roles of these inputs in the behaving animal.
Input-specific synaptic physiology and behavior
The Ib and Is inputs to the Drosophila larval muscle respectively resemble tonic (low Pr, facilitating) and phasic (high Pr, depressing) inputs seen at neuro-muscular and neuro-neuronal connections in other organisms (Atwood and Karunanithi, 2002). Given these differences, the Is input has been proposed to initiate strong, phasic muscle contractions (Schaefer et al., 2010). However, we find that the primary excitatory drive and main cause of muscle contraction in larval Drosophila is actually the Ib input. This is despite the fact that Is synapses have a higher basal Pr and larger quantal sizes. These functional differences likely reflect the relatively short duration of the Is bursts of activity and the relatively small number of active zones of the Is terminal. Whereas, elimination of transmission from Is inputs had little or no effect on muscle contraction during restrained locomotion, just as it had earlier been shown to have negligible effect on general behavior (Suster et al., 2003), we find that the Is input is needed for normal intersegmental coordination of contraction waves. This is consistent with the broad, multi-muscle Is innervation pattern (Hoang and Chiba, 2001).
Ib synaptic activity begins before and ends after Is activity, consistent with their common presynaptic inputs and different intrinsic excitabilities (Choi et al., 2004; Schaefer et al., 2010). Recent work has shown that excitatory and inhibitory interneurons regulate the differential recruitment of MNs between hemisegments and within hemisegments respectively (Heckscher et al., 2015; Zwart et al., 2016). While Ib inputs ramp up their synaptic drive during locomotor bursts, Is inputs abruptly reach a maximum, which they often sustain for the duration of the shorter burst. Given their substantial depression during high frequency stimulation, the ability of the Is input to sustain a fixed output level during locomotion suggests that it increases the firing frequency during the bursts. The common interneuron drive within the VNC suggests that the progressive increase in synaptic drive during the Ib burst may also be partly due to an increase in frequency during the burst, in addition to the recruitment of silent synapses and increase in Pr of active synapses, which we observe during facilitating high frequency trains. Thus, a combination of circuit-level and cell-autonomous differences combine to generate the complex behavioral output of the larva from a limited number MNs and muscles.
Diversity in basal transmission and short-term plasticity
Spontaneous glutamate release has been shown to play a role in synapse development (Choi et al., 2014). However, we find that spontaneous release in vivo represents only ~1% of total release, suggesting that evoked release would drown out the influence of spontaneous release. One possible explanation is that in late third instar larvae, spontaneous release may represent a larger fraction of total synaptic transmission than earlier in development when the developmental influences are exerted. An intriguing alternative explanation derives from our finding that, at both inputs, synapses preferentially participate in either evoked or spontaneous release. This suggests that developmental signals could occur at a subset synapses that are dominated by spontaneous release.
We find that synapses of both inputs differ in key properties, with Is synapses having larger quantal sizes, less total spontaneous release, higher Pr and short-term depression (as opposed to facilitation in Ib synapses) during high frequency trains. The difference in short-term plasticity between the inputs is consistent with electrophysiological analysis of responses to separate stimulation of Is or Ib axons (Lnenicka and Keshishian, 2000; Lu et al., 2016), as well as modeling (Knodel et al., 2014). These resemble input-specific differences seen in the mammalian brain, such as between parallel and climbing fibers converging on Purkinje cells (Dittman et al., 2000; Mapelli et al., 2015) or interneurons in the cortex (Gupta et al., 2000). The tendency to facilitate or depress is shaped by basal Pr, where high Pr results in greater depletion of immediately releasable vesicles leading to depression (Zucker and Regehr, 2002). While overall this agrees with our observation that Is synapses have higher Pr and depress, we find that despite overlapping distributions of single-synapse Pr, overall release tended to depress in Is and facilitate in Ib, suggesting additional differences in regulation. This greater complexity comes into stark relief when we examine the behavior of hundreds of individual synapses during high frequency trains of presynaptic firing. We find that the heterogeneity of short-term plasticity within an input is much greater than was previously appreciated. We categorize local plasticity dynamics by how transmission changed during a stimulus train and find that the inputs differ only in two categories, Is inputs having a larger number of active sites that depress and Ib having a larger number of silent sites that are recruited to a releasing state. These observations reveal a previously unknown level of specialization in basal release and plasticity between neighboring synapses of a common input.
Input-specific and input-autonomous homeostatic plasticity
The Drosophila larval NMJ has proven to be a powerful system for studying synaptic homeostasis. The mechanism of this homeostasis is that reduction in quantal size (due to reduced GluR conductance that results from either mutation of a GluR subunit or partial pharmacological block) triggers a retrograde signal that leads to increased transmitter release, restoring the normal the normal level of excitatory drive (Davis and Müller, 2015). Our results reveal a new aspect to homeostatic plasticity by showing that it is specific to input and acts primarily at synapses with certain properties of basal transmission, short-term plasticity and physiological function. We find that only glutamate release from the Ib input is boosted during homeostatic compensation. We attribute this to the fact that, despite the smaller quantal size and unitary Ca2+ influx at Ib synapses, Ib inputs have longer bouts of activity, resulting in much larger aggregate Ca2+ elevation in the Ib postsynapse during locomotion. The larger Ca2+ influx drives a higher activation of CaMKII in the Ib postsynapse. Critically, mutation of the GluR subunit to reduce quantal size at both Ib and Is synapses exclusively reduces activated CaMKII at the Ib postsynapse. Why there is no reduction in activated CaMKII at the Is postsynapse is not clear, though nonlinearity in the relationship between the Ca2+ concentration profile and CaMKII activation (Stratton et al., 2013) and differences in GluR subunit composition that influence Ca2+ influx (Marrus et al., 2004) may contribute.
A second mechanistic difference assures exclusivity for homeostatic signaling to the Ib input: even when CaMKII activity is inhibited throughout the muscle, only Ib presynapses are boosted in Pr. This could mean that Is presynapses are not responsive to the homeostatic signal. Alternatively, it could mean that Is postsynapses are incapable of generating the homeostatic signal, an idea that would be consistent with our finding that elimination of release from Is axons does not induce homeostatic compensation at Ib synapses. However, this would also require that the retrograde homeostatic signal act very locally so that it could not travel even a few microns from signaling-capable Ib postsynapses to Is boutons that are often located very close by. Another possibility is that basal Pr is high at Is synapses partly due to lower levels of activity in vivo resulting in greater homeostatic enhancement in presynaptic release, which in turn could occlude further increases in synaptic reliability following changes in GluR composition or global postsynaptic CaMKII inhibition.
Evidence for signaling compartmentalization can be seen in the structural differences between Ib and Is NMJs, particularly on the postsynaptic side. Ib axons are surrounded by a significantly thicker and more elaborate SSR (Atwood et al., 1993; Jia et al., 1993). There are also substantial differences in the localization of key organizing postsynaptic proteins such as Dlg which is present at higher levels in Ib postsynapses (Lahey et al., 1994). CaMKII activity has also been shown to affect SSR structure and Dlg localization (Koh et al., 1999). Thus, the different activity patterns during native behaviors may also directly regulate postsynaptic properties other than presynaptic release to maintain functional diversity.
The presynaptic changes that mediate homeostatic compensation in Pr are only partly known. Homeostasis has been shown to be accompanied by an increase in presynaptic AP-evoked Ca2+ elevation in Ib boutons (Müller and Davis, 2012). While a number of molecules have been demonstrated to play a role in mediating presynaptic homeostatic compensation (Davis and Müller, 2015), it remains to be determined how these mechanisms interact with input-specific differences in strength and plasticity.
While homeostasis has been generally thought to be a global mechanism to regulate synaptic strength, evidence has emerged that homeostasis can be regulated with variable degrees of specificity (Davis and Müller, 2015; Turrigiano, 2012). We have now demonstrated that homeostatic changes can also propagate retrogradely to the presynaptic neuron in an input-specific and synapse-autonomous manner. Given the divergent innervation of multiple muscles by Is inputs and unique innervation by Ib inputs, a Ib-specific homeostatic mechanism can provide greater functional flexibility.
Conclusion
By combining in vivo, physiological measurements of glutamate release with high-resolution quantal analysis at single synapses in the semi-dissected preparation, we have clarified the relative properties of convergent glutamatergic inputs in the larva during native behaviors. Importantly, we have demonstrated that the regulation of basal synaptic strength, short-term plasticity, and homeostasis are shaped in a precise input-specific manner. The Ib input has higher levels of in vivo activity, lower Pr synapses, and a propensity for facilitation by recruiting silent synapses during spike trains. Furthermore, the Ib input is the primary determinant for contraction dynamics in the behaving animal. Consistent with its dominant role, when postsynaptic sensitivity to glutamate is altered at both inputs, there is a selective homeostatic adjustment in the amount of neurotransmitter released from Ib input. CaMKII, localized to the postsynaptic density, is ideally placed to detect local changes in postsynaptic activity at both inputs, and postsynaptic inhibition of CaMKII activity is sufficient to enhance release at the Ib input, demonstrating a high degree of signaling compartmentalization within a single muscle cell. Together, these results demonstrate how synaptic activity at the Drosophila larval neuromuscular junction is precisely regulated to ensure both functional diversity and stability.
STAR METHODS
CONTACT FOR REAGENT AND RESOURCE SHARING
Further information and requests for resources and reagents should be directed to and will be fulfilled by the Lead Contact, Ehud Isacoff (ehud@berkeley.edu)
EXPERIMENTAL MODEL AND SUBJECT DETAILS
Drosophila
Transgenic flies were made using standard germline transformation by embryo injection (BestGene Inc., Chino Hills CA). UAS-tdTomato flies were generated by Einat Peled. 24B-Gal4 (Luo et al., 1994), UAS-Ala (Griffith et al., 1993), GluRIIASP16 and Df(2L)clh4 (Petersen et al., 1997) flies were from Corey Goodman (UC Berkeley). UAS-TeTxLC (Sweeney et al., 1995) was from Kristen Scott (UC Berkeley). RN2-Gal4 (#7473) and ShakB-Gal4 (#51633) lines were from Bloomington Drosophila Stock Center (Bloomington, IN). Flies were raised on standard corn meal and molasses media at 25°C. Both male and female wandering third instar larvae were used in all experiments. When required, third instar larvae were screened using an Axio Zoom.V16 microscope (Carl Zeiss, Inc. Oberkochen, Germany) through the use of balancers with larval markers including CyOGFP (3×P3-EGFP variant) and TM6B. Only actively crawling larvae were used for experiments.
Unless otherwise noted, all larvae contained a single copy of SynapGCaMP6f. The following genotypes were used: wild-type control (w1118;+;+), wild-type SynapGCaMP6f (WT; w1118;+/+;SynapGCaMP6f/+), GluRIIA (GluRIIASP16/Df(2L)clh4;SynapGCaMP6f/+), UAS-Ala (w1118;UAS-Ala/+;SynapGCaMP6f/+), 24B-Gal4 (w1118;+/+;SynapGCaMP6f/24B-Gal4), 24B>Ala (w1118;UAS-Ala/+;SynapGCaMP6f/24B-Gal4), UAS-TeTxLC (w1118;UAS-TeTxLC/+;SynapGCaMP6f/+), RN2-Gal4 (w1118;RN2-Gal4/+;SynapGCaMP6f/+), RN2>TeTxLC (w1118;UAS-TeTxLC/RN2-Gal4;SynapGCaMP6f/+), RN2-Gal4>UAS-tdTomato (w1118;RN2-Gal4/UAS-tdTomato;SynapGCaMP6f/+), ShakB-Gal4 (w1118;ShakB-Gal4/+;SynapGCaMP6f/+), and ShakB>TeTxLC (w1118;UAS-TeTxLC/ShakB-Gal4;SynapGCaMP6f/+).
METHOD DETAILS
SynapGCaMP6f Construct
The Ca2+ sensor GCaMP6f (Chen et al., 2013) was targeted to the muscle as done previously (Peled and Isacoff, 2011; Peled et al., 2014) starting with the SynapGCaMP3 DNA construct (MHC-CD8-GCaMP3-Sh), which includes the myosin heavy chain (MHC) promoter, CD8 transmembrane domain and 154 amino acids from the C-terminal tail of the D. melanogaster shaker (Sh) potassium channel. GCaMP6f (#40755, Addgene, Cambridge, MA) was amplified with SpeI containing primers and inserted into the SpeI site of the SynapGCaMP3 construct, exchanging GCaMP3 for GCaMP6f to generate the SynapGCaMP6f construct MHC-CD8-GCaMP6f-Sh.
In vivo Imaging Chambers
For all in vivo imaging, third instar larvae were mounted in a custom-built gas-permeable poly(dimethylsiloxane) (PDMS) imaging chamber. The PDMS chambers were fabricated using standard soft lithography replica molding techniques. A 500 μm-thick mold for the PDMS chambers was fabricated with SU8-2150 (Microchem Corp. Westborough, MA) on a silicon wafer, followed by the silanization of SU8 mold in a vacuum desiccator to aid release from PDMS. PDMS (Sylgard 184, Dow Corning, Auburn, MI) was prepared with a 10:1 mass ratio (base to cross-linker), degassed in a vacuum chamber for 30 min, poured on the SU8 mold, cured in an oven at 60°C for at least 2 h. The PDMS was then carefully peeled off the mold and individual chambers were cut to shape.
In vivo Intact Larval SynapGCaMP6f Imaging
Imaging was performed in a PDMS chamber with an internal depth of 500 μm and an internal width of 1 mm (Figures 1A and S1A). Larvae were oriented with the dorsal surface up in the chamber and gently sealed in the chamber using standard coverslip glass. Larvae were imaged using an Axio Zoom.V16 microscope (Zeiss) with a 2.3× 0.57 NA objective, a FS 38 HE filter set (Zeiss, excitation BP 470/40nm HE; emission 525/50nm HE) and an AxioCam Hr R3 camera. Image acquisition was performed by Zen 2 (Zeiss). Anterior half of the whole larva or dorsal muscles 1, 2, 9 and 10 from segments T3, A1 or A2 were used. Anterior segments provided the cleanest images without significant contamination from the often autofluorescent gut and light scattering fat tissue; however, this technique was able to detect synaptic activity at nearly all body-wall muscles from all segments. For image acquisition, 50 ms images were acquired at frequencies between 14–20 Hz continuously for 1–2 minutes with a final magnification of either 40× or 260× and a 2 μm depth of field (aperture fully opened). The large depth of field prevents the NMJs from moving out of focus during small movements. All MN activity was endogenous and data were only used from larvae that exhibited sustained activity following the mounting and imaging process. Recordings or NMJs where there was too much movement or NMJs that moved completely out of focus were excluded from the analysis.
SynapGCaMP6f Optical Quantal Imaging
For high-resolution quantal analysis, third instar larvae were first dissected in HL3 solution containing, in mM: 70 NaCl, 5 KCl, 0.45 CaCb·2H2O, 20 MgCl2·6H2O, 10 NaHCO3, 5 trehalose, 115 sucrose, 5 HEPES, and with pH adjusted to 7.2. Following removal of the brain, larval fillets were washed and imaged in HL3 containing 1.5 mM Ca2+ and 25 mM Mg2+, unless otherwise noted (see Figures S3G and S5S-V). Fluorescence images were acquired with a Vivo Spinning Disk Confocal microscope (3i Intelligent Imaging Innovations, Denver, CO), which included a 63× 1.0NA water immersion objective (Zeiss), LaserStack 488nm (50 mW) laser, Yokogawa CSU-X1 A1 spinning disk (Tokyo, Japan), standard GFP filter, and EMCCD camera (Photometrics Evolve, Tucson, AZ). Unless otherwise noted (see Figure S7F–G, where 20× water objective was used), all fillet recordings were done on ventral longitudinal abdominal muscle 4 at segments A2–A5 of third instar larvae. Fields of view were first selected to maximize the area of both Ib and Is terminals that could be imaged within a single focal plane. The imaging area was then cropped to just the NMJ area.
Nerve stimulation was performed with a suction electrode attached to a Stimulus Isolation Unit (SIU, ISO-Flex, A.M.P.I Jerusalem, Israel) with a 75–100 μs stimulus duration. Stimulation intensity was adjusted to recruit both Ib and Is axons as verified during the imaging. Nerve stimulation and imaging were synchronized using custom-written MATLAB (MATLAB Version R2015b and Image Processing Toolbox Release R2015b, MathWorks, Inc., Natick, MA) scripts used to control the SIU and trigger imaging episodes within SlideBook (v6.0.9, 3i Intelligent Imaging Innovations).
Episodic stimulation and imaging protocols (only possible at stimulation frequencies between 0.1–1 Hz) involved acquiring images as a series of 10 images (50 ms exposures). Each episode had at least 3–4 baseline frames prior to nerve stimulation. In most cases, 200 stimulus trials at 0.1 Hz were used for analysis to minimize the effects of statistical fluctuations on the calculation of Pr at individual synapses (see below). Spontaneous release was measured by imaging continuously at 20 Hz (50 ms exposures in streaming capture mode) for 2 minutes total separated into four 30 s imaging blocks to allow for the manual correction of any drift. For the simultaneous analysis of spontaneous and evoked quantal amplitudes (only Figure S4K), images were similarly acquired at 20 Hz continuously for 100 s with 10 stimulation trials at 0.1 Hz. High frequency stimulation experiments involved imaging continuously (50 ms exposures in streaming capture mode) at 20 Hz and waiting 3 s before stimulating at the indicated frequencies and durations (Figures 6 and S6). Stimuli were time-locked to the start of the recording to register stimuli.
Data collection and subsequent analysis were not performed blind, however care was taken to ensure that the animals received the same treatment before and during the recordings. Data were then analyzed with the same parameters for all relevant automatic detection thresholds when possible. In all cases, due to the length of individual recording sessions for a given experiment, genotypes were randomly rotated on each day to ensure that data for each genotype were generated on multiple days. However, all replicates for a particular experiment were performed by the same person to remove any source of variability in the preparation of animals. Similar numbers of replicates were used for each genotype within a given experiment.
Electrophysiology
Third instar larvae were dissected as described above and all recordings were performed on muscle 4 from segment A3 in HL3 containing 1.5 mM Ca2+ and 25 mM Mg2+. Recording electrodes contained 3 M KCl and had resistances in the range 15–35 MΩ. Only muscles with a resting membrane potential (Vm) below −60 mV and a membrane resistance above 4 MΩ were used for the analysis. For two-electrode voltage clamp experiments, the membrane was held at −80 mV. All data were recorded at 5 kHz, with an AxoClamp-2A amplifier and Digidata 1322A interface and Clampex 8.0 software (Molecular Devices, Sunnyvale, CA). The motor neuron was stimulated as described above. For simultaneous spontaneous mEPSP measurements with imaging, the image acquisition was triggered by the Digidata so that the imaging was time-locked to the start of the electrophysiology recording. During these recordings we are unable to account for all mEPSP events during our optical analysis. This is due to several technical factors. The combination of spinning disk confocal microscope and high magnification objective (63×) mean that we can only image from a fairly limited Z-section of the muscle surface. We are able to reliably identify events around a single bouton, but if other boutons are located at a different Z position along the curved muscle surface, we may not be able to image those SynapGCaMP6f signals. Similarly, the branching patterns of both Ib and Is axons may prevent us from imaging the entire Ib and Is NMJs simultaneously. Thus, as many as about 50% of either input may not be imaged at a given time, while the electrical mEPSP measurements should be detectable from the entire muscle. However, we should also note that it is possible that mEPSPs may also be missing, as has recently been reported (Nguyen and Stewart, 2016). Given these concerns, we find that nearly all optical events have a corresponding mEPSP but not vice-versa, with many mEPSPs not having an observed optical event.
For simultaneous two-electrode voltage clamp and imaging experiments (see Figures S3J–M), image acquisition was similarly triggered by the Digidata and brief voltage steps were applied to determine whether voltage-gated channels contributed to the SynapGCaMP6f response. We find that voltage steps, even to a membrane potential of 0 mV from −80 mV, failed to produce a detectable fluorescence change.
Antibody Labeling
Larvae were fixed in Bouin’s fixative (Ricca Chemical Company, Arlington, TX) for 5 minutes, permeabilized in PBS with 0.1% Triton X100 (PBT) and blocked in PBS with 0.1% Triton X100, 5% normal goat serum, and 0.02% NaAzide (PBN). All antibody incubations were performed in PBN and washes were performed in PBT. Mouse anti-Brp (nc82) and mouse anti-GluRIIA (8B4D2) primary antibodies were used at 1:100 (Developmental Studies Hybridoma Bank, Iowa City, IA). Polyclonal rabbit anti-pT286 CaMKII (PA5-17755, Thermo Fisher Scientific, Waltham, MA) antibody was used at 1:200. Rabbit anti-GFP antibody (A21311; Thermo Fisher Scientific) was used at 1:1000 to label SynapGCaMP6f following fixation. Alexa Fluor 488 (123-545-021) and Cy3-conjugated (123-165-021) goat anti-Hrp antibodies (Jackson ImmunoResearch Laboratories, West Grove, PA) were used at 1:100. Alexa Fluor 488 goat anti-rabbit (A11008), Alexa Fluor 532 goat anti-mouse (A11002), and Alexa Fluor 647 goat anti-mouse (A21235) secondary antibodies (Invitrogen) were used at 1:1000. Following antibody incubations and washes, larval fillets were mounted in Vectashield (Vector Laboratories, Burlingame, CA). Antibodies obtained from the Developmental Studies Hybridoma Bank were developed under the auspices of the National Institute of Child Health and Human Development of the National Institutes of Health and maintained by the Department of Biological Sciences of the University of Iowa, Iowa City, IA.
Immunofluorescence Imaging
NMJ images of antibody labeled fillets were acquired with a LSM 780 or LSM 880 microscope and a 63×/1.4 DIC oil immersion objective using Zen software (Zeiss). For comparisons of pCaMKII levels between different genotypes all antibody labeling and imaging were performed on the same day under identical conditions. Z-stacks were acquired with between 0.5 μm to 0.25 μm z-axis spacing except for images of the larval central nervous system and ventral nerve cord, which used a 5x objective and 2 μm spacing.
QUANTIFICATION AND STATISTICAL ANALYSIS
In vivo Image Analysis
All image analysis was performed using custom-written MATLAB routines. Images were first converted using the Bio-Formats Matlab Toolbox from the Open Microscopy Environment (Linkert et al., 2010). To stabilize the moving and contracting NMJs in vivo, movies were run through a series of successive image registration steps. Individual recordings often contained several Ib and Is NMJ pairs that were processed separately. Coarse, rigid translational movements of the NMJ pairs were removed by computing the x- and y-displacements to arrive at the maximum 2D cross-correlation between successive frames. These corrections eliminated the movement from neighboring hemisegments and large local contractions. The individual NMJs within the tracked areas were then registered using affine and diffeomorphic nonlinear (Demon) transformations (MATLAB Image Processing Toolbox Release R2015b), where a high intensity frame (with both Ib and Is NMJs showing activity) was used as reference. The combination of these methods corrected for the shape changes that occurred during contraction of the muscle locally. Fluorescence data were calculated using regions of interest (ROIs) that were manually drawn around either 1 to 2 boutons or the entire NMJ depending on the type of analysis performed. Absolute fluorescence from both Ib and Is NMJs was always contaminated by a combination of internal larval autofluorescence, residual out of focus SynapGCaMP6f fluorescence, and broad SynapGCaMP6f fluorescence within the muscle. This later fluorescence was present at lower levels and therefore capable of measuring Ca2+ activity more broadly throughout the muscle near the membrane. Muscle contractions gave rise to slower and spatially uniform fluorescence signals, which remained tightly correlated with high levels of synapse activity (see Figure S1F). These fluorescence changes were consistent with what one would expect from the rapid conduction of the EPSP voltage along the large diameter muscle fiber, coupling of Ca2+ influx through voltage-gated channels to Ca2+-induced Ca2+ release from internal stores. These spatially uniform muscle fluorescence signals (Fm), along with any corresponding background fluorescence changes were therefore always subtracted from the absolute fluorescence prior to calculating Ib and Is ΔF/F by calculating the mean fluorescence intensity from an area adjacent to both types of NMJs but not containing any synapses. Bleaching under these imaging conditions was minor but Fm subtraction often also corrected for any slow bleach during long recordings. This process allowed the synaptic component of the SynapGCaMP6f fluorescence changes to be cleanly isolated in the complex in vivo environment of a behaving larva.
In order to quantify the degree of synchronicity between Ib and Is NMJs, Pearson’s correlation coefficients were calculated between ΔF/F traces averaged across single boutons (Figure S1E). Similar correlation analysis was performed between ΔF/F traces and Fm (Figure S1F). Total NMJ translation magnitude was calculated as the summed magnitudes of all of the motion correction steps for an individual bouton including the coarse translation correction and affine translation magnitudes (see Figure 1G, black trace and Figures S1B–D). Muscle contraction dynamics were quantified using the shear values from the 2D affine transformation matrices for each frame, which were computed during the registration process. Thus the normalized shear metric (Figures 1H–I and 7F–G) was computed by taking the square root of the sum of squared x-shear and y-shear values, shx and shy, respectively:
This shear magnitude was then normalized from 0 to 1 for each of the individual traces. These normalized shear values were aligned to the start of Ib or Is ΔF/F activity and then averaged for multiple NMJs and animals.
To define distinct periods of activity, time to high-state, and mean onset delay (Figures 2A–B and 2H), we binned ΔF/F values into 100 equally spaced bins based on their magnitudes. The relaxed, low-state was defined when the ΔF/F signal was in the lower 25 bins. Since the high-state was more variable, it was defined when the ΔF/F signal surpassed the 50th bin. Percent active time was calculated by dividing the period when ΔF/F signals were in this high-state by the total duration of the movie. The time to high-state was defined when ΔF/F surpassed 10% of the low-state level, which represented the start time, and reached to within at least 10% of the high-state level, representing the end time. This 10% tolerance was used to minimize false positive start and end times due to the noisiness of the ΔF/F signals. Delays between Ib and Is bouts of activity were calculated using these aforementioned start times. All onset periods were then verified manually to guarantee that none were false positives.
To classify Ib NMJ activity states relative to the paired Is activity (Figure 2C) we first took the raw fluorescence traces from Ib regions, normalized to the baseline and peak normalized, and then divided by the maximum peak value to obtain activity values from 0 to 1. The activity index value was obtained by taking the integral underneath this new normalized activity trace. We divided Ib synaptic activity into distinct phases by looking at the temporal correlates of Is activity. Since Ib activity occurred before, during, and after Is activity, our activity index values were therefore divided into three distinct phases: a pre-Is phase, an on-Is phase, and a post-Is phase.
A metric reflecting the total integrated Ca2+ influx, or total synaptic transmission, at Ib and Is NMJs was achieved by summating ΔF/F values spanning the majority of the SynapGCaMP6f area corresponding to each NMJ subtype as well as the entire duration of the recording (Figures 2D–G). For a given frame, we first subtracted Fm. We then calculated the ΔF/F at each pixel (p) of the NMJ region, where F0 was calculated for each pixel during a silent period. These ΔF/F values were then summated within the entire NMJ region (m pixels) for each frame (t), and finally summated across all movie frames (n) to give us a final total synaptic transmission value for a given movie and NMJ:
There are several caveats to this analysis. The inactive in vivo baseline fluorescence (F0) at Is NMJs is usually quite low. Therefore, the Is F0 following subtraction of the Fm often became very small, likely leading to an overestimation of the ΔF/F Care was taken to use ROIs to calculate Fm that permitted the retention of accurate information about Is activity. As the background, Fm, subtraction is necessary to isolate the Is activity, the calculation of the total synaptic transmission in Is NMJs is also likely overcorrected. However, we found that the total integrated activity at Ib is always larger than the Is total synaptic transmission despite this, so overcorrection does not change the results (Figure 2E–H). Additionally, we cannot account for the nonlinearities in the SynapGCaMP6f responses under persistent high levels of synaptic activity or the nonlinear summation (see below) in the membrane voltage during simultaneous Ib and Is activity in vivo, which may also affect the apparent Ca2+ activity.
Fluorescent events representing quantal, spontaneous vesicular release were detected during periods of muscle relaxation and the absence of motor neuron activity (Figures 2I–K and Figure S2). These events were automatically detected within the affine registered data for each NMJ using the same method as described in more detail below. All automatically detected events were further filtered by their amplitude, size, and roundness and were subsequently verified manually. The frequency of spontaneous release was calculated by selecting ROIs over the majority of the Ib or Is NMJ areas, counting the number of events occurring in either area and dividing by the total relaxed, inactive time (Figure 2L). The spontaneous/evoked total synaptic transmission ratio was calculated using the suprathreshold pixels associated with each spontaneous quantal event (Figures 2M and S2I). The ΔF/F after background subtraction was summated for these pixels in the same manner as described above. This method increased the signal-to-noise by ensuring that only spontaneous, quantal events made up our total activity integral during relaxed periods rather than background or movement-associated ΔF/F artifacts. The total MN-evoked activity was calculated in a similar manner as above, using the whole Ib or Is NMJ area, except only the MN-active frames were included in the total synaptic transmission calculation, excluding those time points that were spontaneously active. These spontaneous quantal summated values were then divided by the active state to calculate the spontaneous/evoked ratio.
To analyze intersegmental wave propagation dynamics (Figures 7H–I) we manually analyzed 40x magnification movies (see Supplemental Movie 1), where at least four segments between T2 and A3 were visible and in focus. We classified large-scale activity based on the number of segments that individual wave events propagated through. The maximum value was four segments, and the minimum value was one segment. Single segment events were defined based on asynchronous firing patterns between segments, indicating uncoordinated large-scale activity.
Optical Quantal Image Analysis
Quantal image analysis was performed using techniques similar to previous work (Peled and Isacoff, 2011; Peled et al., 2014), using custom-written MATLAB routines. All images were initially filtered (Gaussian low-pass filter), to reduce high-frequency noise. Images were then separated into Ib and Is regions based on their baseline SynapGCaMP6f fluorescence, which was 2–3 fold lower at Is synapses compared to their Ib counterparts on the same muscle (Figure S3A). Individual stimulus trial episodes were motion corrected by maximizing the 2D cross-correlation for the whole NMJ region of the first frame of each episode to a reference frame. This was repeated again separately for smaller portions of the NMJ to account for minor shape changes that often occurred during long recordings. Images were then bleach corrected (with SynapGCaMP6f and spinning disk confocal imaging, bleaching is very minor) using a double exponential fit to the baseline and post-activity fluorescence data for each trial separately. Individual stimulus trials were excluded if the NMJ was out of focus, moving during the acquisition period, or the stimulus failed to recruit one of the axons.
For automatic detection of MN stimulation-evoked ΔF spots, in the episodic imaging mode, we first manually identified several (>20) ΔF spots (across >10 release sites and several stimulation trials). These were used for generating ΔF traces. The average of these ΔF traces was used to generate a template response. A separate template response trace was used for different image intervals and recording conditions. Pixel-by-pixel ΔF values were then used to generate ΔF response images, and ΔF images were divided by basal-fluorescence (t = 0) images to obtain the normalized ΔF/F values. Participating pixels were identified if they had a high degree of correlation with the template response, as determined by the maximum cross-covariance as well as ΔF/F amplitudes that were above a threshold (typically between 0.04 – 0.05 ΔF/F) and at least 1.5 to 2 times larger than the standard deviation of the values at that pixel. Active pixels were grouped together and we applied additional size and amplitude thresholds to eliminate any false positive quantal spots (Figures S4B–E).
To construct release probability maps we applied an additional filter (Gaussian) to smooth the edges of the thresholded quantal spots. We then identified the centers of ΔF spots in response images by searching for well-isolated 2D local maxima, and counted how many times out of all stimulation trials each pixel was identified as a spot center. The probability maps are color coded to show the percentage of times each pixel was identified as a ΔF spot center (Figure 4B). The probability scale for these images was set so that its maximum reports the maximal release-site Pr in the image. Probability maps were filtered (Gaussian) for display purposes. Reported probability values were not affected by this filtering because they were determined using unfiltered data (see below).
To determine Pr of individual release sites, each site was manually identified as a spatially distinct local maximum in the filtered Pr map. For Ib release sites, a 4×4 square area was assigned to each site and the number of ΔF spots that were centered in that area during all stimulation trials was counted. For Is release sites a 5×5 pixel area was used because of the greater uncertainty in the spot center locations due to the larger evoked quantal spot sizes and amplitudes. To obtain Pr values for each site, the total number of ΔF spot centers was divided by the number of stimulation trials. To determine evoked transmission amplitudes within individual release sites, the maximum ΔF/F within the release site box was measured each time a response was counted within that site.
To avoid any bias due to the need for manual identification of release site locations as well as the possibility of low probability sites near high Pr sites that would not otherwise be identified, we also included an unbiased metric of the quantal density for all of the recordings. Quantal density is calculated as the area-normalized quantal content. This metric used the total number of ΔF spot centers identified for each stimulus trial and averaged over the total 200 stimulus trials and divided by the total area of the imaged Ib or Is NMJ. We normalized this to the total imaged area because, due to the shape of the muscle and the branching patterns of both NMJs, it was often impossible to image the entire NMJ (something that was not a problem in vivo). The quantal density metric is relatively stable over 200 trials, > 30 min of episodic imaging (see Figure S6B), even though some slow bleaching was noted in the average ΔF/F amplitudes during long recordings. This decay during 0.1 Hz stimulation experiments occurred slowly and similarly at both NMJs (data not shown). This metric is unbiased and more sensitive to changes in release at the low Pr synapses as it does not require any synapse detection in the cumulative activity maps prior to calculation. However, it is not equivalent to the classic quantal content metric as we were not always able to image the entire Ib and Is NMJ areas simultaneously.
Automatic detection of spontaneous activity was done accomplished with a technique similar to the method described above for the episodic acquisition mode. Motion correction for these recordings was accomplished using a customized subpixel registration algorithm (Guizar-Sicairos et al., 2008) in order to allow for ΔF/F analysis over extended periods of time without any edge pixel jitter artifacts (i.e. when single pixel translations cause artifacts on edges of the NMJ). Correlation of ΔF traces with a template trace was evaluated over the entire imaging time, to allow detection of miniature events at any time point during the 30 s window except for several initial frames and the last few frames where a complete template match could not be obtained. This was done as described above for evoked quantal analysis. All automatically detected events were verified manually, using unfiltered ΔF/F images and ΔF/F traces to confirm that the events had characteristic shapes and ΔF/F profiles.
Spontaneous event local maxima were identified similarly to the evoked responses. Spontaneous frequency maps were then generated by counting the number of times each pixel had a spontaneous event center and these maps were filtered (Gaussian) for display purposes (Figure 3L). Spontaneous event amplitudes were measured as the maximum ΔF/F amplitude at the event local maxima. Local spontaneous frequencies were calculated using the same methods as the single release site Pr values. Using the maps of cumulative spontaneous activity, 3×3 pixel areas were assigned at both NMJs at any non-overlapping spontaneously active location. Fs was then calculated as the number of events within each of these regions divided by the total time of the recording (2 min) (Figures S3F–S3G).
In most conditions in the filleted larvae, quantal responses, either spontaneous or evoked, were easily distinguished from noise (Figures 3B–3E). However, the smaller amplitude of unitary events in the GluRIIA mutant posed a potential problem. We noted that this was especially true GluRIIA Ib synapses where events profiles were much closer to the noise level of our recordings (Figure S5P), something that did not pose such a problem at GluRIIA Is synapses. However, given the increases in both Pr and quantal density observed in GluRIIA Ib NMJs, this would suggest that we are likely underestimating the degree of compensation at those Ib synapses, while the Is synapses should be unaffected by any detection issues (Figure S5P). When the extracellular Ca2+ concentration was further reduced (see Figure S3G for quantification of the effects on optical quantal amplitudes) the responses at the Ib NMJs became more difficult to detect (data not shown). This prevented the accurate quantification of presynaptic GluRIIA synaptic strength at 1.0 mM Ca2+, although the GluRIIA Is responses remained strong enough to detect accurately under these conditions (see Figures S5S–V)
Simultaneous mini and evoked amplitude measurements (Figure S4K) were performed similarly to the spontaneous event measurements. All events were identified through the entire continuous 100 s imaging window, which included both spontaneous and evoked responses using the same template. Events were then binned into spontaneous and evoked response windows according to their peak time relative to the nerve stimulation (a 1 s window surrounding the nerve stimulation was used for all evoked trials). Events were then processed in the same way as the spontaneous measurements above to calculate the relative evoked and spontaneous quantal event amplitudes. For these calculations only spontaneous and evoked events with exact same peak location were used for comparisons of amplitudes.
Unlike the low frequency episodic imaging or spontaneous event imaging protocols, stimulating at frequencies above 2 Hz makes it difficult to perform unambiguous template matching to identify quantal events. This is largely due to the quantal SynapGCaMP6f decay time (spontaneous quantal event decay times were Ib: t1/2 = 149.0 ± 2.8 ms and Is: t1/2 = 152.6 ± 1.6 ms, see Figure S3E–F). However, due to the low-to-moderate basal Pr at either Ib or Is synapses, local quantal activity is not expected to summate significantly during repetitive stimulation. For example, during a 10 s, 5 Hz stimulus a ~0.2 Pr synapse would only be predicted to release a vesicle 10 times, with, on average, 1 s between responses, much longer than the decay time required for full decay of the SynapGCaMP6f signal. Similarly, a higher Pr synapse of 0.5, such as what we tend to observe at Is NMJs or a transiently facilitated low Pr Ib synapse, would, on average, have 400 ms between responses, long enough to for SynapGCaMP6f to mostly decay back to baseline. This quantal separation is indeed what we observed during 5 Hz stimulation with individual quantal responses clearly identifiable during the train without substantial summation occurring (Figure S6F). Nevertheless, in order to identify when, where and how strong these quantal responses are during repetitive stimulation, we developed an alternative detection technique that did not require template fitting. These recordings were analyzed by first performing the same subpixel registration as used above for the spontaneous event detection. We then thresholded the ΔF data to remove any low amplitude, high frequency noise and searched for local maxima within in x-y-t space (MinimaMaxima3D, MathWorks File Exchange). These events locations were then used to identify peak timing and ΔF/F amplitudes. Stimulus timing was used to bin the recordings into individual stimuli to calculate the quantal density per stimulus. Spontaneous events occurring before or after the stimulus period were excluded.
For the local plasticity analysis (Figures 6F, 6K and S6L-M) all response timings were collected for overlapping 3×3 pixel regions centered at every pixel within the Ib or Is NMJ area. Only pixel regions that had at least one MN-evoked response were included in the analysis. All responsive pixels were then sorted based on the number of responses in the first half of the recording compared to the second half of the recording. The categories included active regions that increased the number of responses (facilitated), decreased the number of responses (depressed), had the exact same number of responses (unchanged), went from no responses to some responses (recruited), or went from some responses to no responses (silenced).
Optical Quantal Amplitude Comparisons
In our comparisons between spontaneous and evoked transmission separately, we noted a larger difference in the evoked response amplitudes at Is sites compared to Ib sites than we would have predicted from optical mini amplitudes alone (compare Figures 3F–G and Figures S4I–J). Several factors could contribute to this discrepancy. First, due to the high basal Pr at Is synapses, it was possible that a large percentage of Is evoked responses were multiquantal from the same synapse. Second, we could have been observing evoked quantal release from neighboring synapses that were located too close to reliably identify separate peak responses. The density of active release sites was found to be lower than the density of Brp puncta (i.e. approximately the number of active zones) (Figure S4G). Third, evoked and spontaneous release events at Is NMJs could be restricted at spatially separate synapses with significantly different quantal sizes (either different vesicle sizes or different postsynaptic glutamate sensitivities). Finally, neighboring synapse postsynaptic responses could be slightly overlapping enough raise the peak amplitude at neighboring sites.
In order to differentiate between these interpretations, we first measured spontaneous and evoked response amplitudes simultaneously from the same NMJs and at the same locations using the same detection settings (see above). Consistent with measurements for these two transmission modes taken separately, we observed larger evoked responses at Is synapses compared to the spontaneous events at the same sites. We found that the ratio of evoked to spontaneous release amplitudes at single Is synapses were distributed between 1 and 3 (Figure S4K) confirming our suspicion from separate recordings of either evoked or spontaneous activity.
To determine whether quantal response crosstalk was a factor, we next isolated functional release sites at both NMJs that had only a single matching and spatially isolated Brp punctum in the post hoc Brp structural data (Figures S4L–M). We then compared mean evoked response amplitudes and evoked Pr at these sites to the pooled data for all release sites. When we compared single-Brp site mean evoked amplitudes at Ib NMJs we did not observe any differences (Figure S4N). However, we found that single-Brp Is response amplitudes were significantly smaller than the pooled data (Figure S4N). Importantly, these isolated Is sites had average amplitudes that were the same size as spontaneous quantal responses at Is NMJs (Figure 3G). Because these sites likely only had a single active zone we concluded that spontaneous-evoked site quantal size differences and single-site multiquantal release likely did not contribute to this discrepancy in amplitude. Rather the differences were likely due to the interaction between neighboring synapses leading to the boosting of the amplitude of neighboring responses.
The evoked quantal amplitude boosting/crosstalk when neighboring synapses were both present and active, necessitated that we confirm that our Pr measurements weren’t skewed by the high quantal density at Is NMJs. We found that the single-Brp release sites had similarly large distributions of Pr compared to the pooled data at both NMJs, with a nearly identical mean and median Prs (Figure S4O). This confirmed that our Pr data were representative of the population of active synapses despite the lower resolution of the activity data relative to the density of Brp-containing AZs and the high Is quantal density. Furthermore, these data would suggest that the large numbers of Brp puncta that do not have a corresponding active release site are very weakly active or completely inactive during low frequency stimulation as has been noted previously (Peled and Isacoff, 2011).
Our high frequency quantal data also supports this idea as along with a decreasing quantal content at Is NMJs during stimulus trains (Figure 6D) we noted decreases in the amplitude of the quantal responses (see Figures S6I–J). This occurs because with fewer active synapses as the Is NMJ depresses, there is a reduced probability of overlap of quantal responses during repetitive stimulation. However, we were still able to isolate neighboring active synapses, as single sites are only active for a small portion of action potentials during repetitive stimulation (Figure S6F). Taken together, we conclude that discrepancies between spontaneous and evoked response amplitudes, at least at WT Is NMJs, are largely due to either glutamate spillover or postsynaptic Ca2+ signal contamination from neighboring and simultaneously active synapses. Smaller SSR surrounding Is axons may allow for this quantal crosstalk between synapses more readily than at Ib NMJs (Atwood et al., 1993).
Our comparisons of evoked and spontaneous event amplitudes also unveiled another complication to the analysis of evoked response amplitudes. Ib evoked quantal responses were generally slightly smaller than spontaneous event amplitudes (Figure S4K). This suggests that not only are most Ib responses single quantal events, but that there may be some reduction in amplitude due to nonlinear summation during simultaneous motor neuron activity. With such a large quantal content and large quantal sizes, the Is axon, when co-active with the Ib axon, could interact in the non-voltage clamped muscle to alter the Ca2+ driving force into the muscle (Wolf et al., 1998). Supporting this conclusion, we were able to demonstrate that the Ca2+-dependence of our SynapGCaMP6f responses are linear through a large range of extracellular Ca2+ concentrations (Figure S3G) so any differences are likely consistent with changes in Ca2+ entry. Nonlinear summation-based decreases in Ib quantal amplitudes were confirmed with our Is-specific TeTxLC expression quantal analysis data where, in the absence of synchronous MN-evoked Is activity, we noted somewhat larger evoked quantal responses at the corresponding Ib synapses (UAS-TeTxLC control Ib ΔF/F mean = 0.43±0.03 n = 6 NMJs; RN2-Gal4 control Ib ΔF/F mean = 0.39±0.03 n = 6 NMJs; RN2>TeTxLC Ib ΔF/F mean = 0.61±0.03 n = 6 NMJs; p = 0.13 RN2>TeTxLC vs. UAS control and p = 0.038 RN2>TeTxLC vs Gal4 control using ANOVA with post hoc Tukey’s test). Though it is important to note that this effect has no effect on our quantal density or Pr measurements as despite the increase evoked amplitudes in the Is-TeTxLC expression case, no differences were noted in either metric (Figures 7L and S7K). However, we should note that in light of these issues, widely implemented quantal content corrections to compound EPSP measurements (Martin, 1955) that try to account for nonlinear summation should be used carefully as the effects of nonlinear summation may be non-uniform with convergent inputs in fly larvae.
Electrophysiology Analysis
All electrophysiological recordings were analyzed with custom-written MATLAB routines. Briefly, all data were filtered offline at 1 kHz. EPSP and EPSCs were calculated as the difference between the peak response to the average baseline immediately prior to MN stimulation. At least 20 evoked responses were acquired at 0.1 Hz and then averaged to calculate the mean compound response. Spontaneous mEPSP events were automatically identified using the same template correlation method described above for detection of spontaneous optical quantal events. All mEPSPs were validated manually as having characteristic rise and decay profiles. Quantal content was calculated as the mean EPSP amplitude divided by the mean mEPSP amplitude. For simultaneous mEPSP and optical recordings verified optical events and mEPSPs were paired manually and we only included events where optical and electrophysiological event pairs were unambiguously matched.
Immunofluorescence Image Analysis
Unless otherwise noted all images are maximum intensity projections that were generated using custom-written MATLAB routines. For post hoc analysis of Brp puncta, maximum intensity projections of Brp and Hrp images were first filtered (Gaussian). Then axonal regions were identified using the Hrp maximum intensity projection image corresponding to the live SynapGCaMP6f imaged region (see below). Pixels within their respective Hrp areas were then intensity thresholded to remove any pixels that were not part of a Brp punctum. Using these thresholded images, local maxima were identified and all maxima were validated manually. False puncta were removed and any puncta that were missed by the automatic detection were added manually. These locations were then used to identify the number of Brp puncta, their density (relative to the total Hrp area), and their maximum intensity. Because the post hoc Brp analysis was not all performed at the same time and under the exact same labeling and imaging conditions we found that the Ib-Is internally compared differences in the intensity of Brp labeling were more reliable (Figures S3T-U versus S3V).
For quantitative analysis of the total integrated pCaMKII levels, we similarly used maximum intensity projections of pCaMKII and Hrp labels that were filtered (Gaussian). Ib and Is regions were identified using both the pCaMKII and Hrp signals. We then excluded any pixels below a common intensity threshold for all preps and genotypes and NMJ types. Finally, we summated the remaining pixel intensity values for the respective Ib or Is NMJ. The pCaMKII integrated intensities were likely underestimated because maximum intensity projections were used, however this would likely bias the Ib NMJ which always has a much larger z-axis profile compared to the Is NMJs.
In contrast to a recent report (Nesler et al., 2016), we noted robust postsynaptic pCaMKII labeling. These differences could be due to different antibodies and the presence of potentially many splice isoforms of CaMKII in flies (Guptaroy et al., 2000), which have been shown to have large functional diversity. We did find that the pCaMKII antibody used in this study (PA5-17755, Thermo Fisher), also provided robust staining of the neuropil of the larval central nervous system, approximately overlapping with Brp (Figure S8A). This would suggest that the strong postsynaptic labeling at the NMJ is not limited to glutamatergic synapses. pCaMKII labeling was also present in non-SynapGCaMP6f expressing animals (w1118;+;+ data not shown), so labeling was not an artifact of overexpressing SynapGCaMP6f, a sensor that contains calmodulin. Furthermore, we noted similar but less specific labeling (data not shown) with another rabbit polyclonal anti-pT286 CaMKIIα antibody (sc12886, Santa Cruz Biotechnology, Inc., Dallas, TX).
Statistics
The calculation of Pr at individual sites required special consideration given the stochastic and all-or-none nature of release at each synapse. First, the number of stimulation trials at each NMJ will define the theoretical detection threshold of the very low Pr synapses. Second, in a binomial system, the relationship between the number of measurements, the Pr of a single site, and the expected coefficient of variation (CV) can be calculated with the following formula:
where n is the number of stimulus trials and Pr is the likelihood that an individual synapse will release a single vesicle of glutamate, assuming it does not change over the course of the experiment. With this relationship, the normalized variance will increase as Pr decreases or the number of trials decreases. Thus, care was taken to acquire enough single action potential stimuli at a low (0.1 Hz) frequency to provide an accurate Pr calculation even at very low Pr synapses. Thus, 200 trials were used for these experiments, as this would provide a theoretical detection limit of synapses with a Pr of 0.01 since multiple release events were required to define an evoked active synapse. More importantly, this would bring the predicted CV for all synapses with a Pr of ≥ 0.02 below 0.5 and all synapses with a Pr of > 0.1 around or below 0.2. In this way, we increased the confidence in our single-synapse Pr measurements for a large range of basal synaptic strengths.
Unpaired Student’s t-tests were used for average NMJ data Ib-Is comparisons. Paired Student’s t-tests were used to compare spontaneous and evoked amplitudes within the same NMJ. Mann-Whitney Rank Sum test was used to compare in vivo activity integral groups and average imaging-electrophysiology matched amplitudes. Two-sample Kolmogorov-Smirnov tests were used to compare pooled data Ib-Is frequency distributions. One-way ANOVAs with Tukey-Kramer post hoc tests were used to compare mean NMJ Ib-Is properties for different genotypes. Kruskal-Wallis with Tukey-Kramer post hoc tests were used to compare pooled data frequency distributions for different genotypes. One dimensional Pearson’s correlation coefficients (r) were used to compare ΔF/F traces with motion traces or Fm or optical quantal amplitudes with mEPSP amplitudes, and two dimensional Pearson’s correlation coefficients were used to compare spontaneous and evoked response maps. Reported values are mean ± SEM unless otherwise stated. The specific statistical tests as well as number of replicates including numbers of animals, activity bouts, NMJs, synapses or quantal events, are provided in the corresponding figure legends. For all figures significance corresponds to * p < 0.05, ** p < 0.01, *** p < 0.001, **** p < 0.0001 or NS not significant for the comparisons indicated in the figure or figure legend.
Supplementary Material
Highlights.
Quantal resolution imaging of synaptic transmission achieved at the fly larval NMJ.
Synapses of Ib and Is motor inputs differ in basal transmission and plasticity.
Homeostatic plasticity is input-specific and input-autonomous.
Unique transmission and plasticity sculpt contribution of motor inputs to behavior.
Acknowledgments
We thank members of the Isacoff lab for helpful discussions and support, particularly Einat Peled for helping develop the quantal image analysis tools, Zhu Fu for generating the SynapGCaMP6f construct, Joshua Levitz and Amy Winans for comments on the manuscript, Atiriya Hari and Julia Rabkin for fly maintenance. Support was from the National Science Foundation Graduate Research Fellowship DGE 1106400 (Z.L.N.) and National Institutes of Health PN2EY018241 and U01MH109069. Work performed in part at the UC Berkeley, Cancer Research Lab, Molecular Imaging Center, was supported by NIH S10RR028971-01A1, NSF DBI-1041078, and the Helen Wills Neuroscience Institute, with technical assistance from Holly Aaron and Jen-Yi Lee.
Footnotes
Publisher's Disclaimer: This is a PDF file of an unedited manuscript that has been accepted for publication. As a service to our customers we are providing this early version of the manuscript. The manuscript will undergo copyediting, typesetting, and review of the resulting proof before it is published in its final citable form. Please note that during the production process errors may be discovered which could affect the content, and all legal disclaimers that apply to the journal pertain.
Author Contributions
Z.L.N conceived and performed experiments, analyzed data and co-wrote the manuscript. A.H. K.A. and K.L.W. performed in vivo experiments and analysis. S.L.L. performed electrophysiology. J.H.S. and L.P.L designed and produced in vivo imaging chambers. E.Y.I. conceived and supervised the project and co-wrote the manuscript.
References
- Atwood HL, Karunanithi S. Diversification of Synaptic Strength: Presynaptic Elements. Nat Rev Neurosci. 2002;3:497–516. doi: 10.1038/nrn876. [DOI] [PubMed] [Google Scholar]
- Atwood HL, Govind CK, Wu CF. Differential ultrastructure of synaptic terminals on ventral longitudinal abdominal muscles in Drosophila larvae. J Neurobiol. 1993;24:1008–1024. doi: 10.1002/neu.480240803. [DOI] [PubMed] [Google Scholar]
- Branco T, Staras K. The probability of neurotransmitter release: variability and feedback control at single synapses. Nat Rev Neurosci. 2009;10:373–383. doi: 10.1038/nrn2634. [DOI] [PubMed] [Google Scholar]
- Branco T, Staras K, Darcy KJ, Goda Y. Local dendritic activity sets release probability at hippocampal synapses. Neuron. 2008;59:475–485. doi: 10.1016/j.neuron.2008.07.006. [DOI] [PMC free article] [PubMed] [Google Scholar]
- Budnik V, Ruiz-Cañada C. The Fly Neuromuscular Junction: Structure and Function. San Diego: Elsevier Academic Press; 2006. [Google Scholar]
- Chadderton P, Margrie TW, Häusser M. Integration of quanta in cerebellar granule cells during sensory processing. Nature. 2004;428:856–860. doi: 10.1038/nature02442. [DOI] [PubMed] [Google Scholar]
- Chen TW, Wardill TJ, Sun Y, Pulver SR, Renninger SL, Baohan A, Schreiter ER, Kerr RA, Orger MB, Jayaraman V, et al. Ultrasensitive fluorescent proteins for imaging neuronal activity. Nature. 2013;499:295–300. doi: 10.1038/nature12354. [DOI] [PMC free article] [PubMed] [Google Scholar]
- Cho RW, Buhl LK, Volfson D, Tran A, Li F, Akbergenova Y, Littleton JT. Phosphorylation of Complexin by PKA Regulates Activity-Dependent Spontaneous Neurotransmitter Release and Structural Synaptic Plasticity. Neuron. 2015;88:749–761. doi: 10.1016/j.neuron.2015.10.011. [DOI] [PMC free article] [PubMed] [Google Scholar]
- Choi BJ, Imlach WL, Jiao W, Wolfram V, Wu Y, Grbic M, Cela C, Baines RA, Nitabach MN, McCabe BD. Miniature neurotransmission regulates Drosophila synaptic structural maturation. Neuron. 2014;82:618–634. doi: 10.1016/j.neuron.2014.03.012. [DOI] [PMC free article] [PubMed] [Google Scholar]
- Choi JC, Park D, Griffith LC. Electrophysiological and morphological characterization of identified motor neurons in the Drosophila third instar larva central nervous system. J Neurophysiol. 2004;91:2353–2365. doi: 10.1152/jn.01115.2003. [DOI] [PubMed] [Google Scholar]
- Davis GW, Müller M. Homeostatic Control of Presynaptic Neurotransmitter Release. Annu Rev Physiol. 2015;77:251–270. doi: 10.1146/annurev-physiol-021014-071740. [DOI] [PubMed] [Google Scholar]
- Dittman JS, Kreitzer AC, Regehr WG. Interplay between facilitation, depression, and residual calcium at three presynaptic terminals. J Neurosci. 2000;20:1374–1385. doi: 10.1523/JNEUROSCI.20-04-01374.2000. [DOI] [PMC free article] [PubMed] [Google Scholar]
- Ehmann N, van de Linde S, Alon A, Ljaschenko D, Keung XZ, Holm T, Rings A, DiAntonio A, Hallermann S, Ashery U, et al. Quantitative super-resolution imaging of Bruchpilot distinguishes active zone states. Nat Commun. 2014;5:ncomms5650. doi: 10.1038/ncomms5650. [DOI] [PMC free article] [PubMed] [Google Scholar]
- Frank CA, Kennedy MJ, Goold CP, Marek KW, Davis GW. Mechanisms underlying the rapid induction and sustained expression of synaptic homeostasis. Neuron. 2006;52:663–677. doi: 10.1016/j.neuron.2006.09.029. [DOI] [PMC free article] [PubMed] [Google Scholar]
- Fujioka M, Lear BC, Landgraf M, Yusibova GL, Zhou J, Riley KM, Patel NH, Jaynes JB. Even-skipped, acting as a repressor, regulates axonal projections in Drosophila. Development. 2003;130:5385–5400. doi: 10.1242/dev.00770. [DOI] [PMC free article] [PubMed] [Google Scholar]
- Griffith LC, Verselis LM, Aitken KM, Kyriacou CP, Danho W, Greenspan RJ. Inhibition of calcium/calmodulin-dependent protein kinase in Drosophila disrupts behavioral plasticity. Neuron. 1993;10:501–509. doi: 10.1016/0896-6273(93)90337-q. [DOI] [PubMed] [Google Scholar]
- Guerrero G, Reiff DF, Rieff DF, Agarwal G, Ball RW, Borst A, Goodman CS, Isacoff EY. Heterogeneity in synaptic transmission along a Drosophila larval motor axon. Nat Neurosci. 2005;8:1188–1196. doi: 10.1038/nn1526. [DOI] [PMC free article] [PubMed] [Google Scholar]
- Guizar-Sicairos M, Thurman ST, Fienup JR. Efficient subpixel image registration algorithms. Opt Lett. 2008;33:156–158. doi: 10.1364/ol.33.000156. [DOI] [PubMed] [Google Scholar]
- Gupta A, Wang Y, Markram H. Organizing Principles for a Diversity of GABAergic Interneurons and Synapses in the Neocortex. Science. 2000;287:273–278. doi: 10.1126/science.287.5451.273. [DOI] [PubMed] [Google Scholar]
- Guptaroy B, Marwaha N, Pla M, Wang Z, Nelson HB, Beckingham K, Griffith LC. Alternative splicing of Drosophila calcium/calmodulin-dependent protein kinase II regulates substrate specificity and activation. Mol Brain Res. 2000;80:26–34. doi: 10.1016/s0169-328x(00)00115-7. [DOI] [PubMed] [Google Scholar]
- Haghighi AP, McCabe BD, Fetter RD, Palmer JE, Hom S, Goodman CS. Retrograde control of synaptic transmission by postsynaptic CaMKII at the Drosophila neuromuscular junction. Neuron. 2003;39:255–267. doi: 10.1016/s0896-6273(03)00427-6. [DOI] [PubMed] [Google Scholar]
- Heckscher ES, Lockery SR, Doe CQ. Characterization of Drosophila larval crawling at the level of organism, segment, and somatic body wall musculature. J Neurosci. 2012;32:12460–12471. doi: 10.1523/JNEUROSCI.0222-12.2012. [DOI] [PMC free article] [PubMed] [Google Scholar]
- Heckscher ES, Zarin AA, Faumont S, Clark MQ, Manning L, Fushiki A, Schneider-Mizell CM, Fetter RD, Truman JW, Zwart MF, et al. Even-Skipped+ Interneurons Are Core Components of a Sensorimotor Circuit that Maintains Left-Right Symmetric Muscle Contraction Amplitude. Neuron. 2015;88:314–329. doi: 10.1016/j.neuron.2015.09.009. [DOI] [PMC free article] [PubMed] [Google Scholar]
- Hoang B, Chiba A. Single-cell analysis of Drosophila larval neuromuscular synapses. Dev Biol. 2001;229:55–70. doi: 10.1006/dbio.2000.9983. [DOI] [PubMed] [Google Scholar]
- Jakawich SK, Nasser HB, Strong MJ, McCartney AJ, Perez AS, Rakesh N, Carruthers CJL, Sutton MA. Local Presynaptic Activity Gates Homeostatic Changes in Presynaptic Function Driven by Dendritic BDNF Synthesis. Neuron. 2010;68:1143–1158. doi: 10.1016/j.neuron.2010.11.034. [DOI] [PMC free article] [PubMed] [Google Scholar]
- Jia XX, Gorczyca M, Budnik V. Ultrastructure of neuromuscular junctions in Drosophila: Comparison of wild type and mutants with increased excitability. J Neurobiol. 1993;24:1025–1044. doi: 10.1002/neu.480240804. [DOI] [PMC free article] [PubMed] [Google Scholar]
- Karunanithi S, Marin L, Wong K, Atwood HL. Quantal size and variation determined by vesicle size in normal and mutant Drosophila glutamatergic synapses. J Neurosci. 2002;22:10267–10276. doi: 10.1523/JNEUROSCI.22-23-10267.2002. [DOI] [PMC free article] [PubMed] [Google Scholar]
- Kavalali ET. The mechanisms and functions of spontaneous neurotransmitter release. Nat Rev Neurosci. 2015;16:5–16. doi: 10.1038/nrn3875. [DOI] [PubMed] [Google Scholar]
- Kittel RJ, Wichmann C, Rasse TM, Fouquet W, Schmidt M, Schmid A, Wagh DA, Pawlu C, Kellner RR, Willig KI, et al. Bruchpilot promotes active zone assembly, Ca2+ channel clustering, and vesicle release. Science. 2006;312:1051–1054. doi: 10.1126/science.1126308. [DOI] [PubMed] [Google Scholar]
- Knodel MM, Geiger R, Ge L, Bucher D, Grillo A, Wittum G, Schuster CM, Queisser G. Synaptic bouton properties are tuned to best fit the prevailing firing pattern. Front Comput Neurosci. 2014;8 doi: 10.3389/fncom.2014.00101. [DOI] [PMC free article] [PubMed] [Google Scholar]
- Koh YH, Popova E, Thomas U, Griffith LC, Budnik V. Regulation of DLG localization at synapses by CaMKII-dependent phosphorylation. Cell. 1999;98:353–363. doi: 10.1016/s0092-8674(00)81964-9. [DOI] [PMC free article] [PubMed] [Google Scholar]
- Kurdyak P, Atwood HL, Stewart BA, Wu CF. Differential physiology and morphology of motor axons to ventral longitudinal muscles in larval Drosophila. J Comp Neurol. 1994;350:463–472. doi: 10.1002/cne.903500310. [DOI] [PubMed] [Google Scholar]
- Lahey T, Gorczyca M, Jia XX, Budnik V. The Drosophila tumor suppressor gene dlg is required for normal synaptic bouton structure. Neuron. 1994;13:823–835. doi: 10.1016/0896-6273(94)90249-6. [DOI] [PMC free article] [PubMed] [Google Scholar]
- Lin MZ, Schnitzer MJ. Genetically encoded indicators of neuronal activity. Nat Neurosci. 2016;19:1142–1153. doi: 10.1038/nn.4359. [DOI] [PMC free article] [PubMed] [Google Scholar]
- Linkert M, Rueden CT, Allan C, Burel JM, Moore W, Patterson A, Loranger B, Moore J, Neves C, MacDonald D, et al. Metadata matters: Access to image data in the real world. J Cell Biol. 2010;189:777–782. doi: 10.1083/jcb.201004104. [DOI] [PMC free article] [PubMed] [Google Scholar]
- Lnenicka GA, Keshishian H. Identified motor terminals in Drosophila larvae show distinct differences in morphology and physiology. J Neurobiol. 2000;43:186–197. [PubMed] [Google Scholar]
- Lu Z, Chouhan AK, Borycz JA, Lu Z, Rossano AJ, Brain KL, Zhou Y, Meinertzhagen IA, Macleod GT. High-Probability Neurotransmitter Release Sites Represent an Energy-Efficient Design. Curr Biol. 2016;26:2562–2571. doi: 10.1016/j.cub.2016.07.032. [DOI] [PMC free article] [PubMed] [Google Scholar]
- Luo L, Liao YJ, Jan LY, Jan YN. Distinct morphogenetic functions of similar small GTPases: Drosophila Drac1 is involved in axonal outgrowth and myoblast fusion. Genes Dev. 1994;8:1787–1802. doi: 10.1101/gad.8.15.1787. [DOI] [PubMed] [Google Scholar]
- Mapelli L, Pagani M, Garrido JA, D’Angelo E. Integrated plasticity at inhibitory and excitatory synapses in the cerebellar circuit. Front Cell Neurosci. 2015;9:1–17. doi: 10.3389/fncel.2015.00169. [DOI] [PMC free article] [PubMed] [Google Scholar]
- Marrus SB, Portman SL, Allen MJ, Moffat KG, DiAntonio A. Differential localization of glutamate receptor subunits at the Drosophila neuromuscular junction. J Neurosci. 2004;24:1406–1415. doi: 10.1523/JNEUROSCI.1575-03.2004. [DOI] [PMC free article] [PubMed] [Google Scholar]
- Martin A. A further study of the statistical composition on the end-plate potential. J Physiol. 1955;130:114–122. doi: 10.1113/jphysiol.1955.sp005397. [DOI] [PMC free article] [PubMed] [Google Scholar]
- Melom JE, Akbergenova Y, Gavornik JP, Littleton JT. Spontaneous and Evoked Release Are Independently Regulated at Individual Active Zones. J Neurosci. 2013;33:17253–17263. doi: 10.1523/JNEUROSCI.3334-13.2013. [DOI] [PMC free article] [PubMed] [Google Scholar]
- Muhammad K, Reddy-Alla S, Driller JH, Schreiner D, Rey U, Böhme MA, Hollmann C, Ramesh N, Depner H, Lützkendorf J, et al. Presynaptic spinophilin tunes neurexin signalling to control active zone architecture and function. Nat Commun. 2015;6:ncomms9362. doi: 10.1038/ncomms9362. [DOI] [PMC free article] [PubMed] [Google Scholar]
- Müller M, Davis GW. Transsynaptic control of presynaptic Ca2+ influx achieves homeostatic potentiation of neurotransmitter release. Curr Biol. 2012;22:1102–1108. doi: 10.1016/j.cub.2012.04.018. [DOI] [PMC free article] [PubMed] [Google Scholar]
- Nesler KR, Starke EL, Boin NG, Ritz M, Barbee SA. Presynaptic CamKII regulates activity-dependent axon terminal growth. Mol Cell Neurosci. 2016;76:33–41. doi: 10.1016/j.mcn.2016.08.007. [DOI] [PMC free article] [PubMed] [Google Scholar]
- Nguyen CT, Stewart BA. The influence of postsynaptic structure on missing quanta at the Drosophila neuromuscular junction. BMC Neurosci. 2016;17:53. doi: 10.1186/s12868-016-0290-7. [DOI] [PMC free article] [PubMed] [Google Scholar]
- O’Rourke NA, Weiler NC, Micheva KD, Smith SJ. Deep molecular diversity of mammalian synapses: why it matters and how to measure it. Nat Rev Neurosci. 2012;13:365–379. doi: 10.1038/nrn3170. [DOI] [PMC free article] [PubMed] [Google Scholar]
- Paradis S, Sweeney ST, Davis GW. Homeostatic control of presynaptic release is triggered by postsynaptic membrane depolarization. Neuron. 2001;30:737–749. doi: 10.1016/s0896-6273(01)00326-9. [DOI] [PubMed] [Google Scholar]
- Paul MM, Pauli M, Ehmann N, Hallermann S, Sauer M, Kittel RJ, Heckmann M. Bruchpilot and Synaptotagmin collaborate to drive rapid glutamate release and active zone differentiation. Front Cell Neurosci. 2015;9 doi: 10.3389/fncel.2015.00029. [DOI] [PMC free article] [PubMed] [Google Scholar]
- Peled ES, Isacoff EY. Optical quantal analysis of synaptic transmission in wild-type and rab3-mutant Drosophila motor axons. Nat Neurosci. 2011;14:519–526. doi: 10.1038/nn.2767. [DOI] [PMC free article] [PubMed] [Google Scholar]
- Peled ES, Newman ZL, Isacoff EY. Evoked and spontaneous transmission favored by distinct sets of synapses. Curr Biol. 2014;24:484–493. doi: 10.1016/j.cub.2014.01.022. [DOI] [PMC free article] [PubMed] [Google Scholar]
- Pelkey KA, McBain CJ. Differential regulation at functionally divergent release sites along a common axon. Curr Opin Neurobiol. 2007;17:366–373. doi: 10.1016/j.conb.2007.04.008. [DOI] [PubMed] [Google Scholar]
- Petersen SA, Fetter RD, Noordermeer JN, Goodman CS, DiAntonio A. Genetic analysis of glutamate receptors in Drosophila reveals a retrograde signal regulating presynaptic transmitter release. Neuron. 1997;19:1237–1248. doi: 10.1016/s0896-6273(00)80415-8. [DOI] [PubMed] [Google Scholar]
- Reese AL, Kavalali ET. Spontaneous neurotransmission signals through store-driven Ca(2+) transients to maintain synaptic homeostasis. Elife. 2015;4:e09262. doi: 10.7554/eLife.09262. [DOI] [PMC free article] [PubMed] [Google Scholar]
- Reese AL, Kavalali ET. Single synapse evaluation of the postsynaptic NMDA receptors targeted by evoked and spontaneous neurotransmission. Elife. 2016;5:e21170. doi: 10.7554/eLife.21170. [DOI] [PMC free article] [PubMed] [Google Scholar]
- Saitoe M, Schwarz TL, Umbach JA, Gundersen CB, Kidokoro Y. Absence of junctional glutamate receptor clusters in Drosophila mutants lacking spontaneous transmitter release. Science. 2001;293:514–517. doi: 10.1126/science.1061270. [DOI] [PubMed] [Google Scholar]
- Schaefer JE, Worrell JW, Levine RB. Role of intrinsic properties in Drosophila motoneuron recruitment during fictive crawling. J Neurophysiol. 2010;104:1257–1266. doi: 10.1152/jn.00298.2010. [DOI] [PMC free article] [PubMed] [Google Scholar]
- Siegel F, Lohmann C. Probing synaptic function in dendrites with calcium imaging. Exp Neurol. 2013;242:27–32. doi: 10.1016/j.expneurol.2012.02.007. [DOI] [PubMed] [Google Scholar]
- Stewart BA, Atwood HL, Renger JJ, Wang J, Wu CF. Improved stability of Drosophila larval neuromuscular preparations in haemolymph-like physiological solutions. J Comp Physiol A. 1994;175:179–191. doi: 10.1007/BF00215114. [DOI] [PubMed] [Google Scholar]
- Stratton MM, Chao LH, Schulman H, Kuriyan J. Structural studies on the regulation of Ca2+/calmodulin dependent protein kinase II. Curr Opin Struct Biol. 2013;23:292–301. doi: 10.1016/j.sbi.2013.04.002. [DOI] [PMC free article] [PubMed] [Google Scholar]
- Suster ML, Martin JR, Sung C, Robinow S. Targeted expression of tetanus toxin reveals sets of neurons involved in larval locomotion in Drosophila. J Neurobiol. 2003;55:233–246. doi: 10.1002/neu.10202. [DOI] [PubMed] [Google Scholar]
- Sweeney ST, Broadie K, Keane J, Niemann H, O’Kane CJ. Targeted expression of tetanus toxin light chain in Drosophila specifically eliminates synaptic transmission and causes behavioral defects. Neuron. 1995;14:341–351. doi: 10.1016/0896-6273(95)90290-2. [DOI] [PubMed] [Google Scholar]
- Takizawa E, Komatsu A, Tsujimura H. Identification of common excitatory motoneurons in Drosophila melanogaster larvae. Zoolog Sci. 2007;24:504–513. doi: 10.2108/zsj.24.504. [DOI] [PubMed] [Google Scholar]
- Turrigiano G. Homeostatic synaptic plasticity: local and global mechanisms for stabilizing neuronal function. Cold Spring Harb Perspect Biol. 2012;4:a005736. doi: 10.1101/cshperspect.a005736. [DOI] [PMC free article] [PubMed] [Google Scholar]
- Wolf E, Zhao FY, Roberts A. Non-linear summation of excitatory synaptic inputs to small neurones: a case study in spinal motoneurones of the young Xenopus tadpole. J Physiol. 1998;511:871–886. doi: 10.1111/j.1469-7793.1998.871bg.x. [DOI] [PMC free article] [PubMed] [Google Scholar]
- Zucker RS, Regehr WG. Short-Term Synaptic Plasticity. Annu Rev Physiol. 2002;64:355–405. doi: 10.1146/annurev.physiol.64.092501.114547. [DOI] [PubMed] [Google Scholar]
- Zwart MF, Pulver SR, Truman JW, Fushiki A, Cardona A, Landgraf M. Selective Inhibition Mediates the Sequential Recruitment of Motor Pools. Neuron. 2016;91:615–628. doi: 10.1016/j.neuron.2016.06.031. [DOI] [PMC free article] [PubMed] [Google Scholar]
Associated Data
This section collects any data citations, data availability statements, or supplementary materials included in this article.