Abstract
Purpose
To improve velocity–to-noise ratio (VNR) and dynamic velocity range at 4D flow MRI by using dual-velocity encoding (dual-venc) with k-t GRAPPA acceleration.
Materials and Methods
A dual-venc 4D flow MRI sequence with k-t GRAPPA acceleration was developed using a shared reference scan followed by three-directional low- and high-venc scans (TR/TE/FA=6.1ms/3.4ms/15°, temporal/spatial resolution=43.0ms/1.2×1.2×1.2mm3). The high-venc data was used to correct for aliasing in the low-venc data, resulting in a single dataset with the favorable VNR of the low-venc but without velocity aliasing. The sequence was validated at a 3 Tesla MRI Scanner in phantom experiments and applied in 16 volunteers to investigate its feasibility for assessing intracranial hemodynamics (net flow and peak velocity) at the major intracranial vessels. In addition, image quality and image noise was assessed in the in-vivo acquisitions.
Results
All 4D flow MRI scans were acquired successfully with an acquisition time of 20±4min. The shared reference scan reduced the total acquisition time by 12.5% compared to two separate scans. Phantom experiments showed 51.4% reduced noise for dual-venc compared to high-venc and an excellent agreement of velocities (ρ=0.8, p<0.001). The volunteer data showed decreased noise in dual-venc data (54.6% lower) compared to high-venc, and improved image quality, as graded by two observers: less artifacts (P<0.0001), improved vessel conspicuity (P<0.0001), and reduced noise (P<0.0001).
Conclusion
Dual-venc 4D flow MRI exhibits the superior VNR of the low-venc acquisition and reliably incorporates low- and high-velocity fields simultaneously. In-vitro and in-vivo data demonstrate improved flow visualization, image quality and image noise.
Keywords: 4D flow MRI, dual venc, intracranial 4D flow MRI, PC-MRI, k-t GRAPPA
Introduction
4D flow MRI allows for the in-vivo volumetric assessment of 3D cardiovascular blood flow, and has been successfully applied in several studies (1–11). However, current 4D flow MRI techniques to measure blood velocity (v) are based on a single pre-defined velocity sensitivity (venc), which is typically set above the expected maximum velocity. This single-venc acquisition results in either velocity aliasing for unexpected high blood flow velocities (v > venc) or high noise levels for slow flow (v < venc), since velocity noise (σv) is directly proportional to the adjusted venc (σv ~ venc) (12). As a result, previous applications of 4D flow MRI were limited by its inability to fully capture the wide dynamic range of velocities often encountered.
For complete evaluation of cardiac and neurovascular flow, it is desirable to gain quantitative information on both lower and high blood flow velocities simultaneously, which can differ by an order of magnitude even in normal subjects (e.g. slow venous flow on the order of 10 cm/s versus peak systolic atrial velocities of 150 cm/s) (13). To address these limitations, low- and high-venc 4D flow MRI can be performed successively (dual-venc) in two separate acquisitions. The resulting non-aliased high-venc data can then be used for pixel-wise anti-aliasing of the low-venc data. Dual-venc 4D flow MRI could thus provide improved quantification of the entire velocity spectrum.
Previous studies have investigated dual-venc approaches based on multiple subsequent 4D flow MRI acquisitions with two or more venc values and post-processing methods (14–16), or have used five-point balanced flow encoding to reduce noise and aliasing in phase images (17). Alternatively, velocity encoding was varied for acquiring data points during systole or diastole (18). A very early implementation of dual-venc 2D PC-MRI with through-plane velocity encoding, three-point phase contrast imaging, was reported by Lee et al. (12). Another approach by Binter et al. (19) used multipoint velocity encoding with k-t undersampling in combination with Bayesian analysis to map mean and fluctuating velocity for a large dynamic range. This method was validated against 3D particle image velocimetry (20) and was validated in an in vitro flow phantom and tested in the aorta in healthy controls and two patients. In addition, the method was applied to simultaneously acquire arterial and venous blood flow velocities as well as cerebrospinal fluid flow in 2D slices (21). A limitation of this method is the extensive processing time of the Bayes framework for a 3D volume with multiple velocity encodings, which was stated to be about 8 hours per in vivo dataset on a conventional personal computer.
The aim of this study was to develop and test a fully integrated k-t accelerated dual-venc 4D flow MRI sequence (3D volume and 3-directional velocity encoding) with a shared reference scan for the acquisition of both low- and high-venc data; therefore, a single acquisition to achieve the dynamic range of high-venc and the noise of low-venc measurements.
Materials and Methods
Sequence Development
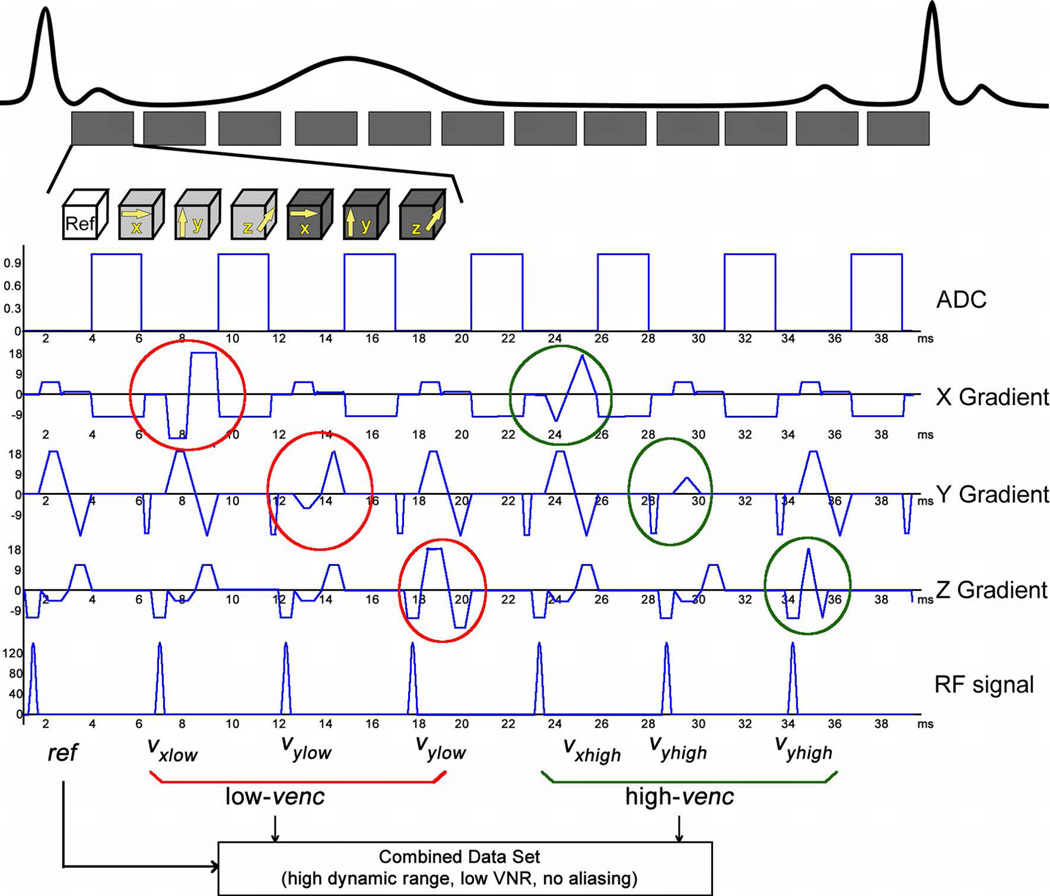
Gradient waveforms for this seven-point velocity encoding scheme were designed following the strategies of Bernstein et al to minimize TE (22). For simplicity, we will henceforth refer to dual-venc 4D flow MRI instead of seven-point velocity encoding. As shown in Figure 1, similar to standard PC-MRI, the first gradient echo was used to measure the common reference MR-signal phase Φ(ref). In the following 6 TRs, velocity encoding gradients were applied along the 3 orthogonal directions (i = x, y, z) with the required change in first moment ΔM1 in each direction for both low- and high-venc. Six sets of phase difference images (three-directional low- and high-venc data) were obtained by subtracting the reference MR-signal phase from the following six flow-sensitive MR-signal phases. To achieve minimum echo time, a “two-sided” velocity encoding strategy was used (22).
Figure 1.
Dual-venc PC-MRI sequence with a shared reference scan (ref) followed by low-venc and high-venc velocity encoding in three orthogonal directions (x, y, and z). A combined data set for each cardiac time frame was reconstructed utilizing the high VNR of the low-venc scan and the high-venc data for anti-aliasing. Note that a total of 7 TRs is needed to acquire one k-space line for dual-venc data compared to 8TRs that would be required for two separate low- and high-venc acquisitions.
Velocity encoding was determined by the duration and amplitudes of bipolar gradients (Gi(ref), Gi(low-venc), Gi(high-venc)) in the three orthogonal directions (i = x, y, z) and the corresponding first-order gradient moments. For a desired total change in the first-gradient moment ΔM1i(low-venc) and with symmetrically divided two-sided velocity encoding for the low-venc acquisition, the first-gradient moments for the reference and flow-sensitive low-venc scans are −ΔM1i(low-venc)/2 and +ΔM1i(low-venc)/2, respectively with:
| (1) |
where γ is the gyromagnetic ratio. To reduce acquisition time, the reference scan was shared for high-venc data acquisition. The first-order gradient moments were efficiently distributed between the reference (M1i(ref), i = x, y, z), low-venc (M1i(low)), and high-venc (M1i(high)) scans based on the following boundary conditions:
| (2) |
| (3) |
As a result, the first-gradient moment difference for the high-venc encoding gradients can be calculated as:
| (4) |
| (5) |
Blood flow velocities vi,j were then reconstructed by subtracting the reference phase Φ(ref) from the following 6 flow-sensitive phases Φi(j):
| (6) |
where j = low, high.
Since the low-venc acquisition requires higher first-order gradient moments and thus longer TE, the gradient waveforms were optimized based on the low-venc acquisition and the same timing was used for the high-venc gradient waveforms.
Acceleration of the dual-venc 4D flow MRI sequence was achieved with the 'PEAK-GRAPPA' technique - an extension of k-t GRAPPA (23,24). Briefly, k-t GRAPPA is characterized by a uniform reconstruction kernel geometry composing a smallest cell within a ky-kz-t data undersampling pattern. The kernel extends over k-t space and consists of several acquired source points and missing target points. Kernel size and geometry determine which data is used for coil weight estimation, which then are used to fit the missing lines in the undersampled k-space. In combination with temporal averaging of coil weights, it has been shown that this approach leads to superior results compared to conventional k-t GRAPPA (25). The PEAK algorithm was integrated into the scanner's reconstruction workflow. A previous study (26) evaluated accuracy of net flow and peak velocity in 4D flow MRI. The results showed that an optimal acceleration factor was R=5 with only minimal over- or underestimation of peak velocity or net flow.
Dual-venc Phase-Contrast Reconstruction
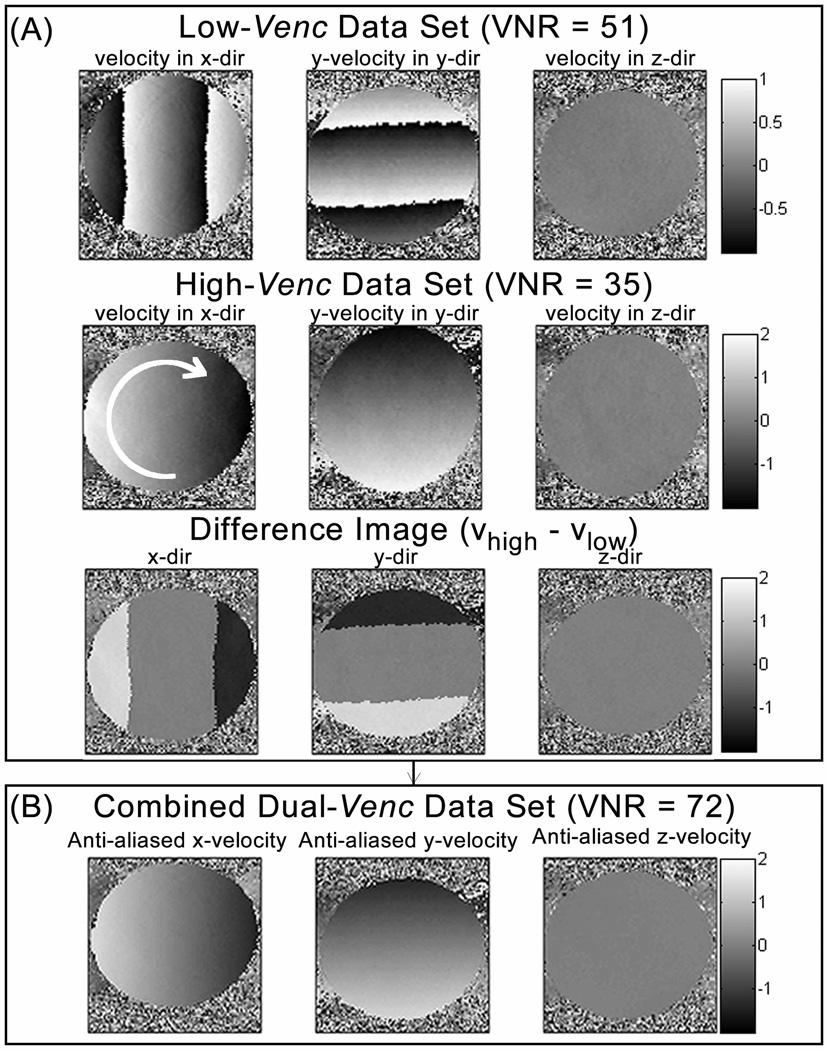
Background-phase offsets were corrected for the low- and high-venc acquisitions using the gradient’s Maxwell terms, which were calculated online and corrected during image reconstruction (27). Subsequently, eddy-current correction was performed independently for the low- and high-venc acquisitions (28). The high-venc data was corrected for velocity aliasing ensuring correct velocity values. The fully automated velocity unwrappping is based on the assumption that adjacent velocities in temporal or slice direction should not differ by more than venc (29). In the following step, the dual-venc data was reconstructed by using the corrected high-venc scan as an estimator for regional velocities to correct for velocity aliasing (Figure 2) in the low-venc data, similar to strategies for the 3-point approach by Lee et al. (12) or the 5-point approach by Johnson et al. (17). High- vs. low-venc phase difference images were used to estimate the number of phase wraps for each velocity direction i = x, y and z. The number of phase wraps was determined using thresholds. Voxels with single and double aliasing would be above thresh1= low-venc * 1.6 and below thresh2 = low-venc * 2.4 and twice the adjusted low-venc was added or subtracted to the aliased voxel depending on the sign of Di. Triple and four times aliased voxels would be above thresh3 = low-venc * 3.2 and below thresh4== low-venc * 4.8 and four times the adjusted low-venc was added or subtracted to the low-venc voxel.
| (7) |
Figure 2.
Dual-venc phase contrast reconstruction using the low-venc scan (top row in (A)) as basis image and correcting the aliased voxels by comparing with the high-venc scan (second row in (A)) using a difference map (bottom row in (A)) and thresholds (B) to determine number of wrap arounds in the low-venc data. The resulting combined dual-venc data set without remaining aliasing artifact is shown in (C). The arrow in the image of the high-venc acquisition (A, second row) indicates the direction of rotation.
We chose thresholds in dependence of the venc within a “soft-margin” of ±20% of the factor to account for voxels within the limits of noise in the high-venc. All reconstructions were performed under the assumption that there was no more than four times velocity aliasing.
Phantom Experiments
The dual-venc MRI sequence with 3-directional velocity encoding (TR/TE/FA = 5ms/2.7ms/15°, temporal resolution = 70ms, low-venc/high-venc = 100/200 cm/s) was tested with a rotation phantom on a 3T MRI scanner (MAGNETOM Skyra, Siemens Medical Systems, Erlangen, Germany). In addition to the dual-venc encoding, two standard 2D PC-MRI scans were performed for comparison (scan 1: venc = 100 cm/s, TR/TE/FA = 5ms / 2.7ms / 15°, temporal resolution = 40 ms; scan 2: venc = 200 cm/s, TR/TE/FA = 4.8ms / 2.4 ms / 15°, temporal resolution = 38.4 ms). All data were acquired with identical spatial resolution of 1.6 × 1.6 × 8 mm3. A scan time reduction of 12.5% compared to two separate acquisitions was expected.
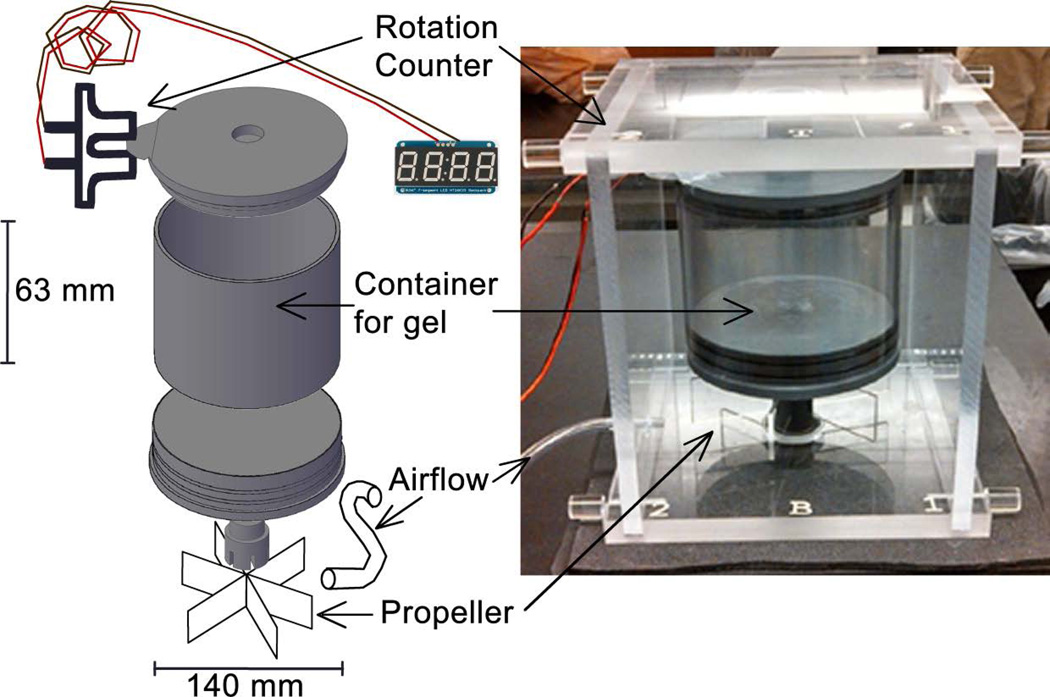
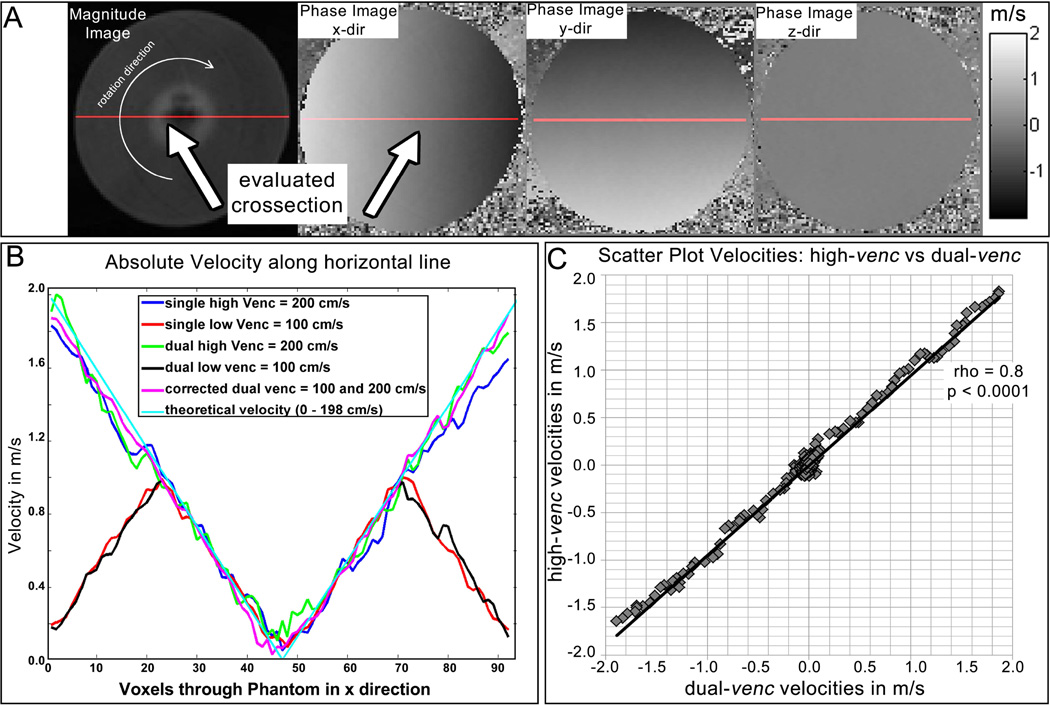
The rotation phantom design and dimensions are illustrated in Figure 3. The phantom consisted of a canister that rotated at various angular speeds using pressurized air and a fan blade rotation mechanism. The container was filled with a contrast-enhanced agar-gelatin mixture and rotations were counted with a photomicrosensor mounted to the upper rim of the container. The rotation speed for this experiment was set to 4.5 revolution per second (rev/s), resulting in velocities ranging from 0 – 200 cm/s depending on distance from the center of the phantom (cyan line in Figure 5B).
Figure 3.
The rotation phantom consists of a container filled with contrast enhanced media. The container is driven by an air coupled propeller and rotations are counted with a photomicrosensor. Velocities varied linearly from 0 cm/s at the center to a maximum speed of 200 cm/s.
Velocities were compared between high-, low-, and dual-venc acquisitions along a horizontal cross section through the center of the phantom. Velocity noise was estimated using the standard deviation of absolute velocities (σv = std (|v|)) in successive time frames over the entire rotation phantom and compared between the dual-venc and the standard 2D PC-MRI scans.
Healthy Volunteer Study
The study was approved by our Institutional Review Board, and informed consent was obtained from all subjects. All scans were performed using a 3T MRI system (MAGNETOM Skyra). Each subject underwent k-t accelerated dual-venc 4D flow MRI using ECG gating with the following scan parameters: low-/high-venc combination (44/100 cm/s (8 cases), 48/110 cm/s (5 cases), and 60/130 cm/s (3 cases)), k-t GRAPPA acceleration with R = 5 and 20 × 8 ky-kz reference lines, TR/TE/FA = 6.1 ± 0.1ms / 3.4 ± 0.1ms / 15°, temporal/spatial resolution = 43.0 ± 0.5 ms / 1.2 × 1.2 × 1.2 mm3. The average thickness of the 3D slab was 5.6 ± 3.7 mm, covering the Circle of Willis. The acquired number of cardiac time frames were dependent on the heart rate.
In-vivo Dual-venc 4D Flow Processing
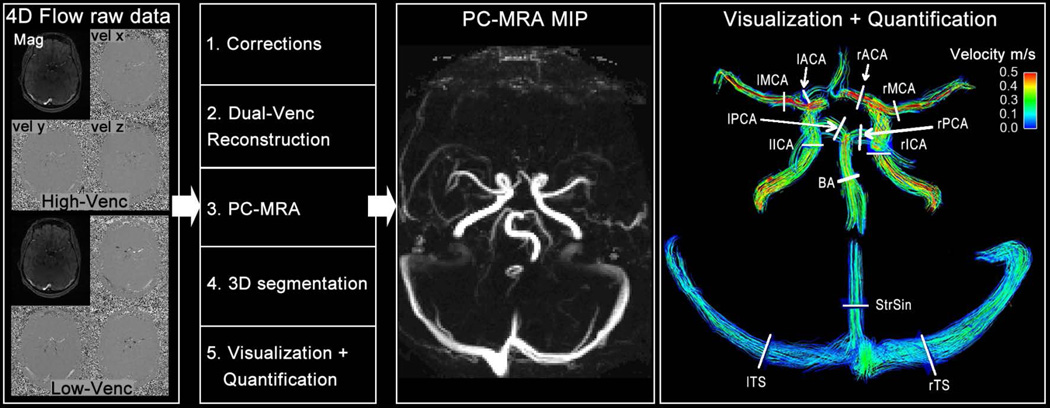
Data analysis for all 16 subjects included noise masking, velocity anti-aliasing, and corrections for Maxwell terms and eddy currents (Matlab, The Mathworks, Boston, MA, USA) (27,28) as illustrated in Figure 4. The dual-venc data set was reconstructed from the preprocessed low and high-venc data as described earlier and shown in Figure 2. In addition, a PC-MR angiogram (PC-MRA, Figure 4) was calculated for all 4D flow MRI data (low-venc, high-venc, dual-venc) using the piecewise pseudo complex difference:
| (8) |
where Mag represents the magnitude and |v| the absolute velocity (8). From all three calculated 3D PC-MRA data sets the maximum intensity projections (MIP) were generated (Figure 4). The low-venc 3D PC-MRA was then used as basis for the segmentation of the main intracranial vessels (MIMICS, Materialise, Leuven, Belgium). Both the 3D segmentation and 4D flow MRI data were loaded into a 3D flow visualization package (EnSight, CEI, Apex, NC, USA). The 3D segmentation was employed to restrict velocities to the segmented arterial and venous vessel boundaries for 3D flow visualization and quantification (Figure 4). Color-coded peak systolic 3D streamlines emitted from the entire segmented volume were used to visualize arterial and venous cerebrovascular blood flow patterns.
Figure 4.
Magnitude and phase raw data of the low- and high-venc (left panel) is used to pre-process, reconstruct the dual-venc data set (Figure 3), calculate the PC-MRAs for all three acquisitions: low-, high- and dual-venc. The low-venc PC-MRA is used to segment the angiogram (MIMICS, Materialize, Belgium). From the PC-MRAs, the maximum intensity projection (MIP) is calculated along all spatial directions (second panel from right depict an axial MIP), which is used for qualitative grading. The segmented angiogram from the low-venc acquisition is used to mask velocities in all three data sets in order to get precise quantification of peak velocity and net flow at all defined locations (right panel): left and right internal carotid artery (lICA + rICA), left and right middle cerebral artery (lMCA + rMCA), left and right anterior cerebral artery (lACA + rACA), left and right posterior cerebral artery (lPCA + rPCA), basilar artery (BA), left and right transverse sinus (lTS + rTS) and straight sinus. The angiogram mask is also used to restrict the streamlines to the vessel boundaries for visualization of intracranial blood flow (right panel depicts streamlines at peak systole).
Data Analysis
To quantitatively assess image quality, velocity noise was compared between the high-venc, low-venc and reconstructed dual-venc 4D flow MRI data by calculating the voxel-wise standard deviation of velocity over time for each direction in a static region of the brain. The regions of interest for static tissue were drawn manually for each data set.
In addition, a semi-quantitative image quality grading of the derived 3D PC-MRA data was independently performed by one experienced radiologist (IM, over 5 years of training) and one recent medical graduate (OR), both blinded to subject identity and scan information as well as to each other's results using the MIP of the 3D PC-MRA in axial and coronal views. The level of noise and artifact was separately graded on a 3-point scale (mild = 0, moderate = 1, severe = 2), as well as the ability to depict the following vessels (0 = not present, 1 = partly/incomplete, 2 = clear/complete): right and left internal carotid arteries (rICA, lICA), right and left middle cerebral arteries (rMCA, lMCA), right and left anterior cerebral arteries (rACA, lACA), right and left posterior cerebral arteries (rPCA, lPCA), right and left vertebral arteries (rVA, lVA), basilar artery (BA), right and left transverse sinus (rTS, rTS) as well as the straight and superior sagittal sinus (StrSin, SagSin).
Further, regional flow quantification (net flow and peak velocity) was performed in all major intracranial arteries and veins (rICA, lICA, rMCA, lMCA, rACA, lACA, rVA, lVA, BA) and veins (rTS, lTS, StrSin, SagSin) using analysis planes perpendicular to the vessel as illustrated on the right of Figure 4 (EnSight, CEI, Apex, NC, USA). Note that the same segmented vasculature mask was used for the quantification of the low-, high- and dual-venc data.
Statistics
Data were tested for normal distribution using the Schapiro-Wilk test. All continuous values are reported with mean ± standard deviation unless specified differently. Pearson correlation was performed to compare the net flow and peak velocity between high-venc and dual-venc and between low-venc and dual-venc. The correlation was considered significant with a P value < 0.05 and correlation quality is expressed with correlation coefficient R. In addition, Bland-Altman analysis was performed for peak velocity and net flow. 3D PC-MRA image quality grades were compared between the three data sets (high-, low- and dual-venc) using the Wilcoxon rank sum test. A grading result was considered significantly different between high-, low- and dual-venc for a P < 0.05. The inter-rater agreement was tested with linearly weighted Cohen’s kappa statistics, and significance of quality differences between low-, high- and dual-venc was tested using the Wilcoxon rank sum test. The data analysis for this paper was generated using the Real Statistics Resource Pack software (Release 4.3, Copyright (2013 – 2015) Charles Zaiontz. www.real-statistics.com).
Results
Phantom Experiments
Dual-venc and standard 2D PC-MRI data were successfully acquired as shown in Figure 5 by equivalent velocities for high- and dual-venc acquisitions along a cross section of the axial cut-plane of the rotating phantom. The use of a single common reference scan reduced the total acquisition time by 12.5% compared to running two separate scans. A total of 7 TRs was needed to acquire one k-space line for dual-venc data compared to 8 TRs for two separate low and high-venc acquisitions. Dual-venc reconstruction was successfully implemented as shown in Figure 5 B and correlation analysis shown in Figure 5 C. As expected, the dual-venc sequence showed 51.4% lower noise than high-venc. Rotation phantom velocities for high- and dual-venc acquisitions were strongly correlated (2-tailed Spearman correlation, ρ= 0.8, P < 0.001).
Figure 5.
A. Magnitude and corresponding phase difference images of the rotation phantom in an axial cut plane. The cross section through the center of the phantom used for velocity quantification is shown by the red line. The arrow in the magnitude image indicates the direction of rotation. B. measured absolute along the cross section. The blue and green curves represent the high-venc scans measured with a venc of 200 cm/s, and the red and black lines represent the low-venc scans with aliasing at the outer voxels (venc = 100 cm/s). The magenta line represents the combined data set (dual-venc corrected scan) showing the result after dual-venc reconstruction. The cyan line corresponds to the calculated velocity assuming 198 cm/s at the outer diameter at 4.5 rev/s. C. Correlation of absolute velocities along the horizontal line for dual- vs high-venc shows a significant Spearman rank sum correlation of ρ = 0.8, indicating successful velocity anti-aliasing by dual-venc reconstruction.
Healthy Volunteer Studies
k-t accelerated dual-venc 4D flow MRI data was successfully acquired in all 16 subjects (n = 16, age = 36 ± 12, 7 females) with an average total acquisition time (TA) of 20.3 ± 4.3 min. k-t GRAPPA reconstruction was performed online directly upon completion of data acquisition and took on average 13.0 ± 5.5 min. An average of 16.5 ± 1.8 cardiac time frames (ranging from 13 to 20) were acquired, depending on the subject’s heart rate. No motion artefacts from head movement were noticed.
Qualitative Results of the In-Vivo Acquisition
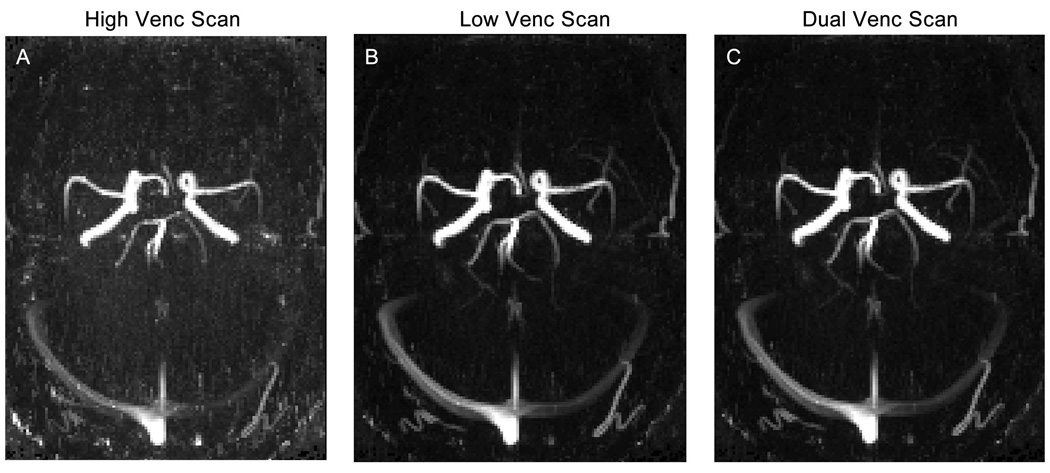
Figure 6 shows results of in-vivo dual-venc 4D flow MRI in a healthy volunteer. More coherent and compact streamlines (Figure 6 C as well as zoomed in panels D, E, F, G and H) for dual-venc compared to high-venc can clearly be appreciated (Figure 6 A vs. 6 C). In addition, no velocity aliasing artifacts in streamline visualization compared to low-venc were observed (Figure 6 B vs. C, and F). In addition, 3D PC-MRA MIPs for all three reconstructions are shown (Figure 7 A–C). As expected, the low-venc and dual-venc data demonstrated less noise, fewer artifacts and superior vessel depiction.
Figure 6.
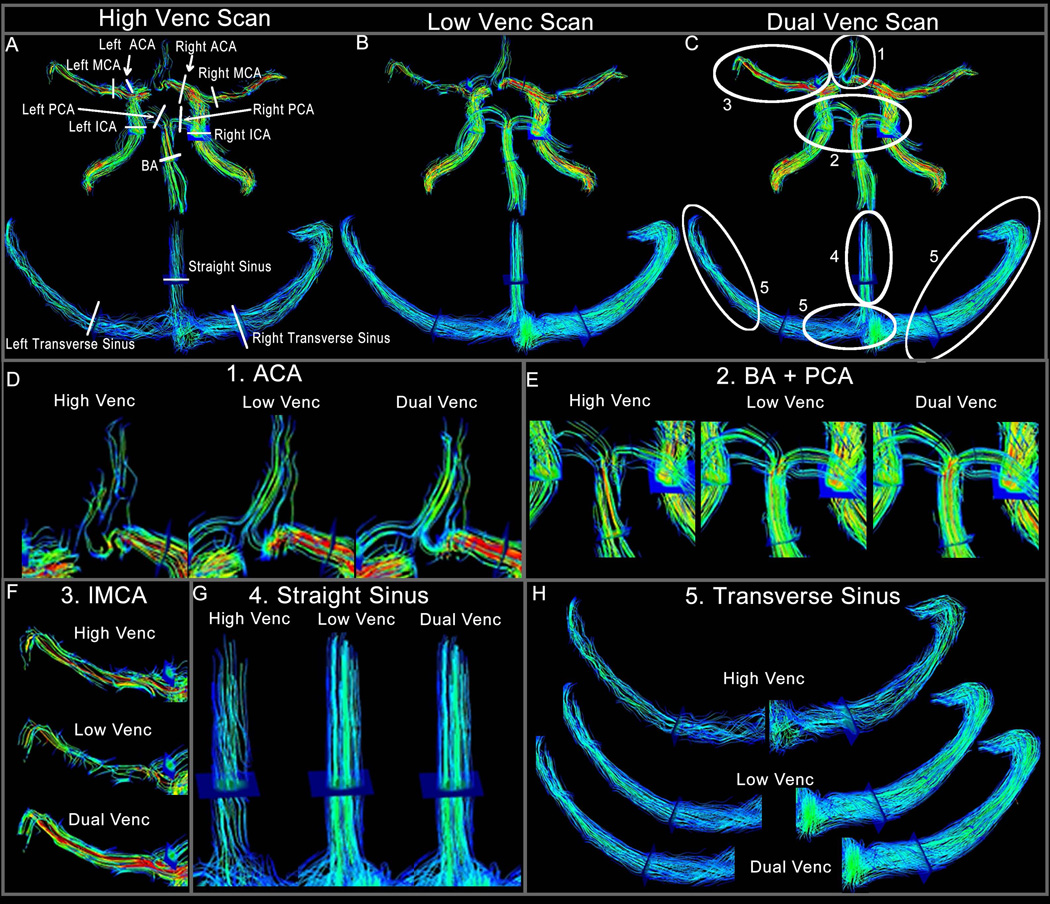
Panels A–C show an example of one volunteer with 3D streamlines emitted from the entire angiogram volume for all three 4D flow scans (A high-venc, B low-venc and C dual-venc). The plane locations for flow quantification and quality assessment are illustrated in A. Those planes were also used to determine net flow and peak velocity. In panels D–H the areas in which dual-venc 4D-flow MRI provided superior flow visualization are zoomed. Panel D shows more as well as more coherent streamlines for the ACA. Panel E shows the BA and PCA, panel F shows disrupted streamlines in the low-venc, which are corrected in the dual-venc and panels G and E show examples of the slow flow venous system.
Figure 7.
Example of the PC-MRA MIP for one volunteer, in A high-venc, B low-venc and C dual-venc.
These observations were confirmed by qualitative grading as summarized in Table 1. The grading results of the two observers show that dual-venc 4D flow MRI expressed a similar degree of artifacts (Plow_vs_dual = 0.1875, Phigh_vs_dual < 0.0001, Phigh_vs_low = 0.0067) as well as the ability to depict vessels (Plow_vs_dual = 0.3750, Phigh_vs_dual < 0.0001, Phigh_vs_low < 0.0001) as the low-venc data, but was superior to the high-venc data, and expressed the least amount of noise (Plow_vs_dual = 0.0156, Phigh_vs_dual < 0.0001, Phigh_vs_low < 0.0001) compared to low- and high-venc data.
Table 1.
Results of Quality Grading for Vessel Depiction (summed up for all 15 locations, 0 = not present, 1 = partly/incomplete, 2 = clear/complete), Noise (mild = 0, moderate = 1, severe = 2) and Artifact impression (mild = 0, moderate = 1, severe = 2).
| Vessel Depiction | Noise Impression | Artifact Impression | |||||||
|---|---|---|---|---|---|---|---|---|---|
| High-Venc | Low-Venc | Dual-Venc | High-Venc | Low-Venc | Dual-Venc | High-Venc | Low-Venc | Dual-Venc | |
| Mean ± Std | 20.2 ± 3.2 | 27.0 ± 1.6 | 27.2 ± 1.5 | 1.6 ± 1.5 | 0.5 ± 0.5 | 0.3 ± 0.3 | 0.8 ± 1 | 0.3 ± 0 | 0.1 ± 0 |
| median | 21 | 27 | 27 | 1.5 | 0.5 | 0.5 | 1 | 0 | 0 |
| Plow_vs_dual | 0.3750 | 0.0156 | 0.1875 | ||||||
| Phigh_vs_dual | < 0.0001 | < 0.0001 | < 0.0001 | ||||||
| Phigh_vs_low | < 0.0001 | < 0.0001 | 0.0067 | ||||||
The inter-rater agreement (linearly weighted Cohen’s Kappa) for noise was fair (κ = 0.352), for artifacts moderate (κ = 0.56) and for overall vessel depiction moderate (κ = 0.49).
Cerebrovascular Flow Quantification
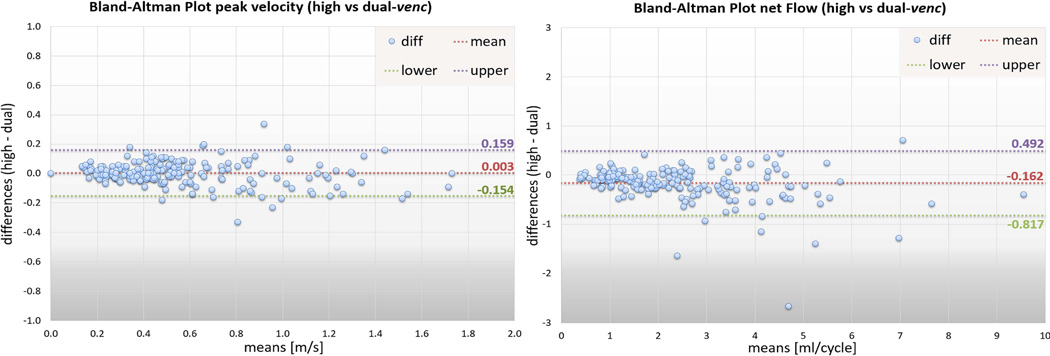
Regional flow quantification demonstrated similar peak velocity at all arterial locations (P = 0.952) and lower peak velocities in the dual-venc acquisition at all venous locations (P = 0.012) when compared to high-venc. Pearson correlation analysis showed that peak velocities in the arteries derived from the dual-venc data correlated well with the high-venc data, but not as well with the low-venc data (Figure 8 A, RHV = 0.95, PHV-DV < 0.0001, RLV = 0.72, PLV-DV < 0.0001). Venous peak velocities resulted in higher correlation coefficients for low- versus dual-venc (Figure 8 B). Bland-Altman analysis (Figure 9, left panel) showed excellent agreement between high- and dual-venc acquisition (offset = 0.003 m/s, limits of agreement = [+0.16 −0.15].
Figure 8.
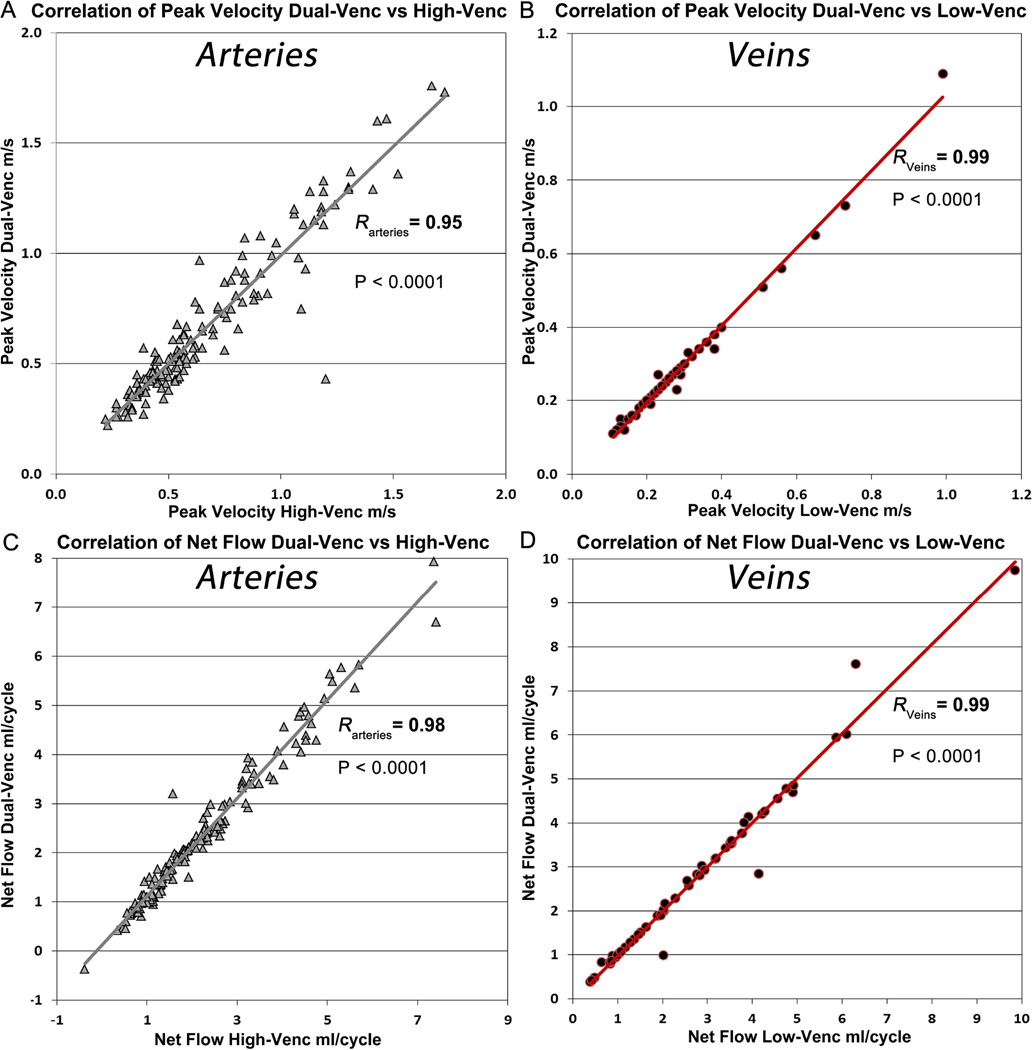
The grey line depicts the correlation of peak velocity of dual-venc with high-venc (A) and the red line the correlation of dual-venc with low venc (B). (C) Correlation of net flow of dual-venc vs high-venc depicted with grey line. (D) Correlation of net flow dual-venc vs low-venc depicted with red line. R = Pearson correlation coefficient of the correlation.
Figure 9.
Bland-Altman plots for peak velocity values in all vessels (left panel) as well as net flow values in all vessels (right panel) between the high- and dual-venc acquisitions.
Net flow analysis revealed significantly higher values for the arterial (P < 0.0001) and venous system (median netFlowvenous_dual = 2.43 ml/cycle, median netFlowvenous_high = 2.27 ml/cycle, P < 0.0001) for dual-venc compared with high-venc data (Supporting Figures S1 and S2). Both low- and high-venc derived net flow showed significant correlation to the dual-venc data. However, the high-venc derived net flow in arterial vessels showed better correlation to the dual-venc (RHV = 0.98, RLV=0.87, PHV-DV = PLV-DV < 0.0001, Figure 8 C). Net flow increased in venous areas in the low-venc data compared to the high-venc. Therefore the correlation dual- vs low-venc data was improved compared to the high-venc data (RLV = 0.99, RHV = 0.97, PHV-DV=PLV-DV < 0.0001, Figure 8C and D). The individual differences for all vessels between the high- versus dual-venc scan for peak velocity and net flow are shown in Supporting Figures S1 and S2 for the interested reader. Bland-Altman analysis (Figure 9, right panel) of high- versus dual-venc confirmed the underestimation of net flow of the high-venc acquisition with an offset of −0.162 ml/cycle and limits of agreement at +0.49 and −0.82 ml/cycle.
Velocity noise in high-venc data was 0.088 ± 0.024 m/s (7.74% of adjusted high-venc, range = 0.058 – 0.148 m/s) compared to the low-venc data with 0.040 ± 0.011 m/s (7.91% of adjusted low-venc, range = 0.026 – 0.069 m/s). This resulted in a noise for the dual-venc 4D flow MRI data of 3.51% of adjusted high-venc (0.040 ± 0.011 m/s). This corresponds to noise reduction of 54.6%, which is close to the expected theoretical noise reduction of 55.8% calculated from the venc-ratio.
Discussion
A fully integrated dual-venc 4D flow MRI sequence was developed and compared with single-venc 4D flow MRI in a rotation phantom experiment and in a healthy volunteer feasibility study. VNR could be increased by the ratio of high- to low-venc by using the high-venc to correct velocity wrapping in the low-venc images. Noise evaluation in the volunteers also corresponded with the high/low-venc ratio. This resulted in excellent correlation of net flow and peak velocity compared to the high-venc scan in arteries and the low-venc scan in veins. The implemented PEAK-GRAPPA acceleration allowed image acquisition within a time comparable to standard single-venc 4D flow MRI.
Increased VNR resulted in improved quality of the calculated PC-MRA, which could be confirmed by two blinded observers. Increased net flow for dual-venc versus high-venc in venous vessels reflects the improved dynamic velocity range of the dual-venc acquisition. The observed difference of net flow between high-venc and low/dual-venc can be explained with the higher noise in the high-venc scan. Slow velocities contributing to net flow especially in veins are not measured with the high-venc scan. Variation in peak velocity can be expected to be as high as velocity noise in the range of 8% of venc, which is 8–10 cm/s depending on adjusted venc (100, 110 and 130 cm/s). Differences between low- and dual-venc can be explained with the velocity aliasing in the low-venc data.
This dual-venc 4D flow MRI implementation is very similar to the three-point 2D PC-MRI implementation by Lee et al. (12) and shows similar results for VNR gain. Our implementation, however, acquires a time-resolved 3D volume slab and applies velocity encoding in three spatial directions representing the seven-point encoding strategy. As in the three-point implementation, there is an acquisition time increase compared to single-venc due to the additional number of phase encoding gradients. However, with the usage of k-t GRAPPA acceleration of R = 5 we could achieve similar scan times as with single velocity encoding.
In the study by Nett et al, two separately acquired single-venc PC-VIPR (vastly undersampled isotropic-voxel radial projection imaging) scans were combined in a post-processing step and studied with both phantom and healthy control experiments (14). The phantom results showed significant improvement of VNR efficiency by a factor of 2.88 with only 5% increase in scan time. Additionally, the authors demonstrated successful unwrapping of the low-venc when using 12% of the acquired high-venc data. In their in-vivo experiments, a reasonable compromise between accuracy and scan time was found when combining a low-venc scan of 80 cm/s with 25% of a high-venc scan of 160 cm/s. For a theoretical full implementation of the presented method this would mean 25% longer scan time than for a single-venc PC-VIPR acquisition, which is similar in regards of scan time to our k-t GRAPPA accelerated fully implemented dual-venc 4D flow MRI sequence when compared to current single-venc implementations. The advantage of retrospectively combining two single-venc acquisitions is that a better temporal resolution can be achieved than with a fully implemented method. The disadvantage is that one must correct for bulk motion, varying heart beats and variation of temporal resolutions due to longer echo times for the stronger gradients of the low-venc scan. However, reducing the amount of acquired high-venc data could also benefit our fully implemented dual-venc method and even further reduce scan time in addition to k-t GRAPPA acceleration.
Similar to the study by Nett et al (14), the multi-venc study by Ha et al. (15) utilized post-processing methods to combine separately acquired 4D flow acquisitions with multiple vencs. In this study, the high-venc scan was not used to unwrap the low-venc scan, but so-called valid voxels from each scan were combined resulting in a multi-venc overlapped dataset. The combination of the datasets makes estimation of velocity noise impossible, since noise is typically determined in static tissue, which is in the low signal range and thus taken from the scan with the lowest venc. However, additional noise is introduced into the dataset if voxels are assembled from all measurements; the velocity noise estimation from the static regions therefore is invalid. In addition to the aforementioned issues with using separate acquisitions, this imposes unpredictable noise situations in areas of high flow. Scan time depends on the number of separately acquired 4D flow acquisitions, and therefore, would be at least 12.5% longer than the fully implemented dual-venc acquisition for two acquired vencs.
The five-point encoding strategy introduced by Johnson et al (17) also using PC-VIPR reported a 63% increase in VNR (corresponding to a 39% noise reduction compared to 55% in our implementation) with minimal 1% increase in scan time when acquired with acceleration. This strategy involved the addition of a flow-compensated measurement to four-point encoding. A velocity estimate is determined from all five points and velocity is determined using the four non-compensated measurements. The phase gets unwrapped before the velocity is computed by using the velocity estimate. Velocity noise is similar to the standard four-point encoding; however, resulting velocities are automatically unwrapped. In this method, the gain in dynamic range cannot be adjusted as it can be done with a true dual-venc implementation. Because the noise reduction is proportional to the two adjusted vencs in the fully implemented dual-venc approach, the gain of VNR in the five-point encoding strategy is lower.
For the five-point implementation by Johnson et al. (17) and for the post-processsing dual-venc study by Nett et al. (14) PC-VIPR was used to acquire 4D flow MRI data. VIPR is a high speed 4D flow MRI method and uses radial k-space sampling evenly spaced through a spherical volume each intersecting the origin of k-space. PC-VIPR allows higher volume coverage and spatial resolution as well as faster sampling of k-space. However, radial sampling methods can often introduce streak artefacts, because of the difficult handling of k-space trajectory errors. The advantage of using radial acquisition is that it has different spatial aliasing and artifact behavior than Cartesian sampling (streak artifacts instead of spatial aliasing and wrapping), which allows for highly undersampled acquisitions as it is done in PC-VIPR. Another advantage is more flexible temporal view sharing since each line goes through central k-space. PEAK-GRAPPA on the other hand is easier to implement and applied for Cartesian k-space acquisition schemes. Both methods have been extensively validated. However, a thorough comparison of the methods in regards of flow quantification is still outstanding.
With Fourier velocity-encoding (FVE), a wide range of velocities can be encoded (30). With FVE the distribution of velocities within a pixel can be measured, rather than only the weighted average. In FVE, a series of e.g. 8 or 16 values of flow encoding steps is used and separated by constant increment of the first moment ΔM1. The resulting hybrid spatial-velocity k-space is reconstructed with a discrete Fourier transform instead of a phase difference method. This yields a set of images for each pixel sensitive to velocity within a specific range. FVE has the advantage that by examining the zero velocity image the stationary tissue contribution to the signal for each pixel can be measured. However, in order to achieve precise velocity information within a reasonable scan time, there is a trade-off between spatial resolution, number of encoded spatial dimensions, or temporal resolution. The acquisition time penalty is the reason why FVE has found most applications with 1D pencil beam excitation imaging (31). Although it may be utilized to assess flow in the coronary arteries (32) which is intrinsically fast, it does not allow measurement of three-dimensional flow in a 3D volume. Wise et al (33) combined FVE with sparse sampling and a Bayesian technique of probability analysis, which allows sparse sampling and thus fast acquisition times. Binter et al used multipoint velocity encoding and combined it with the Bayesian approach with k-t undersampling methods, which allows mapping turbulence (19) within a reasonable scan time. This method provides an increase in accuracy and dynamic range, but its extensive processing time of the Bayes framework of (8 hours for a full aortic 3D dataset) is a limiting factor for in-vivo studies. One intracranial in-vivo application of Bayesian Multipoint Velocity-encoded MRI was reported to simultaneously quantify flow in the arterial and venous systems as well as CSF flow (21). However, this study employed only 2D slices and through-plane velocity encoding at pre-specified locations. Acquisition time was similar to standard 2D PC MR imaging; however, no noise comparison was provided.
In the variable velocity encoding strategy (4D-vPC) introduced by Swan et al (34) and extended in 3D by Nilsson et al (18), the venc is varied for all three directions over the cardiac cycle. The approach uses a standard balanced four-point velocity encoding scheme, but the bipolar gradient strengths were recalculated to correspond to a predefined venc in each heart phase while keeping the slope of the bipolar gradient pair constant. The velocity information in the 4D-vPC sequence is retrospectively corrected for venc variation after the acquisition. The acquisition time is similar to a standard four-point acquisition scheme. Noise estimation was performed in a rotating phantom and was similar to the noise of a standard four-point strategy with a fixed venc of the highest adjusted venc of the 4D-vPC. As expected, the in-vivo noise ratios showed large variations. However, when looking at streamline visualization, a clearer identification of flow patterns could be achieved during diastole compared to standard four-point encoding. This implementation of variable venc requires prior information of temporal velocity variation and length of systole. In contrast to a fully implemented dual-venc sequence, both high and low velocities occurring during systole cannot be captured and thus low flow remains corrupted by noise.
A limitation of the dual-venc 4D flow MRI implementation presented here is that it requires prior knowledge of the highest potentially occurring velocity to adapt the high-venc accordingly and avoid velocity aliasing. However, the high-venc can be adjusted more flexibly than for the standard single-venc acquisition, since VNR is determined by the low-venc acquisition. The current implementation requires 7 TRs for both low- and high-venc data acquisitions, which results in 75% longer scan time than a single-venc acquisition as well as lower temporal resolution assuming the same number of k-space lines per cardiac cycle are used. These are limitations of the methods and can be an advantage or disadvantage depending on the application. For example, the resulting scan time would actually be shorter in applications where two 4D flow MRI scans at low- and high-venc are typically acquired, such as in the liver or brain, where both venous and arterial flow are of interest. Furthermore, for applications where only a single 4D flow MRI acquisition is typically performed, the gain in VNR and velocity range may be more important than a shorter scan time: for example, when investigating patients with aortic stenosis. A smaller field of view (smaller imaging volume) could also be offset by high spatial resolution and shorter scan times, which would be feasible in a limited volume of interest e.g. intracranial aneurysm. In addition, due to the low pulsatility (in comparison to the thoracic aorta), intracranial applications of dual-venc with lower temporal resolution seem feasible.
Another limitation of the implementation using the shared reference scan is the reduced temporal resolution. Typical 4D flow MRI studies in the brain as well as in the body use a temporal resolution of 40ms. We kept the temporal resolution in the similar range and used PEAK-GRAPPA to achieve similar scan times than for a single-venc acquisition. In fact, Bammer et al. (35) studied the effect of temporal resolution on blood flow quantification in the brain and demonstrated that 4D flow MRI is feasible for the measurement and visualization of blood flow in the major intracranial vessels with a required temporal resolution of <65ms.
Velocity noise was estimated using standard deviation over time to account for the spatial variation of image noise as a result of the k-t parallel imaging. The accurate estimation of regional noise would have required the acquisition of additional 'noise only' data (by setting the flip angle to zero), which could not be performed in the framework of our already lengthy imaging protocols. In addition, we performed a visual grading of image quality by two blinded and independent radiologists, which provided another measure of objectivity.
The inter-rater qualitative image quality grading agreement was only fair to moderate, indicating differences in the raters’ definition of a high quality exam, which was probably influenced by differences in observer experience. The more experienced observer consistently rated image quality (superior vs inferior) to the less experienced observer. Despite the suboptimal agreement, both an experienced and inexperienced observer agreed that phase contrast angiograms from dual- and low-venc acquisitions were superior to the high-venc.
It should be noted that a more equitable comparison of single-venc versus dual-venc would include two successive high-venc acquisitions and averaging. As a result, acquisition time would be 12.5% longer than for dual-venc 4D flow MRI, but result in a SNR gain of 144%. For dual-venc 4D flow MRI, the SNR gain is proportional to venc and thus higher than averaging two serial scans (depending on the chosen low-/high-venc combination). Furthermore, since each individual high-venc acquisition cannot capture slow velocities below or at the noise level, these velocities can also not be recovered by averaging several high-venc acquisitions.
Further investigation of the dual-venc acquisition needs to be performed in future studies as the maximum VNR achievable remains limited by various factors. Specifically, as the low-venc is lowered, unwrapping becomes more sensitive to velocity noise in the high-venc acquisition and results in phase unwrapping errors when the high-venc image has errors from noise. In addition, a lot of data are omitted by not using the high-venc scan for any other purpose than unwrapping and there may be other information in the data we are not using for this presented approach. Furthermore, there are a couple of limitations in study design such as the small cohort size with only healthy volunteers for this feasibility study as well as the lack of an external validation study. We also did not acquire additional separate single-venc acquisitions to directly compare dual- with single-venc 4D flow MRI due to scan time limitations.
In conclusion, this study has elucidated the importance of dual velocity encoding to improve the velocity-to-noise ratio as well as quantification of fast arterial and slow venous flow with a single 4D flow MRI acquisition in the brain. The findings of this feasibility study show that k-t GRAPPA accelerated dual-venc 4D flow MRI can provide improved visualization and quantification of venous and arterial hemodynamics across a wide range of the velocity spectrum. Velocity noise was significantly reduced compared to standard single-venc implementations. Further work includes integration of the phase-unwrapping algorithms to the inline image reconstruction pipeline and undersampling methods for the high-venc portion. The optimized dual-venc 4D flow MRI sequence can be employed for improved measurement of in-vivo blood flow and may be particularly useful in settings requiring evaluation of both low- and high-velocities such intracranial, abdominal, or whole heart 4D flow MRI studies.
Supplementary Material
Supporting Figure S1: Trend plots for comparing the change of peak velocity depending on applied 4D flow method (left: high-venc, right: dual-venc) occurring at all measurement locations. ICA = internal carotid arteries, MCA = middle cerebral arteries, ACA = anterior cerebral arteries, PCA = posterior cerebral arteries, VA = vertebral arteries, BA = basilar artery, TS = transverse sinus, StrSin = straight sinus, SagSin = superior sagittal sinus.
Supporting Figure S2: Trend plots for comparing the change of net flow depending on applied 4D flow method (left: high-venc, right: dual-venc) occurring at all measurement locations. ICA = internal carotid arteries, MCA = middle cerebral arteries, ACA = anterior cerebral arteries, PCA = posterior cerebral arteries, VA = vertebral arteries, BA = basilar artery, TS = transverse sinus, StrSin = straight sinus, SagSin = superior sagittal sinus.
Acknowledgments
Grant Support: DFG SCHN 1170/1-1, SIR Foundation pilot study grant, AHA Predoctoral Fellowship 14PRE18370014, AHA Posdoctoral Fellowship 14POST18350019, AHA Grant-in-Aid 13GRNT17340018, AHA Scientist Development Grant 16SDG30420005, Radiological Society of North America Research Seed Grant RSD1207, and NHLBI R01HL115828.
References
- 1.Wu C, Schnell S, Markl M, Ansari SA. Combined DSA and 4D Flow Demonstrate Overt Alterations of Vascular Geometry and Hemodynamics in an Unusually Complex Cerebral AVM. Clinical neuroradiology. 2015 doi: 10.1007/s00062-015-0477-9. [DOI] [PubMed] [Google Scholar]
- 2.Wu C, Ansari SA, Honarmand AR, et al. Evaluation of 4D vascular flow and tissue perfusion in cerebral arteriovenous malformations: influence of Spetzler-Martin grade, clinical presentation, and AVM risk factors. AJNR American journal of neuroradiology. 2015;36(6):1142–1149. doi: 10.3174/ajnr.A4259. [DOI] [PMC free article] [PubMed] [Google Scholar]
- 3.Markl M, Wu C, Hurley MC, et al. Cerebral arteriovenous malformation: complex 3D hemodynamics and 3D blood flow alterations during staged embolization. Journal of magnetic resonance imaging : JMRI. 2013;38(4):946–950. doi: 10.1002/jmri.24261. [DOI] [PubMed] [Google Scholar]
- 4.Schuchardt F, Schroeder L, Anastasopoulos C, et al. In vivo analysis of physiological 3D blood flow of cerebral veins. European radiology. 2015;25(8):2371–2380. doi: 10.1007/s00330-014-3587-x. [DOI] [PubMed] [Google Scholar]
- 5.Harloff A, Zech T, Wegent F, Strecker C, Weiller C, Markl M. Comparison of blood flow velocity quantification by 4D flow MR imaging with ultrasound at the carotid bifurcation. AJNR American journal of neuroradiology. 2013;34(7):1407–1413. doi: 10.3174/ajnr.A3419. [DOI] [PMC free article] [PubMed] [Google Scholar]
- 6.Hope TA, Hope MD, Purcell DD, et al. Evaluation of intracranial stenoses and aneurysms with accelerated 4D flow. Magnetic resonance imaging. 2010;28(1):41–46. doi: 10.1016/j.mri.2009.05.042. [DOI] [PubMed] [Google Scholar]
- 7.Boussel L, Rayz V, Martin A, et al. Phase-contrast magnetic resonance imaging measurements in intracranial aneurysms in vivo of flow patterns, velocity fields, and wall shear stress: comparison with computational fluid dynamics. Magnetic resonance in medicine : official journal of the Society of Magnetic Resonance in Medicine / Society of Magnetic Resonance in Medicine. 2009;61(2):409–417. doi: 10.1002/mrm.21861. [DOI] [PMC free article] [PubMed] [Google Scholar]
- 8.Schnell S, Ansari SA, Vakil P, et al. Three-dimensional hemodynamics in intracranial aneurysms: influence of size and morphology. Journal of magnetic resonance imaging : JMRI. 2014;39(1):120–131. doi: 10.1002/jmri.24110. [DOI] [PMC free article] [PubMed] [Google Scholar]
- 9.Kecskemeti S, Johnson K, Wu Y, Mistretta C, Turski P, Wieben O. High resolution three-dimensional cine phase contrast MRI of small intracranial aneurysms using a stack of stars k-space trajectory. Journal of magnetic resonance imaging : JMRI. 2011 doi: 10.1002/jmri.23501. [DOI] [PMC free article] [PubMed] [Google Scholar]
- 10.Isoda H, Ohkura Y, Kosugi T, et al. In vivo hemodynamic analysis of intracranial aneurysms obtained by magnetic resonance fluid dynamics (MRFD) based on time-resolved three-dimensional phase-contrast MRI. Neuroradiology. 2010;52(10):921–928. doi: 10.1007/s00234-009-0635-3. [DOI] [PubMed] [Google Scholar]
- 11.Hollnagel DI, Summers PE, Poulikakos D, Kollias SS. Comparative velocity investigations in cerebral arteries and aneurysms: 3D phase-contrast MR angiography, laser Doppler velocimetry and computational fluid dynamics. NMR in biomedicine. 2009;22(8):795–808. doi: 10.1002/nbm.1389. [DOI] [PubMed] [Google Scholar]
- 12.Lee AT, Pike GB, Pelc NJ. Three-point phase-contrast velocity measurements with increased velocity-to-noise ratio. Magnetic resonance in medicine : official journal of the Society of Magnetic Resonance in Medicine / Society of Magnetic Resonance in Medicine. 1995;33(1):122–126. doi: 10.1002/mrm.1910330119. [DOI] [PubMed] [Google Scholar]
- 13.Markl M, Harloff A, Bley TA, et al. Time-resolved 3D MR velocity mapping at 3T: improved navigator-gated assessment of vascular anatomy and blood flow. Journal of magnetic resonance imaging : JMRI. 2007;25(4):824–831. doi: 10.1002/jmri.20871. [DOI] [PubMed] [Google Scholar]
- 14.Nett EJ, Johnson KM, Frydrychowicz A, et al. Four-dimensional phase contrast MRI with accelerated dual velocity encoding. Journal of magnetic resonance imaging : JMRI. 2012 doi: 10.1002/jmri.23588. [DOI] [PMC free article] [PubMed] [Google Scholar]
- 15.Ha H, Kim GB, Kweon J, et al. Multi-VENC acquisition of four-dimensional phase-contrast MRI to improve precision of velocity field measurement. Magnetic resonance in medicine : official journal of the Society of Magnetic Resonance in Medicine / Society of Magnetic Resonance in Medicine. 2015 doi: 10.1002/mrm.25715. [DOI] [PubMed] [Google Scholar]
- 16.Callaghan FM, Kozor R, Sherrah AG, et al. Use of multi-velocity encoding 4D flow MRI to improve quantification of flow patterns in the aorta. Journal of magnetic resonance imaging : JMRI. 2015 doi: 10.1002/jmri.24991. [DOI] [PubMed] [Google Scholar]
- 17.Johnson KM, Markl M. Improved SNR in phase contrast velocimetry with five-point balanced flow encoding. Magnetic resonance in medicine : official journal of the Society of Magnetic Resonance in Medicine / Society of Magnetic Resonance in Medicine. 2010;63(2):349–355. doi: 10.1002/mrm.22202. [DOI] [PMC free article] [PubMed] [Google Scholar]
- 18.Nilsson A, Bloch KM, Carlsson M, Heiberg E, Stahlberg F. Variable velocity encoding in a three-dimensional, three-directional phase contrast sequence: Evaluation in phantom and volunteers. Journal of magnetic resonance imaging : JMRI. 2012;36(6):1450–1459. doi: 10.1002/jmri.23778. [DOI] [PubMed] [Google Scholar]
- 19.Binter C, Knobloch V, Manka R, Sigfridsson A, Kozerke S. Bayesian multipoint velocity encoding for concurrent flow and turbulence mapping. Magnetic resonance in medicine : official journal of the Society of Magnetic Resonance in Medicine / Society of Magnetic Resonance in Medicine. 2013;69(5):1337–1345. doi: 10.1002/mrm.24370. [DOI] [PubMed] [Google Scholar]
- 20.Knobloch V, Binter C, Gulan U, et al. Mapping mean and fluctuating velocities by Bayesian multipoint MR velocity encoding-validation against 3D particle tracking velocimetry. Magnetic resonance in medicine : official journal of the Society of Magnetic Resonance in Medicine / Society of Magnetic Resonance in Medicine. 2014;71(4):1405–1415. doi: 10.1002/mrm.24785. [DOI] [PubMed] [Google Scholar]
- 21.Knobloch V, Binter C, Kurtcuoglu V, Kozerke S. Arterial, venous, and cerebrospinal fluid flow: simultaneous assessment with Bayesian multipoint velocity-encoded MR imaging. Radiology. 2014;270(2):566–573. doi: 10.1148/radiol.13130840. [DOI] [PubMed] [Google Scholar]
- 22.Bernstein MA, Shimakawa A, Pelc NJ. Minimizing TE in moment-nulled or flow-encoded two- and three-dimensional gradient-echo imaging. Journal of magnetic resonance imaging : JMRI. 1992;2(5):583–588. doi: 10.1002/jmri.1880020517. [DOI] [PubMed] [Google Scholar]
- 23.Huang F, Akao J, Vijayakumar S, Duensing GR, Limkeman M. k-t GRAPPA: a k-space implementation for dynamic MRI with high reduction factor. Magnetic resonance in medicine : official journal of the Society of Magnetic Resonance in Medicine / Society of Magnetic Resonance in Medicine. 2005;54(5):1172–1184. doi: 10.1002/mrm.20641. [DOI] [PubMed] [Google Scholar]
- 24.Jung B, Ullmann P, Honal M, Bauer S, Hennig J, Markl M. Parallel MRI with extended and averaged GRAPPA kernels (PEAK-GRAPPA): optimized spatiotemporal dynamic imaging. Journal of magnetic resonance imaging : JMRI. 2008;28(5):1226–1232. doi: 10.1002/jmri.21561. [DOI] [PubMed] [Google Scholar]
- 25.Jung B, Stalder AF, Bauer S, Markl M. On the undersampling strategies to accelerate time-resolved 3D imaging using k-t-GRAPPA. Magnetic resonance in medicine : official journal of the Society of Magnetic Resonance in Medicine / Society of Magnetic Resonance in Medicine. 2011;66(4):966–975. doi: 10.1002/mrm.22875. [DOI] [PubMed] [Google Scholar]
- 26.Schnell S, Markl M, Entezari P, et al. k-t GRAPPA accelerated four-dimensional flow MRI in the aorta: effect on scan time, image quality, and quantification of flow and wall shear stress. Magnetic resonance in medicine : official journal of the Society of Magnetic Resonance in Medicine / Society of Magnetic Resonance in Medicine. 2014;72(2):522–533. doi: 10.1002/mrm.24925. [DOI] [PMC free article] [PubMed] [Google Scholar]
- 27.Bernstein MA, Zhou XJ, Polzin JA, et al. Concomitant gradient terms in phase contrast MR: analysis and correction. Magnetic resonance in medicine : official journal of the Society of Magnetic Resonance in Medicine / Society of Magnetic Resonance in Medicine. 1998;39(2):300–308. doi: 10.1002/mrm.1910390218. [DOI] [PubMed] [Google Scholar]
- 28.Walker PG, Cranney GB, Scheidegger MB, Waseleski G, Pohost GM, Yoganathan AP. Semiautomated method for noise reduction and background phase error correction in MR phase velocity data. Journal of magnetic resonance imaging : JMRI. 1993;3(3):521–530. doi: 10.1002/jmri.1880030315. [DOI] [PubMed] [Google Scholar]
- 29.Bock JK, Hennig J, Markl M. Optimized pre-processing of time-resolved 2D and 3D Phase Contrast MRI data. Proceedings Scientific Meeting ISMRM; Berlin. 2007. p. 3138. [Google Scholar]
- 30.Moran PR. A flow velocity zeugmatographic interlace for NMR imaging in humans. Magnetic resonance imaging. 1982;1(4):197–203. doi: 10.1016/0730-725x(82)90170-9. [DOI] [PubMed] [Google Scholar]
- 31.Hardy CJ, Bolster BD, Jr, McVeigh ER, Iben IE, Zerhouni EA. Pencil excitation with interleaved fourier velocity encoding: NMR measurement of aortic distensibility. Magnetic resonance in medicine : official journal of the Society of Magnetic Resonance in Medicine / Society of Magnetic Resonance in Medicine. 1996;35(6):814–819. doi: 10.1002/mrm.1910350605. [DOI] [PMC free article] [PubMed] [Google Scholar]
- 32.Macgowan CK, Liu GK, van Amerom JF, Sussman MS, Wright GA. Self-gated Fourier velocity encoding. Magnetic resonance imaging. 2010;28(1):95–102. doi: 10.1016/j.mri.2009.05.021. [DOI] [PubMed] [Google Scholar]
- 33.Wise RG, Newling B, Gates AR, Xing D, Carpenter TA, Hall LD. Measurement of pulsatile flow using MRI and a Bayesian technique of probability analysis. Magn Reson Imaging. 1996;14(2):173–185. doi: 10.1016/0730-725x(95)02059-3. [DOI] [PubMed] [Google Scholar]
- 34.Swan JS, Weber DM, Grist TM, Wojtowycz MM, Korosec FR, Mistretta CA. Peripheral MR angiography with variable velocity encoding. Work in progress. Radiology. 1992;184(3):813–817. doi: 10.1148/radiology.184.3.1509072. [DOI] [PubMed] [Google Scholar]
- 35.Bammer R, Hope TA, Aksoy M, Alley MT. Time-resolved 3D quantitative flow MRI of the major intracranial vessels: initial experience and comparative evaluation at 1.5T and 3.0T in combination with parallel imaging. Magnetic resonance in medicine : official journal of the Society of Magnetic Resonance in Medicine / Society of Magnetic Resonance in Medicine. 2007;57(1):127–140. doi: 10.1002/mrm.21109. [DOI] [PMC free article] [PubMed] [Google Scholar]
Associated Data
This section collects any data citations, data availability statements, or supplementary materials included in this article.
Supplementary Materials
Supporting Figure S1: Trend plots for comparing the change of peak velocity depending on applied 4D flow method (left: high-venc, right: dual-venc) occurring at all measurement locations. ICA = internal carotid arteries, MCA = middle cerebral arteries, ACA = anterior cerebral arteries, PCA = posterior cerebral arteries, VA = vertebral arteries, BA = basilar artery, TS = transverse sinus, StrSin = straight sinus, SagSin = superior sagittal sinus.
Supporting Figure S2: Trend plots for comparing the change of net flow depending on applied 4D flow method (left: high-venc, right: dual-venc) occurring at all measurement locations. ICA = internal carotid arteries, MCA = middle cerebral arteries, ACA = anterior cerebral arteries, PCA = posterior cerebral arteries, VA = vertebral arteries, BA = basilar artery, TS = transverse sinus, StrSin = straight sinus, SagSin = superior sagittal sinus.


