

Abstract
Objective
Distinguishing depressive episodes due to bipolar disorder (BD) or major depressive disorder (MDD) solely on clinical grounds is challenging. We aimed at comparing resting-state functional connectivity (rsFC) of regions subserving emotional regulation in similarly depressed BD and MDD.
Method
We enrolled 76 inpatients (BD, n=36; MDD, n=40), and healthy controls (HC, n=40). A seed-based approach was used to identify regions showing different rsFC with the insula and the amygdala. Insular and amygdalar parcellations were then performed along with diagnostic accuracy of the main findings.
Results
Lower rsFC between the left insula and the left mid-dorsolateral prefrontal cortex and between bilateral insula and right frontopolar prefrontal cortex (FPPFC) were observed in BD compared to MDD and HC. These results were driven by the dorsal anterior and posterior insula (PI). Lower rsFC between the right amygdala and the left anterior hippocampus was observed in MDD compared to BD and HC. These results were driven by the centromedial and laterobasal amygdala. Left PI/right FPPC rsFC showed 78% accuracy differentiating BD and MDD.
Conclusion
Amygdalar and insular rsFC distinguished between depressed BD and MDD. The observed differences suggest the possibility of differential pathophysiological mechanisms of emotional dysfunction in bipolar and unipolar depression.
Keywords: bipolar disorder, major depression, depression, functional magnetic resonance imaging
Introduction
Distinguishing between bipolar disorder (BD) and major depressive disorder (MDD) is challenging clinically and necessary for timely and effective treatment of individuals in the midst of a major depressive episode, especially for those with bipolar depression. Misdiagnosis of unipolar depression among persons whose clinical course ultimately proves bipolar is common, with as many as 69% of persons with BD initially receiving a diagnosis of unipolar depression and consulting a mean of four physicians prior to receiving an appropriate diagnosis (1). Although the presence of depressive episode-related psychosis, diurnal mood variation, and hypersomnia are more common in BD than MDD, and excessive self-reproach, loss of energy, and diminished libido are more common in MDD than BD (2), these features alone do not reliabily differentiate major depressive episodes associated with BD from those associated with MDD. Over time, the course of the illness (2–4) facilitates provision of the correct diagnosis and treatment, but often at substantial personal, psychosocial, and economic cost (5,6).
Advanced neuroimaging may yield clinically useful methods by which to differentiate major depressive episodes associated with BD from those associated with MDD (7,8). Resting state functional connectivity (rsFC) is one possible such method (9). Previous studies suggest that BD is characterized by decoupling of rsFC among frontal, temporal and subcortical regions, as reflected by abnormally increased or decreased rsFC between ventrolateral prefrontal cortex (PFC), amygdala and hippocampus bilaterally in combination with increased rsFC in the reward circuitry in the left hemisphere (10). By contrast, meta-analyses show that MDD is characterized by decreased rsFC within the frontoparietal network bilaterally, increased rsFC within the anterior default mode network, and increased rsFC between the salience and the anterior default mode network in the left hemisphere (11,12). These findings suggest that BD and MDD differ with respect to the functional neuroanatomy underlying disturbances of emotion, although additional evidence of such differences between BD- and MDD-associated major depressive episode is needed (7,13).
The amygdala and the insula appear to be integrally involved in both bipolar and unipolar depression, as well as in different neurophysiological depression subtypes (12,14,15). These structures are critical nodes within the salience network, which is responsible for the detection of emotional salience and the integration of sensory, emotional and cognitive information (16). Lower insula activity and both higher and lower amygdala connectivity with other frontal and subcortical regions are found during mood episodes in BD and differentiate between depressive and manic states (17–19) vs. euthymic state (20). Moreover, lower rsFC between and within the two regions has been found in fist-episode MDD and in youth BD and MDD compared to healthy controls (HC), suggesting their early involvement in emotional dysregulation and depression (21,22).
Aims of the study
Whether the functional connectivity of the two regions differs in bipolar and unipolar depression has not been investigated. Thus, we compared rsFC of the insula and amygdala in similarly depressed inpatients diagnosed with BD and MDD. Cognizant of recent evidence suggesting functionally distinct roles of subregions within the insula and amygdala (23,24), we explored the differential contributions of each insula and amygdala subregion to the functional networks involved in emotion and emotional regulation in BD and MDD. We also investigated rsFC of these structures and their subregions in BD and MDD in comparison to HC. We hypothesized that BD would display decreased rsFC with the lateral prefrontal regions associated with cognitive control of emotions while MDD would display decreased rsFC with the medial prefrontal regions associated with emotional processing.
Materials and methods
Participants
The study protocol and procedures were approved in accordance with the Baylor College of Medicine Internal Review Board. Written informed consent was obtained from all subjects. Study participants were recruited from adult inpatient units at The Menninger Clinic (Houston, TX) and included if they met DSM-IV (25) criteria for current major depressive episode associated with either Recurrent MDD, BD type I, or BD type II. Participants were permitted to have comorbid substance use disorder diagnoses, given the pervasive comorbidity between mood disorders and substance use disorders (26) together with the need to investigate ecologically valid samples in neuroimaging studies (27). Propensity score matching (PSM) was used to create a group of patients with MDD whose distribution of baseline covariates was similar to a group of patients with BD, with respect to age, gender, race, education and substance use. Particularly, for the latter covariate we entered in the model the level of use score of substances that were used in more than a third of the sample (tobacco, alcohol and cannabis) based on the World Health Organization Alcohol, Smoking and Substance Involvement Screening Test (WHO-ASSIST).
HC subjects were recruited from the general population. HC were excluded if they had a self-reported history of psychiatric diagnosis, including substance abuse/dependence. Additional exclusion criteria for all participant groups included a previous history of traumatic brain injury with loss of consciousness or any contraindication to magnetic resonance imaging (MRI).
Assessments
Participants drawn from the inpatient services completed a comprehensive diagnostic assessment. Demographic history was collected using a standardized patient information survey. Psychiatric diagnoses were made using the Structured Clinical Interview for DSM-IV Disorders (SCID-I/II) (28,29). Depression and difficulties in emotion regulation were psychometrically assessed using the self-rated Patient Health Questionnaire depressive scale (PHQ-9) (30) and the Difficulties in Emotion Regulation Scale (DERS) (31). The PHQ-9 is a reliable measure of depression severity that scores each of the 9 diagnostic criteria of Major Depressive Episode over the past 2 weeks as “0” (not at all) to “3” (nearly every day) (32). The DERS is a 36-item measure of the approach, understanding, and modulation of emotions that is scored on a five-point Likert scale ranging from “1” (almost never) to “5” (almost always). It incorporates six subscales that have been previously found to be positively associated with depression in adults with severe mental illness (33). Patients also completed the 12-item World Health Organization Disability Assessment Schedule 2.0 (WHODAS) (34) to assess level of disability. The WHODAS scores are reported as percentile, ranging from normal (<74th percentile) to extremely severe (>95th percentile). All patients were medicated at the time of the assessment.
Neuroimaging Data Acquisition and preprocessing
All study participants underwent magnetic resonance imaging of the brain on a 3T Siemens Trio Magnetom system. A structural T1- MPRAGE (TR=1200ms, TE=2.66 ms, flip angle=12°, voxel size=1mm isotropic, field of view (FOV)=245 mm, and total sequence time=4.5 min) was acquired. A 5-minute resting-state echo-planar imaging (EPI) scan (echo time (TE)=30 ms, repetition time (TR)=2000 ms, flip angle=90°, voxel size=3.4 × 3.4 × 4 mm, field of view (FOV)= 220 mm) also was acquired for each subject. A large “X” was displayed on the screen during the resting-state scan and the participants were instructed to keep their eyes open or closed and to not fall asleep.
Preprocessing of the functional data including functional realignment and unwarp, functional slice-timing correction, structural segmentation and normalization, functional normalization, ART-based functional outlier detection and scrubbing (global-signal Z value= 9; subject-motion= 2mm), and functional smoothing (8 mm Gaussian kernel) were done in MNI-space using CONN- fMRI Functional Connectivity toolbox v15.b (35) with SPM8 (www.fil.ion.ucl.ac.uk/spm/). Considering the importance of properly correcting for motion by not only regressing out motion parameters but also regressing out or eliminating specific frames with motion outliers (36), we used the Artifact Rejection Toolbox (ART; http://www.nitrc.org/projects/artifact_detect/) outlier detection and scrubbing to create confound regressors for motion parameters as implemented in CONN using default parameters. Realignment parameters were entered as first-level covariates in the toolbox. Realignment, scrubbing, white matter, and cerebrospinal fluid were entered as potential confound regressors in the subject-level general linear model (GLM). Using the anatomical component correction (aCompCor) method of flexibly removing physiological noise and movement confounds on a voxel-by-voxel level (37,38), each of these effects was regressed out of the BOLD signal before connectivity measures were computed by the toolbox. The aCompCor strategy improves the sensitivity and specificity of positive correlations and can reveal non-artifactual anticorrelations without global signal removal (37). Functional images were then temporally band-pass filtered (0.01 < f < 0.1 Hz) to investigate low frequency correlations.
Functional Connectivity Analyses
Seed-to-voxel
A seed-based, whole-brain approach was used to explore brain regions that were differentially connected with the bilateral insula and amygdala during major depressive episodes associated with either BD or MDD. The whole bilateral insula and amygdala based on the automated anatomical labeling atlas (39) were chosen as seeds. The mean time series from each seed was used as a predictor in a multiple regression GLM at each voxel. The toolbox creates t-statistic volumes, which were brought into SPM8 for whole-brain investigation of between-group maps. ANCOVA controlling for age, gender, psychosis, and substance use was performed. Medications effects, that could also plausibly confound findings, were investigated in a post-hoc manner to avoid reducing statistical power of the original ANCOVA analysis. A voxel statistical height threshold of p<0.001 with a cluster-level threshold of p<0.05 family-wise error (FWE) corrected was used to identify connectivity differences between BD and MDD. Significant clusters were saved and imported as target ROIs in the ROI-to-ROI analysis. Masks were created using the xjview toolbox (http://www.alivelearn.net/xjview).
ROI-to-ROI
To explore which subregions within the insula and amygdala were contributing to the abnormal connectivity with the resulting clusters, ROI-to-ROI analyses were performed using the insula and amygdala subregions as seed ROIs. The insula was divided into 3 subregions: ventral anterior (vAI), dorsal anterior (dAI) and posterior (PI). ROIs 6mm radius spheres centered at MNI coordinates reported previously (23) that were created using the WFU-pickatlas (http://fmri.wfubmc.edu/software/pickatlas). The amygdala was divided into 3 subregions: the laterobasal (LB), centromedial (CM), and superficial (SF). Each was based on a recently developed stereotaxic, cytoarchitectonic maps (40) implemented in the SPM Anatomic Toolbox (41). CONN computed temporal correlations between the BOLD signals in nine seed ROIs – right amydala LB (MNI: 25, −4, −19), CM (MNI: 13, −7, −14), SF (MNI: 19, −7, −14) and bilateral vAI (MNI: −33, 13, −7; 32,10, −6), dAI (MNI: −38, 6, 2; 35, 7, 3), PI (MNI: −38, −6, 5; 35, −11, 6), – and three target ROIs [mid-dorsolateral PFC (mid-DLPFC): −38, 38, 4; frontopolar PFC (FPPFC): 17, 57, −11; hippocampus: −30, −10, −18). Fisher’s Z-transformed correlations were calculated to indicate the strength of connectivity between each pairs of ROIs. Between group differences (BD vs. MDD) were studied using ANCOVA, controlling for age, gender, psychosis, and substance use. ROI-to-ROI results are reported when significant if p< 0.05 false discovery rate (FDR) analysis level corrected. To further explore whether the observed differences persisted if medications were included in the model, effects of antidepressants, lithium, antiepileptics, anxiolytics as well as antipsychotics were entered as dichotomous covariates (absent vs. present) in post-hoc ANCOVA analyses.
Additionally, to assess the accuracy of the beta values in predicting diagnosis (BD versus MDD) Receiver Operating Characteristics (ROC) analyses was carried out to obtain the area under the curve (AUC) using SPSS software (SPSS, Inc., Chicago, Illinois). Three diagnostic efficiency statistics were also calculated: Sensitivity (SN), Specificity (SP), and Odds Ratio (OR).
Exploratory comparisons
The primary hypothesis concerned differences between the two depressed patients groups; however we also performed exploratory comparisons by including a group of HC in a second series of ROI-to-ROI analyses. In order to provide information regarding the extent to which observed MDD and BD differences represents abnormal neural functioning, we extracted beta values from the same pairs of ROIs also in HC and conducted an ANCOVA, controlling for the effect of age and gender. Results are reported as significant if p< 0.05 FDR analysis level corrected. Post-hoc analyses were also performed.
Results
Demographic and descriptive statistics are presented in Table 1. The BD, MDD did not significantly differ on age, gender, years of education, race, presence of psychosis and substance use/abuse disorder. BD and MDD differed from one another on the current use of antidepressants (p= 0.001), lithium (p< 0.001), and antipsychotics (p< 0.001).
Table 1.
Demographic and clinical data
| BD group | MDD group | HC | F or χ2 or Fisher | df | p | |
|---|---|---|---|---|---|---|
| N | 36 | 40 | 40 | |||
| Age (years), mean (SD)* | 31.0 (11.3) | 30.0 (11.7) | 35.5 (14.4) | 2.1 | 2 | 0.12 |
| Gender, n male (%)* | 16 (44.4) | 21 (52.5) | 24 (60) | 1.81 | 2 | 0.39 |
| Education (years), mean (SD)* | 15.4 (3.7) | 15.8 (4.3) | 13.9 (4.5) | 2.2 | 2 | 0.11 |
| Race, n caucasian (%)* | 35 (97.2) | 35 (87.5) | 38 (95) | 2.6 | 2 | 0.28 |
| Psychosis, n (%) | 5 (13.9) | 2 (5.0) | – | 1.7 | 1 | 0.25 |
| Personality Disorder, n (%) | 16 (44.4) | 21 (52.5) | – | 0.5 | 1 | 0.48 |
| Substance Use Disorder, n (%) | 20 (55.5) | 21 (52.5) | – | 0.7 | 1 | 0.79 |
| PHQ9-Depression, mean (SD) | 17 (5.7) | 17.9 (7.2) | – | 0.3 | 1 | 0.55 |
| DERS-Total, mean (SD) | 114.9 (21.4) | 108.5 (26.8) | – | 1.3 | 1 | 0.26 |
| WHO-DAS Total, mean (SD) | 89.7 (11.3) | 90.7 (10.6) | / | 0.166 | 1 | 0.69 |
| Psychotropic medications, n (%) | – | |||||
| Antidepressants, n (%) | 21 (58.3) | 36 (90) | – | 10.13 | 1 | 0.001 |
| Lithium, n (%) | 15 (41.6) | 2 (5) | – | 14.6 | 1 | < 0.001 |
| Antiepileptics n (%) | 21 (58.3) | 16 (40) | – | 2.54 | 1 | 0.11 |
| Anxiolytics n (%) | 5 (13.9) | 12 (30) | – | 2.83 | 1 | 0.09 |
| Antipsychotics, n(%) | 25 (69.4) | 11 (27.5) | – | 13.3 | 1 | < 0.001 |
BD= Bipolar Disorder; MDD= Major Depressive Disorder; HC= healthy controls; PHQ-9= Patient Health Questionnaire depressive scale; DERS= Difficulties in emotion regulation scale; WHODAS= World Health Organization Disability Assessment Schedule.
t-test or chi-square comparing BD and MDD did not show any significant difference (p< 0.05).
Seed-to-voxel analysis
After adjusting for the possible effect of age, gender, psychosis and substance use, three clusters in which BD and MDD differed were identified. When compared to MDD, the BD group demonstrated: lower rsFC between the left insula and both the left mid-DLPFC), BA 46 [k = 213, p= 0.041; peak at MNI: (−38, 38, 4), Z = 4.04] and the right FPPFC, BA 10 [k = 210, p= 0.043; peak at MNI: (12, 62, −10), Z = 4.51]; lower rsFC between the right insula and the right FPPFC, BA 10 [k = 232, p= 0.032; peak at MNI: (18, 52, −12), Z = 4.31]; and higher rsFC between the right amygdala and the left anterior hippocampus [k = 373, p= 0.003; peak at MNI: (−30, −10, −18), Z = 4.31]. No suprathreshold differences were found considering the left amygdala as seed. Results are displayed in Figure 1.
Figure 1. Seed-to-voxel between patients (BD vs. MDD) results.

Clusters presenting lower (blue) or higher (red) rsFC, p< 0.05 FWE-corrected.
A) Left insula seed; B) left insula and right insula seeds; C) right amygdala seed. Talairach x,y,z- coordinates are shown above each slice (left hemisphere corresponds to the left side of the image).
ROI-to-ROI analysis
Lower rsFC between the left mid-DLPFC and the three left insula subregions [vAI t(70)= −3.33, p= 0.01; dAI t(70)= −3.31, p= 0.01);PI t(70)= −3.08, p= 0.02)] was observed in the BD group when compared to the MDD group. Lower rsFC also was observed in BD between the right FPPFC and the bilateral dorsal anterior insula (dAI) and posterior insula (PI) [left dAI t(70)= −4.07, p= 0.003; right dAI t(70)= −4.27, p= 0.002; left PI t(70)= −4.55, p= 0.001; right PI t(70)= −3.32, p= 0.01]. Conversely, higher rsFC between the left anterior hippocampus and both the right laterobasal amygdala (LB) and right centromedial amygdala (CM) [LB t(70)= 4.44, p= 0.001 and CM t(70)= 3.95, p= 0.003] was observed in BD compared to MDD.
Novel to the current analysis, BD showed higher rsFC between the left anterior hippocampus and both the right vental anterior insula (vAI) and dorsal anterior insula [vAI t(70)= −3.64, p=0.008; dAI t(70)= −2.69, p=0.03] compared to MDD. Moreover, higher rsFC between the right superficial amygdala (SF) and right PI [t(70)=3.21, p=0.01] was observed in BD compared to MDD.
After including the medications in the model, results remain significant except for the rsFC between the left mid-DLPFC and left vAI [t(65)= −2.62, p= 0.12)] and the right FPPFC and the right PI [t(65)= −2.38, p= 0.056)]. With up to 78% accuracy, the left PI - right FPPFC (p< 0.001) rsFC was the best predictor of major depressive episode associated with BD vs. MDD, closely followed by right amy LB - left hippo (AUC= 75%, p<0.001), right dAI- right FPPFC (AUC= 74%, p<0.001), left dAI- right FPPFC and right amy CM - left hippo (AUC= 73%, p=0.001), right PI - R FPPFC (AUC= 72%, p=0.001) and left dAI – left mid-DLPFC (AUC=70%, p=0.003). Only the left PI – left mid-DLPFC showed poor to good accuracy (AUC=69%, p=0.005). Results are presented in Table 2. No correlations were found between the altered rsFC and both the PHQ-9 and DERS scores.
Table 2.
Diagnostic Efficiency Statistics of rsFC pairings in classifying diagnosis.
| AUC | SN | SP | OR | |
|---|---|---|---|---|
| L PI - R FPPFC | 0.781 | 0.722 | 0.725 | 6.855 |
| R amy LB - L hippo | 0.755 | 0.722 | 0.725 | 6.855 |
| R dAI- R FPPFC | 0.740 | 0.611 | 0.625 | 2.619 |
| R amy CM - L hippo | 0.733 | 0.667 | 0.675 | 4.154 |
| L dAI- R FPPFC | 0.731 | 0.667 | 0.675 | 4.154 |
| R PI - R FPPFC | 0.722 | 0.667 | 0.675 | 4.154 |
| L vAI - L DLPFC | 0.716 | 0.639 | 0.675 | 3.675 |
| L dAI - L DLPFC | 0.701 | 0.639 | 0.650 | 3.286 |
| L PI - L DLPFC | 0.688 | 0.583 | 0.600 | 2.100 |
AUC= area under the curve from receiver operating characteristic analysis; SN= sensitivity; SP= specificity; OR= odds ratio.
L vAI= left ventral anterior insula; LdAI= left dorsal anterior insula; L PI= left posterior insula; R vAI= right ventral anterior insula; R dAI= right dorsal anterior insula; R PI= right posterior insula; R amy SF= right amygdala superficial; R amy LB= right amygdala laterobasal; R amy CM= right amygdala centromedial; L mid-DLPFC= left mid-dorsolateral prefrontal cortex; R FPPFC= right frontopolar prefrontal cortex; L Hippo= left hippocampus
Exploratory comparisons with healthy controls
Relative to HC, BD was associated with lower rsFC between the left mid-DLPFC and the left dorsal and posterior insula [dAI t(109)= 3.61, p= 0.003; PI t(109)= 2.55, p= 0.027]. The BD group also showed lower connectivity between the right FPPFC and the left PI [t(109)= 3.32, p= 0.009] and the right dAI [t(109)= 3.08, p= 0.010]. Conversely, relative to HC the MDD group showed lower connectivity between the left anterior hippocampus and the right centromedial and laterobasal amygdala [CM t(109)= 0.33, p=0.003; LB t(109)= 3.62, p=0.004. Comparisons are displayed in Figure 2.
Figure 2.
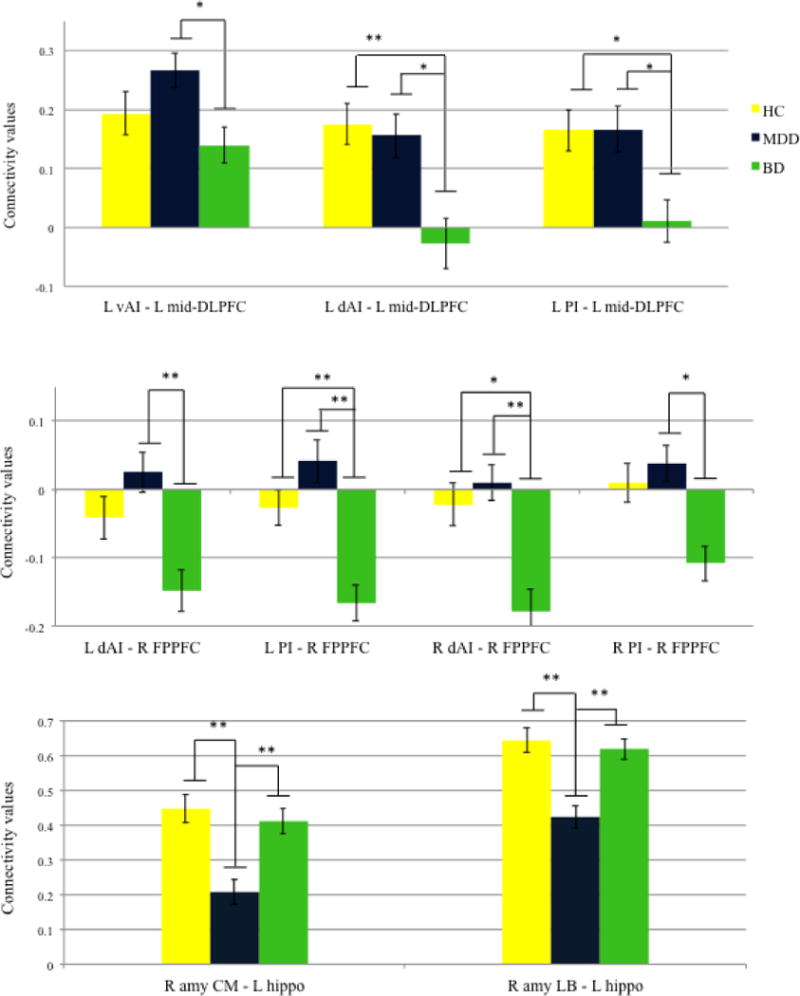
ROI-to-ROI comparison between BD, MDD, and HC.
Values are means, with standard errors represented by vertical bars. *p <0.05; **p<0.01.
Legend:
L vAI= left ventral anterior insula; LdAI= left dorsal anterior insula; L PI= left posterior insula; R vAI= right ventral anterior insula; R dAI= right dorsal anterior insula; R PI= right posterior insula; R amy SF= right amygdala superficial; R amy LB= right amygdala laterobasal; R amy CM= right amygdala centromedial; L mid-DLPFC= left mid-dorsolateral prefrontal cortex; R FPPFC= right frontopolar prefrontal cortex; L Hippo= left hippocampus.
Discussion
The current study investigated insula and amygdala-seeded rsFC in participants with phenotypically similar major depressive episodes due to BD or MDD. Consistent with our hypothesis, bipolar depression was associated with decreased rsFC between the left insula and the left mid-DLPFC as well as between bilateral insula and right FPPFC when compared to MDD and HC; this difference reflected rsFC of the right FPPFC to the dAI and PI insula subregions. Unexpectedly, unipolar depression was associated with decreased rsFC between the right amygdala and the left anterior hippocampus when compared to BD and HC; this difference reflected rsFC of the left anterior hippocampus to the CM and LB amygdala subregions (Figure 3 shows a model of major findings). All of the observed rsFC differences (excepting only the left PI with the left mid-DLPFC) afforded accurate differentiation between unipolar and bipolar depression in ROC analysis. Collectively, these findings suggest that the insular and amygdalar rsFC reflect different functional neuroanatomies for major depressive episodes due to BD versus MDD. Further, these observations, if replicated at the group level and adapted to remain robust at the single-subject level (42), may provide a starting point from which to develop a neuroimaging method that facilitates differentiating unipolar depression from bipolar depression.
Figure 3.

Proposed model of altered rsFC in depressed BD and MDD.
Altered lower (dark blue) or unaltered (light gray) connections. Superior view of a 3D brain.
BD= bipolar disorder group; MDD= major depressive disorder group.
mid-DLPFC= mid-dorsolateral prefrontal cortex; FPPFC= frontopolar prefrontal cortex; dAI= dorsal anterior insula; PI= posterior insula; amy LB= amygdala laterobasal; amy CM= amygdala centromedial; Hippo= left hippocampus.
Considering the relative dearth of previous seed-based rsFC studies comparing unipolar and bipolar depression on regions of the salience network, cautious interpretation of the present findings is required. In contrast to a previous, smaller, and potentially underpowered study that failed to identify rsFC differences between unipolar and bipolar depression (43), our results are consistent with the findings of decreased rsFC of the left posterior insula in depressed BD compare to MDD (44) and decreased rsFC between the amygdala and the anterior hippocampus with respect to HC (17). By contrast, MDD showed lower rsFC with respect to BD and HC, consistent with observations made in in adolescent MDD, early-onset MDD, and populations at-risk for MDD (45–47) and suggesting aberrant amygdala-hippocampus rsFC throughout the course of recurrent MDD. Moreover, in adults with recurrent MDD, reduced amygdala-hippocampus rsFC is a particularly robust discriminator from HC in a multivariate whole-brain analysis (48). The present findings suggest that differential amygdalar-hippocampal rsFC also may robustly discriminate not only MDD from HC but also unipolar from bipolar depression.
The insula is a multimodal integration region that evaluates emotional or motivational salience of certain external and internal stimuli (49). The vAI is functionally connected with the anterior cingulate (ACC) and involved principally in the processing of emotion and in emotional salience detection (23,50). The dAI is functionally connected with the entire insula and adjacent regions (opercula and posterior orbitofrontal cortex (pOFC)) and with a set of regions mainly involved in the cognitive control network. Thus, it has been proposed that the dAI plays a role in responding to affective aversive stimuli by linking the affective response to attentional or executive mechanisms (23). The PI is functionally connected also with the entire insula, opercula, dorsal ACC, and IFG but also with the primary and secondary motor and somatosensory cortices. Thus, the PI might play a role in processing somatosensory stimuli with affective or motivational significance (23,51).
In the present study, bilateral insula, particularly dAI and PI subregions, showed altered connectivity with the mid-DLPFC and FPPFC which are respectively involved in the manipulation of externally generated information and in the process of evaluation of internally generated responses for action (52). Thus, we hypothesized that in BD the pathway by which the somatosensory/interoceptive information from the PI influence decision-making and behavior via dAI is impaired. The altered connectivity may relate to the dysfunction in integrating multiple cognitive and emotional functions, thus failing to correctly identify the most homeostatically relevant external and internal stimuli. Additionally, if replicated, our findings of rsFC between the left PI and right FPPFC suggest that this pattern of connectivity might be a suitable biomarker to assist in the differential diagnosis between BD and MDD. In fact, the diagnostic efficiency statistics observed for this pattern of connectivity are in line with, and in some instances better than, the sensitivity and specificity of other psychiatric diagnostic tests as well as more established medical laboratory tests (53). Finally, the insula baseline activity has been identified as one of the predictive neural markers of treatment response in unipolar depression (54). Anterior insula hypometabolism is associated with poor response to antidepressant but remission with psychotherapy in a MDD sample (55). Considering the debate on the risk-benefit profile of antidepressants in BD, we suggest future studies should test the insula treatment biomarker also in bipolar depression.
The amygdala is a complex of structurally and functionally heterogeneous group of nuclei with a well-documented role in processing emotions (56). The LB amygdala facilitates associative learning processes through connections with the temporal regions including the hippocampus, medial PFC, and precentral gyrus. The CM amgydala mediates response expression and facilitates attention to salient stimuli via connections to thalamus, insula, dorsal ACC, and cerebellum. The SF amygdala supports olfactory and affective processes through connections throughout the limbic cortex (24). Although the spatial resolution of the fMRI is a limitation for the parcellation of the amygdala undertaken in this study, the present findings within the right amygdala are consistent with Grotegerd et al. (57). Albeit at a non-significant level, they observed activity in the right LB amydgala group differentiating between unipolar and bipolar depressed patients, during an emotion-processing task. In the present study, lower rsFC was observed between the amygdala and hippocampus, mainly the anterior part. According to a recent model, the anterior hippocampus is engaged during high-level cognitive functions linked to the construction and refinement of scene representation (58). Effective connectivity between these two regions is essential to the network interactions facilitating integration of emotional states into conscious awareness (59). The transition from the “unconscious” or automatic aspect of emotions into conscious awareness requires the effective integration of information between the so-called ventral and the dorsal compartment, for which the hippocampus is a key node. Thus, it is tempting to speculate that the altered connectivity in MDD may reflect impairment in the creation of emotional feelings.
Potential limitations of the present study include sample-specific factors. All of the participants with BD or recurrent MDD were hospitalized with a major depressive episode at the time of study participation. Accordingly, it is not clear whether the present rsFC findings reflect emotional state or diagnosis-specific traits. Further, findings in this sample may not generalize easily to persons with less chronic, less severe, or less complex BD or MDD that are typically managed in outpatient settings. The present study also did not include a comprehensive accounting of the number and duration of previous mood episodes as well as the total duration of illness, leaving uncertain the relationship of the rsFC patterns observed and these illness characteristics. The inclusion of persons with comorbid substance use disorder also risks introduction of findings that reflect the effects of these disorders or their interactions with BD or MDD rather than characteristics of BD or MDD alone. This caveat is somewhat tempered given the analytic approaches employed across analyses that statistically controlled for substance abuse comorbidity. Additionally, the inclusion of individuals with comorbid substance use increases the “real-world” characteristics of the present population (27), thereby potentially increasing the ecological validity of these findings. All persons with BD and MDD also were prescribed multiple medications at the time of MRI. Although medication status was secondarily included as covariates in the analyses performed here, the potential effects of medication status on rsFC cannot be disentangled fully from those effects attributable to diagnosis (i.e., BD vs. MDD). However, an updated review on neuroimaging studies comparing BD and HC concluded that medication effects do not seem to provide an alternative explanation for differences in BOLD signal (60). Moreover, using self-reported psychiatric history, including substance abuse/dependence, to characterize the HC participants is a limitation of this study, and may reduce between-group differences. However, the comparison with the HC group was conducted for exploratory purposes in the present study.
With regard to the fMRI analysis, the seed-based approach used in this study may limit the findings produced, as it focuses on specific regions of interest and ignores possibly valuable differences elsewhere that might have been revealed by a data-driven approach. However, the seed-based approach has the advantage of being a neuroanatomic model-driven specification of brain regions that are functionally connected and one that yields moderate to high reliability when a hypothesis-driven approach to data analysis is taken (61). Additionally, spatial localization error and overlaps between the amygdala subregions, particularly with the CM and LB, cannot be excluded and results concerning the specific subregions should be interpreted carefully, especially in light of the somewhat large voxel size used. However, our approach uses cytoarchitectonic mapping that has been previously employed (24,57).
Lastly, although the diagnostic accuracy of the main findings was performed on the connectivity data obtained in the post-hoc analyses risking inflated accuracy, we also calculated SN, SP, and OR - to provide a deeper understanding of the results.
In summary, the present findings support the hypothesis that phenotypically similar major depressive episodes in BD and MDD arise from different patterns of altered functional connectivity. Abnormal fronto-insular connectivity may mediate emotional regulation dysfunction in BD while abnormal amygdala-hippocampal connectivity may mediate emotional processing dysfunction in MDD. As such, the observed differences suggest the possibility of differential pathophysiological mechanisms of major depressive episodes in BD and MDD. If replicated, such differences may inform the development of neuroimaging methods that facilitate clinical distinction between unipolar depression and bipolar depression.
Significant outcomes
Despite phenotypic similarities, bipolar and unipolar depression can be distinguished with respect to the resting-state functional connectivity of the insula and amygdala.
Lower fronto-insular connectivity in BD and lower amygdala-hippocampal connectivity in MDD suggest different underlying dysfunction of the neural networks involved in emotion regulation.
Connectivity findings showing good diagnostic accuracy may contribute to differential diagnosis, especially if replicated in larger medication-naïve and first-episode samples.
Limitations
Depressed patients with comorbid substance use/abuse were not excluded. This was included as a possible confounder in the analyses.
Seed-based approach may limit the detection of possible additional differences.
Acknowledgments
This work was supported by the McNair Medical Institute; American Foundation for Suicide Prevention (SRG-2-125-14); NARSAD (19295); the Veteran Health Administration (VHA5I01CX000994); and the National Institute of health (NIDA DA026539, DA09167). This research was partially supported by the Menninger Clinic Foundation; The Brown Foundation, Inc. of Houston, Texas; the George and Mary Josephine Hamman Foundation; and the Toomim Family Fund. Drs. Frueh and Madan are McNair Scholars. This material is partly the result of work supported with resources and the use of facilities at the Michael E. DeBakey VA Medical Center, Houston, TX. The authors thank the Core for Advanced MRI at Baylor College of Medicine, and Dr. Charles Neblett. The study follows the guidelines on good publication practices (62). The study sponsors were not involved in any aspect of research activities and did not approve the specific protocol or manuscript. Thus, the authors were independent from study sponsors in the context of research.
Footnotes
Financial Disclosures
None of the authors have any potential conflicts of interests to declare.
References
- 1.Hirschfeld RMA, Lewis L, Vornik LA. Perceptions and impact of bipolar disorder: how far have we really come? Results of the national depressive and manic-depressive association 2000 survey of individuals with bipolar disorder. J Clin Psychiatry. 2003;64:161–174. [PubMed] [Google Scholar]
- 2.Forty L, Smith D, Jones L, et al. Clinical differences between bipolar and unipolar depression. Br J Psychiatry. 2008;192:388–389. doi: 10.1192/bjp.bp.107.045294. [DOI] [PubMed] [Google Scholar]
- 3.Judd LL, Akiskal HS, Schettler PJ, et al. A prospective investigation of the natural history of the long-term weekly symptomatic status of bipolar ii disorder. Arch Gen Psychiatry. 2003;60:261–269. doi: 10.1001/archpsyc.60.3.261. [DOI] [PubMed] [Google Scholar]
- 4.Judd LL, Akiskal HS, Schettler PJ, et al. The long-term natural history of the weekly symptomatic status of bipolar I disorder. Arch Gen Psychiatry. 2002;59:530–537. doi: 10.1001/archpsyc.59.6.530. [DOI] [PubMed] [Google Scholar]
- 5.Kamat Sa, Rajagopalan K, Pethick N, Willey V, Bullano M, Hassan M. Prevalence and humanistic impact of potential misdiagnosis of bipolar disorder among patients with major depressive disorder in a commercially insured population. J Manag Care Pharm. 2008;14:631–642. doi: 10.18553/jmcp.2008.14.7.632. [DOI] [PubMed] [Google Scholar]
- 6.Centorrino F, Fogarty KV, Sani G, Salvatore P, Cimbolli P, Baldessarini RJ. Antipsychotic drug use: McLean Hospital, 2002. Hum Psychopharmacol. 2005;20:355–358. doi: 10.1002/hup.700. [DOI] [PubMed] [Google Scholar]
- 7.Cardoso de Almeida JR, Phillips ML. Distinguishing between unipolar depression and bipolar depression: current and future clinical and neuroimaging perspectives. Biol Psychiatry. 2013;73:111–118. doi: 10.1016/j.biopsych.2012.06.010. [DOI] [PMC free article] [PubMed] [Google Scholar]
- 8.Rive MM, Redlich R, Schmaal L, et al. Distinguishing medication-free subjects with unipolar disorder from subjects with bipolar disorder: state matters. Bipolar Disord. 2016:612–623. doi: 10.1111/bdi.12446. [DOI] [PubMed] [Google Scholar]
- 9.Fox MD, Raichle ME. Spontaneous fluctuations in brain activity observed with functional magnetic resonance imaging. Nat Rev Neurosci. 2007;8:700–711. doi: 10.1038/nrn2201. [DOI] [PubMed] [Google Scholar]
- 10.Phillips ML, Swartz HA. A critical appraisal of neuroimaging studies of bipolar disorder: toward a new conceptualization of underlying neural circuitry and a road map for future research. Am J Psychiatry. 2014;171:829–843. doi: 10.1176/appi.ajp.2014.13081008. [DOI] [PMC free article] [PubMed] [Google Scholar]
- 11.Kaiser RH, Andrews-Hanna JR, Wager TD, Pizzagalli DA. Large-Scale Network Dysfunction in Major Depressive Disorder: A Meta-analysis of Resting-State Functional Connectivity. JAMA psychiatry. 2015;72:603–611. doi: 10.1001/jamapsychiatry.2015.0071. [DOI] [PMC free article] [PubMed] [Google Scholar]
- 12.Mulders PC, van Eijndhoven PF, Schene AH, Beckmann CF, Tendolkar I. Resting-state functional connectivity in major depressive disorder: A review. Neurosci Biobehav Rev. 2015;56:330–344. doi: 10.1016/j.neubiorev.2015.07.014. [DOI] [PubMed] [Google Scholar]
- 13.Phillips ML, Ladouceur CD, Drevets WC. A neural model of voluntary and automatic emotion regulation: implications for understanding the pathophysiology and neurodevelopment of bipolar disorder. Mol Psychiatry. 2008;13:829, 833–857. doi: 10.1038/mp.2008.65. [DOI] [PMC free article] [PubMed] [Google Scholar]
- 14.Strakowski SM, Adler CM, Almeida J, et al. The functional neuroanatomy of bipolar disorder: a consensus model. Bipolar Disord. 2012;14:313–325. doi: 10.1111/j.1399-5618.2012.01022.x. [DOI] [PMC free article] [PubMed] [Google Scholar]
- 15.Drysdale AT, Grosenick L, Downar J, et al. Resting-state connectivity biomarkers define neurophysiological subtypes of depression. Nat Med Published Online First. 2016 doi: 10.1038/nm.4246. [DOI] [PMC free article] [PubMed] [Google Scholar]
- 16.Menon V. Large-scale brain networks and psychopathology: A unifying triple network model. Trends Cogn Sci. 2011;15:483–506. doi: 10.1016/j.tics.2011.08.003. [DOI] [PubMed] [Google Scholar]
- 17.Li M, Huang C, Deng W, et al. Contrasting and convergent patterns of amygdala connectivity in mania and depression: A resting-state study. J Affect Disord. 2015;173:53–58. doi: 10.1016/j.jad.2014.10.044. [DOI] [PubMed] [Google Scholar]
- 18.Hummer TA, Hulvershorn L, Karne H, Gunn AD, Wang Y, Anand A. Emotional Response Inhibition in Bipolar Disorder: A Functional Magnetic Resonance Imaging Study of Trait- and State-Related Abnormalities. Biol Psychiatry. 2013;73:136–143. doi: 10.1016/j.biopsych.2012.06.036. [DOI] [PMC free article] [PubMed] [Google Scholar]
- 19.Cerullo MA, Eliassen JC, Smith CT, et al. Bipolar I disorder and major depressive disorder show similar brain activation during depression. Bipolar Disord. 2014;16:703–712. doi: 10.1111/bdi.12225. [DOI] [PMC free article] [PubMed] [Google Scholar]
- 20.Rey G, Piguet C, Benders A, et al. Resting-state functional connectivity of emotion regulation networks in euthymic and non-euthymic bipolar disorder patients. Eur Psychiatry. 2016;34:56–63. doi: 10.1016/j.eurpsy.2015.12.005. [DOI] [PubMed] [Google Scholar]
- 21.Bebko G, Bertocci M, Chase H, et al. Decreased amygdala-insula resting state connectivity in behaviorally and emotionally dysregulated youth. Psychiatry Res - Neuroimaging. 2015;231:77–86. doi: 10.1016/j.pscychresns.2014.10.015. [DOI] [PMC free article] [PubMed] [Google Scholar]
- 22.Song Z, Zhang M, Huang P. Aberrant emotion networks in early major depressive disorder patients: an eigenvector centrality mapping study. Transl Psychiatry. 2016;6:e819. doi: 10.1038/tp.2016.81. [DOI] [PMC free article] [PubMed] [Google Scholar]
- 23.Deen B, Pitskel NB, Pelphrey KA. Three systems of insular functional connectivity identified with cluster analysis. Cereb Cortex. 2011;21:1498–1506. doi: 10.1093/cercor/bhq186. [DOI] [PMC free article] [PubMed] [Google Scholar]
- 24.Roy AK, Shehzad Z, Margulies DS, et al. Functional connectivity of the human amygdala using resting state fMRI. Neuroimage. 2009;45:614–626. doi: 10.1016/j.neuroimage.2008.11.030. [DOI] [PMC free article] [PubMed] [Google Scholar]
- 25.American Psychiatric Association. Diagnostic and statistical manual of mental disorders. (4th) 1994 [Google Scholar]
- 26.Conway KP, Compton W, Stinson FS, Grant BF. Lifetime comorbidity of DSM-IV mood and anxiety disorders and specific drug use disorders: results from the National Epidemiologic Survey on Alcohol and Related Conditions. J Clin Psychiatry. 2006;67:247–257. doi: 10.4088/jcp.v67n0211. [DOI] [PubMed] [Google Scholar]
- 27.Greene DJ, Black KJ, Schlaggar BL. Considerations for MRI study design and implementation in pediatric and clinical populations. Dev Cogn Neurosci. 2016;18:101–112. doi: 10.1016/j.dcn.2015.12.005. [DOI] [PMC free article] [PubMed] [Google Scholar]
- 28.First M, Gibbon M, Spitzer R. Structured Clinical Interview for DSM-IV Axis II Personality Disorders (SCID-II) Washington, DC: Am Psychiatr Press, Inc; 1997. [Google Scholar]
- 29.First MB, Spitzer RL, Gibbon M, Williams JBW. Structured Clinical Interview for DSM-IV-TR Axis I Disorders, Patient Edition (SCID-I/P, 11/2002 revision) 2002 doi:M. [Google Scholar]
- 30.Löwe B, Kroenke K, Herzog W, Gräfe K. Measuring depression outcome with a brief self-report instrument: Sensitivity to change of the Patient Health Questionnaire (PHQ-9) J Affect Disord. 2004;81:61–66. doi: 10.1016/S0165-0327(03)00198-8. [DOI] [PubMed] [Google Scholar]
- 31.Gratz KL, Roemer L. Multidimensional assessment of emotion regulation and dysregulation. J Psychopathol Behav Assess. 2004;26:41–54. [Google Scholar]
- 32.Kroenke K, Spitzer RL, Williams JBW. The PHQ-9: Validity of a brief depression severity measure. J Gen Intern Med. 2001;16:606–613. doi: 10.1046/j.1525-1497.2001.016009606.x. [DOI] [PMC free article] [PubMed] [Google Scholar]
- 33.Fowler JC, Charak R, Elhai JD, Allen JG, Frueh BC, Oldham JM. Construct validity and factor structure of the difficulties in Emotion Regulation Scale among adults with severe mental illness. J Psychiatr Res. 2014;58:175–180. doi: 10.1016/j.jpsychires.2014.07.029. [DOI] [PubMed] [Google Scholar]
- 34.Üstün TB. Measuring Health and Disability: Manual for WHO Disability Assessment Schedule WHODAS 2.0. World Heal Organ. 2010;90 [Google Scholar]
- 35.Whitfield-Gabrieli S, Nieto-Castanon A. Conn: A Functional Connectivity Toolbox for Correlated and Anticorrelated Brain Networks. Brain Connect. 2012;2:125–141. doi: 10.1089/brain.2012.0073. [DOI] [PubMed] [Google Scholar]
- 36.Power JD, Barnes KA, Snyder AZ, Schlaggar BL, Petersen SE. Spurious but systematic correlations in functional connectivity MRI networks arise from subject motion. Neuroimage. 2012;59:2142–2154. doi: 10.1016/j.neuroimage.2011.10.018. [DOI] [PMC free article] [PubMed] [Google Scholar]
- 37.Behzadi Y, Restom K, Liau J, Liu TT. A component based noise correction method (CompCor) for BOLD and perfusion based fMRI. Neuroimage. 2007;37:90–101. doi: 10.1016/j.neuroimage.2007.04.042. [DOI] [PMC free article] [PubMed] [Google Scholar]
- 38.Chai XJ, Castañán AN, Öngür D, Whitfield-Gabrieli S. Anticorrelations in resting state networks without global signal regression. Neuroimage. 2012;59:1420–1428. doi: 10.1016/j.neuroimage.2011.08.048. [DOI] [PMC free article] [PubMed] [Google Scholar]
- 39.Tzourio-Mazoyer N, Landeau B, Papathanassiou D, et al. Automated anatomical labeling of activations in SPM using a macroscopic anatomical parcellation of the MNI MRI single-subject brain. Neuroimage. 2002;15:273–289. doi: 10.1006/nimg.2001.0978. [DOI] [PubMed] [Google Scholar]
- 40.Amunts K, Kedo O, Kindler M, et al. Cytoarchitectonic mapping of the human amygdala, hippocampal region and entorhinal cortex: Intersubject variability and probability maps. Anatomy and Embryology. 2005:343–352. doi: 10.1007/s00429-005-0025-5. [DOI] [PubMed] [Google Scholar]
- 41.Eickhoff SB, Stephan KE, Mohlberg H, et al. A new SPM toolbox for combining probabilistic cytoarchitectonic maps and functional imaging data. Neuroimage. 2005;25:1325–1335. doi: 10.1016/j.neuroimage.2004.12.034. [DOI] [PubMed] [Google Scholar]
- 42.Gordon EM, Laumann TO, Adeyemo B, et al. Individual-specific features of brain systems identified with resting state functional correlations. Neuroimage Published Online First. 2016 doi: 10.1016/j.neuroimage.2016.08.032. [DOI] [PMC free article] [PubMed] [Google Scholar]
- 43.Anand A, Li Y, Wang Y, Lowe MJ, Dzemidzic M. Resting state corticolimbic connectivity abnormalities in unmedicated bipolar disorder and unipolar depression. Psychiatry Res. 2009;171:189–198. doi: 10.1016/j.pscychresns.2008.03.012. [DOI] [PMC free article] [PubMed] [Google Scholar]
- 44.Liu CH, Ma X, Wu X, et al. Resting-state abnormal baseline brain activity in unipolar and bipolar depression. Neurosci Lett. 2012;516:202–206. doi: 10.1016/j.neulet.2012.03.083. [DOI] [PubMed] [Google Scholar]
- 45.Cullen KR, Westlund MK, Klimes-Dougan B, et al. Abnormal Amygdala Resting-State Functional Connectivity in Adolescent Depression. JAMA Psychiatry. 2014;71:1138–1147. doi: 10.1001/jamapsychiatry.2014.1087. [DOI] [PMC free article] [PubMed] [Google Scholar]
- 46.Luking KR, Repovs G, Belden AC, et al. Functional connectivity of the amygdala in early-childhood-onset depression. J Am Acad Child Adolesc Psychiatry. 2011;50:1027–1041. doi: 10.1016/j.jaac.2011.07.019. [DOI] [PMC free article] [PubMed] [Google Scholar]
- 47.van der Werff SJA, Pannekoek JN, Veer IM, et al. Resting-state functional connectivity in adults with childhood emotional maltreatment. Psychol Med. 2013;43:1825–1836. doi: 10.1017/S0033291712002942. [DOI] [PubMed] [Google Scholar]
- 48.Zeng LL, Shen H, Liu L, et al. Identifying major depression using whole-brain functional connectivity: A multivariate pattern analysis. Brain. 2012;135:1498–1507. doi: 10.1093/brain/aws059. [DOI] [PubMed] [Google Scholar]
- 49.Damasio A, Damasio H, Tranel D. Persistence of feelings and sentience after bilateral damage of the insula. Cereb Cortex. 2013;23:833–846. doi: 10.1093/cercor/bhs077. [DOI] [PMC free article] [PubMed] [Google Scholar]
- 50.Cauda F, D’Agata F, Sacco K, Duca S, Geminiani G, Vercelli A. Functional connectivity of the insula in the resting brain. Neuroimage. 2011;55:8–23. doi: 10.1016/j.neuroimage.2010.11.049. [DOI] [PubMed] [Google Scholar]
- 51.Chang LJ, Yarkoni T, Khaw MW, Sanfey AG. Decoding the role of the insula in human cognition: Functional parcellation and large-scale reverse inference. Cereb Cortex. 2013;23:739–749. doi: 10.1093/cercor/bhs065. [DOI] [PMC free article] [PubMed] [Google Scholar]
- 52.Christoff K, Gabrieli JDE. The frontopolar cortex and human cognition: Evidence for a rostrocaudal hierarchical organization within the human prefrontal cortex. Psychobiology. 2000;28:168–186. [Google Scholar]
- 53.Fowler JC, Patriquin M, Madan A, Allen JG, Frueh BC, Oldham JM. Early identification of treatment non-response utilizing the Patient Health Questionnaire (PHQ-9) J Psychiatr Res. 2015;68:114–119. doi: 10.1016/j.jpsychires.2015.06.018. [DOI] [PubMed] [Google Scholar]
- 54.Fu CHY, Steiner H, Costafreda SG. Predictive neural biomarkers of clinical response in depression: A meta-analysis of functional and structural neuroimaging studies of pharmacological and psychological therapies. Neurobiol Dis. 2013;52:75–83. doi: 10.1016/j.nbd.2012.05.008. [DOI] [PubMed] [Google Scholar]
- 55.McGrath CL, Kelley ME, Holtzheimer PE, III, et al. Toward a Neuroimaging Treatment Selection Biomarker for Major Depressive Disorder. Jama Psychiatry. 2013;70:821–829. doi: 10.1001/jamapsychiatry.2013.143. [DOI] [PMC free article] [PubMed] [Google Scholar]
- 56.LeDoux JE. Emotion circuits in the brain. Annu Rev Neurosci. 2000;23:155–184. doi: 10.1146/annurev.neuro.23.1.155. [DOI] [PubMed] [Google Scholar]
- 57.Grotegerd D, Stuhrmann A, Kugel H, et al. Amygdala excitability to subliminally presented emotional faces distinguishes unipolar and bipolar depression: An fMRI and pattern classification study. Hum Brain Mapp. 2014;35:2995–3007. doi: 10.1002/hbm.22380. [DOI] [PMC free article] [PubMed] [Google Scholar]
- 58.Zeidman P, Maguire EA. Anterior hippocampus: the anatomy of perception, imagination and episodic memory. Nat Rev Neurosci. 2016;17:173–182. doi: 10.1038/nrn.2015.24. [DOI] [PMC free article] [PubMed] [Google Scholar]
- 59.Arciniegas DB. Emotion. In: Arciniegas DB, Anderson CA, Filley CM, editors. Behavioral neurology & neuropsychiatry. Cambridge: Cambridge University Press; 2013. [Google Scholar]
- 60.Hafeman DM, Chang KD, Garrett AS, Sanders EM, Phillips ML. Effects of medication on neuroimaging findings in bipolar disorder: an updated review. Bipolar Disord. 2012;14:375–410. doi: 10.1111/j.1399-5618.2012.01023.x. [DOI] [PubMed] [Google Scholar]
- 61.Cole DM, Smith SM, Beckmann CF. Advances and pitfalls in the analysis and interpretation of resting-state FMRI data. Front Syst Neurosci. 2010;4:8. doi: 10.3389/fnsys.2010.00008. [DOI] [PMC free article] [PubMed] [Google Scholar]
- 62.Battisti WP, Wager E, Baltzer L, et al. Good publication practice for communicating company-sponsored medical research: GPP3. Ann Intern Med. 2015;163:461–464. doi: 10.7326/M15-0288. [DOI] [PubMed] [Google Scholar]