Abstract
Understanding of the structure and the origin of genetic variation patterns in the laboratory inbred mouse provides insight into the utility of the mouse model for studying human complex diseases and strategies for disease gene mapping. In order to address this issue, we have constructed a multistrain, high-resolution haplotype map for the 99-Mb mouse Chromosome 16 using ∼70,000 single nucleotide polymorphism (SNP) markers derived from whole-genome shotgun sequencing of five laboratory inbred strains. We discovered that large polymorphic blocks (i.e., regions where only two haplotypes, thus one SNP conformation, are found in the five strains), large monomorphic blocks (i.e., regions where the five strains share the same haplotype), and fragmented blocks (i.e., regions of greater complexity not resembling at all the first two categories) span 50%, 18%, and 32% of the chromosome, respectively. The haplotype map has 98% accuracy in predicting mouse genotypes in two other studies. Its predictions are also confirmed by experimental results obtained from resequencing of 40-kb genomic sequences at 21 distinct genomic loci in 13 laboratory inbred strains and 12 wild-derived strains. We demonstrate that historic recombination, intra-subspecies variations and inter-subspecies variations have all contributed to the formation of the three distinctive genetic signatures. The results suggest that the controlled complexity of the laboratory inbred strains may provide a means for uncovering the biological factors that have shaped genetic variation patterns.
The laboratory inbred mouse is the primary mammalian model organism for human disease research owing in part to its utility in identifying genetic components underlying complex common diseases in humans. However, identifying candidate genes by conventional mapping techniques after initial low-resolution mapping is a labor-intensive and time-consuming process. An accurate high-resolution multistrain haplotype map of the mouse genome may accelerate the discovery of causative variants in the initially large candidate regions. By making possible the comparison of haplotype structure across different inbred strains used in the crosses, researchers will be able to identify haplotype blocks that segregate in concert with phenotypic differences, thereby reducing the number of potential candidates for further analysis from hundreds to a more manageable number (Grupe et al. 2001; Park et al. 2003).
Two previous studies, one by the Whitehead Institute (WI) (Wade et al. 2002) and the other by the Genomics Institute of the Novartis Research Foundation (GNF) (Wiltshire et al. 2003), have examined genome-wide genetic variation patterns in laboratory inbred strains using low-resolution SNP data. Both studies have concluded that there is lack of genetic heterogeneity in common laboratory mouse strains and that the majority of the haplotype blocks are >1 Mb long. In an earlier study, we constructed a multistrain, medium-resolution haplotype map of an 8-Mb region on Chromosome 19 (Park et al. 2003), which reveals a different pattern. Nonhomogeneous SNP density was observed across the region, and most of the haplotype blocks were only 80-100 kb long. Two recent studies (Frazer et al. 2004; Yalcin et al. 2004) independently conducted multistrain high-resolution SNP analyses of genomic regions of ∼5 Mb and in both cases reported the discovery of a complex haplotype structure. These detailed but regionally limited results suggest that higher-density SNP data across multiple strains might reveal a haplotype structure different from what was derived from low-density, pairwise strain analysis in the previous studies.
To gain insight into the high-resolution haplotype structure of the common laboratory inbred mouse at the genome scale, we analyzed genetic variation patterns of 70,795 SNPs discovered from high-quality variations among the five laboratory strains in the Celera whole-genomic shotgun sequence of the 99-Mb mouse Chromosome 16 (Mural et al. 2002). The SNP density of this data set is 30-fold and 185-fold higher than those in the WI and GNF studies, respectively (Table 1). We discovered that the laboratory mouse genome is composed of three distinctive genetic variation patterns—large monomorphic haplotype blocks, large polymorphic haplotype blocks, and fragmented haplotype blocks—that are likely to be shaped by historic recombination as well as intra- and inter-subspecies variation.
Table 1.
Summary of SNP mapping from Celera, WI, and GNF data
| Overlap with other data sets
|
||||||||
|---|---|---|---|---|---|---|---|---|
| Sourcea | All SNPs | Laboratory inbred strains | Mapped SNPs | Inconsistently mapped SNPs | SNPs per 100 kb | Celera | WI | GNF |
| Celerab | 70,795 | C57BL/6J, 129S1/SvlmJ, A/J, DBA/2J, 129X1/SvJ | 68,848 (97%) | 306 (0.4%) | 75 | — | 835 (1.2%) | 25 (0.04%) |
| WIc | 2347 | C57BL/6J, 129S1/SvlmJ, C3H/H3, BALB/cByJ | 2347 (100%) | 0 (0%) | 2.6 | 835 (35.6%) | — | 1 (0.04%) |
| GNFd | 477 | C57BL/6J, A/J, BALB/cByJ, AKR/J, DBA/2J, 129S1/SvlmJ, C3H/He | 391 (82%) | 0 (0%) | 0.4 | 25 (6.4%) | 1 (0.2%) | — |
All SNP data were obtained from the Mouse Phenome Database at the Jackson Laboratory (http://www.jax.org/phenome).
Celera SNPs were obtained from the file mpd 147.zip in the project “Celera Genomics SNPs.” As described in Wiltshire et al. (2003), SNPs in the Celera data set were discovered from Celera Assembly R13 in 2003. In this study, SNPs with inconsistent mapping order on the Celera and MGSCv3 assembly were identified and excluded from haplotype analysis. There is no additional filtering other than that.
WI SNPs were obtained from the file mpd127big.zip in the project “MIT mouse SNP data-2.”
GNF SNPs were obtained from the files mpd 133strains.zip and mpd133loc.zip in the project “GNF mouse SNP data.”
Results
Construction of a multistrain haplotype map of mouse Chromosome 16
The Celera data set consists of high-density SNPs from five laboratory inbred strains, from which SNP genotypes can readily be assembled into haplotypes across the entire chromosome. By comparing haplotypes from multiple strains, it is possible to identify haplotype blocks by patterns of linkage disequilibrium between the SNPs, a procedure that has been used to define haplotype blocks for the human genome (Patil et al. 2001; Gabriel et al. 2002). Previous studies reported that most of the laboratory mouse genome consists of two ancestral haplotypes (Bishop et al. 1985; Wade et al. 2002; Wiltshire et al. 2003), which suggests that defining a haplotype block by requiring that the majority of SNPs within a block be in perfect linkage disequilibrium (which results in two haplotypes per block) is a reasonable starting point for investigating the haplotype structure of the laboratory mouse genome. Thus, we implemented the following procedure: A haplotype block is initiated with two adjacent SNPs and is extended one SNP at a time until more than two haplotypes are found; a single SNP that breaks the two-haplotype structure is considered an exception and does not affect block extension (see Methods for details). Approximately 5% of the SNPs turned out to be such “orphan” SNPs, while the remaining 95% form 2083 haplotype blocks, resulting in an average of 38.5-kb haplotype block size (see http://lpg.nci.nih.gov/mulan/ for details).
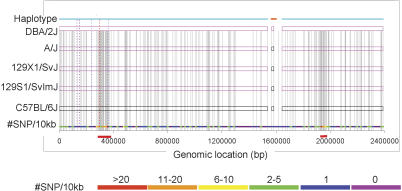
A close look at the haplotype structure reveals that, in some regions, adjacent haplotype blocks with the same allelic variation pattern are interrupted by small haplotype blocks (Fig. 1). Some of these small blocks make only a minor contribution to the local genetic diversity but can disrupt the contiguity of the global haplotype structure. Therefore, we implemented a procedure to meld neighboring blocks with the same haplotype variation pattern if the number of inconsistent SNPs (i.e., the SNPs whose allelic variation patterns are inconsistent with the haplotype variation pattern) is <5% of the total SNPs in the melded block. In the example in Figure 1, we were able to meld the two haplotype blocks into a single 2.4-Mb block because only three out of 352 SNPs in this region are inconsistent with the dominant haplotype variation pattern. In all, 301 blocks were merged into 36 “melded” blocks. The average haplotype block size after melding is 44.6 kb.
Figure 1.
Haplotype structure of a 2.4-Mb region at 82,865,855-85,256,831 on Chromosome 16. The top horizontal line uses color to label a distinct haplotype pattern. The region contains two large haplotype blocks (marked by the lines with cyan color at the top) that form a 2.4-Mb melded haplotype block because the small “disruptive” block at the middle (the top line with orange color) contains <5% of all SNPs in the region. Rectangles with different colors represent haplotypes in each strain; (magenta rectangles) allelic variations different from the C57BL/6J strain, (black rectangles) allelic variations identical to the C57BL/6J strain. SNP density (defined as the number of SNPs per 10 kb) is displayed in color at the bottom. Vertical gray lines across the strains display individual SNP positions. The x-axis labels the base-pair position in the region. Dotted vertical lines are regions that were selected for resequencing.
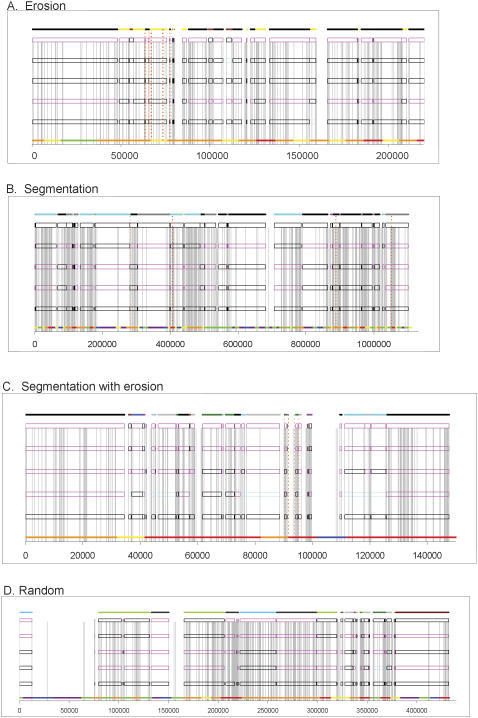
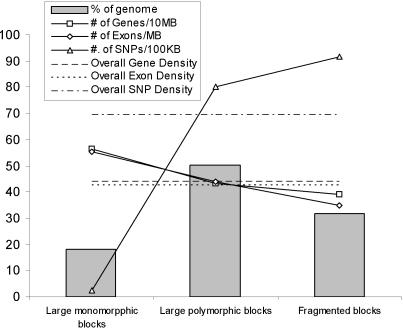
Three major patterns of genetic variation emerged from the global haplotype structure. Large blocks with few polymorphisms (“monomorphic blocks”), defined as large regions (>1 Mb) with extremely low SNP density (<0.5 SNPs per 10 kb) and inconsistent haplotype variation patterns (each haplotype variation pattern spans <10 SNPs), cover 18% of the chromosome. The remaining regions consist of large polymorphic haplotype blocks (≥200 kb) that span 50% of the chromosome (Fig. 1) and fragmented haplotype blocks that span 32% of the chromosome and include 42% of SNPs (Fig. 2). The fragmented blocks take four forms: (1) erosion of a major haplotype pattern by a variety of small haplotypes blocks (Fig. 2A); (2) segmentation of two or three haplotype patterns over a long range (Fig. 2B); (3) segmentation coupled with erosion (Fig. 2C); and (4) random scrambling (Fig. 2D). There is an inverse relationship between gene density and SNP density in the three major genetic variation patterns. Large monomorphic blocks have the highest gene density and the lowest SNP density, while the fragmented blocks have the lowest gene density but the highest SNP density (Fig. 3).
Figure 2.
Four types of fragmented haplotype blocks. (A) Erosion of a major ancestral haplotype pattern (labeled as the black horizontal line at the top) with a variety of small haplotypes in a 220-kb region between 34,013,629 and 34,233,629 bp. (B) Segmentation of three haplotype patterns (in cyan, gray, and black color lines at the top) in a 1-Mb region between 8,398,561 and 9,500,697 bp. (C) Erosion within segmentation at 45,248,233-45,395,930 bp. (D) Random scrambling of multiple haplotype blocks in a 500-kb region between 73,247,019 and 73,679,138 bp.
Figure 3.
Distribution of large monomorphic haplotype blocks, large polymorphic haplotype blocks, and fragmented blocks on Chromosome 16. The distribution of genes and exons was derived from the 455 mouse RefSeq records mapped to Chromosome 16.
Assessing the accuracy of the Chromosome 16 haplotype map constructed in this study
A haplotype block is expected to capture the allelic variation pattern of a genomic region. Therefore, the accuracy of a haplotype map can be measured by how well its blocks predict the allelic variation of polymorphic markers that were not included in haplotype block construction. To assess the accuracy of the haplotype map constructed in this study, we measured the consistency between the allelic variation patterns depicted in haplotype blocks derived from our study with genotypes of SNPs that were assayed in WI and GNF studies. In this analysis, only SNPs unique to the WI and GNF studies were included, and only the strains common between the studies were analyzed. More specifically, C57BL/6J and 129S1/SvImJ are the strains common to the WI and Celera data sets; C57BL/6J, 129S1/SvImJ, DBA/2J, and A/J are common to GNF and Celera. We found that the haplotype blocks defined in this study from the Celera genotype data were consistent with 98% and 91% of the genotype data in the WI and GNF studies, respectively. In addition, the distribution of WI SNPs across large polymorphic blocks, large monomorphic blocks, and fragmented haplotype blocks is similar to that of the Celera SNPs, even when including SNPs derived from the two strains unique in the WI study, C3H/He and BALB/cByJ (Table 2).
Table 2.
SNP distribution in the three genetic variation patterns
| % of total SNPs
|
||||
|---|---|---|---|---|
| Data source | Large monomorphic | Large polymorphic | Fragmented blocks | p-value of χ2 testa |
| Celera | ||||
| All strains | 0.6 | 57.65 | 41.75 | N/A |
| WI | ||||
| Common strainsb | 0.22 | 58.45 | 41.34 | 0.91 |
| All strains | 0.98 | 60.12 | 38.90 | 0.88 |
The p-value measures the similarity of SNP distribution in the WI data set with that of the Celera SNPs in these three regions.
The two strains included in both the WI and the Celera samples are C57BL/6J and 129S1/Svlmj.
Experimental validation by resequencing
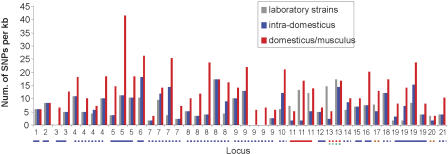
To validate the predicted haplotype structure, to extend our knowledge of the genetic diversity in the common laboratory inbred strains and to better understand the origins of the patterns of genetic variation, we resequenced 39,495 bp of genomic sequence. The regions selected for resequencing comprised 44 internally contiguous genomic segments at 21 distinct genomic loci found in our initial analysis to consist of 10 large blocks and 11 fragmented blocks (Fig. 4; Supplemental Table S4). The target regions were selected to validate or investigate the following: (1) regions defined as SNP-poor across all strains in the WI study but found to be SNP rich in our analysis; (2) large haplotype blocks with varying SNP density but the same allelic variation pattern; (3) the discrepancy between genotypes in the WI and GNF studies and the haplotype blocks constructed in this study; (4) the validity of “orphan” SNPs that break a haplotype block; (5) fragmented haplotype blocks (including segmentation and erosion); (6) the validity of SNP-poor regions discovered in this study; (7) the validity of SNPs in SNP-poor regions found in the current analysis; (8) genetic variations between the two 129 strains (129S1/SvImJ, 129X1/SvJ); and (9) the relationship between gene structure and SNP density. Additional information about target region selection can be found in the Supplemental material and Supplemental Table S4. A total of 25 inbred mice were assayed: 13 common laboratory strains and 12 wild-derived strains from four subspecies of the species Mus musculus: domesticus, musculus, molossinus, and castaneus as well as the species Mus spretus. In what follows, we use the mouse strain nomenclature developed by the Jackson Laboratory, in which the classical laboratory mouse stocks are referred to as “laboratory inbred strains” and descendants of recently captured wild mice as “wild-derived inbred strains.” A total of 1004 substitution SNPs (ss32467313-ss32468316 in the NCBI dbSNP database), including six triallelic markers, were found across all strains, 225 of which were polymorphic among the laboratory inbred strains. There were a total of 132 Celera SNPs, 22 WI SNPs, and eight GNF SNPs in the regions selected for resequencing. The validation rates were 99%, 95%, and 63% for the SNPs previously described in the Celera, the WI, and the GNF data sets in these regions, respectively. In each case, the resequencing results are in agreement with the haplotype block structure defined in this study (details are in the Supplemental material and http://lpg.nci.nih.gov/mulan/).
Figure 4.
Resequencing results of the 44 genomic segments at 21 genomic loci. The y-axis shows the SNP density (number of the SNPs per kilobase) derived from resequencing that represents variations in 13 laboratory inbred strains, intra-subspecies variations in wild-derived inbred strains of domesticus subspecies (intra-domesticus), and inter-subspecies variations between domesticus and musculus subspecies (domesticus/musculus). At the x-axis, each segment is labeled by its genome locus; multiple segments selected from the same locus are labeled with the same name. Genomic loci are shown in the same numeric order as in Supplemental Table S4. A locus is underlined with a solid line if it is a large haplotype block, a dotted line if it is a fragmented block; the line color indicates whether the variations in the laboratory inbred strains arise from intra-subspecies variations in domesticus (blue), inter-subspecies variations between domesticus and molossinus (red), domesticus versus haplotypes only found in laboratory inbred strains (brown), or molossinus versus haplotypes only found in laboratory inbred strains (green).
Variations of SNP density within a haplotype block
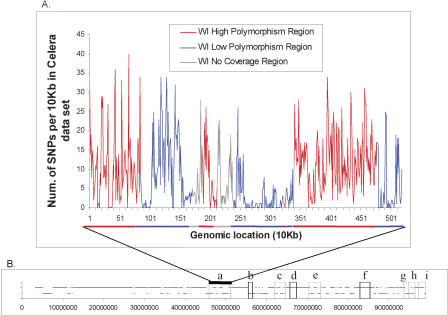
In the multistrain haplotype map that we constructed using the Celera data, the vast majority (>95%) of the SNPs within a block have the same allelic variation pattern, but the SNP density can vary considerably. The number of SNPs per segment in successive 10-kb intervals ranges from 0 to more than 20. For example, in the largest melded block (5.2 Mb) located at 45.9-51.1 Mb on Chromosome 16, in which the haplotype of C57BL/6J is different from the one shared by the four other strains, 97% of the 4119 SNPs are consistent with the dominant haplotype variation. However, the SNPs are not evenly distributed over this large physical region. SNP-poor segments (0 SNP per 10 kb), which cover 15% of the block, are interspersed with SNP-rich segments (>20 SNPs per 10 kb) (Fig. 5A). Such a pattern of varying SNP rate across a large haplotype block is common on Chromosome 16. Of the nine largest (>1 Mb) melded blocks in which C57BL/6J and 129S1/SvImJ strains have different haplotypes, eight show considerable variation in SNP density (details in the Supplemental material). Six of the eight melded blocks with differing SNP density were split into multiple haplotype blocks on the WI map of C57BL/6J and 129S1/SvImJ (Fig. 5B). The one exception is a 2.4-Mb block located at 82.88-85.26 Mb in which 85% of the genomic region has low SNP density (≤1 SNPs per 10 kb). However, even in this region, two subregions, one 90 kb and the other 60 kb long, are SNP-rich and contain 50% of the SNPs of the entire block (Fig. 1).
Figure 5.
(A) SNP density (number of SNPs per 10 kb) in the largest melded block (5.2 Mb) discovered in our analysis. The haplotype of C57BL/6J is different from the one shared by the four other strains, 129S1/SvImJ, 129X1/SvJ, A/J, and DBA/2J. This haplotype block was split into eight WI blocks, and the red and blue colors label the corresponding WI blocks in which C57BL/6J and 129S1/SvImJ were projected to have different or the same alleles in the WI study. (Gray area) Regions with no data in the WI map. (B) Locations of the nine largest melded haplotype blocks defined by our analysis in which C57BL/6J and 129S1/SvImJ have different haplotypes. The WI haplotype map was extracted from the file (http://www.broad.mit.edu/personal/claire/strainsnplist_all.xls), and the melded haplotype blocks in our study were enclosed in rectangles; those that are labeled with a gray line (i.e., a, c, e, g, h, and i) represent a split of melded haplotype blocks into multiple WI blocks.
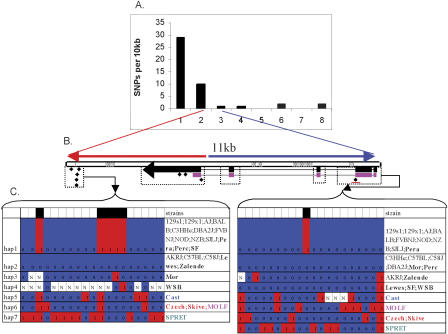
We were interested in verifying the high variability of SNP density within a haplotype block and investigating the cause of sharp transitions in SNP density. In the resequencing experiment, we selected juxtaposed regions of consistently high and low SNP density in the 2.4-Mb large block described above (Fig. 1) and a 77-kb small block located at 35.61-35.69 Mb (Fig. 6). The second small block was particularly interesting because it includes a 12-kb genomic sequence that encodes a protein with unknown function (GenBank accession NM_145481). As shown in Figure 6, the genomic sequence that encompasses protein-coding exons 1-4, including the introns, is SNP-poor (1 SNP per 10 kb), while the mostly noncoding exon 5 (86% of which is 3′-UTR) and its 3′ downstream region are SNP-rich (10-29 SNP per 10 kb).
Figure 6.
(A) SNP density (defined as the number of SNPs per 10 kb) of a 70-kb haplotype block. The x-axis labels the 10-kb intervals in this block. (B) The 11-kb genomic region within this block encodes mRNA NM_145481. The region was split into two sections labeled with red and blue lines to represent SNP-rich and SNP-poor segments, respectively. (Gray boxes) Regions with repetitive sequence. The mRNA is transcribed in reverse orientation, and the exons are labeled with black rectangles. (Magenta) The coding regions. (Black diamonds) The SNPs in the Celera data. The last SNP in this region (with a red underline) is the only missense variation in this region. (Dotted rectangles) The regions selected for resequencing. (C) Haplotypes constructed with SNPs discovered by resequencing. (Black) The SNPs discovered in the five Celera strains. The two alleles of a SNP are labeled as 0 or 1; (N) an ambiguous allele. The wild-derived inbred strains are labeled in bold, with colors indicating strains of the domesticus (black), musculus (red), molossinus (magenta), and castaneus (blue) subspecies. (Green) M. spretus species.
We resequenced 2.2 kb of the SNP-rich region and 2.0 kb of the SNP-poor region. Among the 13 laboratory inbred strains, 27 and three SNPs were found in the SNP-rich and SNP-poor regions, respectively. The SNP-poor region contains the only missense variation (Phe200Leu in the protein sequence NP_663456.1) in the laboratory inbred strains. In both SNP-poor and SNP-rich regions, the haplotypes of the laboratory inbred strains can be found in the wild-derived inbred strains of domesticus but in no other subspecies (Fig. 6C). There is no transition from inter-subspecies to intra-subspecies in the ancestral origin of genetic variations in the laboratory inbred strains even though there is a sharp transition from high SNP rate to low SNP rate at this locus. Similar results were obtained in the resequencing of one SNP-rich segment and three SNP-poor segments in the 2.4-Mb large haplotype block (details in the Supplemental material).
Analysis of haplotypes and SNPs in laboratory inbred strains and wild-derived inbred strains
A total of 276 haplotypes were assembled in the 44 contiguous genomic segments that were resequenced. Of the haplotypes, 110 were found in the laboratory inbred strains, while the remaining ones were found only in wild-derived inbred strains. Three wild-derived inbred strains, SF/CamEi, PERA/Ei, and PERC/Ei, currently listed as Mus mus musculus subspecies on the Jackson Laboratory's mice data sheet Web page (http://jaxmice.jax.org), have 70%-77% of haplotypes in common with domesticus strains and <10% of their haplotypes in common with the two other musculus strains (CZECHII/Ei and SKIVE/Ei) (details in Supplemental Table S10). In all analyses presented here, we refer to SF/CamEi, PERA/Ei, and PERC/Ei as strains of domesticus subspecies instead of musculus subspecies.
Of the 110 haplotypes in the laboratory inbred strains, 91 (84%) were also found in the wild inbred strains of domesticus subspecies, while none matched exclusively to the European musculus strains (CZECHII/Ei and SKIVE/Ei). Another 5% and 1% of the haplotypes in the laboratory strains were found in the Asian mice molossinus and castaneus, respectively. The remaining 10% of haplotypes could only be found in the laboratory inbred strains.
The 44 contiguous genomic segments were sampled from 21 distinct genomic loci. In 17 out of the 21 genomic loci, SNPs in the laboratory inbred strains arise from intra-subspecies variations in the wild-derived inbred strains of domesticus subspecies (Fig. 4). These 17 loci include 80% of all SNPs in the laboratory inbred strains discovered by resequencing. In contrast, inter-subspecies variations between molossinus and domesticus contribute to SNPs in the laboratory inbred strains at only two loci. At the remaining two loci, SNPs in laboratory strains arise from variations between haplotypes of domesticus subspecies and haplotypes found only in the laboratory inbred strains.
Analysis of the origin of segmentation and erosion blocks
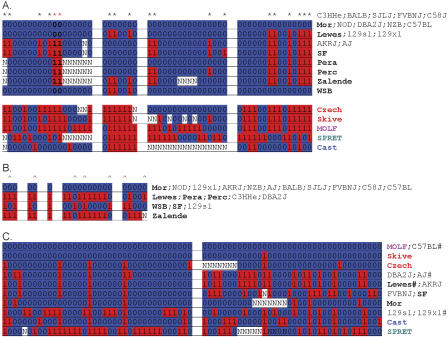
We conjecture that historical recombination is the cause of the alternating haplotype variation pattern that we observe in segmentation blocks. To analyze historic recombination in the laboratory inbred strains and their related wild-derived inbred strains, we resequenced four segments inside a 1-Mb region of segmentation (Fig. 2B) and applied the four-gamete test (FGT). For a pair of segments A and B, each with two alleles (denoted as A0, A1, B0, and B1, respectively), a recombination between the two segments will result in four gametes, namely, A0B0, A1B0, A0B1, and A1B1, being observed in the sample. The haplotypes of the 13 laboratory inbred strains in this region can be directly attributed to the wild-derived strains of domesticus subspecies (Fig. 7A). All four gametes were observed in the seven wild-derived domesticus strains for the pair consisting of segment 2 and segment 3 but not for the pair segment 3 and segment 4. In segment 1, a third haplotype was found in the wild-derived strains PERA/Pk, PERC/Ei, and ZALENDE/Ei but not in the laboratory inbred strains. Haplotypes of the last two SNPs polymorphic in domesticus strains (marked by red asterisks in Fig. 7A) in segment 1 are biallelic (among the wild-derived domesticus strains) and they pass the FGT (i.e., show four gametes) with the haplotypes of all SNPs in segment 2, showing a historic recombination event between segment 1 and 2 in the wild domesticus population. The failure of segments 3 and 4 to pass the FGT may be due to the limited sample size of 13 laboratory inbred strains and seven wild-derived domesticus strains, which is small for a population study, and therefore might generate false-negative results.
Figure 7.
Resequencing results in regions of fragmented blocks. The wild-derived inbred strains are labeled in bold with the same color code as Figure 6. (A) Four segments in the segmentation blocks in Figure 2B. The distance between the segments is 124,387 bp, 481,367 bp, and 163,713 bp, respectively. (*) Markers that are polymorphic in laboratory inbred strains and wild-derived inbred strains of domesticus subspecies. (B) Five segments in the erosion blocks in Figure 2A. The distance between the segments is 1474 bp, 755 bp, 6117 bp, and 3219 bp, respectively. Only markers that are polymorphic in laboratory inbred strains and wild-derived inbred strains of domesticus subspecies are shown. (^)SNPs that have genotypes inconsistent with the dominant haplotype variation pattern. (C) Two segments in a 5-kb region of erosion blocks (locus 13 in Fig. 4). The distance between the two is 2080 bp. A strain name appended with a # indicates that additional strains from the same subspecies were not displayed because of lack of space. The haplotype of DBA/2J and A/J is likely to be of domesticus origin because it is very similar to that of Lewes (LEWES/Ei). The haplotype of the two 129 strains does not resemble any wild-derived strains in this sample.
Unlike segmentation blocks in which several haplotype variation patterns alternate, erosion blocks are characterized by a single, predominant variation pattern frequently interrupted (eroded) by other variation patterns. The genomic span of predominant variation patterns varies from 10 kb to 1.2 Mb; the erosions usually contain a significant proportion (17%-35%) of the SNPs. One of the loci selected for resequencing is a 220-kb region in which the erosion blocks contain 32% of SNPs in the region (Fig. 2A). The five segments selected for resequencing span 14,777 bp. Three haplotypes were found in the 13 laboratory inbred strains; each can be directly and exclusively attributed to the domesticus subspecies (Fig. 7B). SNP pairs within a segment or between adjacent segments all fail the FGT and there are seven interruptions to the predominant variation pattern. The frequent interruptions to the dominant variation pattern coupled with lack of evidence for historic recombination indicate that it is unlikely the region is a recombination hotspot. Rather, three out of the four haplotypes found in the wild domesticus population are present in the laboratory inbred strains. The predominant variation pattern shows the divergence between MOR/Rk and LEWES/Ei, while the erosions arise because of the minor differences between MOR/Rk and WSB/Ei in this region.
Another region of erosion blocks surveyed by resequencing is located at 45.1-45.9 Mb on Chromosome 16 (locus 13 in Fig. 4). There, the predominant variation pattern is generated by differences between C57BL/6J and the other Celera strains; four additional variation patterns form the erosions in this region; they contain 30% of the SNPs. The resequencing results show that C57BL/6J and C58/J have the same haplotype as molossinus, while the four haplotypes found in the other strains are likely to be of domesticus origin (Fig. 7C). Thus, this region has a mixture of inter- and intra-subspecies variations.
Phylogenetic analysis
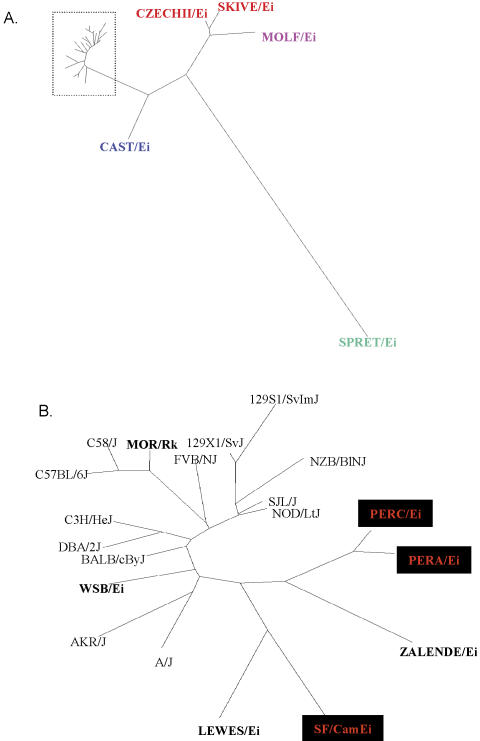
To investigate the origin of the laboratory inbred strains and to determine whether the results obtained from Chromosome 16 SNPs are compatible with those derived from genome-wide polymorphic markers, we constructed two phylogenetic trees, one using 1004 Chromosome 16 SNPs identified by resequencing (Fig. 8) and the other using 266 genome-wide STRP markers (Witmer et al. 2003; Supplemental Fig. 10). The trees constructed with the two data sets show near identical strain-strain relationship. Both fit well with the known lineage of wild-derived inbred strains: there is a three-way split among domesticus, castaneus, and musculus-molossinus, the three subspecies of Mus musculus species. SPRET/Ei, which belongs to a different species (i.e., Mus spretus), is far more distant from the rest of the strains of M. musculus species. SF/CamEi, PERA/Ei, and PERC/Ei are in the same cluster as the five wild-derived inbred strains of M. m. domesticus subspecies. In both trees, all laboratory inbred strains are the in the same cluster as the wild-derived inbred strains of M. m. domesticus.
Figure 8.
Phylogenetic tree constructed with 1004 SNPs discovered from resequencing of 13 laboratory inbred strains and 12 wild-derived inbred strains (labeled in bold) from five subspecies: musculus (SKIVE/Ei and CZECHII/Ei), molossinus (MOLF/Ei), castaneus (CAST/Ei), M. spretus (SPRET/Ei), and domesticus (LEWES/Ei, MOR/Rk, WSB/Ei, ZALENDE/Ei, PERA/Pk, PERC/Ei, and SF/CamEi). The phylogeny was constructed using the dnadist program in the PHYLIP package (http://evolution.genetics.washington.edu/phylip.html). The branch length information was used to plot evolutionary distance between strains in the DrawTree program. (A) Phylogeny of all strains. (B) Detailed phylogenetic tree of species in the dotted rectangle in A.
Discussion
Using high-resolution, multiple-strain SNP data of the 99-Mb mouse Chromosome 16, three major genetic variation patterns emerged from the global haplotype structure of the laboratory mouse genome: large monomorphic blocks, large haplotype blocks, and fragmented blocks. This structure is more complex than the mosaic structure of alternating large segments of low or high SNP density reported in a previous study (Wade et al. 2002). It has a high accuracy (91%-98%) in predicting allelic variations in the other two studies compared to the 65%-77% for the haplotype blocks constructed with a low-resolution SNP assay in previous studies (details in Supplemental material). We experimentally validated this structure by resequencing ∼40 kb of genomic sequence in 13 laboratory inbred strains and 12 wild-derived inbred strains. Variation in haplotype block size has also been reported in two recent studies (Frazer et al 2004; Yalcin et al. 2004) based on analyses of ∼5 Mb of fine-resolution haplotype structure across multiple strains. These findings suggest that a high-resolution SNP map is required to obtain an accurate description of the genetic variations in the laboratory mouse genome.
In a previous study, Wade et al. (2002) suggested that regions of low and high SNP density, derived from pairwise comparisons of laboratory strains, indicate common and different subspecies origin, respectively. However, in the resequencing data we observed the following: (1) High-density SNPs in the laboratory inbred strains can arise from either intra- or inter-subspecies variations (Fig. 4). (2) There is substantial global and local fluctuation in both intra- and inter-subspecies variation rates (Fig. 4). (3) In the blocks defined in this study, a sharp transition from high to low SNP rate within a block does not correspond to a transition from inter-subspecies to intra-subspecies variations in the laboratory inbred strains (Fig. 6; Supplemental material). The genome-scale analysis of SNP density in this study was based on the Celera SNPs identified using the whole-genome shotgun sequence reads. In the regions selected for experimental validation, we found the SNP density in the Celera data to be consistent with the results obtained by resequencing. However, we cannot exclude the possibility that artifact in whole-genome shotgun assembly, such as sequencing gaps or failure to assemble divergent fragments, will occasionally result in artificial fluctuation in SNP density. Interestingly, Yalcin et al. (2004) analyzed a 4.8-Mb region by resequencing and also reported that the SNP density varies in an unstructured manner. These results indicate that variations in SNP rate may not always correlate to a change in the phylogenetic origin of a genomic segment.
Inter-subspecies variations have been postulated to be the main contributor to the genetic diversity in the laboratory mouse genome based on the observation that most of these strains carry a M. m. domesticus mitochondrial DNA (Ferris et al. 1982) and a M. m. musculus Y-chromosome (Bishop et al. 1985) (later modified to be the Asian Mus mus molossinus Y-chromosome) (Nagamine et al. 1992; Tucker et al. 1992). A previous analysis of 27 genomic segments by Wade et al. (2002) also reported a major contribution of inter-subspecies (primarily domesticus vs. molossinus) to the genetic diversity of the laboratory mouse genome. However, using data obtained from resequencing multiple strains of wild-derived Mus mus domesticus and M. m. musculus subspecies, it was shown in this study that the majority (80%) of the SNPs in the laboratory strains were intra-subspecies variations of M. m. domesticus rather than inter-subspecies variation. The regions selected for resequencing by Wade et al. (2002) consist of the most divergent segments in the laboratory mouse genome; the SNP density distribution in the regions we analyzed is similar to that of the entire Chromosome 16 (Supplemental Fig. S5). Thus, it is possible that selection bias toward the most divergent segments might have led Wade et al. (2002) to overestimate inter-subspecies variations in the laboratory mouse genome.
In regions of fragmented blocks, a pattern of erosion or segmentation usually spans multiple blocks. In some cases, all haplotypes in the region defined by an erosion or a segmentation pattern were originated from the same subspecies, and the complexity of the haplotype structure might be comparable to that found in an outbred population with limited founders. Erosion blocks indicate that additional haplotypes similar to the two predominant haplotypes are present in the region. Although our sample of seven strains of wild-derived domesticus subspecies is insufficient to determine SNP population frequency, we suspect that the erosions arose as a consequence of low-frequency SNPs in the wild population because such a pattern of two predominant haplotypes with completely different alleles (dubbed “yin yang” haplotypes) was also found in human when low-frequency SNPs (<10%) were filtered (Zhang et al. 2003). The presence of four gametes in the strains of wild-derived domesticus subspecies in segmentation blocks shows that the pattern could arise from historical recombination in the wild domesticus population in addition to previously proposed inter-subspecies recombination between the European domesticus and Asian mice (Wade et al. 2002; Frazer et al. 2004). Interestingly, we noticed that recombination hotspots collected from reciprocal cross of (C57BL/6J × SPRET/Ei) F1 × SPRET/Ei (Rowe et al. 2003) are overrepresented in segmentation blocks (details in Supplemental material).
Methods
Compute haplotype blocks using the Celera SNP data
Genotype data were converted to integer number 1 or 2 to represent alleles the same as or different from the allele in the C57BL/6J strain, respectively. We found that 34% of the genotypes in the Celera data were missing and represented these as Ns. A haplotype block was initiated with a seed of two adjacent SNPs; we required the two “seed SNPs” to have a minimum of two unambiguous haplotypes so that a haplotype block would not be initiated with phase ambiguous haplotypes. For example, two adjacent SNPs with genotypes 1N, N1, 2N, N2 for each of four strains would not qualify as a seed. Haplotypes for all strains were collected to assemble a set of nonredundant, reference haplotypes for each block. If a block had only two reference haplotypes, the current block was considered valid and was extended by 1 SNP for the next iteration of reference haplotype assembly. To assemble the reference haplotypes, the mouse strains were processed in ascending order of their number of missing genotypes. A new reference haplotype was created if the haplotype of the current strain did not match any of the existing reference haplotypes. Otherwise, the matching reference haplotype was updated if the current haplotype could replace missing alleles in the reference haplotype. The program was executed in multiple iterations; after each iteration, “orphan” SNPs that form 1-SNP blocks were removed; and the program ends when there is no remaining “orphan” SNP. The program was iterated three times to process the Celera SNP data, generating a total of 2083 blocks with 65,068 SNPs.
A melding program was developed to merge adjacent haplotype blocks with the same allelic variation pattern. Only blocks that contain >40 SNPs were considered for merging. For a pair of adjacent blocks, if the two have the same haplotype variation pattern and if >95% of all SNPs in the region spanned by the two blocks (including the orphan SNPs and those that belong to other smaller blocks in the region) are consistent with the haplotype variation pattern, then the two will be merged into one block.
SNP validation and discovery by resequencing
We designed 94 sets of forward and reverse PCR primers to assay in 44 internally contiguous genomic segments distributed at 21 distinct genomic loci (Supplemental Table S5). We sequenced 13 common laboratory inbred strains and 12 wild-derived feral inbred strains. The laboratory strains are 129S1/SvImJ, 129X1/SvJ, A/J, AKR/J, BALB/cByJ, C3H/HeJ, C57BL/6J, C58/J, DBA/2J, FVB/NJ, NOD/LtJ, NZB/BlNJ, and SJL/J. The wild-derived inbred strains include seven domesticus subspecies (LEWES/Ei, MOR/Rk, PERA/Ei, PERC/Ei, SF/CamEi, WSB/Ei, and ZALENDE/Ei), two musculus subspecies (CZECHII/Ei, SKIVE/Ei), one molossinus subspecies (MOLF/Ei F), one castaneus subspecies (CAST/Ei), and one M. spretus species (SPRET/Ei).
SNP loci were amplified with forward primers containing the -21M13 primer site (5′-TGTAAAACGACGGCCAGT-3′) and reverse primers containing a -48M13 primer site (5′-AGCGGAT AACAATTTCACAC-3′). Cleaned PCR products were sequenced using fluorescent BigDye Terminator v2 Ready Reaction Kits (Applied Biosystems cat # 4314416) on an ABI 3100 Sequencer.
Assemble haplotypes in the 44 genomic regions
SNPs discovered in each amplicon were mapped to the genomic coordinates of the 44 contiguous genomic regions. If an SNP was discovered in multiple overlapping amplicons, the sequence base with the highest quality score was chosen as the genotype. Low-quality genotypes with phred quality score <15 were considered missing data. To assemble a set of reference haplotypes (i.e., the unique haplotypes found in the 25 mouse strains) for each genomic region, we processed the strains in ascending order of missing genotype. For each strain, we compared its haplotype with the current list of the reference haplotypes. If none of the existing reference haplotypes match the current haplotype, a new reference haplotype is created representing the current haplotype. Otherwise, if there is only one matching reference haplotype, the matching reference haplotype was updated if the current haplotype could replace missing alleles in the reference haplotype. Occasionally (∼5%), multiple reference haplotypes matched the current haplotype as a result of missing genotype data. To resolve ambiguity in reference haplotype assignment, we included the low-quality genotype data in the current haplotype and manually reviewed its alignment to all matching reference haplotypes in both sequence and trace view. A total of 57 instances of the ambiguous reference haplotype mapping were resolved by such analysis.
Acknowledgments
We thank David Kaufman, David Lipman, Andy Clark, Robert Clifford, Richard Finney, Maxwell Lee, and the three anonymous reviewers for critical review of the manuscript.
Footnotes
[Supplemental material is available online at www.genome.org.]
Article and publication are at http://www.genome.org/cgi/doi/10.1101/gr.2901705.
References
- Bishop, C.E., Boursot, P., Baron, B., Bonhomme, F., and Hatat, D. 1985. Most classical Mus musculus domesticus laboratory mouse strains carry a Mus musculus musculus Y chromosome. Nature 315: 70-72. [DOI] [PubMed] [Google Scholar]
- Ferris, S.D., Sage, R.D., and Wilson, A.C. 1982. Evidence from mtDNA sequences that common laboratory strains of inbred mice are descended from a single female. Nature 295: 163-165. [DOI] [PubMed] [Google Scholar]
- Frazer, K.A., Wade, C.M., Hinds, D.A., Patil, N., Cox, D.R., and Daly, M.J. 2004. Segmental phylogenetic relationships of inbred mouse strains revealed by fine-scale analysis of sequence variation across 4.6 mb of mouse genome. Genome Res. 14: 1493-1500. [DOI] [PMC free article] [PubMed] [Google Scholar]
- Gabriel, S.B., Schaffner, S.F., Nguyen, H., Moore, J.M., Roy, J., Blumenstiel, B., Higgins, J., DeFelice, M., Lochner, A., Faggart, M., et al. 2002. The structure of haplotype blocks in the human genome. Science 296: 2225-2229. [DOI] [PubMed] [Google Scholar]
- Grupe, A., Germer, S., Usuka, J., Aud, D., Belknap, J.K., Klein, R.F., Ahluwalia, M.K., Higuchi, R., and Peltz, G. 2001. In silico mapping of complex disease-related traits in mice. Science 292: 1915-1918. [DOI] [PubMed] [Google Scholar]
- Mural, R.J., Adams, M.D., Myers, E.W., Smith, H.O., Miklos, G.L., Wides, R., Halpern, A., Li, P.W., Sutton, G.G., Nadeau, J., et al. 2002. A comparison of whole-genome shotgun-derived mouse chromosome 16 and the human genome. Science 296: 1661-1671. [DOI] [PubMed] [Google Scholar]
- Nagamine, C.M., Nishioka, Y., Moriwaki, K., Boursot, P., Bonhomme, F., and Lau, Y.F. 1992. The musculus-type Y chromosome of the laboratory mouse is of Asian origin. Mamm. Genome 3: 84-91. [DOI] [PubMed] [Google Scholar]
- Park, Y.G., Clifford, R., Buetow, K.H., and Hunter, K.W. 2003. Multiple cross and inbred strain haplotype mapping of complex-trait candidate genes. Genome Res. 13: 118-121. [DOI] [PMC free article] [PubMed] [Google Scholar]
- Patil, N., Berno, A.J., Hinds, D.A., Barrett, W.A., Doshi, J.M., Hacker, C.R., Kautzer, C.R., Lee, D.H., Marjoribanks, C., McDonough, D.P., et al. 2001. Blocks of limited haplotype diversity revealed by high-resolution scanning of human chromosome 21. Science 294: 1719-1723. [DOI] [PubMed] [Google Scholar]
- Rowe, L.B., Barter, M.E., Kelmenson, J.A., and Eppig, J.T. 2003. The comprehensive mouse radiation hybrid map densely cross-referenced to the recombination map: A tool to support the sequence assemblies. Genome Res. 13: 122-133. [DOI] [PMC free article] [PubMed] [Google Scholar]
- Tucker, P.K., Lee, B.K., Lundrigan, B.L., and Eicher, E.M. 1992. Geographic origin of the Y chromosomes in “old” inbred strains of mice. Mamm. Genome 3: 254-261. [DOI] [PubMed] [Google Scholar]
- Wade, C.M., Kulbokas III, E.J., Kirby, A.W., Zody, M.C., Mullikin, J.C., Lander, E.S., Lindblad-Toh, K., and Daly, M.J. 2002. The mosaic structure of variation in the laboratory mouse genome. Nature 420: 574-578. [DOI] [PubMed] [Google Scholar]
- Wiltshire, T., Pletcher, M.T., Batalov, S., Barnes, S.W., Tarantino, L.M., Cooke, M.P., Wu, H., Smylie, K., Santrosyan, A., Copeland, N.G., et al. 2003. Genome-wide single-nucleotide polymorphism analysis defines haplotype patterns in mouse. Proc. Natl. Acad. Sci. 100: 3380-3385. [DOI] [PMC free article] [PubMed] [Google Scholar]
- Witmer, P.D., Doheny, K.F., Adams, M.K., Boehm, C.D., Dizon, J.S., Goldstein, J.L., Templeton, T.M., Wheaton, A.M., Dong, P.N., Pugh, E.W., et al. 2003. The development of a highly informative mouse Simple Sequence Length Polymorphism (SSLP) marker set and construction of a mouse family tree using parsimony analysis. Genome Res. 13: 485-491. [DOI] [PMC free article] [PubMed] [Google Scholar]
- Yalcin, B., Fullerton, J., Miller, S., Keays, D.A., Brady, S., Bhomra, A., Jefferson, A., Volpi, E., Copley, R.R., Flint, J., et al. 2004. Unexpected complexity in the haplotypes of commonly used inbred strains of laboratory mice. Proc. Natl. Acad. Sci. 101: 9734-9739. [DOI] [PMC free article] [PubMed] [Google Scholar]
- Zhang, J., Rowe, W.L., Clark, A.G., and Buetow, K.H. 2003. Genomewide distribution of high-frequency, completely mismatching SNP haplotype pairs observed to be common across human populations. Am. J. Hum. Genet. 73: 1073-1081. [DOI] [PMC free article] [PubMed] [Google Scholar]
WEB SITE REFERENCES
- http://evolution.genetics.washington.edu/phylip.html; PHYLIP.
- http://jaxmice.jax.org; The Jackson Laboratory.
- http://lpg.nci.nih.gov/mulan/; LPG/NCI Mouse Haplotype Block.
- http://www.broad.mit.edu; Broad Institute.
- http://www.broad.mit.edu/personal/claire/strainsnplist_all.xls; WI haplotype map.


