

Abstract
Aims
Statins are known to influence the status of adipokines, which play a key role in the pathophysiology of cardiometabolic diseases. As the effect of ezetimibe as an add‐on to statin therapy on the impact of statins on plasma adipokines levels is currently unclear, the aim of the present study was to investigate this through a meta‐analysis of controlled trials.
Methods
A systematic review was performed, followed by a bibliographic search in PubMed, Medline, SCOPUS, Web of Science and Google Scholar databases. Quantitative data synthesis was performed using a fixed‐ or random‐effects model (based on the level of interstudy heterogeneity) and the generic inverse variance weighting method. Effect sizes were expressed as standardized mean difference (SMD) and 95% confidence interval (CI).
Results
Meta‐analysis of 23 controlled trials did not suggest any significant effect of adding ezetimibe on top of statin therapy on plasma concentrations of adiponectin (SMD 0.34, 95% CI –0.28, 0.96; P = 0.288), leptin (SMD –0.75, 95% CI: –2.35, 0.85; P = 0.360), plasminogen activator inhibitor 1 (SMD –1.06, 95% CI: –2.81, 0.69; P = 0.236) and interleukin 6 (SMD 0.30, 95% CI: –0.08, 0.67; P = 0.124). However, significantly greater reductions in plasma concentrations of tumour necrosis factor α (TNF‐α) (SMD –0.48, 95% CI –0.87, −0.08; P = 0.018) were achieved with ezetimibe/statin combination therapy.
Conclusions
The results suggested that ezetimibe add‐on to statin therapy is associated with an enhanced TNF‐α‐lowering effect compared with statin monotherapy. Owing to the emerging role of TNF‐α in the pathogenesis of metabolic disorders, further investigations are required to unveil the translational relevance of this TNF‐α‐lowering effect.
Keywords: adipose tissue, cytokine, ezetimibe, pleiotropic, statin, tumour necrosis factor α
Tables of Links
| TARGETS | |
|---|---|
| Other protein targets 2 | Transporters 4 |
| TNF‐α | GLUT4 |
| NPC1L1 | |
| Enzymes 3 | |
| plasminogen activator, tissue type |
| LIGANDS | |
|---|---|
| IL‐6 | fluvastatin |
| leptin | lovastatin |
| adiponectin | rosuvastatin |
| atorvastatin | endothelin‐1 |
| simvastatin | ezetimibe |
| rimonabant | fenofibrate |
These Tables list key protein targets and ligands in this article which are hyperlinked to corresponding entries in http://www.guidetopharmacology.org, the common portal for data from the IUPHAR/BPS Guide to PHARMACOLOGY 1, and are permanently archived in the Concise Guide to PHARMACOLOGY 2015/16 2, 3, 4.
Introduction
Adipose tissue is an active endocrine organ with the ability to express many bioactive peptides, known as ‘adipokines’, such as tumour necrosis factor α (TNF‐α), interleukin 6 (IL‐6), leptin, adiponectin, plasminogen activator inhibitor 1 (PAI‐1), resistin and visfatin 5. These specific fat‐related hormones are considered as a link between the vasculature and obesity, which is the major risk factor for diabetes mellitus, metabolic syndrome and cardiovascular diseases 6, 7. The best characterized adipokine is leptin, which regulates body weight centrally, and increased circulating levels of which are present in obese patients. Plasma levels of proinflammatory adipokines such as visfatin, IL‐6 and TNF‐α have also been shown to be increased during obesity 8, 9. By contrast, adiponectin has been described mainly as an anti‐inflammatory mediator, with plasma levels inversely correlated with obesity and its complications 10, and with a tendency to increase with weight loss 11. In addition, TNF‐α is known to be a pro‐inflammatory cytokine, and PAI‐1 to be a component of the coagulation system. Both PAI‐1 and TNF‐α (similarly to other adipokines such as leptin and adiponectin) have metabolic effects – for example, inhibiting the activity of tissue‐type plasminogen activator (an anticlotting factor) and stimulating the release of free fatty acids by adipocytes, and reducing adiponectin synthesis and impaired insulin signalling, respectively 12. The role of reduced circulating levels of adipokines in the pathophysiology of obesity, hypercholesterolaemia, insulin resistance and cardiovascular diseases 5, 13 implies that adipose tissue is an interesting target for hypolipidaemic agents.
Aside from their well‐documented role as the cornerstone of pharmacotherapy for dyslipidaemia, statins have been shown to possess several pleiotropic and lipid‐independent effects relevant for the prevention and treatment of cardiovascular disease 14, 15, 16, 17, 18, 19, 20. It has been shown that adipose tissue is one of the targets of hypolipidaemic drugs such as statins due to their pleiotropic effect. Krysiak et al. demonstrated that atorvastatin reduced adipokine release from visceral and subcutaneous adipose tissue independently of its cholesterol‐lowering effects 21. Moreover, simvastatin has been shown partially to reverse the abnormal hormonal function of adipose tissue besides having a lipid‐lowering effect 22. Ezetimibe is a lipid‐lowering agent that inhibits the Niemann‐Pick C1‐Like 1 (NPC1L1) transport protein, which takes up cholesterol from the lumen of jejunal enterocytes. This agent is used in patients who are either intolerant or resistant to the effects of 3‐hydroxy‐3‐methylglutaryl coenzyme A (HMG‐CoA) reductase inhibitors (statins) 23, 24.
Several studies have demonstrated both ezetimibe‐ and statin‐induced changes in plasma adipokines level 25, 26, 27, 28, 29, 30, while others have found neither of these agents to have an effect on adipose tissue function 31, 32, 33, 34. We therefore undertook the present meta‐analysis to assess the effect of ezetimibe add‐on to statin therapy vs. statin monotherapy on the plasma concentration of adipokines. In parallel, we evaluated the effect of ezetimibe therapy on plasma adipokine concentrations in nonstatin trials.
Methods
Search strategy
The present systematic review and meta‐analysis was conducted according to the instructions of the 2009 preferred reporting items for systematic reviews and meta‐analysis (PRISMA) statement 35. A systematic literature search was performed in PubMed, Medline, SCOPUS, Web of Science and Google Scholar databases using the following key words in titles and abstracts: (ezetimibe) AND (adiponectin OR leptin OR visfatin OR resistin OR ‘plasminogen activator inhibitor‐1’ OR ‘plasminogen activator inhibitor 1’ OR ‘plasminogen activator inhibitor1’ OR PAI‐1 OR ‘PAI 1’ OR ‘PAI1’ OR ‘tumour necrosis factor‐α’ OR ‘tumour necrosis factor α’ OR ‘tumour necrosis factorα’ OR TNF‐α OR ‘TNF α’ OR TNFα OR interleukin‐6 OR ‘interleukin 6’ OR ‘interleukin6). The wild‐card term ‘*’ was used to increase the sensitivity of the search strategy. The search was limited to articles published in the English language. The literature was searched from inception to 16 April 2015.
Study selection
For inclusion in the analysis, studies had to be randomized controlled trials (RCTs) comparing the effect of ezetimibe monotherapy vs. no treatment, or comparing the effect of ezetimibe addition to statin therapy vs. statin monotherapy on plasma concentrations of adipokines. Exclusion criteria included: in vitro, in vivo and observational studies; uncontrolled or inappropriately controlled trials; trials with a treatment duration of <2 weeks and studies with a lack of sufficient information on baseline or follow‐up adipokine concentrations (or net change values).
Data extraction
Following a review of eligible studies, the data regarding authors; publication date; study location and design; number of participants in the ezetimibe and control groups; drug type and dose; treatment duration; the age, gender and body mass index (BMI) of study participants; baseline lipid levels, high‐sensitivity C‐reactive protein (hs‐CRP) and glucose, blood pressure and adipokines were collated.
Quality assessment
A systematic assessment of bias in the included studies was performed according to the Cochrane instructions 36.
Quantitative data synthesis
Meta‐analysis was conducted using Comprehensive Meta‐Analysis (CMA) V2 software (Biostat, Englewood, NJ, USA) 37. Net changes in measurements (change scores) were calculated for parallel and crossover trials, as follows: (measure at the end of follow‐up in the treatment group − measure at baseline in the treatment group) − (measure at the end of follow‐up in the control group − measure at baseline in the control group) 38, 39, 40. Standard deviations (SDs) of the mean difference were calculated using the following formula: SD = square root [(SDpretreatment)2 + (SDposttreatment)2 – (2R × SDpretreatment × SDposttreatment)], assuming a correlation coefficient (R) = 0.5 41, 42, 43, 44. If the outcome measures were reported in median and range [or 95% confidence CI)], interval (mean and SD values were estimated using the method described by Hozo et al. 45. To convert interquartile ranges into minimum–maximum ranges, the following equations were used: A = median + 2 × (Q3 – median) and B = median – 2 × (median – Q1), where A, B, Q1 and Q3 are upper and lower ends of the range, and upper and lower ends of the interquartile range, respectively. When only the standard error of the mean (SEM) was reported, the SD was estimated using the following formula: SD = SEM × sqrt (n), where sqrt is the square root and n is the number of subjects.
The results of selected RCTs were pooled using the generic inverse variance method and a fixed‐ and random‐effects model, depending on the presence of high (≥ 50%) or low‐to‐moderate (<50%) heterogeneity, respectively. Interstudy heterogeneity was assessed using the Cochran Q test and I2 index. Effect sizes were expressed as the standardized mean difference (SMD) owing to the differences in the methods employed for the adipokine assay among the included studies. The influence of each study on the estimated effect size was assessed using leave‐one‐out sensitivity analysis. A weighted meta‐regression analysis was performed to assess the association between the overall estimate of effect size, with low‐density lipoprotein cholesterol (LDL‐C)‐lowering activity as a potential confounder.
Publication bias
The presence of publication bias in the meta‐analysis was assessed through visual inspection of Begg's funnel plot asymmetry, Begg's rank correlation and Egger's weighted regression tests. Duval and Tweedie's ‘trim and fill’ and ‘ fail‐safe N’ methods were used to adjust the analysis for the effects of publication bias 46.
Results
Flow and characteristics of included studies
Following a systematic search, 339 articles were identified and reviewed by title and abstract. Of these, 296 articles were excluded for not being an original study (n = 123) and not meeting the predefined eligibility criteria (n = 173). The full text of the remaining 43 articles were carefully evaluated, resulting in the exclusion of an additional 20 studies for being not appropriately controlled (n = 4), being uncontrolled (n = 7), having no ezetimibe intervention (n = 3), not measuring plasma levels of adipokine(s) (n = 3), being a duplicate report (n = 2) and including no adipokine assay (n = 1). Finally, 23 studies were found to meet the inclusion criteria and were included in the systematic review and meta‐analysis. The study selection process is shown in Figure 1.
Figure 1.
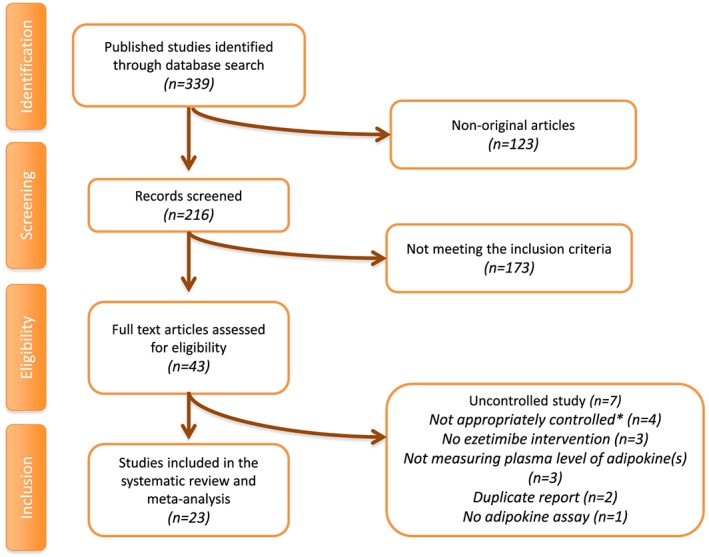
Flow chart of the number of studies identified and included in the meta‐analysis
Data were pooled from 23 clinical trials comprising 1226 subjects: 374, 413, 236 and 203 in the ezetimibe/statin combination, statin monotherapy, ezetimibe monotherapy and nonstatin therapy arms (participants of the crossover trials were considered in both ezetimibe/statin combination and statin monotherapy arms), respectively. Included studies were published between 2008 and 2015. The clinical trials used different doses of ezetimibe and statins. Two studies investigated ezetimibe 5 mg day–1 47, 48 and 21 studies investigated ezetimibe 10 mg day–1 25, 28, 31, 49, 50, 51, 52, 53, 54, 55, 56, 57, 58, 59, 60, 61, 62, 63, 64, 65, 66; in regard to statins, one study investigated atorvastatin 5 mg day–1 47, one study investigated atorvastatin 10 mg day–1 28, two studies investigated atorvastatin 20 mg day–1 47, 51, two studies investigated atorvastatin 80 mg day–1 51, 58, one study investigated fluvastatin 30 mg day–1 53, one study investigated lovastatin 5 mg day–1 62, one study investigated lovastatin 20 mg day–1 62, one study investigated rosuvastatin 2.5 mg day–1 66, one study investigated rosuvastatin 10 mg day–1 66, two studies investigated simvastatin 10 mg day–1 54, 63, one study investigated simvastatin 20 mg day–1 56, seven studies investigated simvastatin 40 mg day–1 25, 31, 49, 50, 59, 61, 65 and two studies investigated simvastatin 80 mg day–1 54, 63. The range of intervention periods was from 2 weeks 25, 31, 50 up to 12 months 58. Study designs of the included studies included parallel group 25, 28, 31, 47, 48, 50, 51, 52, 53, 55, 56, 58, 59, 60, 61, 62, 63, 64, 65, 66 and crossover 49, 54, 57. Selected studies enrolled subjects with diabetes 49, 63, prediabetes 56, chronic kidney disease 49, obesity 52, 54, 55, 57, abdominal aortic aneurysm 50, a high risk of cardiovascular disease 51, dyslipidaemia 28, 47, 48, 52, 56, 57, 59, 60, 61, 62, stable angina pectoris 53, 58, non‐alcoholic fatty liver disease 64, metabolic syndrome 54, acute coronary syndrome 65, coronary artery disease 66 and also apparently healthy men 25, 31. Anthropometric and biochemical characteristics of the evaluated studies are presented in Table 1.
Table 1.
Demographic characteristics of the included studies
| Author | Study design | Target population | Treatment duration | n | Study groups | Age, years | Female (n, %) | BMI, (kg m–2) | Adiponectin μg ml–1 | Leptin ng ml–1 | Visfatin (ng ml–1) | >PAI‐1 ng ml–1 | IL‐6 (pg ml–1) | TNF‐α (pg ml–1) | Resistin (ng ml–1) |
|---|---|---|---|---|---|---|---|---|---|---|---|---|---|---|---|
| Almquist et al. (2014) 49 | Randomized, double‐blind, crossover | Diabetes and CKD | 8–10 weeks |
21 18 |
Diabetes, simvastatin 40 mg day–1, simvastatin 40 mg day–1 + ezetimibe 10 mg day–1 Diabetes + CKD, simvastatin 40 mg day–1, simvastatin 40 mg day–1 + ezetimibe 10 mg day–1 |
64 ± 7 67 ± 6 |
8 (38.0) 8 (44.4) |
ND ND |
ND ND |
ND ND |
ND ND |
ND ND |
ND ND |
3160 ± 960 4320 ± 1080 |
ND ND |
| Berthold et al. (2013) 25 | Randomized clinical trial | Apparently healthy men | 2 weeks |
24 24 24 |
Simvastatin 40 mg day–1, ezetimibe 10 mg day–1, simvastatin 40 mg day–1 + ezetimibe 10 mg day–1 |
31.9 ± 8.8 28.6 ± 6.6 34.1 ± 11.2 |
0 (0.0) 0 (0.0) 0 (0.0) |
26.4 ± 3.2 25.0 ± 3.3 25.8 ± 3.1 |
15.1 (9.0)a 12.6 (11.4)a 14.1 (6.0)a |
2600 (2700)a 1900 (1300)a 2000 (2400)a |
ND ND ND |
ND ND ND |
0.81 (0.63)a 0.70 (0.56)a 0.58 (0.67)a |
ND ND ND |
12.0 (5.7)a 14.4 (7.0)a 13.4 (4.0)a |
| Chan et al. (2010) 55 | Randomized, single‐blind, placebo‐controlled | Central obesity | 22 weeks |
15 10 |
Ezetimibe 10 mg day–1, placebo |
57 ± 8 |
6 (40.0) 4 (40.0) |
32 ± 3.8 33 ± 3.1 |
4.9 ± 2.7 5.9 ± 2.2 |
ND ND |
ND ND |
ND ND |
1.1 ± 0.3 0.87 ± 0.25 |
6.3 ± 1.9 5.4 ± 1.5 |
ND ND |
| Dawson et al. (2011) 50 | Randomized, double‐blind, placebo‐controlled | Abdominal aortic aneurysm | 2 weeks |
9 9 |
Ezetimibe 10 mg day–1 + simvastatin 40 mg day–1, simvastatin 40 mg day–1 |
72 (65–77)a 70 (65–76)a |
1 (11.1) 1 (11.1) |
ND ND |
ND ND |
ND ND |
ND ND |
ND ND |
26.4 (22.7–39.0)a 74.4 (39.6–125.3)a |
4.7 ± 1.6 3.7 ± 1.1 |
ND ND |
| Ferreira et al. (2015) 51 | Randomized clinical trial | High risk of cardiovascular disease | 6 months | 75 |
Atorvastatin 80 mg day–1, atorvastatin 20 mg day–1 + ezetimibe 10 mg day–1 |
35–80b |
ND ND |
ND ND |
ND ND |
ND ND |
ND ND |
ND ND |
2.1 (0.3)c 4.1 (1.7)c |
1.6 (0.1)c 1.9 (0.2)c |
ND ND |
| Florentin et al. (2010) 52 | Randomized, open‐label | Obesity and overweight patients with dyslipidaemia | 3 months |
19 18 20 |
Rimonabant 20 mg day–1, rimonabant 20 mg day–1 + ezetimibe 10 mg day–1, rimonabant 20 mg day–1 + fenofibrate 200 mg day–1 |
50 ± 15 52 ± 15 52 ± 7 |
11 (57.8) 9 (50.0) 10 (50.0) |
34.2 ± 6.7 34.5 ± 4.2 33.0 ± 4.6 |
6.8 (2.8–14)a 7.7 (3.8–11.1)a 4.5 (3.0–7.1)a |
30.8 (11.1–50.6)a 33.2 (5.0–51.7)a 28.8 (3.2–48.6)a |
2.6 (1.6–3.9)a 2.4 (1.4–3.4)a 3.6 (2.5–5.5)a |
ND ND ND |
ND ND ND |
ND ND ND |
ND ND ND |
| Gouni‐Berthold et al. (2008) 31 | Randomized clinical trial | Healthy men | 2 weeks |
24 24 24 |
Ezetimibe 10 mg day–1, simvastatin 40 mg day–1. ezetimibe 10 mg day–1 + simvastatin 40 mg day–1 |
28.6 ± 6.6 31.9 ± 8.8 34.1 ± 11.2 |
0 (0.0) 0 (0.0) 0 (0.0) |
25.0 ± 3.3 26.4 ± 3.2 25.8 ± 3.1 |
13.17 ± 5.97 13.28 ± 5.29 13.63 ± 4.88 |
2630 ± 2940 3400 ± 2970 2850 ± 2470 |
ND ND ND |
ND ND ND |
ND ND ND |
ND ND ND |
14.39 ± 5.29 13.78 ± 6.42 14.08 ± 4.19 |
| Habara et al. (2014) 53 | Randomized clinical trial | Stable angina pectoris | 9 months |
31 32 |
Fluvastatin 30 mg day–1, ezetimibe 10 mg day–1 + fluvastatin 30 mg day–1 |
68.8 ± 7.8 69.8 ± 7.8 |
5 (16.1) 11 (34.3) |
23.5 ± 4.0 24.5 ± 3.0 |
ND ND |
ND ND |
ND ND |
ND ND |
2.3 ± 2.3 4.5 ± 6.1 |
1.5 ± 0.8 1.3 ± 1.5 |
ND ND |
| Hajer et al. (2008) 54 | Randomized, double‐blind, crossover | Obese men with metabolic syndrome | 6 weeks | 15 |
Simvastatin 80 mg day–1, simvastatin 10 mg day–1 + ezetimibe 10 mg day–1 |
55 ± 6 | 0 (0.0) | 29.7 ± 2.8 | 5.0 ± 2.3 | ND | ND | ND | ND | ND | ND |
| Kater et al. (2010) 56 | Randomized, open‐label | Prediabetes and hypercholesterolaemia | 12 weeks |
25 25 |
Ezetimibe 10 mg day–1, simvastatin 20 mg day–1 |
53.4 ± 9.3 53.1 ± 8.1 |
19 (79.1) 19 (76.0) |
33.1 ± 4.5 31.9 ± 3.4 |
ND ND |
ND ND |
ND ND |
ND ND |
3.1 ± 2.5 2.8 ± 1.5 |
8.8 ± 16 6.1 ± 1.0 |
ND ND |
| Kikuchi et al. (2012) 57 | Randomized, double‐blind, placebo‐controlled, crossover | Obese men with hyperlipidaemia | 4 weeks |
20 10 10 |
Ezetimibe 10 mg day–1, placebo |
43.7 ± 8.1 | 0 (0.0) | 26.0 ± 2.6 |
5.5 ± 1.9 5.3 ± 2.2 |
ND ND |
ND ND |
ND ND |
ND ND |
1.7 ± 3.3 1.4 ± 1.9 |
ND ND |
| Kovarnik et al. (2012) 58 | Randomized, open‐label | Stable angina pectoris | 12 months |
42 47 |
Atorvastatin 80 mg day–1 + ezetimibe 10 mg day–1, prior statin therapy or atorvastatin 10 mg day–1 |
63.5 ± 9.3 65.1 ± 10.6 |
9 (21.4) 16 (34.0) |
ND ND |
ND ND |
ND ND |
ND ND |
ND ND |
ND ND |
ND ND |
ND ND |
| Krysiak et al. (2012) 59 | Randomized, double‐blind, placebo‐controlled | Hypercholesterolaemia | 3 months |
24 25 25 24 |
Ezetimibe 10 mg /day–1, simvastatin 40 mg day–1, ezetimibe 10 mg day–1 + simvastatin 40 mg day–1, placebo |
53.2 ± 3.2 53.9 ± 3.5 54.2 ± 3.8 52.4 ± 2.2 |
10 (41.7) 11 (44.0) 10 (40.0) 11 (45.8) |
28.1 ± 2.4 27.9 ± 2.6 28.3 ± 2.3 28.6 ± 2.3 |
ND ND ND ND |
ND ND ND ND |
ND ND ND ND |
143.2 ± 12.1 145.8 ± 8.6 147.5 ± 11.5 141.5 ± 10.1 |
ND ND ND ND |
ND ND ND ND |
ND ND ND ND |
| Krysiak et al. (2014) 22 | Open‐label | Hypercholesterolaemia | 3 months |
21 18 |
Ezetimibe 10 mg day–1, control |
52.0 ± 2.8 50.9 ± 2.7 |
9 (43) 8 (44) |
26.7 ± 2.1 27.0 ± 2.5 |
5.4 ± 1.3 5.9 ± 1.0 |
25.2 ± 5.1 23.9 ± 4.7 |
20.9 ± 2.5 20.7 ± 4.1 |
ND ND |
ND ND |
16.5 ± 3.0 15.3 ± 2.0 |
ND ND |
| Krysiak et al. (2014) 61 | Placebo‐controlled | Hypercholesterolaemia | 12 weeks |
23 21 21 |
Simvastatin 40 mg day–1, simvastatin 40 mg day–1 + ezetimibe 10 mg day–1, placebo |
51.9 ± 2.7 52.5 ± 3.5 51.1 ± 2.6 |
9 (39.0) 9 (43.0) 9 (43.0) |
26.5 ± 2.6 26.9 ± 2.2 27.2 ± 2.6 |
5.3 ± 1.2 6.0 ± 1.0 5.7 ± 1.1 |
24.5 ± 5.0 25.6 ± 5.3 24.1 ± 4.9 |
22.4 ± 3.2 21.5 ± 4.0 20.9 ± 4.3 |
ND ND ND |
ND ND ND |
16.3 ± 1.9 15.9 ± 2.4 15.4 ± 2.0 |
ND ND ND |
| Kurobe et al. (2011) 28 | Open‐label | Hypercholesterolaemia | 3 months |
20 20 |
Ezetimibe 10 mg day–1, control |
66.2 ± 9.9 64.0 ± 14.1 |
4 (20.0) 3 (15.0) |
24.8 ± 2.8 23.7 ± 3.3 |
9300 ± 5210 10 190 ± 3780 |
ND ND |
ND ND |
ND ND |
ND ND |
ND ND |
ND ND |
| Lee et al. (2011) 47 | Randomized, open‐label | Hypercholesterolaemia | 8 weeks |
30 30 |
Atorvastatin 20 mg/day–1, atorvastatin 5 mg day–1 + ezetimibe 5 mg day–1 |
62 ± 9 60 ± 9 |
21 (70) 20 (67) |
25.3 ± 2.7 25.3 ± 3.8 |
ND ND |
ND ND |
ND ND |
ND ND |
1.40 (0.43–5.38)a 1.14 (0.43–4.36)a |
ND ND |
ND ND |
| Liu et al. (2013) 62 | Randomized clinical trial | Dyslipidaemia | 6 weeks |
23 23 |
Xuezhikang 2400 mg day–1 Xuezhikang 600 mg day–1 + ezetimibe 10 mg day–1 |
51 ± 7 50 ± 7 |
17 (73.9) 9 (39.1) |
24 ± 3 23 ± 3 |
ND ND |
ND ND |
ND ND |
ND ND |
9.7 ± 0.9 9.5 ± 0.9 |
ND ND |
ND ND |
| Rudofsky et al. (2012) 63 | Randomized, double‐blind, placebo‐controlled | Type 2 diabetes | 8 weeks |
11 10 9 |
Simvastatin 10 mg day–1 + ezetimibe 10 mg day–1, simvastatin 80 mg day–1, placebo |
65 ± 9 56 ± 10 64 ± 9 |
6 (54.5) 6 (60.0) 7 (77.7) |
ND ND ND |
ND ND ND |
ND ND ND |
ND ND ND |
ND ND ND |
1.9 ± 0.9d 2.4 ± 1.2d 1.9 ± 0.9d |
ND ND ND |
ND ND ND |
| Takeshita et al. (2014) 64 | Randomized, open‐label | NAFLD | 6 months |
17 14 |
Ezetimibe 10 mg day–1, control |
50.4 ± 11.9 55.5 ± 11.2 |
6 (35.2) 5 (35.7) |
30.5 ± 4.9 27.7 ± 6.3 |
3.0 ± 2.4 4.0 ± 1.8 |
0.0108 ± 0.0057 0.0081 ± 0.0037 |
ND ND |
35.8 ± 19.1 26.0 ± 10.7 |
ND ND |
0.0050 ± 0.0015 0.0065 ± 0.0014 |
ND ND |
| Undas et al. (2011) 65 | Randomized, double‐blind, placebo‐controlled | Acute coronary syndrome | 2 months |
20 26 |
Simvastatin 40 mg day–1 + ezetimibe 10 mg day–1, simvastatin 40 mg day–1 |
58.5 ± 8.4 56.2 ± 8.6 |
6 (30.0) 5 (19.2) |
27.5 (3.6)a 26.9 (3.9)a |
ND ND |
ND ND |
ND ND |
36.2 ± 8.4 37.1 ± 7.6 |
2.08 (1.93)a 1.42 (2.01)a |
ND ND |
ND ND |
| Yagi et al. (2010) 48 | Clinical trial | Hypercholesterolaemia | 8 weeks |
38 38 |
Ezetimibe 5 mg day–1, control |
63.7 ± 12.8 63.0 ± 12.6 |
19 (50.0) 19 (50.0) |
25.1 ± 6.1 25.6 ± 6.2 |
ND ND |
ND ND |
ND ND |
ND ND |
ND ND |
23.6 ± 9.3 22.6 ± 8.9 |
ND ND |
| Yamazaki et al. (2013) 66 | Randomized, open‐label | Coronary artery disease | 12 weeks |
24 22 |
Rosuvastatin 10 mg day–1, rosuvastatin 2.5 mg day–1 + ezetimibe 10 mg day–1 |
71.8 ± 8.2 70.1 ± 9.6 |
9 (37.5) 8 (36.3) |
26.0 ± 2.8 24.4 ± 3.2 |
ND ND |
ND ND |
ND ND |
ND ND |
9.4 ± 25.9 5.4 ± 6.8 |
4.4 ± 8.9 7.6 ± 13.9 |
ND ND |
Values are expressed as mean ± SD. BMI, body mass index; CKD, chronic kidney disease; IL‐6, interleukin 6; NAFLD, non‐alcoholic fatty liver disease; ND, no data; PAI‐1, plasminogen activator inhibitor 1; SD, standard deviation; TNF‐α, tumour necrosis factor alpha
Data are medians (interquartile range)
Range only
Mean (SE)
Median ± SD
Risk of bias assessment
With respect to random sequence generation, four studies were judged to have a high risk of bias 28, 48, 60, 61, while some studies presented insufficient information 25, 31, 51, 52, 55, 59, 62, 66. The afore‐mentioned four studies had high risks of bias regarding allocation concealment 28, 48, 60, 61, while the others had a lack of information on this aspect 25, 31, 47, 51, 52, 53, 55, 56, 58, 59, 62. Several studies showed a high risk of bias with respect to the blinding of participants, personnel and outcome assessors 28, 31, 47, 48, 51, 52, 56, 58, 60, 61, 62, 64, 66, and some contained insufficient information 25, 54, 55, 57, 59, 63, 65. Most of the included studies had a low risk of bias regarding incomplete outcome data, and only two exhibited a high risk of bias 51, 58. Finally, all trials showed low risk of bias for selective outcome reporting. Evaluation of the risk of bias is summarized in Table 2.
Table 2.
Risk of bias assessment in the studies included
| Study | Sequence generation | Allocation concealment | Blinding of participants, personnel and outcome assessors | Incomplete outcome data | Selective outcome reporting | Other potential threats to validity |
|---|---|---|---|---|---|---|
| Almquist et al. (2014) 49 | L | L | L | L | L | L |
| Berthold et al. (2013) 25 | U | U | U | L | L | U |
| Chan et al. (2010) 55 | U | U | U | L | L | U |
| Dawson et al. (2011) 50 | L | L | L | L | L | L |
| Ferreira et al. (2015) 51 | U | U | H | H | L | U |
| Florentin et al. (2010) 52 | U | U | H | L | L | U |
| Gouni‐Berthold et al. (2008) 31 | U | U | H | L | L | U |
| Habara et al. (2014) 53 | L | U | L | L | L | L |
| Hajer et al. (2008) 54 | L | L | U | L | L | L |
| Kater et al. (2010) 56 | L | U | H | L | L | L |
| Kikuchi et al. (2012) 57 | L | L | U | L | L | L |
| Kovarnik et al. (2012) 58 | L | U | H | H | L | U |
| Krysiak et al. (2012) 59 | U | U | U | L | L | U |
| Krysiak et al. (2014) 22 | H | H | H | L | L | U |
| Krysiak et al. (2014) 61 | H | H | H | L | L | U |
| Kurobe et al. (2011) 28 | H | H | H | L | L | U |
| Lee et al. (2011) 47 | L | U | H | L | L | U |
| Liu et al. (2013) 62 | U | U | H | L | L | U |
| Rudofsky et al. (2012) 63 | L | L | U | L | L | L |
| Takeshita et al. (2014) 64 | L | L | H | L | L | L |
| Undas et el. (2011) 65 | L | L | U | L | L | L |
| Yagi et al. (2010) 48 | H | H | H | L | L | U |
| Yamazaki et al. (2013) 66 | U | L | H | L | L | U |
H, high risk of bias; L, low risk of bias; U, unclear risk of bias
Effect of ezetimibe/statin combination therapy vs. statin monotherapy on plasma adipokines
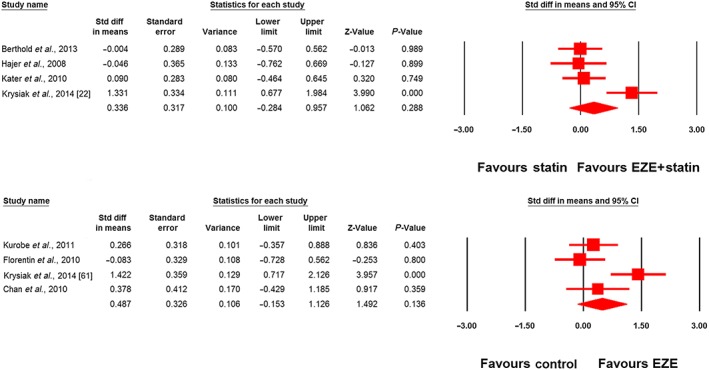
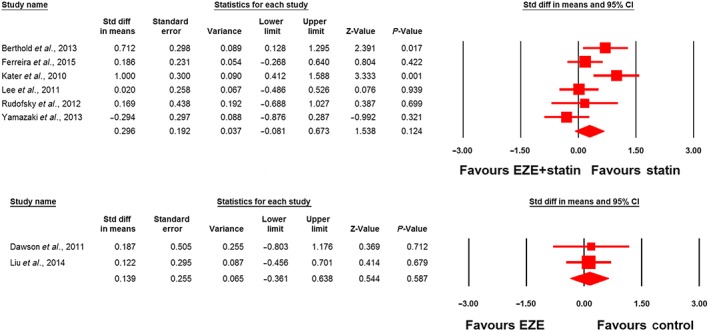
Meta‐analysis did not suggest any benefit of ezetimibe addition to statin therapy in altering plasma concentrations of adiponectin (SMD 0.34, 95% CI: –0.28, 0.96; P = 0.288; I2 = 75.22%), leptin (SMD –0.75, 95% CI –2.35, 0.85; P = 0.360; I2 = 92.40%), PAI‐1 (SMD –1.06, 95% CI –2.81, 0.69; P = 0.236; I2 = 95.50%) and IL‐6 (SMD 0.30, 95% CI –0.08, 0.67; P = 0.124; I2 = 61.11%) (Figures 2, 3, 4). However, significantly greater reductions in the plasma concentrations of TNF‐α (SMD –0.48, 95% CI –0.87, −0.08; P = 0.018; I2 = 75.43%; Figure 5) were achieved with ezetimibe/statin combination therapy. In the sensitivity analysis, omission of each study from the meta‐analysis did not remove the statistical significance of effect size, apart from in the study by Yamazaki et al. 66, for which a slight sensitivity was observed (Figure 6).
Figure 2.
Forest plot displaying standardized difference (Std diff) in means and 95% confidence intervals (CIs) for the impact of statin/ezetimibe (EZE) combination therapy vs. statin monotherapy on plasma adiponectin concentrations (upper plot). The lower plot displays the impact of EZE vs. control on plasma adiponectin concentrations in nonstatin trials
Figure 3.
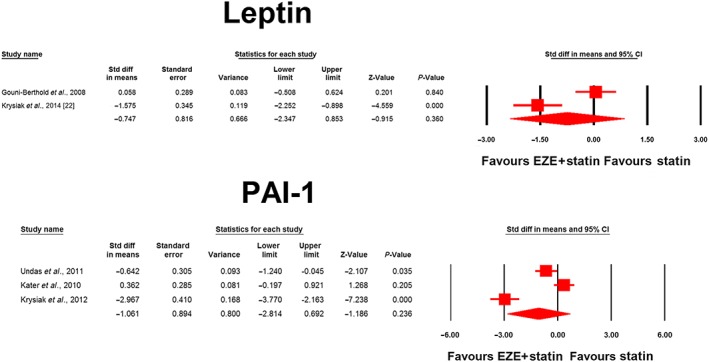
Forest plot displaying standardized difference (Std diff) in means and 95% confidence intervals (CIs) for the impact of statin/ezetimibe (EZE) combination therapy vs. statin monotherapy on plasma concentrations of leptin and plasminogen activator inhibitor 1 (PAI‐1)
Figure 4.
Forest plot displaying standardized difference (Std diff) in means and 95% confidence intervals (CIs) for the impact of statin/ezetimibe (EZE) combination therapy vs. statin monotherapy on plasma interleukin 6 (IL‐6) concentrations (upper plot). Lower plot displays the impact of ezetimibe vs. control on plasma IL‐6 concentrations in nonstatin trials
Figure 5.
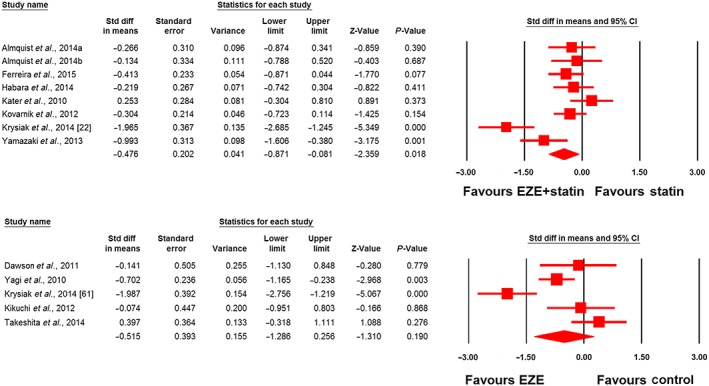
Forest plot displaying standardized difference (Std diff) in means and 95% confidence intervals (CIs) for the impact of statin/ezetimibe (EZE) combination therapy vs. statin monotherapy on plasma tumour necrosis factor α (TNF‐α) concentrations (upper plot). Lower plot displays the impact of EZE vs. control on plasma TNF‐α concentrations in nonstatin trials. Almquist a and b refer to different treatment arms of a single study
Figure 6.
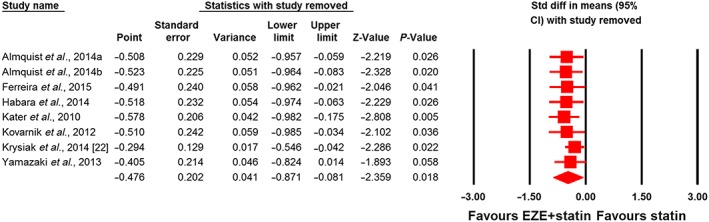
Leave‐one‐out sensitivity analysis for the impact of statin/ezetimibe (EZE) combination therapy vs. statin monotherapy on plasma tumour necrosis factor α concentrationsCI, confidence interval; Std diff, standardized difference. Almquist a and b refer to different treatment arms of a single study
The TNF‐α‐lowering activity did not differ between subgroups of studies in patients with (SMD –0.37, 95% CI –0.59, −0.16) and without (SMD –0.84, 95% CI –3.02, 1.33) established cardiovascular disease (or diabetes) (P = 0.674). The reduction in TNF‐α was also comparable between simvastatin (SMD –0.51, 95% CI –1.41, 0.39) and atorvastatin (SMD –0.35, 95% CI –0.66, −0.04) (P = 0.747). Moreover, no significant association was found between the changes in plasma TNF‐α and LDL‐C concentrations in the included studies (slope 0.02; 95% CI –0.03, 0.07; P = 0.391) (Figure 7).
Figure 7.
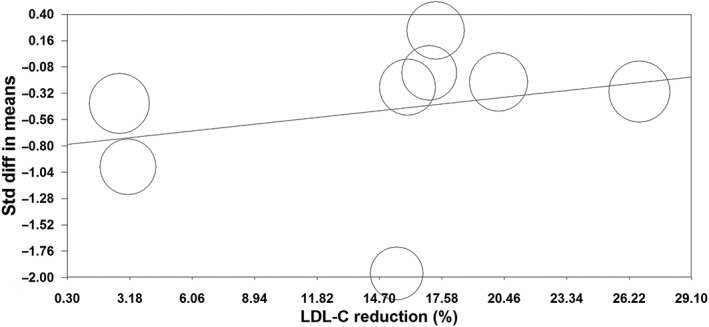
Random‐effects meta‐regression analysis for the association between changes in plasma tumour necrosis factor α and low‐density lipoprotein cholesterol (LDL‐C) concentrations in trials comparing statin/ezetimibe combination vs. statin monotherapyStd diff, standardized difference
Effect of ezetimibe therapy on plasma adipokines in nonstatin trials
The effect of ezetimibe vs. control on plasma concentrations of adiponectin, IL‐6 and TNF‐α in nonstatin trials was assessed in four, two and five studies, respectively. Meta‐analysis did not suggest any significant changes in plasma adiponectin (SMD 0.49, 95% CI –0.15, 1.13; P = 0.136; I2 = 70.88%; Figure 2), IL‐6 (SMD 0.14, 95% CI –0.36, 0.64; P = 0.587; I2 = 0%; Figure 4) and TNF‐α levels (SMD –0.51, 95% CI –1.29, 0.26; P = 0.190; I2 = 82.11%; Figure 5) following treatment with ezetimibe.
Publication bias
The Begg's funnel plot of precision was slightly asymmetrical and suggested a potential publication bias in the meta‐analysis of ezetimibe/statin combination vs. statin monotherapy on plasma concentrations of TNF‐α. Using ‘trim and fill’ correction, one potentially missing study was imputed, leading to a corrected effect size of −0.58 (95% CI –0.99, −0.17) (Figure 8). The presence of publication bias was excluded by Egger's linear regression (intercept = −4.97, standard error = 3.98; 95% CI = −14.71, 4.78; t = 1.25, df = 6, two‐tailed P‐value = 0.259) and Begg's rank correlation (Kendall's Tau with continuity correction = −0.18, z = 0.62, two‐tailed P‐value =0.536) tests. The ‘fail‐safe N’ test showed that 36 studies would be needed to bring the SMD down to a nonsignificant (p > 0.05) value.
Figure 8.
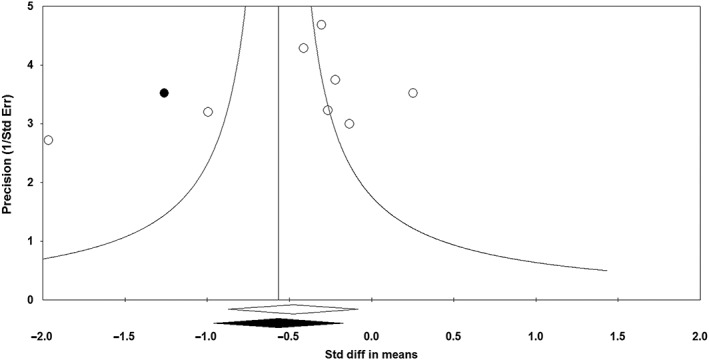
Funnel plot displaying publication bias in the studies reporting the impact of statin/ezetimibe combination therapy vs. statin monotherapy on plasma tumour necrosis factor α concentrations. Std diff, standardized difference; Std Err, standard error. Open circles denote analyzed studies filled circle denotes potentially missing studies that were imputed
Discussion
A major finding of the present meta‐analysis was that combination treatment with ezetimibe and statins significantly reduces TNF‐α plasma concentration, which generates a hypothesis for the potential relevance of such a combination for enhancing the anti‐inflammatory effects of statins.
3‐hydroxy‐3‐methylglutaryl coenzyme A (HMG‐CoA) reductase inhibitors, or statins, have proved to be effective in the primary and secondary prevention of cardiovascular diseases 67. Statins have a strong hypolipidaemic effect, especially on LDL‐cholesterol levels; however, the overall benefits of statins are greater because of their so‐called pleiotropic (cholesterol‐independent) effects 68. Despite their relative safety and efficacy, several studies have shown that some patients do not tolerate statins, or suffer from adverse effects 69, 70, 71. These patients may benefit from treatment with ezetimibe, a selective inhibitor of the NPC1L1 protein in the jejunal brush border which inhibits intestinal cholesterol absorption and thus reduces plasma total and LDL‐cholesterol levels 72. Moreover, combination therapy with ezetimibe and statins prevents both the enhanced cholesterol synthesis induced by ezetimibe and increased cholesterol absorption induced by statins, and thus provides an additive reduction in plasma cholesterol levels 73.
Adipokines and other peptides released from adipose tissue play important roles in the pathogenesis of various cardiovascular diseases related to obesity, insulin resistance and atherosclerosis. For example, Krysiak et al. 61 showed a restoration in adipokine production after combined treatment with simvastatin and ezetimibe in high‐risk hypercholesterolaemic patients. By contrast, Gupta et al. 74 demonstrated no effects of ezetimibe add‐on to statin therapy on adipokine production in patients with metabolic syndrome and stable vascular disease. These controversial data directed us to undertake the present meta‐analysis to assess the effect of ezetimibe add‐on to statin vs. statin monotherapy on plasma concentrations of selected adipokines such as adiponectin, leptin, PAI‐1, IL‐6 and TNF‐α.
The present meta‐analysis suggested no benefit of ezetimibe/statin combination treatment on plasma concentrations of adiponectin, leptin, PAI‐1 and IL‐6. Some authors have shown decreased levels of TNF‐α after treatment with ezetimibe/statin combination 58, 61, whereas others have not 49, 51, 53, 56, 66. However, our meta‐analysis showed a significant decrease in the plasma concentration of TNF‐α after ezetimibe/statin combination therapy.
TNF‐α is an adipokine which is not produced directly by adipocytes, but by activated macrophages infiltrating adipose tissue 75. This adipose tissue is characterized by the presence of large (hypertrophic) adipocytes, which are formed due to an alteration in insulin sensitivity in adipose tissue and obesity 76. TNF‐α promotes insulin resistance by reducing glucose transporter 4 (GLUT4) expression, decreasing lipoprotein lipase activity or reducing insulin signalling 77. Moreover, TNF‐α impairs adipocyte differentiation and promotes inflammation 78. In addition, higher plasma concentrations of TNF‐α are associated with increased endothelin 1 (ET‐1) production and endothelial dysfunction, vascular instability and atherogenesis 79. Interestingly, a recent meta‐analysis showed that statins reduce plasma ET‐1 levels 20. Therefore, we might speculate that a reduction in TNF‐α levels might be accompanied by decreased levels of ET‐1, although this was not addressed in the present study. In addition, Buldak et al. 2016 80 showed that exenatid, TNF‐α inhibitor, has a strong antioxidative and anti‐inflammatory potential by reducing the production of reactive oxygen species and secretion of proinflammatory cytokines in cultured macrophages treated with lipopolysaccharide. Moreover, TNF‐α blockade is associated with a reduction in carotid intima–media thickness in patients with active rheumatoid arthritis 81. TNF‐α effects may be associated with cardiac apoptosis, increased oxidative stress and mitochondrial dysfunction, so a decrease in plasma TNF‐α levels (e.g. caused by its inhibitors) may prevent TNF‐α‐induced apoptosis associated with the protection of mitochondrial function 82. Therefore, we suggest that TNF‐α levels might not only serve as a biomarker of the above‐mentioned pathological conditions, but also be implicated in the progress of cardiovascular‐related pathologies. This is in agreement with several studies that have shown a potential benefit of TNF‐α reduction after statin treatment 83, 84, suggesting that reduced TNF‐α levels might be associated with both treatment efficacy and a reduction in inflammation in these patients. Plasma TNF‐α levels are considered to add prognostic information to that conveyed by CRP or hs‐CRP (another classical acute‐phase protein and an extremely sensitive marker of systemic inflammation) in the prevention of future cardiovascular events 85. Moreover, plasma hs‐CRP and TNF‐α levels are positively correlated with adipocyte size, an increase in which might constitute an inflammatory condition and act as a risk factor for cardiovascular‐related diseases 86.
The results of the present meta‐analysis were in line with the latest IMProved Reduction of Outcomes: Vytorin Efficacy International Trial (IMPROVE‐IT) regarding inflammatory markers 87. In the present study, we showed that ezetimibe/simvastatin reduces levels of TNF‐α levels, and IMPROVE‐IT showed that significantly more patients treated with ezetimibe/simvastatin have a reduction in both LDL‐C and hs‐CRP levels when compared with patients treated only with statins 87.
It is of interest to consider a possible mechanism for explaining how ezetimibe/statin combination therapy affects inflammatory marker levels. Wang et al. 88 demonstrated a better improvement in plaque stability and necrotic plaque composition because of the potent inhibitory effects of ezetimibe and rosuvastatin on inflammatory parameters (hs‐Crp and IL‐6) in patients with coronary atherosclerotic disease treated with a combination of ezetimibe and rosuvastatin vs. rosuvastatin alone. They also proposed that LDL lowering to certain levels results in a reduction in inflammatory markers, which subsequently affects plaque size/stability. Indeed, it was demonstrated by Tsujita et al. 89 that the addition of ezetimibe to statin therapy causes greater coronary plaque regression, which might be attributed to inhibition of cholesterol absorption and a stronger lipid‐lowering effect when compared with statin monotherapy. These studies suggested that the cholesterol‐lowering effect is the key mechanism for the atheroprotective effect of ezetimibe either alone or in combination with statins. By contrast, Crea and Niccoli 90 have commented that ezetimibe seems to modulate atherosclerotic plaque regression beyond its lipid‐lowering effects by modulating the genes associated with inflammation and/or oxidative stress, monocyte/macrophage activity and the inhibition of smooth muscle cell proliferation. Moreover, Yagi et al. 48 showed that ezetimibe significantly decreases LDL‐cholesterol and hs‐CRP levels in patients with hypercholesterolaemia. Interestingly, the changes in serum hs‐CRP levels were not correlated with a decrease in the LDL‐cholesterol level. These findings suggest that ezetimibe has cardiovascular protective actions, including anti‐inflammatory effects, that are at least partially independent of the LDL‐cholesterol‐lowering effects. In other words, the addition of ezetimibe to statin therapy could be beneficial by increasing both the hypolipidaemic and anti‐inflammatory effects of ezetimibe when compared with statin monotherapy.
The present meta‐analysis had potential limitations. First, there were few studies assessing the impact of statin therapy on plasma adipokine levels, which could have restricted the power of the analysis. In particular, most of the studies assessing the impact of ezetimibe on plasma adiponectin levels reported an increasing effect, yet the pooled effect did not reach statistical significance, which might be attributed to the small trial sizes. This suggests the need for further, larger studies to enable a robust conclusion to be reached on the effect of ezetimibe on plasma adiponectin levels. Second, there was heterogeneity among the included studies in terms of trial protocol, recruited population, statin type and the duration of treatment. To address this, we assessed the interstudy heterogeneity and applied a random‐effects model when the heterogeneity was found to be high. Third, few studies were performed in overweight/obese or diabetic populations, thereby suggesting a need for additional trials in these specific conditions which are associated with adipokine abnormalities. Finally, most of the studies did not evaluate the association between changes in plasma adipokine levels and cardiovascular outcomes.
Conclusion
The present meta‐analysis demonstrated that the addition of ezetimibe to statin therapy might be beneficial not only because of enhancing hypolipidaemic effects, but also due to reduced levels of plasma proinflammatory TNF‐α, suggesting that there is a reduction in the cardiometabolic risk after ezetimibe/statin combination treatment.
Competing Interests
All authors declare no support from any organization for the submitted work, no financial relationships with any organizations that might have an interest in the submitted work, no other relationships or activities that could appear to have influenced the submitted work.
Contributors
A.S. was responsible for the concept and design of the study and for the statistical analysis; A.S., E.S., G.D. and P.M. analysed the data; and P.N., E.D. and A.S. wrote the manuscript.
Dolezelova, E. , Stein, E. , Derosa, G. , Maffioli, P. , Nachtigal, P. , and Sahebkar, A. (2017) Effect of ezetimibe on plasma adipokines: a systematic review and meta‐analysis. Br J Clin Pharmacol, 83: 1380–1396. doi: 10.1111/bcp.13250.
References
- 1. Southan C, Sharman JL, Benson HE, Faccenda E, Pawson AJ, Alexander SP, et al. The IUPHAR/BPS Guide to PHARMACOLOGY in 2016: towards curated quantitative interactions between 1300 protein targets and 6000 ligands. Nucl Acids Res 2016; 44 (Database Issue): D1054–D1068. [DOI] [PMC free article] [PubMed] [Google Scholar]
- 2. Alexander SPH, Kelly E, Marrion N, Peters JA, Benson HE, Faccenda E, et al. The Concise Guide to PHARMACOLOGY 2015/16: Overview. Br J Pharmacol 2015; 172: 5729–5743. [DOI] [PMC free article] [PubMed] [Google Scholar]
- 3. Alexander SPH, Fabbro D, Kelly E, Marrion N, Peters JA, Benson HE, et al. The Concise Guide to PHARMACOLOGY 2015/16: Enzymes. Br J Pharmacol 2015; 172: 6024–6109. [DOI] [PMC free article] [PubMed] [Google Scholar]
- 4. Alexander SPH, Kelly E, Marrion N, Peters JA, Benson HE, Faccenda E, et al. The Concise Guide to PHARMACOLOGY 2015/16: Transporters. Br J Pharmacol 2015; 172: 6110–6202. [DOI] [PMC free article] [PubMed] [Google Scholar]
- 5. Ritchie SA, Connell JM. The link between abdominal obesity, metabolic syndrome and cardiovascular disease. Nutr Metab Cardiovasc Dis 2007; 17: 319–326. [DOI] [PubMed] [Google Scholar]
- 6. Ritchie SA, Ewart MA, Perry CG, Connell JM, Salt IP. The role of insulin and the adipocytokines in regulation of vascular endothelial function. Clin Sci (Lond) 2004; 107: 519–532. [DOI] [PubMed] [Google Scholar]
- 7. Von Hunolstein JJ, Nebigil CG. Can prokineticin prevent obesity and insulin resistance? Curr Opin Endocrinol Diabetes Obes 2015; 22: 367–373. [DOI] [PubMed] [Google Scholar]
- 8. Diamant M, Lamb HJ, van de Ree MA, Endert EL, Groeneveld Y, Bots ML, et al. The association between abdominal visceral fat and carotid stiffness is mediated by circulating inflammatory markers in uncomplicated type 2 diabetes. J Clin Endocrinol Metab 2005; 90: 1495–1501. [DOI] [PubMed] [Google Scholar]
- 9. Hotamisligil GS. The role of TNFalpha and TNF receptors in obesity and insulin resistance. J Intern Med 1999; 245: 621–625. [DOI] [PubMed] [Google Scholar]
- 10. Ukkola O, Santaniemi M. Adiponectin: a link between excess adiposity and associated comorbidities? J Mol Med (Berl) 2002; 80: 696–702. [DOI] [PubMed] [Google Scholar]
- 11. Scotece M, Conde J, Vuolteenaho K, Koskinen A, López V, Gómez‐Reino J, et al. Adipokines as drug targets in joint and bone disease. Drug Discov Today 2014; 19: 241–258. [DOI] [PubMed] [Google Scholar]
- 12. He G, Bruun JM, Lihn AS, Pedersen SB, Richelsen B. Stimulation of PAI‐1 and adipokines by glucose in human adipose tissue in vitro . Biochem Biophys Res Commun 2003; 310: 878–883. [DOI] [PubMed] [Google Scholar]
- 13. Krysiak R, Zmuda W, Marek B, Okopień B. The effect of short‐term combined treatment with simvastatin and ezetimibe on circulating adipokine levels in patients with isolated hypercholesterolemia. Endokrynol Pol 2014; 65: 275–280. [DOI] [PubMed] [Google Scholar]
- 14. Parizadeh SM, Azarpazhooh MR, Moohebati M, Nematy M, Ghayour‐Mobarhan M, Tavallaie S, et al. Simvastatin therapy reduces prooxidant‐antioxidant balance: results of a placebo‐controlled cross‐over trial. Lipids 2011; 46: 333–340. [DOI] [PubMed] [Google Scholar]
- 15. Sahebkar A, Catena C, Ray KK, Vallejo‐Vaz AJ, Reiner Ž, Sechi LA, et al. Impact of statin therapy on plasma levels of plasminogen activator inhibitor‐1: a systematic review and meta‐analysis of randomised controlled trials. Thromb Haemost 2016; 116: 162–171. [DOI] [PubMed] [Google Scholar]
- 16. Sahebkar A, Simental‐Mendía LE, Pedone C, Ferretti G, Nachtigal P, Bo S, et al. Statin therapy and plasma free fatty acids: a systematic review and meta‐analysis of controlled clinical trials. Br J Clin Pharmacol 2016; 81: 807–818. [DOI] [PMC free article] [PubMed] [Google Scholar]
- 17. Sahebkar A, Serban C, Mikhailidis DP, Undas A, Lip GYH, Muntner P, et al. Association between statin use and plasma d‐dimer levels: A systematic review and meta‐analysis of randomised controlled trials. Thrombosis and Haemostasis 2015; 114: 546–557. [DOI] [PubMed] [Google Scholar]
- 18. Ferretti G, Bacchetti T, Sahebkar A. Effect of statin therapy on paraoxonase‐1 status: a systematic review and meta‐analysis of 25 clinical trials. Prog Lipid Res 2015; 60: 50–73. [DOI] [PubMed] [Google Scholar]
- 19. Sahebkar A, Ponziani MC, Goitre I, Bo S. Does statin therapy reduce plasma VEGF levels in humans? A systematic review and meta‐analysis of randomized controlled trials. Metabolism 2015; 64: 1466–1476. [DOI] [PubMed] [Google Scholar]
- 20. Sahebkar A, Kotani K, Serban C, Ursoniu S, Mikhailidis DP, Jones SR, et al. for the Lipid and Blood Pressure Meta‐analysis Collaboration (LBPMC) GroupStatin therapy reduces plasma endothelin‐1 concentrations: a meta‐analysis of 15 randomized controlled trials. Atherosclerosis 2015; 241: 433–442. [DOI] [PubMed] [Google Scholar]
- 21. Krysiak R, Labuzek K, Okopien B. Effect of atorvastatin and fenofibric acid on adipokine release from visceral and subcutaneous adipose tissue of patients with mixed dyslipidemia and normolipidemic subjects. Pharmacol Rep 2009; 61: 1134–1145. [DOI] [PubMed] [Google Scholar]
- 22. Krysiak R, Zmuda W, Okopien B. The effect of short‐term simvastatin treatment on plasma adipokine levels in patients with isolated hypercholesterolemia: a preliminary report. Pharmacol Rep 2014; 66: 880–884. [DOI] [PubMed] [Google Scholar]
- 23. Ballantyne CM, Blazing MA, King TR, Brady WE, Palmisano J. Efficacy and safety of ezetimibe co‐administered with simvastatin compared with atorvastatin in adults with hypercholesterolemia. Am J Cardiol 2004; 93: 1487–1494. [DOI] [PubMed] [Google Scholar]
- 24. Battaggia A, Donzelli A, Font M, Molteni D, Galvano A. Clinical efficacy and safety of ezetimibe on major cardiovascular endpoints: systematic review and meta‐analysis of randomized controlled trials. PLoS One 2015; 10: e0124587. [DOI] [PMC free article] [PubMed] [Google Scholar]
- 25. Berthold HK, Berneis K, Mantzoros CS, Krone W, Gouni‐Berthold I. Effects of simvastatin and ezetimibe on interleukin‐6 and high‐sensitivity C‐reactive protein. Scand Cardiovasc J Suppl 2013; 47: 20–27. [DOI] [PubMed] [Google Scholar]
- 26. Blanco‐Colio LM, Martín‐Ventura JL, Gómez‐Guerrero C, Masramon X, de Teresa E, Farsang C, et al. Adiponectin plasma levels are increased by atorvastatin treatment in subjects at high cardiovascular risk. Eur J Pharmacol 2008; 586: 259–265. [DOI] [PubMed] [Google Scholar]
- 27. Hu Y, Tong G, Xu W, Pan J, Ryan K, Yang R, et al. Anti‐inflammatory effects of simvastatin on adipokines in type 2 diabetic patients with carotid atherosclerosis. Diab Vasc Dis Res 2009; 6: 262–268. [DOI] [PubMed] [Google Scholar]
- 28. Kurobe H, Aihara K, Higashida M, Hirata Y, Nishiya M, Matsuoka Y, et al. Ezetimibe monotherapy ameliorates vascular function in patients with hypercholesterolemia through decreasing oxidative stress. J Atheroscler Thromb 2011; 18: 1080–1089. [DOI] [PubMed] [Google Scholar]
- 29. Sun YM, Li J, Luan Y, Wang LF. Effect of statin therapy on leptin levels in patients with coronary heart disease. Peptides 2010; 31: 1205–1207. [DOI] [PubMed] [Google Scholar]
- 30. Takase H, Dohi Y, Okado T, Hashimoto T, Goto Y, Kimura G. Effects of ezetimibe on visceral fat in the metabolic syndrome: a randomised controlled study. Eur J Clin Invest 2012; 42: 1287–1294. [DOI] [PubMed] [Google Scholar]
- 31. Gouni‐Berthold I, Berthold HK, Chamberland JP, Krone W, Mantzoros CS. Short‐term treatment with ezetimibe, simvastatin or their combination does not alter circulating adiponectin, resistin or leptin levels in healthy men. Clin Endocrinol (Oxf) 2008; 68: 536–541. [DOI] [PubMed] [Google Scholar]
- 32. Kater AL, Batista MC, Ferreira SR. Improved endothelial function with simvastatin but unchanged insulin sensitivity with simvastatin or ezetimibe. Metabolism 2010; 59: 921–926. [DOI] [PubMed] [Google Scholar]
- 33. Otto C, Otto B, Frost RJ, Vogeser M, Pfeiffer AF, Spranger J, et al. Short‐term therapy with atorvastatin or fenofibrate does not affect plasma ghrelin, resistin or adiponectin levels in type 2 diabetic patients with mixed hyperlipoproteinaemia. Acta Diabetol 2007; 44: 65–68. [DOI] [PubMed] [Google Scholar]
- 34. Park H, Shima T, Yamaguchi K, Mitsuyoshi H, Minami M, Yasui K, et al. Efficacy of long‐term ezetimibe therapy in patients with nonalcoholic fatty liver disease. J Gastroenterol 2011; 46: 101–107. [DOI] [PubMed] [Google Scholar]
- 35. Moher D, Liberati A, Tetzlaff J, Altman DG, PRISMA Group . Preferred reporting items for systematic reviews and meta‐analyses: the PRISMA statement. BMJ 2009; 339: b2535. [DOI] [PMC free article] [PubMed] [Google Scholar]
- 36. Higgins J, Green S. Cochrane Handbook for Systematic Reviews of Interventions. London: The Cochrane Collaboration, 2009.Version 5.0.2 [Google Scholar]
- 37. Borenstein M, Hedges L, Higgins J. Comprehensive Meta‐Analysis. Englewood, NJ: Biostat, 2005.Version 2 [Google Scholar]
- 38. Sahebkar A, Rathouska J, Derosa G, Maffioli P, Nachtigal P. Statin impact on disease activity and C‐reactive protein concentrations in systemic lupus erythematosus patients: a systematic review and meta‐analysis of controlled trials. Autoimmun Rev 2016; 15: 344–353. [DOI] [PubMed] [Google Scholar]
- 39. Banach M, Serban C, Sahebkar A, Mikhailidis DP, Ursoniu S, Ray KK, et al. Impact of statin therapy on coronary plaque composition: a systematic review and meta‐analysis of virtual histology intravascular ultrasound studies. BMC Med 2015; 13: 229. [DOI] [PMC free article] [PubMed] [Google Scholar]
- 40. Sahebkar A. A systematic review and meta‐analysis of the effects of pycnogenol on plasma lipids. J Cardiovasc Pharmacol Ther 2014; 19: 244–255. [DOI] [PubMed] [Google Scholar]
- 41. Derosa G, Maffioli P, Sahebkar A. Improvement of plasma adiponectin, leptin and C‐reactive protein concentrations by orlistat: a systematic review and meta‐analysis. Br J Clin Pharmacol 2016; 81: 819–834. [DOI] [PMC free article] [PubMed] [Google Scholar]
- 42. Derosa G, Maffioli P, Sahebkar A. Plasma uric acid concentrations are reduced by fenofibrate: a systematic review and meta‐analysis of randomized placebo‐controlled trials. Pharmacol Res 2015; 102: 63–70. [DOI] [PubMed] [Google Scholar]
- 43. Banach M, Serban C, Ursoniu S, Rysz J, Muntner P, Toth PP, et al. for the Lipid and Blood Pressure Meta‐analysis Collaboration (LBPMC) GroupStatin therapy and plasma coenzyme Q10 concentrations – a systematic review and meta‐analysis of placebo‐controlled trials. Pharmacol Res 2015; 99: 329–336. [DOI] [PubMed] [Google Scholar]
- 44. Sahebkar A. Are curcuminoids effective C‐reactive protein‐lowering agents in clinical practice? Evidence from a meta‐analysis. Phytother Res 2014; 28: 633–642. [DOI] [PubMed] [Google Scholar]
- 45. Hozo SP, Djulbegovic B, Hozo I. Estimating the mean and variance from the median, range, and the size of a sample. BMC Med Res Methodol 2005; 5: 13. [DOI] [PMC free article] [PubMed] [Google Scholar]
- 46. Duval S, Tweedie R. Trim and fill: a simple funnel‐plot‐based method of testing and adjusting for publication bias in meta‐analysis. Biometrics 2000; 56: 455–463. [DOI] [PubMed] [Google Scholar]
- 47. Lee SH, Kang SM, Park S, Jang Y, Chung N, Choi D. The effects of statin monotherapy and low‐dose statin/ezetimibe on lipoprotein‐associated phospholipase A2 . Clin Cardiol 2011; 34: 108–112. [DOI] [PMC free article] [PubMed] [Google Scholar]
- 48. Yagi S, Akaike M, Aihara K, Iwase T, Ishikawa K, Yoshida S, et al. Ezetimibe ameliorates metabolic disorders and microalbuminuria in patients with hypercholesterolemia. J Atheroscler Thromb 2010; 17: 173–180. [DOI] [PubMed] [Google Scholar]
- 49. Almquist T, Jacobson SH, Mobarrez F, Näsman P, Hjemdahl P. Lipid‐lowering treatment and inflammatory mediators in diabetes and chronic kidney disease. Eur J Clin Invest 2014; 44: 276–284. [DOI] [PubMed] [Google Scholar]
- 50. Dawson JA, Choke E, Loftus IM, Cockerill GW, Thompson MM. A randomised placebo‐controlled double‐blind trial to evaluate lipid‐lowering pharmacotherapy on proteolysis and inflammation in abdominal aortic aneurysms. Eur J Vasc Endovasc Surg 2011; 41: 28–35. [DOI] [PubMed] [Google Scholar]
- 51. Ferreira CE, França CN, Izar MC, Camargo LM, Roman RM, Fonseca FA. High‐intensity statin monotherapy versus moderate‐intensity statin plus ezetimibe therapy: effects on vascular biomarkers. Int J Cardiol 2015; 180: 78–79. [DOI] [PubMed] [Google Scholar]
- 52. Florentin M, Liberopoulos EN, Tellis CC, Derdemezis CS, Elisaf M, Tselepis A. Effects of rimonabant, as monotherapy and in combination with fenofibrate or ezetimibe, on plasma adipokine levels: a pilot study. Angiology 2010; 61: 365–371. [DOI] [PubMed] [Google Scholar]
- 53. Habara M, Nasu K, Terashima M, Ko E, Yokota D, Ito T, et al. Impact on optical coherence tomographic coronary findings of fluvastatin alone versus fluvastatin + ezetimibe. Am J Cardiol 2014; 113: 580–587. [DOI] [PubMed] [Google Scholar]
- 54. Hajer GR, Dallinga‐Thie GM, van Vark‐van der Zee LC, Olijhoek JK, Visseren FL. Lipid‐lowering therapy does not affect the postprandial drop in high density lipoprotein‐cholesterol (HDL‐c) plasma levels in obese men with metabolic syndrome: a randomized double blind crossover trial. Clin Endocrinol (Oxf) 2008; 69: 870–877. [DOI] [PubMed] [Google Scholar]
- 55. Chan DC, Watts GF, Gan SK, Ooi EM, Barrett PH. Effect of ezetimibe on hepatic fat, inflammatory markers, and apolipoprotein B‐100 kinetics in insulin‐resistant obese subjects on a weight loss diet. Diabetes Care 2010; 33: 1134–1139. [DOI] [PMC free article] [PubMed] [Google Scholar]
- 56. Kater AL, Batista MC, Ferreira SR. Synergistic effect of simvastatin and ezetimibe on lipid and pro‐inflammatory profiles in pre‐diabetic subjects. Diabetol Metab Syndr 2010; 2: 34. [DOI] [PMC free article] [PubMed] [Google Scholar]
- 57. Kikuchi K, Nezu U, Inazumi K, Miyazaki T, Ono K, Orime K, et al. Double‐blind randomized clinical trial of the effects of ezetimibe on postprandial hyperlipidaemia and hyperglycaemia. J Atheroscler Thromb 2012; 19: 1093–1101. [DOI] [PubMed] [Google Scholar]
- 58. Kovarnik T, Mintz GS, Skalicka H, Kral A, Horak J, Skulec R, et al. Virtual histology evaluation of atherosclerosis regression during atorvastatin and ezetimibe administration: HEAVEN study. Circ J 2012; 76: 176–183. [DOI] [PubMed] [Google Scholar]
- 59. Krysiak R, Zmuda W, Okopień B. The effect of ezetimibe and simvastatin on hemostasis in patients with isolated hypercholesterolemia. Fundam Clin Pharmacol 2012; 26: 424–431. [DOI] [PubMed] [Google Scholar]
- 60. Krysiak R, Zmuda W, Okopien B. The effect of ezetimibe on adipose tissue hormones in patients with isolated hypercholesterolemia. Pharmacol Rep 2014; 66: 442–447. [DOI] [PubMed] [Google Scholar]
- 61. Krysiak R, Zmuda W, Okopien B. The effect of simvastatin‐ezetimibe combination therapy on adipose tissue hormones and systemic inflammation in patients with isolated hypercholesterolemia. Cardiovasc Ther 2014; 32: 40–46. [DOI] [PubMed] [Google Scholar]
- 62. Liu LQ. Comparative study of high‐dose Xuezhikang and low‐dose Xuezhikang plus ezetimibe on pro‐ and anti‐inflammatory markers. Clin Lipidol 2013; 8: 151–157. [Google Scholar]
- 63. Rudofsky G, Reismann P, Groener JB, Djuric Z, Fleming T, Metzner C, et al. Identical LDL‐cholesterol lowering but non‐identical effects on NF‐kappaB activity: high dose simvastatin vs combination therapy with ezetimibe. Atherosclerosis 2012; 223: 190–196. [DOI] [PubMed] [Google Scholar]
- 64. Takeshita Y, Takamura T, Honda M, Kita Y, Zen Y, Kato K, et al. The effects of ezetimibe on non‐alcoholic fatty liver disease and glucose metabolism: a randomised controlled trial. Diabetologia 2014; 57: 878–890. [DOI] [PubMed] [Google Scholar]
- 65. Undas A, Machnik A, Potaczek DP, Wypasek E, Zmudka K, Tracz W. Ezetimibe combined with simvastatin compared with simvastatin alone results in a greater suppression of oxidative stress and enhanced fibrinolysis in patients after acute coronary events. J Cardiovasc Pharmacol 2011; 58: 167–172. [DOI] [PubMed] [Google Scholar]
- 66. Yamazaki D, Ishida M, Watanabe H, Nobori K, Oguma Y, Terata Y, et al. Comparison of anti‐inflammatory effects and high‐density lipoprotein cholesterol levels between therapy with quadruple‐dose rosuvastatin and rosuvastatin combined with ezetimibe. Lipids Health Dis 2013; 12: 9. [DOI] [PMC free article] [PubMed] [Google Scholar]
- 67. Mihos CG, Pineda AM, Santana O. Cardiovascular effects of statins, beyond lipid‐lowering properties. Pharmacol Res 2014; 88: 12–19. [DOI] [PubMed] [Google Scholar]
- 68. Pasterkamp G, van Lammeren GW. Pleiotropic effects of statins in atherosclerotic disease. Expert Rev Cardiovasc Ther 2010; 8: 1235–1237. [DOI] [PubMed] [Google Scholar]
- 69. Kapur NK, Musunuru K. Clinical efficacy and safety of statins in managing cardiovascular risk. Vasc Health Risk Manag 2008; 4: 341–353. [DOI] [PMC free article] [PubMed] [Google Scholar]
- 70. Sinzinger H, Wolfram R, Peskar BA. Muscular side effects of statins. J Cardiovasc Pharmacol 2002; 40: 163–171. [DOI] [PubMed] [Google Scholar]
- 71. Michalska‐Kasiczak M, Sahebkar A, Mikhailidis DP, Rysz J, Muntner P, Toth PP, et al. for the Lipid and Blood Pressure Meta‐analysis Collaboration (LBPMC) GroupAnalysis of vitamin D levels in patients with and without statin‐associated myalgia – a systematic review and meta‐analysis of 7 studies with 2420 patients. Int J Cardiol 2015; 178: 111–116. [DOI] [PubMed] [Google Scholar]
- 72. Kosoglou T, Statkevich P, Johnson‐Levonas AO, Paolini JF, Bergman AJ, Alton KB. Ezetimibe: a review of its metabolism, pharmacokinetics and drug interactions. Clin Pharmacokinet 2005; 44: 467–494. [DOI] [PubMed] [Google Scholar]
- 73. Pascual Izuel JM, Rodilla Sala E, Sánchez Juan C. Clinical efficacy of ezetimibe and combined use with statins. Rev Clin Esp 2005; 205: 496–498. [DOI] [PubMed] [Google Scholar]
- 74. Gupta M, Szmitko PE, Tsigoulis M, Braga MF, Kajil M, Herjikaka S, et al. Effects of ezetimibe add‐on to statin therapy on adipokine production in patients with metabolic syndrome and stable vascular disease. J Cardiovasc Pharmacol 2010; 56: 241–245. [DOI] [PubMed] [Google Scholar]
- 75. Xu H, Uysal KT, Becherer JD, Arner P, Hotamisligil GS. Altered tumor necrosis factor‐alpha (TNF‐alpha) processing in adipocytes and increased expression of transmembrane TNF‐alpha in obesity. Diabetes 2002; 51: 1876–1883. [DOI] [PubMed] [Google Scholar]
- 76. Hotamisligil GS, Shargill NS, Spiegelman BM. Adipose expression of tumor necrosis factor‐alpha: direct role in obesity‐linked insulin resistance. Science 1993; 259: 87–91. [DOI] [PubMed] [Google Scholar]
- 77. Coppack SW. Pro‐inflammatory cytokines and adipose tissue. Proc Nutr Soc 2001; 60: 349–356. [DOI] [PubMed] [Google Scholar]
- 78. Klover PJ, Clementi AH, Mooney RA. Interleukin‐6 depletion selectively improves hepatic insulin action in obesity. Endocrinology 2005; 146: 3417–3427. [DOI] [PubMed] [Google Scholar]
- 79. Gustafson B. Adipose tissue, inflammation and atherosclerosis. J Atheroscler Thromb 2010; 17: 332–341. [DOI] [PubMed] [Google Scholar]
- 80. Bułdak Ł, Machnik G, Bułdak RJ, Łabuzek K, Bołdys A, Okopień B. Exenatide and metformin express their anti‐inflammatory effects on human monocytes/macrophages by the attenuation of MAPKs and NFkappaB signaling. Naunyn Schmiedebergs Arch Pharmacol 2016; 389: 1103–1115. [DOI] [PubMed] [Google Scholar]
- 81. Del Porto F, Laganà B, Lai S, Nofroni I, Tinti F, Vitale M, et al. Response to anti‐tumour necrosis factor alpha blockade is associated with reduction of carotid intima‐media thickness in patients with active rheumatoid arthritis. Rheumatology (Oxford) 2007; 46: 1111–1115. [DOI] [PubMed] [Google Scholar]
- 82. Cao YY, Chen ZW, Gao YH, Wang XX, Ma JY, Chang SF, et al. Exenatide reduces tumor necrosis factor‐alpha‐induced apoptosis in cardiomyocytes by alleviating mitochondrial dysfunction. Chin Med J (Engl) 2015; 128: 3211–3218. [DOI] [PMC free article] [PubMed] [Google Scholar]
- 83. Link A, Ayadhi T, Böhm M, Nickenig G. Rapid immunomodulation by rosuvastatin in patients with acute coronary syndrome. Eur Heart J 2006; 27: 2945–2955. [DOI] [PubMed] [Google Scholar]
- 84. Xie W, Li P, Wang Z, Chen J, Lin Z, Liang X, et al. Rosuvastatin may reduce the incidence of cardiovascular events in patients with acute coronary syndromes receiving percutaneous coronary intervention by suppressing miR‐155/SHIP‐1 signaling pathway. Cardiovasc Ther 2014; 32: 276–282. [DOI] [PubMed] [Google Scholar]
- 85. Zakynthinos E, Pappa N. Inflammatory biomarkers in coronary artery disease. J Cardiol 2009; 53: 317–333. [DOI] [PubMed] [Google Scholar]
- 86. Bahceci M, Gokalp D, Bahceci S, Tuzcu A, Atmaca S, Arikan S. The correlation between adiposity and adiponectin, tumor necrosis factor alpha, interleukin‐6 and high sensitivity C‐reactive protein levels. Is adipocyte size associated with inflammation in adults? J Endocrinol Invest 2007; 30: 210–214. [DOI] [PubMed] [Google Scholar]
- 87. Bohula EA, Giugliano RP, Cannon CP, Zhou J, Murphy SA, et al. Achievement of dual low‐density lipoprotein cholesterol and high‐sensitivity C‐reactive protein targets more frequent with the addition of ezetimibe to simvastatin and associated with better outcomes in IMPROVE‐IT. Circulation 2015; 132: 1224–1233. [DOI] [PubMed] [Google Scholar]
- 88. Wang X, Zhao X, Li L, Yao H, Jiang Y, Zhang J. Effects of combination of ezetimibe and rosuvastatin on coronary artery plaque in patients with coronary heart disease. Heart Lung Circ 2016; 25: 459–465. [DOI] [PubMed] [Google Scholar]
- 89. Tsujita K, Sugiyama S, Sumida H, Shimomura H, Yamashita T, Yamanaga K, et al. for the PRECISE‐IVUS InvestigatorsImpact of dual lipid‐lowering strategy with ezetimibe and atorvastatin on coronary plaque regression in patients with percutaneous coronary intervention: the multicenter randomized controlled PRECISE‐IVUS trial. J Am Coll Cardiol 2015; 66: 495–507. [DOI] [PubMed] [Google Scholar]
- 90. Crea F, Niccoli G. Ezetimibe and plaque regression: cholesterol lowering or pleiotropic effects? J Am Coll Cardiol 2015; 66: 508–510. [DOI] [PubMed] [Google Scholar]