Abstract
Aims
A new, long‐acting, subcutaneous (SC) formulation of risperidone (RBP‐7000) has been developed for the treatment of schizophrenia to address issues of non‐adherence associated with oral risperidone treatment. The objective of this work was to establish an exposure‐response relationship between total active moiety (AM) plasma exposure (risperidone + 9‐hydroxy‐risperidone) and Positive and Negative Syndrome Scale (PANSS) or Clinical Global Impression severity (CGI‐S) scores using data from a registration trial.
Methods
This was a Phase 3 randomized, double‐blind, placebo‐controlled, multicenter study in 354 patients to evaluate the efficacy, safety and tolerability of RBP‐7000 (90 mg and 120 mg). Non‐linear mixed effects modelling was used to develop an integrated population pharmacokinetic/pharmacodynamic (PK/PD) model that included a joint PK model for risperidone and 9‐hydroxy‐risperidone with placebo and drug‐effect models to establish the relation between total AM exposure and PANSS or CGI‐S scores.
Results
CYP2D6 poor and intermediate metabolizers had lower formation rates of 9‐hydroxy‐risperidone (94% and 76% lower, respectively) compared to the extensive CYP2D6 metabolizers. The maximum placebo‐corrected relative decrease in PANSS score from baseline following RBP‐7000 treatment was 5.4%, half of which could be achieved at plasma concentrations of 4.6 ng ml−1 of the total AM. A proportional odds model for the CGI‐S score related the total AM plasma concentration to the probability of improving/worsening scores over time.
Conclusions
Exposure‐response analysis was established between total AM concentrations and PANSS and CGI‐S scores, with good precision in parameter estimates. CYP2D6 phenotype on risperidone metabolism was the only identified covariate.
Keywords: CGI‐S, exposure‐response, long‐acting, PANSS, pharmacokinetic/pharmacodynamic (PK/PD), risperidone
What is Already Known about this Subject
The major cause of treatment failure in schizophrenia is poor drug compliance rates (~58%).
A bi‐weekly administered risperidone formulation provides some benefit to improve these rates and therapeutic success, but there is room for a longer acting product.
What This Study Adds
This work establishes an exposure‐response relationship for a long‐acting injectable formulation of risperidone given once a month for the treatment of schizophrenia.
This work models both the PANSS and CGI‐S outcome together for the first time adding strength to the overall analysis.
Original data from a registration clinical trial and knowledge from prior work were integrated seamlessly to predict exposure for this long‐acting formulation, and relate exposure to clinical outcome measures such as PANSS and CGI‐S.
Table of Links
| TARGETS |
|---|
| GPCRs 1 |
| D2 receptor |
This Table lists key protein targets in this article that are hyperlinked to corresponding entries in http://www.guidetopharmacology.org, the common portal for data from the IUPHAR/BPS Guide to PHARMACOLOGY 1, and are permanently archived in the Concise Guide to PHARMACOLOGY 2015/16 2.
Introduction
RBP‐7000 is a long‐acting formulation of risperidone administered once monthly via subcutaneous (SC) injection for the treatment of schizophrenia. RBP‐7000 is being developed to address issues of compliance and non‐adherence associated with oral risperidone treatment. The safety, tolerability and pharmacokinetic (PK) profile of RBP‐7000 were evaluated in two Phase 1 single dose studies (a first‐in‐man study and a single ascending dose study) and in one Phase 2a multiple ascending dose study, all conducted in clinically stable schizophrenic male and female adult patients. These studies showed that the SC injection of RBP‐7000 resulted in sustained plasma concentrations of the total active moiety over the dosing interval (28 days), and that plasma concentrations close to steady‐state were reached after the first SC injection when transitioning from oral risperidone therapy.
RBP‐7000 uses the well‐established ATRIGEL® delivery system. The ATRIGEL delivery system is a sterile, polymeric solution of a biodegradable poly(dl‐lactide‐co‐glycolide) (PLG or PLGH) dissolved in N‐methyl‐2‐pyrrolidone (NMP), a water‐miscible, biocompatible solvent. It is composed of 45% (w/w%) 80/20 PLGH and 55% (w/w%) NMP. The risperidone in RBP‐7000 is both dissolved and suspended in this polymeric solution. After SC injection, the delivery system solidifies upon contact with bodily fluids, and the resulting biodegradable implant delivers risperidone for an extended period of time. Depending on the dose strength (90 or 120 mg), the injection volume varies between 0.6 and 0.8 ml.
Population PK models of RBP‐7000 were previously developed using data from the single and multiple ascending dose studies 3, 4. In the single ascending dose study, 45 clinically stable schizophrenic patients with confirmed diagnosis of paranoid, residual or undifferentiated schizophrenia were randomized to receive a single dose of one of the three RBP‐7000 dose levels (60, 90 and 120 mg), with 15 patients per cohort. The multiple ascending dose study recruited a similar number of patients within the same population as the single ascending dose study and evaluated the effects of three monthly doses (60, 90 and 120 mg) after switching subjects from 2, 3 or 4 mg day−1 oral risperidone, respectively. Risperidone and 9‐hydroxy(OH)‐risperidone plasma concentration data were well described by a population PK model having the same structural model as that used for the modelling of the single dose data. Steady‐state was reached after the second or third RBP‐7000 injection, but plasma concentrations close to steady‐state values were obtained right after the first SC injection when switching from oral risperidone therapy 4. Data from these two studies were analysed together using a single population PK model 5 to guide dose selection for Phase 3 trials.
The purpose of the present modelling work was to explore and establish an exposure‐response relationship between total active moiety exposure (risperidone + 9‐OH‐risperidone) and Positive and Negative Syndrome Scale (PANSS) or Clinical Global Impression severity (CGI‐S) scores, using data from a Phase 3 registration trial (NCT02109562). The objectives of the population analysis for RBP‐7000 were, firstly, to characterize the PK profile of RBP‐7000 in schizophrenic patients and to assess the effect of selected covariates on the PK of RBP‐7000 and, secondly, to characterize the PK/pharmacodynamic (PD) relationships between total active moiety plasma concentrations and the PANSS or CGI‐S scales.
Methods
A Phase 3, randomized, double‐blind, placebo‐controlled, multicentre study (NCT02109562) was conducted to evaluate the efficacy, safety and tolerability of RBP‐7000 (90 mg and 120 mg) as a treatment in subjects with acute schizophrenia, subjects in an acute psychotic state, or subjects in relapse with acute schizophrenic symptoms, who had a PANSS score of at least 80–120 and a score of >4 on at least two of the following four items: hallucinatory behaviour, delusions, conceptual disorganization or suspiciousness/persecution at screening. The study was conducted at 35 sites in accordance with the International Conference on Harmonization's Good Clinical Practice guidelines, Food and Drug Administration regulations governing clinical study conduct, and the 2013 Declaration of Helsinki and was approved by the Copernicus Group Institutional Review Board (Durham, NC). An informed consent document, approved by the independent ethics committee/institutional review board for each study site, was signed by the subject and the investigator before any study‐related procedures were performed.
Subjects were randomly assigned to receive 2 SC doses of either RBP‐7000 (90 or 120 mg) or placebo over 8 weeks. A total of 538 subjects were screened to enrol in this Phase 3 study. Only 354 subjects passed screening, of which 119 belonged to the placebo group and 116 and 119 belonged to the 90 mg and 120 mg treatment arms, respectively. Furthermore, 17 subjects (seven placebo, five 90 mg and five 120 mg) failed to make it to the intention‐to‐treat (ITT) group as they either did not receive at least one dose of RBP‐7000 or did not have at least one assessment post‐baseline that facilitates the calculation of change from baseline.
During the screening phase, all subjects received 0.25 mg of oral risperidone at Visit 1 (3–8 days before double‐blind treatment) and a second dose of 0.25 mg oral risperidone 24 h later to assess their tolerability to risperidone prior to receiving RBP‐7000. Subjects who passed screening were tapered off of their current oral anti‐psychotic (if applicable). Modifications to other pre‐existing treatments were not to be made for the explicit purpose of entering this study but were to be done only when deemed clinically appropriate by the investigator. Upon completion of all study participation requirements, subjects were randomized to one of the three study treatments at Visit 3 (Day 1), corresponding to the start of the 8‐week double‐blind treatment period: subjects received two SC injections of RBP‐7000 (90 mg or 120 mg) or placebo at a 28‐day interval, on Day 1 and on Day 29.
Pharmacokinetic sampling
A sparser PK blood sampling design as compared to Phase 1 and 2 data for analysis of risperidone and 9‐OH risperidone plasma levels were collected at specific time points. A pre‐dose sample on Day 1 was followed by post‐injection samples on Days 1–3, 8–15, 16–22 and on Day 29 just before the second SC injection of RBP‐7000. Following the second injection of RBP‐7000, samples were collected on Days 29–31, 36–42, 43–49 and 55–57.
Pharmacogenetic sampling
Blood samples for DNA analysis were collected before the first injection of RBP‐7000 on Day 1. These samples were collected to assess how the genetic variation in enzymes and receptors might affect the PK, safety and efficacy of RBP‐7000. Genotypes were assessed for cytochrome P450 2D6 (CYP2D6), dopamine D2 receptor (DRD2), serotonin 2C receptor (5‐HT2C), serotonin 2A receptor (5‐HT2A) and melanocortin 4 receptor (MCR4).
Laboratory tests
Various laboratory tests were conducted throughout the study duration at specified time points. Tests relating to liver function (aspartate aminotransferase – AST; alanine aminotransferase – ALT) and renal function (creatinine clearance – CRCL) were used as predictors to explore and account for the variability in PK exposure.
Bioanalysis
Plasma concentrations of risperidone and 9‐OH risperidone were determined using a validated method of liquid chromatography with tandem mass spectrometry (LC–MS/MS). The analytical methodology was based on the following procedure: 0.05 ml of human plasma containing internal standards (d4‐risperidone, d4‐9‐OH risperidone) was first acidified and then extracted using solid phase extraction. Analysis required evaporation of elute solvent before being reconstituted. An aliquot of the extract was injected onto a Sciex API 5500 LC–MS/MS equipped with an HPLC column. Quantitation was performed using 1/x 2 weighted linear least squares regression analysis generated from fortified plasma calibration standards prepared immediately prior to each run. The method was validated for specificity, linearity, lower limit of quantitation, precision, accuracy, recovery and stability for a range of 0.1–100 ng ml−1 for both risperidone and 9‐OH risperidone. The overall precision for both analytes was greater than 11.7%; the overall accuracy was within ±4.4%. The recoveries of both analytes and internal standards were greater than 91%. The established short‐term and long‐term stability covered the maximum sample storage time.
Efficacy assessments
The clinical assessments for efficacy included the PANSS and the CGI‐S scales. The PANSS score consists of 30 items, where each item is scored from 1 to 7 (1 indicating the absence of the symptom, and 7 indicating extreme suffering from the symptom). These 30 items are grouped into three subscales: positive (7 items), negative (7 items) and general psychopathology (16 items). PANSS scores were collected at baseline on Day 1 and on Days 15 ± 1, 29, 43 ± 1 and 57. A total of 1571 PANSS assessments were available for analysis from this 8‐week study.
CGI‐S represents the overall clinical severity of illness for each subject. To perform this assessment, the rater answered the following question: ‘Considering your total clinical experience with this particular population, how mentally ill is the patient at this time?’. Response choices included: 1 = normal, not at all ill; 2 = borderline mentally ill; 3 = mildly ill; 4 = moderately ill; 5 = markedly ill; 6 = severely ill; and 7 = among the most extremely ill patients. CGI‐S scores were collected at the same times as those for PANSS, i.e., at baseline on Visit 3 (Day 1) and on Days 15 ± 1, 29, 43 ± 1 and 57. A total of 1549 CGI‐S assessments were available for analysis from this 8‐week study.
Model development
A non‐linear mixed effects modelling approach to describe the time course of PK, PANSS and CGI‐S scores was implemented using the NONMEM 7.3 software 6. Perl‐speaks‐NONMEM 7 (PsN, v 4.4.0) was used to operate NONMEM. R software version 3.2.0 (www.r‐project.org) was used for graphical inspection of the results. Risperidone and 9‐OH risperidone plasma concentrations were used to estimate the parameters of the population PK model, while absolute PANSS scores and CGI‐S scores were used for the PD and PK/PD models. The first‐order conditional estimation (FOCE) method with or without interaction option in NONMEM was used to estimate population PK and PK/PD model parameters and, in the case of CGI‐S analysis, the LAPLACE method was used. Inter‐individual variability (IIV) for the structural model parameters was evaluated assuming lognormal or normal distributions of subject‐specific random effects:
where TV represents the population typical value of the PK and/or PD parameter, and P i is the value of the parameter for subject i. η i denotes an individual‐specific random effect that distinguishes the value of the i th subject from the TV. The η i is normally distributed with mean zero and variance ω 2. The IIV was expressed as percent coefficient of variation (% CV) that was calculated as for exponential models; for additive models, the CV was calculated as ω/TV.
The intra‐individual or residual variability (RUV) describes the variability in residual error, i.e. the variability that remains unexplained and refers to, for example, dosing inaccuracies, analytical assay error, or error in recording sampling times, and structural model misspecifications. A combined proportional and additive error model was used to describe RUV in the plasma concentration, while, an additive term was used to account for the unexplained variability in PANSS score as shown in the following equations:
where yij is the j th observation in the i th individual, is the expectation of yij under the model conditionally to subject i, ε ij , ε 1ij and ε 2ij are normally‐distributed random errors with mean zero and variance and , respectively. In the combined error model, and represent the additive and proportional variance components, respectively.
Model selection was based on comparison of the objective function values (δOFV: 3.84 for one additional estimated parameter, corresponding to a P‐value of <0.05) and the goodness‐of‐fit (GOF) plots. GOF was assessed graphically by evaluation of the agreement between observed and predicted plasma concentrations or PANSS scores, the individual predicted profiles vs. time, the range of individual weighted residuals (IWRES), conditional weighted residuals (CWRES) and expected weighted residuals (EWRES), and the shape of the distribution of these residuals about zero across the range of the predicted concentrations or PANSS scores. The percentage relative standard errors (% RSE) of the parameter estimates and reductions in both IIV and RUV were also used to discriminate between competing models.
Influences of patient and study‐specific covariates were evaluated as possible explanatory variables for the variability in the PK or PK/PD model parameters. Covariate analysis was performed in NONMEM using PsN with a stepwise forward additive approach followed by a stepwise backward elimination approach with P‐values of <0.05 and 0.001, respectively 8. Uncorrelated covariates were included in the model using different functional forms like linear, power and exponential functions.
Pharmacokinetic model
The population PK of risperidone and 9‐OH risperidone after administration of RBP‐7000 via the ATRIGEL delivery system was previously described using data from the single and multiple ascending dose studies for RBP‐7000 3, 4. Both studies were designed to provide rich plasma concentration–time data that could be used to characterize the PK of RBP‐7000 after single or multiple injections at various doses.
The analysis of the plasma concentration–time data from the present Phase 3 study was started using the base structural model developed in these two earlier studies (Figure 1). Briefly, a joint model for risperidone and 9‐OH risperidone described the PK profile of RBP‐7000 after SC injection. A dual absorption process was implemented to account for the double peak plasma concentration–time profiles observed for risperidone and 9‐OH‐risperidone. This dual absorption process was described by a first‐order rate constant (ka 1) associated with the first peak and a transit compartment absorption model, with absorption rate constant ka 2 and transit rate constant ktr, associated with the second peak to mimic the slow delivery of risperidone from the ATRIGEL delivery system. The PK model was empirical and designed purely to fit the profiles from this special delivery system. Together with this absorption sub‐model, a two‐compartment model with two first‐order elimination processes described the plasma disposition of risperidone; systemically available risperidone was partly converted into 9‐OH risperidone (kr 9) and partly eliminated by other routes (k rel). The plasma disposition of 9‐OH risperidone following RBP‐7000 administration was described by a one‐compartment model with first‐order elimination (k 9el). As the volume of distribution of the 9‐OH risperidone was not identifiable, it was set equal to the central volume of the parent compound.
Figure 1.
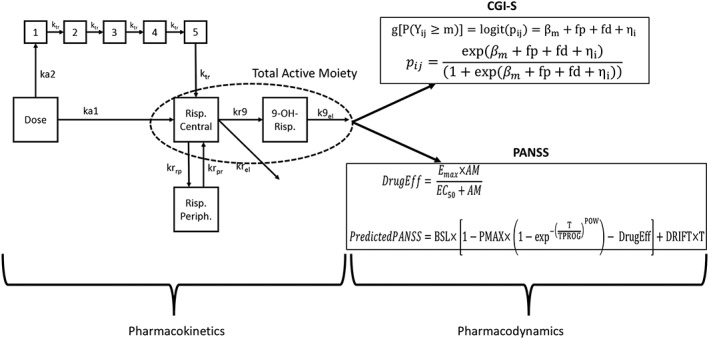
Structural PKPD model for RBP‐7000 used for analysis
Pharmacodynamic model for PANSS
PD models usually comprise an underlying disease progression model to capture the changing disease status of schizophrenia with time, and include treatment effects models (placebo and drug) that refer to all the underlying PK and PD processes involved in producing a treatment effect on the time course (t) of disease progression, as shown below:
where t 0 is the time at the start of the trial. In the present case, it is difficult to separate the disease progression from placebo response due to the episodic nature of schizophrenia and the short duration of the study. Hence, the overall disease progression + placebo response will be referred to as the placebo model.
Placebo response model
Several placebo response models were investigated before picking the one that best described the time course of PANSS in the placebo group of the Phase 3 study. Model exploration was conducted using only the placebo data from this study.
PANSS PK/PD – drug effect model
PK/PD modelling relating the time course of PANSS to the drug exposure was performed using a sequential approach. As the pharmacological profile and potency of 9‐OH‐risperidone are similar to those of risperidone itself, total active moiety plasma concentration was used as a predictor for efficacy. The PK model was used to predict the individual active moiety plasma concentration at the exact time of the PANSS and or CGI‐S measurement (day and hour were recorded in the database). This individual predicted active moiety plasma concentration was used for the PK/PD analysis. Total active moiety [AM] plasma concentrations were calculated as the sum of risperidone and 9‐OH‐risperidone plasma concentrations, corrected by molecular weight of risperidone and 9‐OH‐risperidone to obtain risperidone‐equivalent concentration. The following formula was used: [AM] = [risperidone] + [9‐OH risperidone] × , where [risperidone] and [9‐OH risperidone] are the population PK model‐based individual predictions of concentrations.
Sequential (where the placebo response model parameters were initially fixed) and simultaneous analysis of the drug‐effect model were explored. Two drug effects models were tested: a linear concentration related slope and an E max function, both of which affect the change from baseline in PANSS by relating to drug exposures.
Pharmacodynamic model for CGI‐S
The overall clinical severity of illness for each subject was rated using the CGI‐S ordinal scale with six categories. The CGI‐S scores were the secondary efficacy endpoint for the Phase 3 study. Due to the low frequency, some levels were consolidated such that the final scores were represented in four categories:
Levels 1 and 2 were merged into level 3 – mildly ill
Level 4 – moderately ill
Level 5 – markedly ill
Level 6 – severely ill
As the consolidated CGI‐S score is a categorical ordinal variable (taking integer values 3–6), the probability of observing each score was modelled using logistic regression. If Y ij denotes the observation in subject i at time t ij (j = 1 … n i) and Y i = (Y i1 ,…, Y i n i) is the vector of CGI‐S scores for subject i, the probability for Yij to be larger than or equal to the score m (m = 4, 5 and 6) can be expressed as follows:
in which
and
where g is the logit function of a probability, pij is short notation for P(Yij ≥ m). For a M category score, only M − 1 intercepts need to be estimated. Here, βm decreases with m to account for the ordinal nature of the data; fp represents the placebo effect estimated using placebo data only that is a function of time (TSLP); fd is the drug effect and is a function of total active moiety concentration (AM) through the parameter CSLP; ηi is the subject‐specific random effect introduced on the intercept. The relation is set up such that the covariate relationship is the same for all cumulative categories on the log odds (logits).
The probability of being at a particular score was formulated as:
Covariate model
Covariate exploration was conducted on each sub‐model and the final joint PK/PD model. The inclusion of potential covariates in the final model was based on their clinical relevance and diagnostic plots of empirical Bayes parameter estimates (EBEs) vs. covariate values. The graphical assessment to evaluate covariate relationships looked at the predictions of subject‐specific deviations from population mean estimates (ηs) for the respective PK or PK/PD parameter from the base model against the covariate of interest. Continuous covariates included in this analysis were body weight (BW), age, waist‐to‐hip ratio (WTH), body mass index (BMI), aspartate aminotransferase (AST), alanine amino transferase (ALT) and creatinine clearance (CRCL). Categorical covariates included gender (male = reference, female), race (African American = reference, Caucasian, Others), ethnicity (Not Hispanic or Latino = reference, Hispanic or Latino), CYP2D6 metabolizer status (Extensive Metabolizers (EM) and Inconclusive = reference, Poor Metabolizers (PM), Intermediate Metabolizers (IM)) and genotype classification for dopamine D2 (DRD2), serotonin 2A (5‐HT2A), serotonin 2C (5‐HT2C) and melanocortin 4 (MCR4) receptors (although assessed in relation to antipsychotic weight gain, MC4R polymorphism was included in the PK/PD covariate analysis for a complete evaluation of pharmacogenomic variables). For categorical covariates, covariate effects were added as a proportional component such that the effect estimate represents the percentage change from the reference typical value of the estimate.
For continuous covariates:
For categorical covariates:
where P TV and slope, pow and prop factor are fixed effect parameters representing the population typical value and the covariate effect respectively.
To test the covariate parameter relationship, covariates were added to structural parameters, using the stepwise covariate modelling approach (SCM), as implemented in the PsN software package 7, 8. With this technique, different covariate–parameter relationships can be tested in a forward fashion (P < 0.05 and δOFV of 3.84) to build up the final full model, which in turn is evaluated in the backward elimination step (P < 0.001 and δOFV of 10.8). When a correlation between covariates was found, one of them was omitted on the basis of the prior clinical preference. The resulting final model contains only covariates that meet the pre‐defined statistical criteria and show an acceptable precision of related parameter estimates (<50% RSE).
Model evaluation
A non‐parametric bootstrap resampling method was used to evaluate the stability and robustness of the final PK model. Resampling with replacement generated 200 bootstrap datasets and the final population PK model was fitted repeatedly to each of the 200 bootstrap datasets. The median and 95% confidence intervals of parameters obtained from this step were compared with the final parameter estimates. In addition, the prediction‐corrected visual predictive check (pcVPC) 9 with 1000 simulated datasets was also performed. In a pcVPC, the variability coming from binning across independent variables is removed by normalizing the observed and simulated dependent variable based on the typical population prediction for the median independent variable in the bin. Results from the VPC were assessed using graphical comparison of the appropriate 90% prediction interval from simulated data and was visually explored in comparison with overlaid observed data from the original dataset. pcVPCs for the PANSS models and categorical VPCs for the CGI‐S PD and PK/PD models were used.
Results
RBP‐7000 pharmacokinetic analysis
Descriptive statistics in Table 1 provide a summary of the demographics for continuous and categorical covariates. Figure 2 shows the mean (SD) plasma concentration–time plots for risperidone and 9‐OH risperidone in the 90 mg and 120 mg RBP‐7000 groups. The mean profiles in these plots reveal a prolonged absorption phase consistent with the slow delivery of risperidone from the ATRIGEL delivery system. Rich PK sampling from the previous Phase 1 studies 3, 4 suggested the presence of two peaks: the first one associated with a rapid delivery from the injection site (first‐order absorption process), and the second associated with the slow delivery from the ATRIGEL delivery system (delayed delivery process described by a transit compartment absorption model). It is difficult to visualize this double peak phenomenon in this sparse design.
Table 1.
Summary of demographics and covariates
| Characteristic | Placebo group | 90 mg RBP‐7000 group | 120 mg RBP‐7000 group |
|---|---|---|---|
| Total number (n) | 112 | 111 | 114 |
| Age (years) | 42.76 ± 8.65 | 40.45 ± 9.42 | 40.41 ± 9.42 |
| Body weight (kg) | 92.61 ± 22.86 | 90.89 ± 18.86 | 88.54 ± 20.34 |
| Body mass index (kg m −2 ) | 30.97 ± 7.29 | 29.59 ± 5.96 | 29.33 ± 6.73 |
| Waist‐to‐hip‐ratio | 0.95 ± 0.09 | 0.95 ± 0.08 | 0.94 ± 0.07 |
| Alanine transferase (ALT, U/L) | 29.06 ± 20.09 | 29.88 ± 21.01 | 28.54 ± 23.58 |
| Aspartate transferase (AST, U/L) | 21.65 ± 8.5 | 23.14 ± 12.13 | 20.99 ± 8.66 |
| Creatinine clearance (CRCL, ml min −1 ) | 122.69 ± 46.91 | 121.91 ± 32.68 | 122.62 ± 39.77 |
| Gender (% male) | 81 (72.3) | 93 (83.78) | 84 (73.6) |
| Ethnicity | |||
| Not Hispanic or Latino | 101 (90.1%) | 104 (93.6%) | 104 (91.2%) |
| Other | 11 (9.8%) | 7 (6.3%) | 10 (8.7%) |
| Race | |||
| Black or African American | 84 (75%) | 79 (71.1%) | 80 (70.1%) |
| Other | 28 (25%) | 32 (28.8%) | 34 (29.8%) |
| CYP2D6 genotype metabolizer | |||
| Extensive | 92 (82.1%) | 98 (88.2%) | 97 (85.0%) |
| Intermediate | 8 (7.1%) | 4 (3.6%) | 7 (6.1%) |
| Poor | 3 (2.6%) | 1 (0.9%) | 3 (2.6%) |
| Inconclusive | 8 (7.1%) | 7 (6.3%) | 6 (5.2%) |
| Missing | 1 (0.9%) | 1 (0.9%) | 1 (0.8%) |
| Dopamine D2 receptor (DRD2) genotype (rs1801028) | |||
| GG | 106 (94.6%) | 108 (97.2%) | 113 (99.1%) |
| GC | 5 (4.4%) | 2 (1.8%) | 0 (0%) |
| Missing | 1 (0.9%) | 1 (0.9%) | 1 (0.9) |
| Serotonin 2C receptor (5‐HT2C) genotype (rs3813929) | |||
| CC | 102 (91.0%) | 102 (91.9%) | 104 (91.2%) |
| CT | 4 (3.6%) | 4 (3.6%) | 3 (2.6%) |
| TT | 5 (4.4%) | 4 (3.6%) | 6 (5.2%) |
| Missing | 1 (0.9%) | 1 (0.9%) | 1 (0.9%) |
| Serotonin 2A receptor (5‐HT2A) genotype (rs6313) | |||
| CC | 44 (39.2%) | 45 (40.5%) | 43 (37.7%) |
| CT | 55 (49.1%) | 49 (44.1%) | 48 (42.1%) |
| TT | 12 (10.7%) | 15 (13.5%) | 22 (19.2%) |
| Inconclusive | 0 (0%) | 1 (0.9%) | 0 (0%) |
| Missing | 1 (0.9%) | 1 (0.9%) | 1 (0.9%) |
| Melanocortin 4 receptor (MCR4) genotype (rs17782313) | |||
| CC | 9 (8.0%) | 9 (8.1%) | 11.4 (85.0%) |
| TC | 48 (42.8%) | 55 (49.5%) | 27.1 (6.1%) |
| TT | 54 (48.2%) | 46 (41.4%) | 60.5 (2.6%) |
| Missing | 1 (0.9%) | 1 (0.9%) | 1 (0.9%) |
Figure 2.
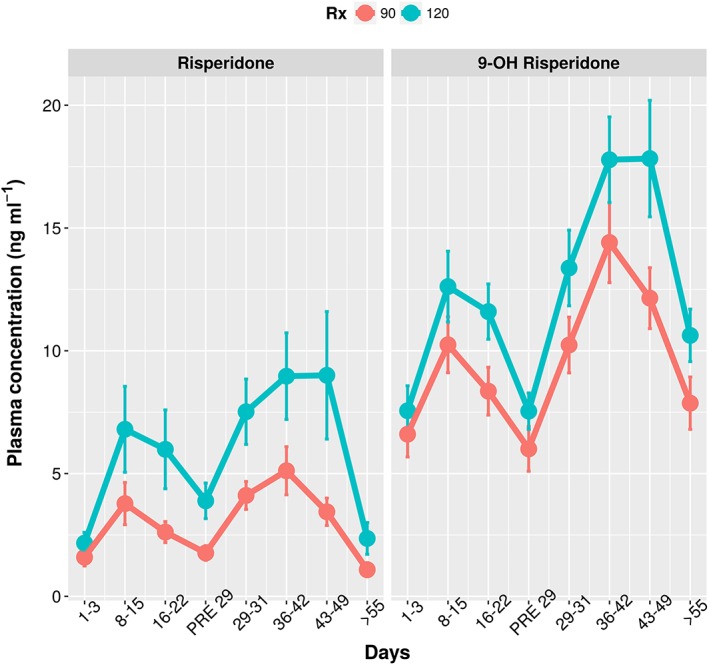
Sampling window‐based mean plasma concentrations of risperidone and 9‐hydroxy(OH) risperidone vs. time
Following inspection of raw data, the 234 subjects from the RBP‐7000 treatment arms contributed to 3154 PK samples that were included in the analysis, 1577 for risperidone and 1577 for 9‐OH risperidone. Drug concentrations below the lower limit of quantification (BLQ) were considered as missing. The total number of BLQ was 373, approximately 10.3%. However, of the 373 BLQ values, 355 were pre‐dose concentrations and the remaining values were post‐dose. Considering this extremely small number of BLQ values post‐dose (n = 18), a decision was made to exclude them from the analysis. The pre‐dose concentrations above the LLOQ were mainly due to the low dose oral risperidone that was given to all subjects prior to treatment. However, these exposures were insignificant compared to those from the treatment arm (data not shown) and hence were not included in the analysis.
A combined additive and proportional residual error model common to risperidone and 9‐OH risperidone was used in the base model. There were no correlations between the random effects at the subject level. This model provided a reasonable fit of the data and was thus retained for subsequent covariate model development. The exploratory analysis on individual PK parameter predictions (EBEs) vs. covariates identified CYP2D6 phenotype as potential covariate with a strong correlation to the formation of metabolite from the parent. In addition, race was correlated, although to a lesser extent, to both the fast (ka1) and slow (ka2) absorption rate constants. So, based on EBEs, CYP2D6 phenotype on metabolite formation and race on ka 1 and ka 2 were selected for testing in NONMEM. BMI was a significant predictor in the previous work by Gomeni et al. 3 and Laffont et al. 4 and hence BMI was also taken forward for covariate testing along with CYP2D6 phenotype and race.
Non‐parametric bootstrap‐based parameter estimates for the final covariate model are presented in Table 2 and agree with the estimates of the model fit. Stepwise covariate search showed that BMI was not a significant covariate on the absorption rate constants, confirming the lack of correlation in the visual diagnostics of absorption rate constant EBEs vs. BMI. Race was also not significant. Regarding CYP2D6 phenotype, intermediate metabolizers had a 76% lower metabolite formation than extensive/inconclusive metabolizers, while poor metabolizers had a 94% lower metabolite formation.
Table 2.
Non‐parametric bootstrap‐based parameter estimates of the base and final covariate pharmacokinetic model for RBP‐7000
| Parameter | Description | Estimate [95% CI] | BSV [95% CI] (%Shrinkage) |
|---|---|---|---|
| ka1 | Rapid abs (h−1) | 0.005 [0.004, 0.007] | 41.8 [35, 50.7] (25.4) |
| ka2 | Slow abs (h−1) | 0.016 [0.01, 0.022] | 32.1 [0.3, 49.9] (65.6) |
| krel | Elimination (h−1) | 0.04 [0.03, 0.07] | — |
| V | App. vol of risp (l) | 129.0 [96.0, 158.0] | 38.6 [32.4, 44.8] (17.5) |
| ktr | Transit rate constants (h−1) | 0.023 [0.021, 0.025] | 42.3 [31.8, 52.7] (15.8) |
| krrp | Cen to Per (h−1) | 0.84 [0.65, 1.14] | 45.1 [28.4, 57.1] (36.3) |
| krpr | Per to Cen (h−1) | 0.006 [0.005, 0.008] | 67.9 [47.9, 81.3] (21.8) |
| kr9 | Met formation (h−1) | 0.22 [0.18, 0.28] | 49.3 [37.8, 60.1] (8.8) |
| k9el | Met elimination (h−1) | 0.07 [0.06, 0.09] | 18.8 [0.2, 29.5] (52.6) |
| σadd | Additive RUV (ng ml−1) | 0.13 [0.003, 0.214] | |
| σprop | Proportional RUV | 0.29 [0.27, 0.32] | |
|
CYP2D6
Intermediate |
Effect on metabolite formation | −0.76 [−0.85, −0.56] | |
| CYP2D6 Poor | Effect on metabolite formation | −0.94 [−0.96, −0.88] |
Standard diagnostic plots and representative model fits for the individual PK profiles for risperidone and 9‐OH risperidone (Appendix) indicate that the model captured the data very well. Further, a pcVPC stratified by analyte for the final covariate model (Figure 3) shows that the variability in the data (quantified by 5th and 95th percentiles) was well predicted, with the exception of the upper 95th percentiles which was under‐ and over‐ predicted for the parent and metabolite respectively. This was a direct consequence of the presence of some extremely high levels contributed by poor and intermediate metabolizers for CYP2D6. However, the total active moiety concentration, which is the driving factor for PD response, is similar across the two phenotypes (Figure A5 in the Appendix).
Figure 3.
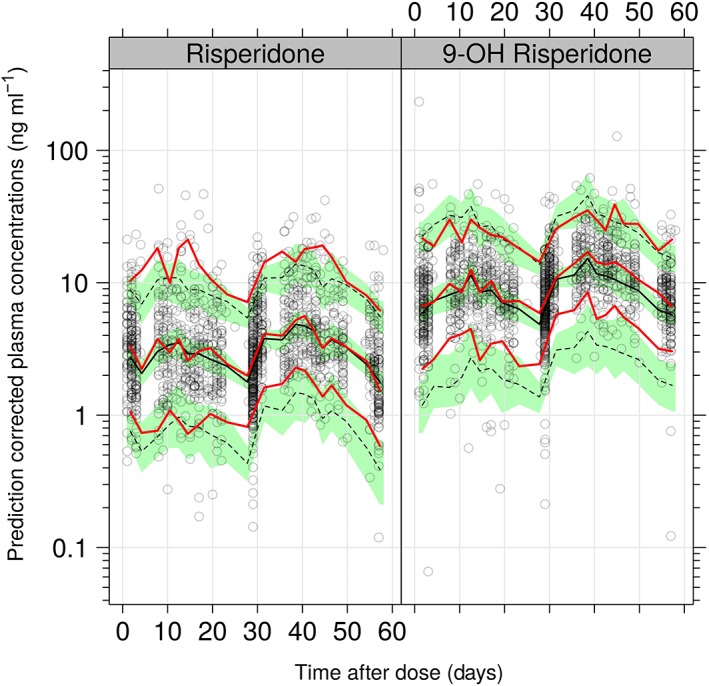
pcVPC for the covariate PK model on log scale. The red lines indicated the 5th, 50th (median) and 95th percentiles of the observed data, whereas the black lines represent these percentiles for the model‐simulated data. The green shaded regions represent the 95% confidence intervals of the simulated percentiles
Pharmacodynamic model for PANSS
Figure 4 shows the mean PANSS score over time across the dose groups. There is a clear separation in change from baseline between placebo and treatment arms. There were 527, 526 and 518 PANSS observations in the placebo, 90 mg and 120 mg groups, respectively. It is clear from the plots that on average, PANSS decreased over time in all three treatment groups. The Appendix shows the summary of placebo models that were explored. Based on the model selection criteria as described in the methods, the Weibull model was chosen over the exponential models even though they had similar OFV, as it provided better individual fits than the exponential model. Further, a linear drift parameter with associated IIV was added to the Weibull model to account for potential individual relapses.
Figure 4.
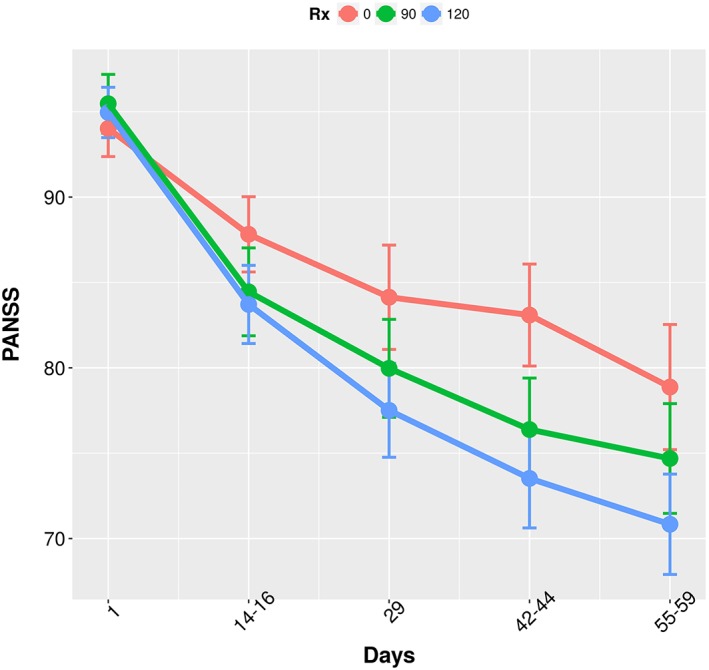
Comparison of mean PANSS Score across the three treatment groups through the study duration
The baseline demographic covariates (age, BMI, WTH, BW, sex, race, ethnicity), CYP2D6 phenotype and the receptor genotypes (5‐HT2C, 5‐HT2A, MC4R, DRD2) were tested in NONMEM as predictors on this model (Table 1). A stepwise covariate approach found no significant covariates on the placebo model.
GOF plots and pcVPC for the placebo model (see Appendix) show that the model captured the data very well.
PK/PD analysis for PANSS score
The treatment arm data was then added to the placebo data. Treatment (placebo vs. 90 mg and 120 mg) as a predictor on placebo effect (PMAX) was the only expected significant covariate, with RBP‐7000 eliciting a maximum change in baseline of about 11.6% as opposed to 5% in the placebo arm. In order to investigate the exposure–response relationship at the subject level, total active moiety plasma concentrations were calculated from the individual predictions of risperidone and 9‐OH risperidone plasma concentrations as indicated in the methods section. An E max model best quantified the drug effect, and the parameter estimates of the overall PK/PD model are shown in Table 3. The final exposure response model is depicted by the following equations:
Table 3.
Non‐parametric bootstrapped‐based parameter estimates of the placebo and drug effect model relating RBP‐7000 total active moiety exposure to total PANSS score
| Description | Estimate [95% CI] | BSV a [95% CI] | Estimate [95% CI] | BSV a [95% CI] (%Shrinkage) |
|---|---|---|---|---|
| Placebo model | Exposure response model | |||
| BSL – Baseline PANSS | 94.0 [92.3, 95.7] | 6.9 [5.67, 8.36] | 94.9 [93.9, 95.8] | 7.0 [6.1, 7.9] (17.3) |
| RUV – Residual variability | 5.5 [4.4, 6.5] | 5.5 [4.9, 6.1] | — | |
| PMAX – Max placebo effect | 0.06 [0.02, 0.10] | 0.1 [0.09, 0.15] | 0.06 [0.04, 0.09] | 0.014 [0.01,0.018] (18.6) |
| TPROG – Time to reach Max CFB (weeks) | 1.9 [1.8, 2.0] | — | 1.7 [1.06, 2.0] | — |
| POW – Weibull shape parameter | 10.0 [2.9, 17.6] | — | 2.1 [1.1, 10.1] | — |
| DRIFT – Linear drift | ‐0.70 [−1.1, −0.26] | 1.4 [0.8, 1.8] | ‐1.2 [−1.5, −1.0] | 1.3 [1.0, 1.6] (32.4) |
| E max – Maximum drug effect | 94.0 [92.3, 95.7] | 6.9 [5.67, 8.36] | 0.054 [0.02, 0.09] | — |
| EC 50 – Concentration to 50% of E max (ng ml −1 ) | 5.50 [4.4, 6.5] | 4.6 [0.18, 33.4] | — | |
BSV, between‐subject variability; CI, confidence interval
All are additive variability parameters, hence reporting standard deviation in the same unit as parameter
The placebo effect (PMAX) for the average schizophrenic patient in this population was estimated to be 0.066 (i.e. the maximum relative decrease in PANSS from the baseline PANSS score was 6.6%). Similarly, the maximum drug effect (E max) of total active moiety (AM) was found to be 0.054 (i.e. the maximum relative decrease in PANSS score from baseline following RBP‐7000 treatment on top of the placebo effect was ~5.5%). The typical EC 50 value for PANSS total score was found to be 4.6 ng ml−1. The IIV in EC 50 could not be estimated, probably due to the sparseness in this design, and was set to zero. Time at which 63.2% of the maximum change from baseline was reached was about 1.7 weeks (~12 days). The linear drift parameter describes the worsening of the disease in some patients after initial improvement or vice versa. Typical model diagnostics and bootstrap results in Table 3 show that the PK/PD model parameters were well estimated with good precision, except for EC 50.
Inspection of the relationship between empirical Bayes estimate and covariates did not identify any major trends. Further, a stepwise covariate analysis confirmed that no covariates were significant in this model. Concomitant medications and clinical study site were not tested for their effects, due to the large number of missing data and low number of subjects across the 33 clinical sites to achieve a meaningful effect.
A pcVPC shown in Figure 5 shows that the model captured both the mean and variability well, although there seemed to be a small under‐prediction with regard to change from baseline PANSS. However, the overall trend was well captured.
Figure 5.
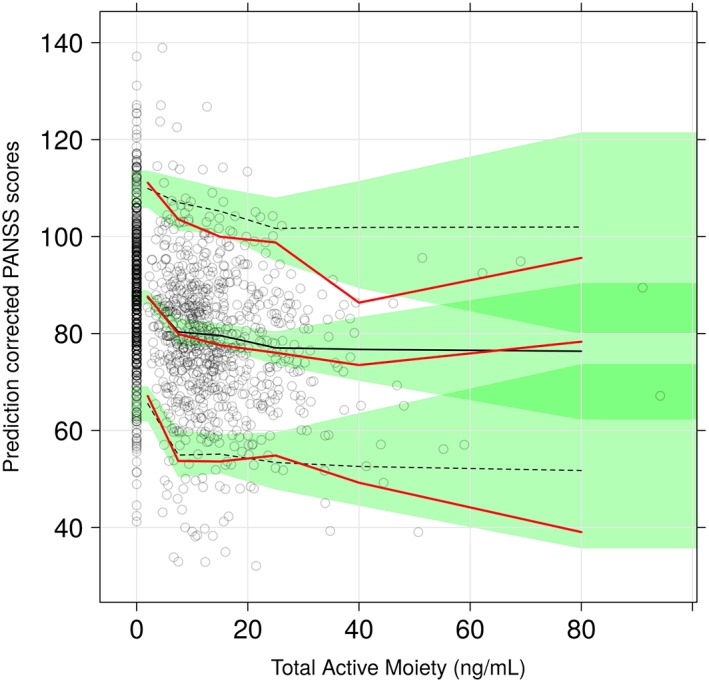
pcVPC for final total active moiety exposure ‐ PANSS model. The red lines indicated the 5th, 50th (median) and 95th percentiles of the observed data whereas the black lines represent these percentiles for the model‐simulated data. The green shaded regions represent the 95% confidence intervals of the simulated percentiles
Pharmacodynamic model for CGI‐S
Figure 6 shows that the proportion of patients with a CGI‐S score of 3 (mildly ill) increased over time in all treatment groups, while the proportion of patients with score 5 (markedly ill) decreased. While such trends were expected in RBP‐7000 treatment groups, they were also observed in the placebo group, suggesting the presence of a placebo effect.
Figure 6.
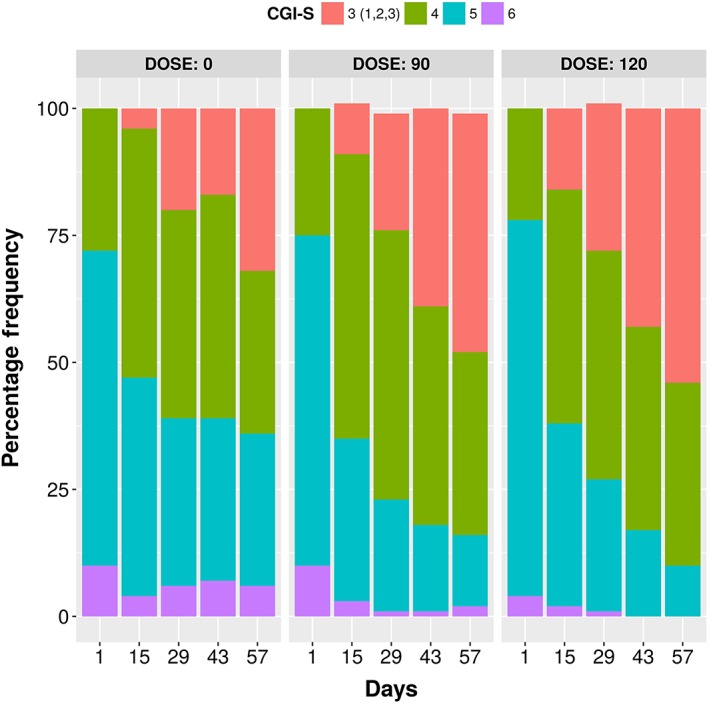
Distribution of consolidated CGI‐S scores by dose
There were 518, 516 and 515 CGI‐S observations in the placebo, 90 mg and 120 mg treatment groups, respectively. A placebo model with a time course effect (TSLP × TIMEij) was statistically superior to the base model without the time course (data not shown).
PK/PD analysis for CGI‐S score
Models with and without a relationship between CGI‐S score and RBP‐7000 exposure (dose, total active moiety plasma concentration) were tested on top of the placebo model that included a time course on placebo effect. The model that included RBP‐7000 dose as a predictor did not show any significant effect (δOFV = − 1.02); however, the model including total active moiety plasma concentration as predictor was significantly better than the model that excluded it (δOFV = − 14.92). No significant improvement was observed in any of the models when the linear relation of concentration (on a logit scale) was replaced by a maximal effect (E max) model. Significant improvements were observed when IIV was added on the slope for total active moiety plasma concentration. Figure 7 shows a VPC of the time course of the predicted probabilities of different CGI‐S scores over time after accounting for total active moiety effect. The population estimates of these parameters are listed in Table 4.
Figure 7.
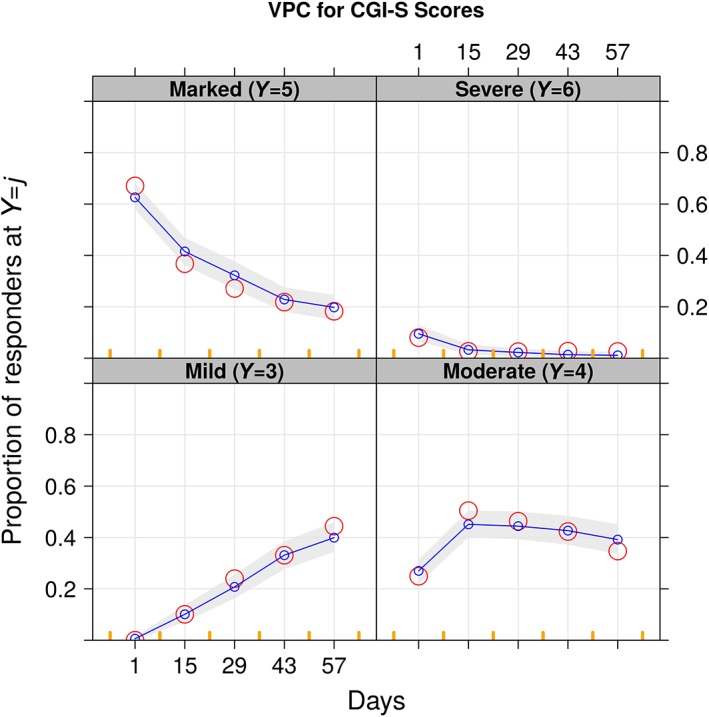
Visual predictive checks for CGI‐S vs. time. The red circles are the observed proportions, whereas the blue lines are the medians and the 5th and 95th percentiles of the simulation that is also shown by the shaded area
Table 4.
Parameter estimates (standard error, SE) of the placebo and drug effect models relating RBP‐7000 total active moiety concentrations to CGI‐S scores
| Description | Placebo data | All data | Drug effect model | ||||
|---|---|---|---|---|---|---|---|
| Estimate | SE | Estimates | SE | Estimate | SE | ||
| α4 | 7.8 | 1.08 | 8.4 | 0.68 | 8.5 | 0.68 | |
| α5 | −6.3 | 0.98 | −6.6 | 0.57 | −6.5 | 0.56 | |
| α6 | −5.7 | 0.73 | −6.2 | 0.50 | −6.4 | 0.53 | |
| TSLP | −0.29 | 0.08 | −0.74 | 0.07 | −0.6 | 0.07 | |
| CSLP | 8.4 | 3.19 | 7.8 | 1.72 | −0.04 | 0.01 | |
|
|
1.7 | 0.49 | 1.3 | 0.18 | 8.3 | 1.83 | |
| ωTSLP | 7.8 | 1.08 | 8.4 | 0.68 | 1.3 | 0.19 | |
α4 , α5 , α6, intercepts of proportional odds model; TSLP, slope effect of time; CSLP, slope effect of concentration; SE, standard error of parameter estimate.
Discussion
RBP‐7000 is being developed as a long‐acting SC injectable formulation of risperidone given once a month to patients for the treatment of schizophrenia. The long‐acting injectable formulation of risperidone currently available in the market (Risperdal® Consta®) is given every 2 weeks intramuscularly and requires supplementation with oral risperidone for 3 weeks after the first injection to ensure that adequate therapeutic plasma concentrations are reached. RBP‐7000 has been developed for SC injection once per month. The RBP‐7000 PK profile, showing an early peak of risperidone within 4–6 h after SC injection followed by a second peak of similar magnitude, suggests that no supplemental oral risperidone is needed as the therapeutic plasma concentrations are reached immediately and are maintained over the dosing interval.
The Phase 3 study data being analysed here demonstrated statistically significant efficacy on the primary (change from baseline to end of the study in PANSS total score) and secondary (change from baseline to end of the study in CGI‐S score) endpoints at both doses (90 and 120 mg) as compared to placebo 10. Both RBP‐7000 dosages were generally well tolerated.
The objective of the present modelling work was to establish an exposure‐response relationship between the total active moiety concentrations (risperidone + 9‐OH risperidone) and PANSS total scores as well as CGI‐S scores. The integrated population PK/PD model developed here was a combination of the following sub‐models:
A joint PK model for the parent drug and the active metabolite.
A PK/PD model for PANSS total score.
A PK/PD model for CGI‐S score.
To our knowledge, there is no literature available on population PK/PD modelling of CGI‐S scores in schizophrenic patients. This pharmacometric analysis served as a secondary analysis of RBP‐7000 Phase 3 study data.
The structural PK model was well established from two previous single dose and multiple dose studies 3, 4 where rich data were collected, and hence no effort was made to refine the model for this sparse sampling design. An evaluation of this model provided reasonable fits in most PK profiles from the Phase 3 study and was used for estimating the parameters of this structural model using the Phase 3 study data. Comparison of parameter estimates between the current analysis and previous combined analysis of single dose and multiple dose studies 5 shows consistency, which provides a good external validation to the current PK model. The design of the Phase 3 study allowed the collection of PK samples in specific sampling windows that covered the complete time course in the population. Such a design, even with sparse sampling, may have facilitated collection of data that resulted in a population PK model where the parameters were well estimated with reasonable precision.
In the previous single and multiple dose studies, BMI was identified as a significant covariate on the first peak of absorption (ka 1), with a lower peak in subjects having a higher BMI. This most likely reflects the influence of fat abdominal tissues on the absorption of risperidone which is a lipophilic drug 3, 4, 5. Hence, in this Phase 3 sparse sampling design, BMI was assessed as a covariate on absorption rate constants, as well as WTH ratio. None of them was identified as significant. The precision of the absorption parameters was good due to the use of sampling time windows in this sparse design. The effect of CYP2D6 phenotype on conversion of risperidone to 9‐OH risperidone has been well established in the literature 11. In the previous combined analysis by Laffont et al. 5, this effect could not be estimated well due to the low number (n = 3) of poor metabolizers. In this study, however, even though only seven poor metabolizers were available in the ITT group, the covariate effect was estimated with statistical significance and the inclusion of the covariate was associated with a 20% drop in IIV on the formation rate constant of the metabolite. Intermediate and poor metabolizers for CYP2D6 had 76% and 94% lower metabolite formation, respectively, than extensive metabolizers. The concentration of the total active moiety was, however, similar across these phenotypes, supporting no need in dose adjustment. This is in line with previous knowledge on risperidone 12.
The pcVPC plots shown in Figure 3 for the covariate PK model captured the median of the entire time course well, but there was marginal underestimation in the upper percentiles. Standard diagnostic plots (see Appendix) did not show any apparent bias. Overall, the population PK model was considered to adequately describe the data.
The subsequent step of the analysis was to develop a population PK/PD model for the change in PANSS total score, which was the primary endpoint in this Phase 3 trial. First, a placebo model for PANSS was developed from the placebo data alone. The base placebo model development results showed that the Weibull model with a linear slope (drift) appeared to be adequate to characterize the PANSS data in this 8‐week study and was thus selected. The linear slope component was introduced to account for the worsening of the disease in some patients after initial improvement or vice versa, as has been done in previous modelling work 13, 14. This placebo model is an empirical model that provided good fits to the data and the pcVPCs showed the good predictive nature of the model (see Appendix). A limitation of such an empirical model is that parameter estimates are based on the study design and duration. A semi‐mechanistic or mechanistic model would have been more robust and independent of the study design and duration as emphasized by Gobburu et al. 15. However, there are not many semi‐mechanistic models due to the complexity and lack of understanding of the disease. This work can be considered for extension to such mechanism‐based models in the future.
Nevertheless, the empirical base model chosen here to model the placebo PANSS data described the data well with good precision of parameter estimates and excellent simulation properties. The maximum change from baseline due to placebo effect (PMAX) was estimated to be 6.7%, and the estimated time to 63.2% of the maximal placebo effect (TPROG) was 1.95 weeks (13.7 days). These estimates agree well with those reported by Pilla Reddy et al. 16 in an earlier meta‐analysis of PANSS placebo data collected in 16 trials conducted in both acute and chronic schizophrenic patients (PMAX: 7.8%; TPROG: 12.6 days). In the present analysis, no covariates were identified on the placebo model to carry forward to the PK/PD model.
The next step was to integrate the PK and the PANSS PD models to establish an exposure‐response relationship using a drug‐effect model. This integration of critical sub‐models such as disease‐progression models, placebo‐response models, drug‐effect models, covariate models and dropout models enables reliable prediction of the outcome of future trials through model‐based simulation with consideration of various predictors of the placebo response and dropout 17. Dropouts are common in antipsychotic clinical trials: dropout rates are generally in the upper 40–70% for the placebo treatment groups 18 and ignoring high dropout information may lead to the biased assessment of study results. In the present study, the dropout rate was unexpectedly low, with no major difference between placebo group (8%) and RBP‐7000 treatments groups (90 mg: 6%; 120 mg: 9%). Hence the decision was made not to include a dropout sub‐model for data description.
As in previous PANSS PK/PD models 16, 17, 19, the treatment effect was modelled as a relative change from the baseline PANSS score using an E max model. In the present model, drug effect and placebo effect were additive. Analysing simultaneously, drug effect and placebo effect did not change placebo parameter estimates, with similar values for the maximum placebo effect, time to 63.2% of the maximal placebo effect, and slope parameter. The only change was noted in the Weibull shape parameter (2.2 in the final model vs. 10 in the placebo model). The parameter estimates for drug‐effect, Emax and EC50, were 5.4% and 4.6 ng ml−1, respectively. The E max estimate of 5.4% was consistent with the placebo‐corrected mean changes in total PANSS from baseline of −6.15 (95% CI: −9.98 to −2.31) for the 90 mg group and −7.24 (95% CI: −11.0 to −3.43) for the 120 mg group, estimated by repeated‐measures analysis at study end point 10. The magnitude of improvement in PANSS total score was similar to that observed in a previous 12‐week, double‐blind, placebo controlled study of schizophrenic subjects treated with long‐acting risperidone (Risperdal® Consta® 25 mg, 50 mg and 75 mg) 20. For oral risperidone, the decrease in PANSS total score varies across studies 21, 22, 23 due to differences in study design, duration, sample size, inclusion and exclusion criteria, dose of risperidone investigated and study conditions. In an 8‐week, double‐blind, placebo‐controlled study of oral risperidone vs. haloperidol conducted in 513 patients with chronic schizophrenia, mean changes in PANSS total score from baseline (mean baseline: 89.2–94.9) were −3.8 for placebo, −5.3 for 2 mg day−1 risperidone, −18.6 for 6 mg day−1 risperidone, and −14.1 for 6–16 mg day−1 risperidone 22.
A potential limitation of the present PK/PD model is that it assumes an instantaneous relationship between drug effect and total active moiety plasma concentration. Although there is evidence for a rapid onset of antispsychotic effects, it usually takes several weeks to reach ‘full therapeutic effect’, especially on the negative symptoms 24. This delay is typically modelled by multiplying drug effect by (1 − e−KT*time) where KT is the rate constant associated with the time to achieve maximal drug effect 17. Such a model was tested on the present data but did not result in a significant improvement of the objective function. This may be due to the fact that rapid improvement and separation from placebo group is seen as early as Day 14 with 90 mg and 120 mg RBP‐7000, with a gradual improvement over time that may be confounded with the small but existing accumulation of the total active moiety (steady‐state is achieved after the second or third SC injection of RBP‐7000). Pilla Reddy 16 reported a KT value of 0.039 day−1 for risperidone and other antipsychotic drugs, which corresponds to a half‐life of approximately 18 days. Therefore, data from a longer study duration would be needed to accurately assess the maximal drug effect of RBP‐7000 and the present E max estimate may be slightly underestimated.
Comparison with previous PK/PD models of risperidone also needs to account for the choice of the independent variable. In this analysis, the total active moiety plasma concentration was linked to the effect while previous models used either risperidone concentrations as a predictor, or used a summary statistic of the total active moiety PK over the daily dosing interval 17. Here, the total active moiety concentration was considered more representative of the actual exposure as 9‐OH risperidone and risperidone are equally active. The choice of the total active moiety plasma concentration in place of any PK summary statistics is explained by the 28‐day dosing schedule for RBP‐7000, i.e. summarizing a 28‐day exposure by a few average statistics to correlate to a weekly PD assessment would not be as informative as using the actual concentrations. Moreover, one expects that total active moiety concentrations will be correlated with the cumulative average concentrations. The PK/PD model developed for PANSS total score was found to describe the data adequately. The pcVPCs of this integrated model (Figure 5) show that the PANSS score was predicted well over the range of total active moiety concentrations. There were no covariates identified for the PANSS PK/PD model.
A second PK/PD model was developed from the CGI‐S scores collected in the Phase 3 study of RBP‐7000. The CGI‐S scores that range from 1 to 7 had to be consolidated in this study to fewer categories as the number of individuals with scores 0 to 2 and 7 was extremely small, resulting in just four categories of scores. As the data are ordinal in nature, a proportional odds model was selected to model the probability of observing any given score. The placebo model that estimated the baseline probability of being at each score was augmented with a component that explained the time course of the probability that captured the data well. The addition of total active moiety plasma concentration as a predictor on the logit of the probabilities significantly improved the model fit and captured the relationship between observed frequency and exposures, as seen in Figure 7. Similar to the PANSS score analysis, no significant covariates were found for the CGI‐S placebo model or CGI‐S exposure‐response model.
The 90 mg and 120 mg doses of RBP‐7000 used in this study were selected as they were expected to provide D2 receptor occupancy levels within the targeted range of 65–80%. Dopamine D2 receptor occupancy levels are recognized to be a key driver for clinical efficacy and safety response to antipsychotic drugs. The currently accepted hypothesis is that dopamine D2 receptor occupancy should range between 65 and 80% for an optimal antipsychotic effect and minimal side effects. In previous modelling work 4, the predicted dopamine D2 receptor occupancy after repeated doses of 90 and 120 mg of RBP‐7000 was in the range of potentially efficacious values. The results for the Phase 3 study confirm the dose selection with respect to clinical endpoints (PANSS and CGI‐S) and confirmed the relationship between exposure and response that was expected from previous receptor occupancy assessment 3. The PK/PD modelling approach also provides additional insight in evaluating the net effect of the drug (on top of placebo) and relating this effect to the total active moiety plasma concentration.
Conclusions
Exposure‐response analysis of this Phase 3 registration trial for RBP‐7000 established a relationship between the concentrations of total active moiety (risperidone + 9‐OH risperidone) and PANSS and CGI‐S scores. The PK sub‐model captured the data well where the parameters were estimated with good precision and consistent with previous knowledge. CYP2D6 phenotype on metabolism of risperidone was the only identified covariate. PANSS and CGI‐S models were correlated with the total active moiety exposures through a PK/PD model.
Competing Interests
The authors declare no conflict of interest.
The authors wish to express their profound gratitude and appreciation to Zacharoula Konsoula for collecting the pharmacogenomic data, J.P. Jones for collecting and reviewing the pharmacokinetic data, and Philip Twumasi‐Ankrah for his constructive comments on the analyses and review of the manuscript.
Contributors
V.I. and C.M.L. analysed the data and drafted the manuscript and J.G., M.G., W.Z., Y.L. and C.H. contributed to different aspects of analysis, study conduct and manuscript reviews.
Figure A1.
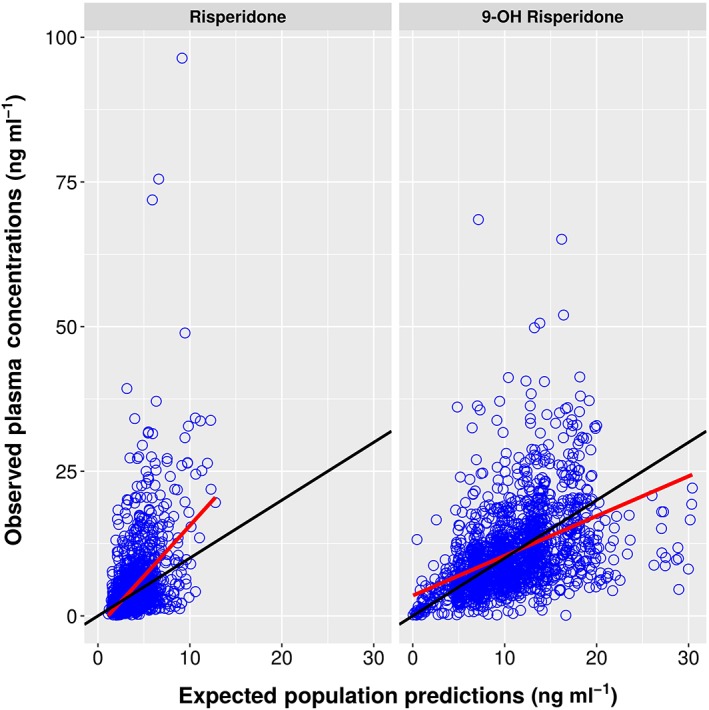
Expected Population Predictions vs. Observations
Figure A2.
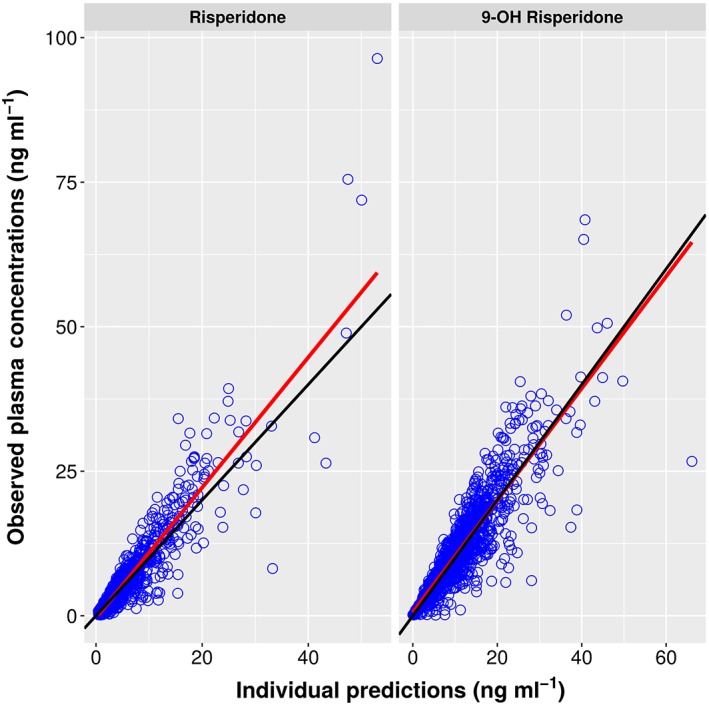
Individual Predictions vs. Observations
Figure A3.
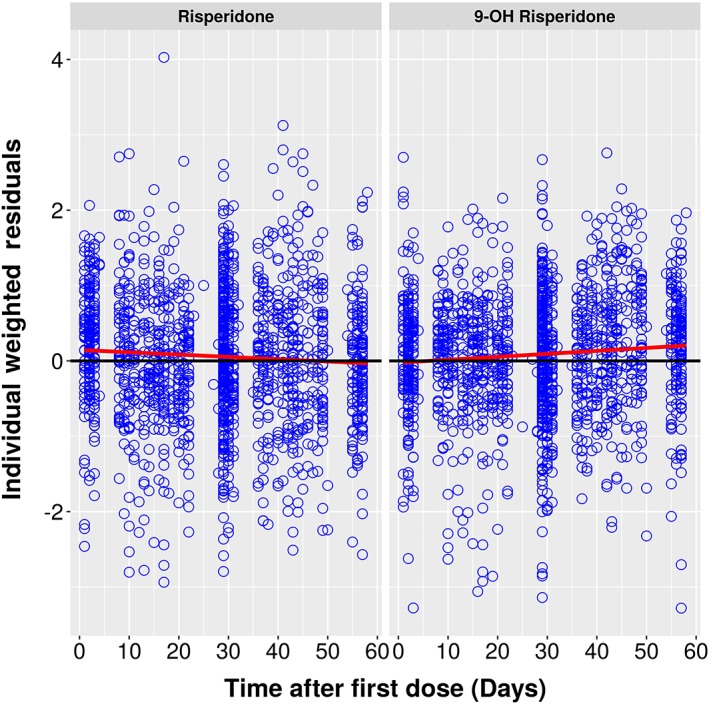
Individual Weighted Residuals vs. Time
Figure A4.
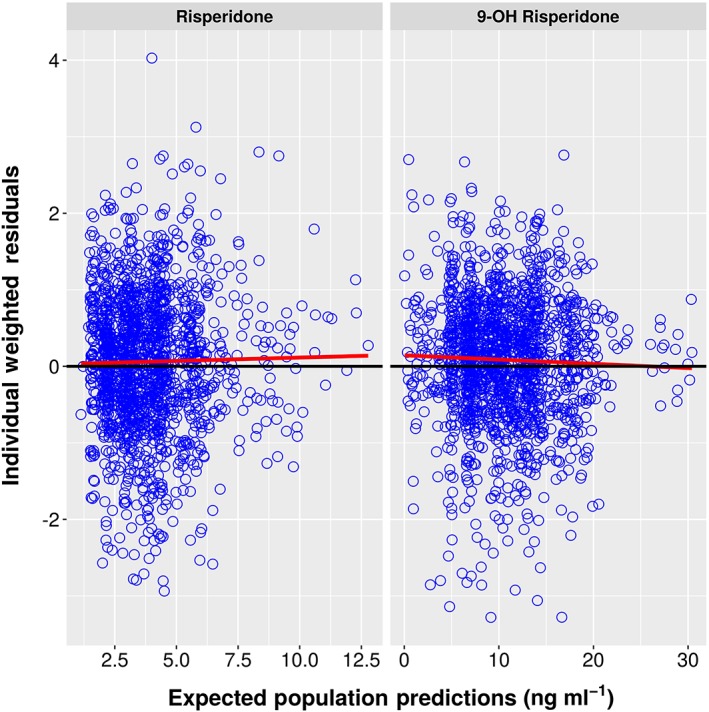
Individual Weighted Residuals vs. EPRED
Figure A5.
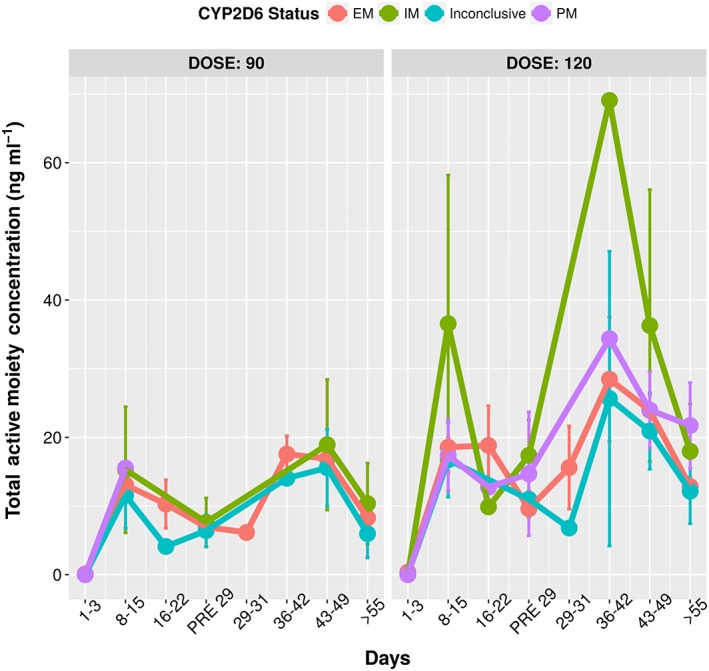
Total active moiety concentrations vs time grouped by genotype. The similarity in the total active moiety concentrations across the genotype showcases the fact that CYP2D6 metabolizer status does not impact the pharmacodynamics as the total concentrations are the primary drivers for effect
Figure A6.
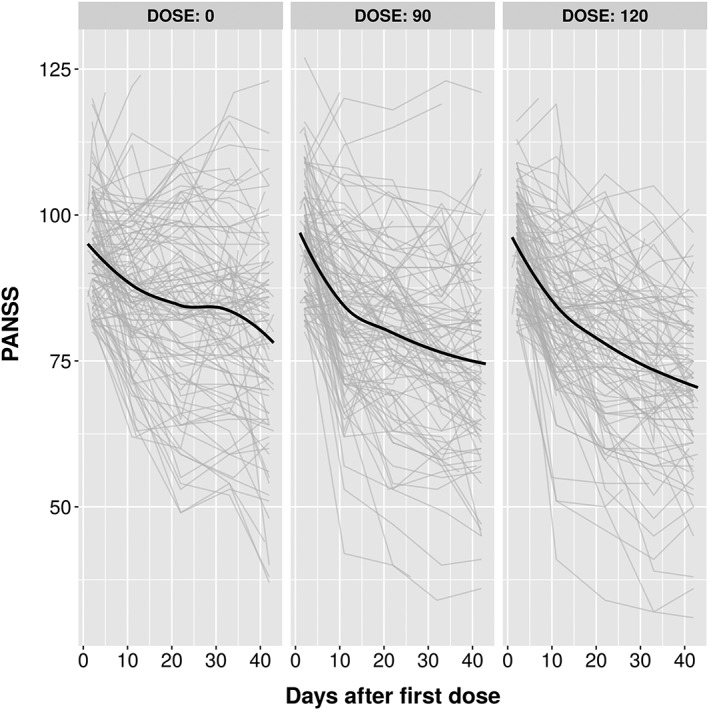
Spaghetti plots of PANSS vs. Time for different doses
Figure A7.
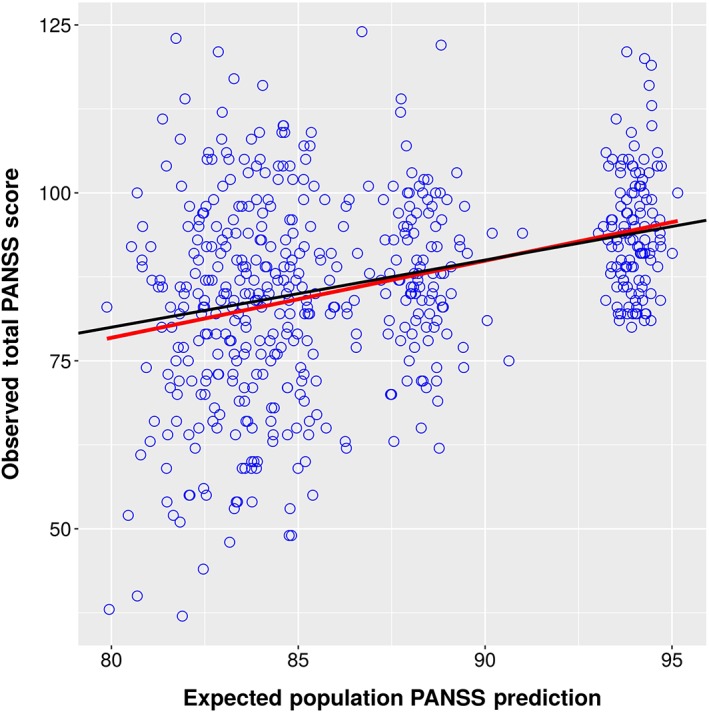
Expected Population Predictions vs. Observations
Figure A8.
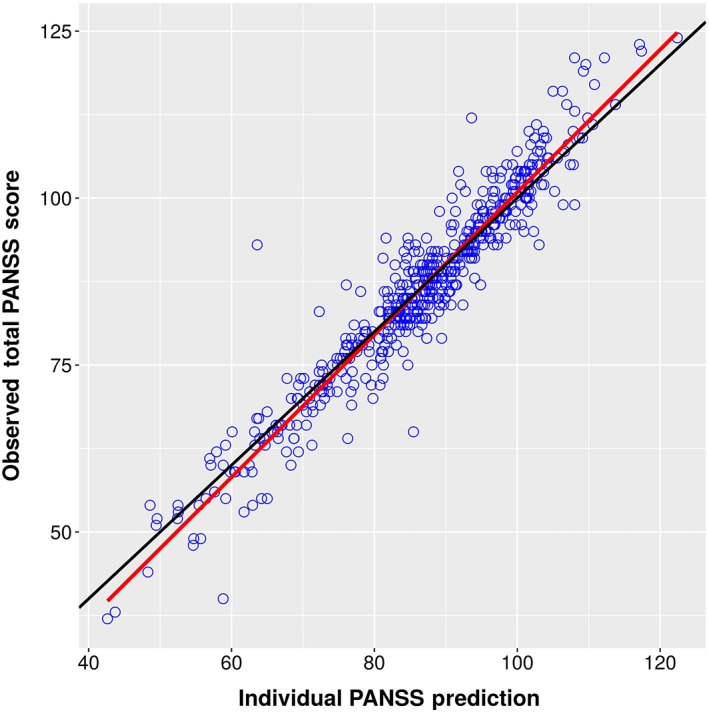
Individual Predictions vs. Observations
Figure A9.
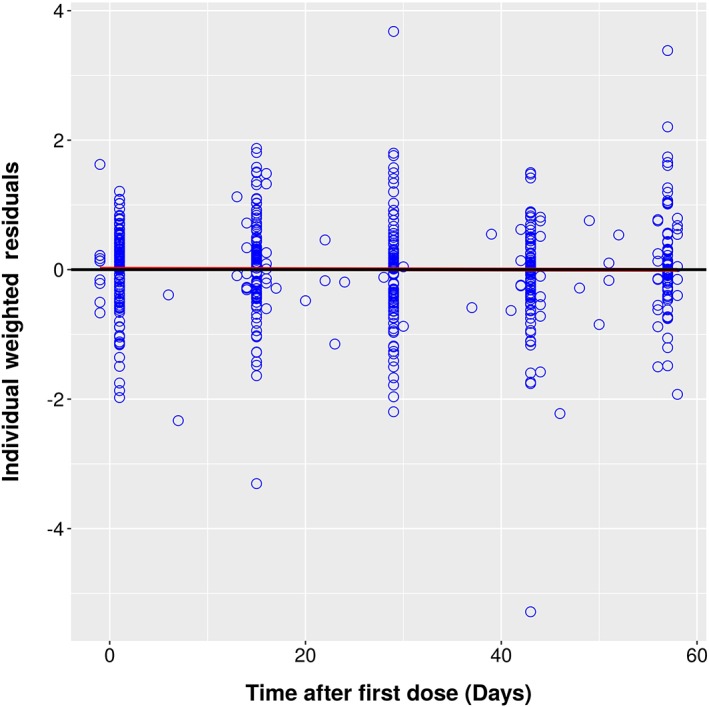
Individual Weighted Residuals vs. Time
Figure A10.
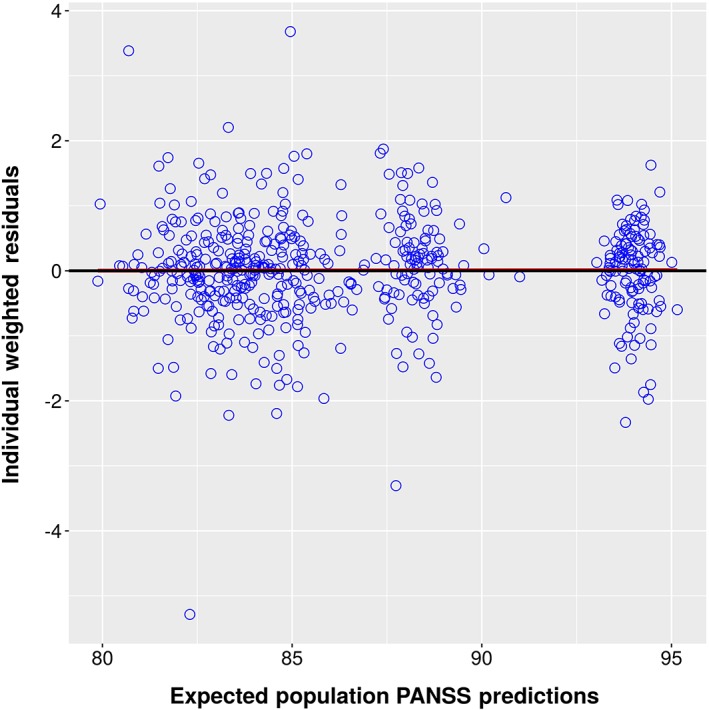
Individual Weighted Residuals vs. EPRED
Figure A11.
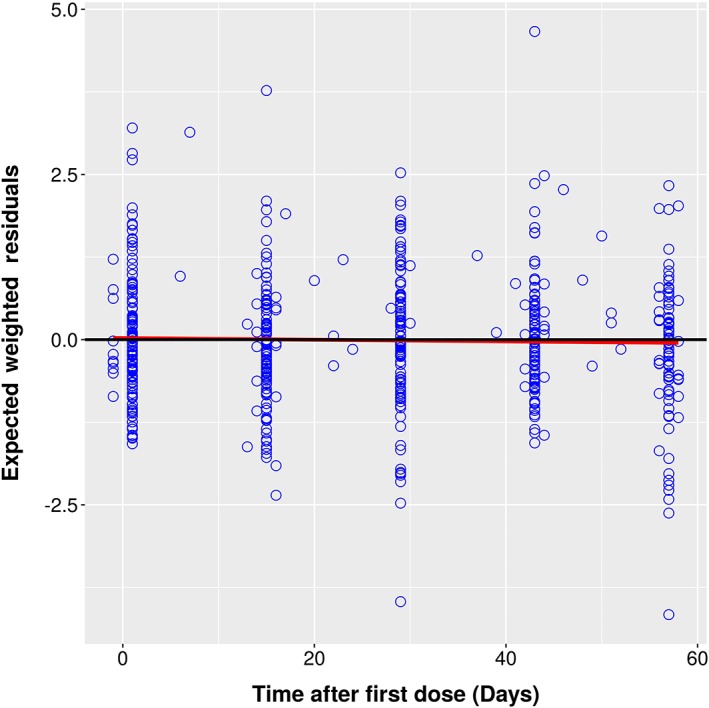
Expected Weighted Residuals vs. Time
Figure A12.
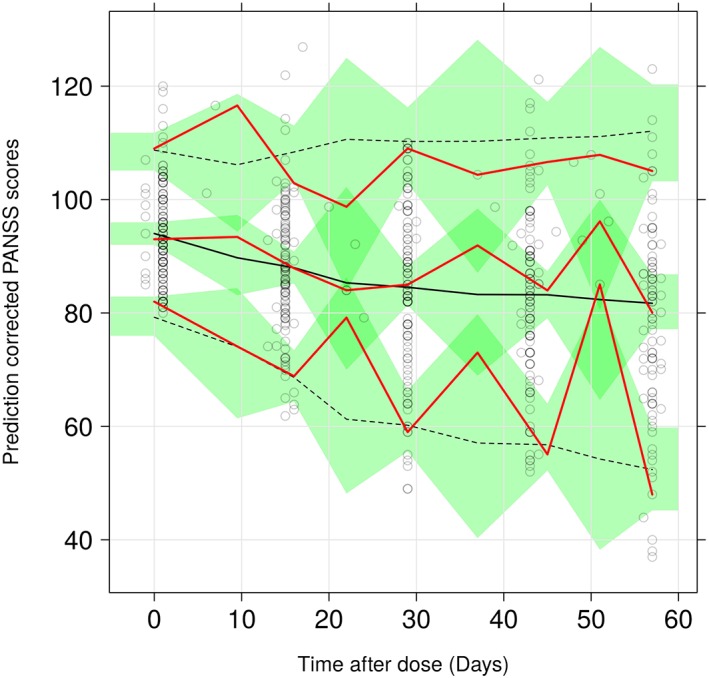
pcVPC for PANSS Placebo Model
Table A1.
Listing of Explored PANSS Placebo Models
| Run | Reference | Description | Formula | OFV | dOFV | |
|---|---|---|---|---|---|---|
| 99 | Baseline | BSL | 3147.75 | |||
| 100 | 99 | Linear Slope | BSL + α · TIME | 2900.39 | −247.36 | |
| 101 | 100 | Linear + Power | BSL + α · TIME POW | 2846.22 | −54.16 | |
| 102 | 99 | Exponential |
|
2840.45 | −307.29 | |
| 103 | 99 | Weibull |
|
2839.57 | −308.181 | |
| 104 | 103 | Weibull + Linear |
|
2823.958 | −15.61 |
Table A2.
Comparison of PK parameter estimates across the three studies
| Parameter | Description | Phase‐3 | Pooled SAD & MAD | ||
|---|---|---|---|---|---|
| Estimate | IIV % | Estimate | IIV % | ||
| ka1 | Rapid abs (h−1) | 0.005 | 42 | 0.0151 | 44 |
| ka2 | Slow abs (h−1) | 0.016 | 32 | 0.0513 | 43 |
| krel | Elimination (h−1) | 0.043 | ‐ | 0.0092 | 91 |
| V | Apparent Volume (L) | 129 | 39 | 125 | 27 |
| ktr | Transit Rate Constants (h−1) | 0.023 | 42 | 0.0283 | 46 |
| krrp | Cen to Per (h−1) | 0.841 | 45 | 0.537 | 57 |
| krpr | Per to Cen (h−1) | 0.006 | 68 | 0.0226 | 59 |
| kr9 | Met Formation (h−1) | 0.221 | 49 | 0.0474 | 66 |
| K9el | Met Elimination (h−1) | 0.069 | 19 | 0.062 | 27 |
| σadd | Additive RUV (ng ml−1) | 0.137 | 0.077 | ||
| σprop | Proportional RUV (%) | 29.7 | 33.5 | ||
| CYP2D6 IM ‐ Met Formation | ‐0.76 | ||||
| CYP2D6 PM ‐ Met Formation | ‐0.942 | ||||
Ivaturi, V. , Gopalakrishnan, M. , Gobburu, J. V. S. , Zhang, W. , Liu, Y. , Heidbreder, C. , and Laffont, C. M. (2017) Exposure‐response analysis after subcutaneous administration of RBP‐7000, a once‐a‐month long‐acting Atrigel formulation of risperidone. Br J Clin Pharmacol, 83: 1476–1498. doi: 10.1111/bcp.13246.
References
- 1. Southan C, Sharman JL, Benson HE, Faccenda E, Pawson AJ, Alexander SP, et al. The IUPHAR/BPS Guide to PHARMACOLOGY in 2016: towards curated quantitative interactions between 1300 protein targets and 6000 ligands. Nucl Acids Res 2016; 44: D1054–68. [DOI] [PMC free article] [PubMed] [Google Scholar]
- 2. Alexander SPH, Davenport AP, Kelly E, Marrion N, Peters JA, Benson HE, et al. The Concise Guide to PHARMACOLOGY 2015/16: G protein coupled receptors. Br J Pharmacol 2015; 172: 5744–5869. [DOI] [PMC free article] [PubMed] [Google Scholar]
- 3. Gomeni R, Heidbreder C, Fudala PJ, Nasser AF. A model‐based approach to characterize the population pharmacokinetics and the relationship between the pharmacokinetic and safety profiles of RBP‐7000, a new, long‐acting, sustained‐released formulation of risperidone. J Clin Pharmacol 2013; 53: 1010–1019. [DOI] [PubMed] [Google Scholar]
- 4. Laffont CM, Gomeni R, Zheng B, Heidbreder C, Fudala PJ, Nasser AF. Population pharmacokinetics and prediction of dopamine D2 receptor occupancy after multiple doses of RBP‐7000, a new sustained‐release formulation of risperidone, in schizophrenia patients on stable oral risperidone treatment. Clin Pharmacokinet 2014; 53: 533–543. [DOI] [PubMed] [Google Scholar]
- 5. Laffont CM, Gomeni R, Zheng B, Heidbreder C, Fudala PJ, Nasser AF. Population pharmacokinetic modeling and simulation to guide dose selection for RBP‐7000, a new sustained‐release formulation of risperidone. J Clin Pharmacol 2015; 55: 93–103. [DOI] [PubMed] [Google Scholar]
- 6. Beal S, Sheiner LB, Boeckmann A, Bauer RJ. NONMEM 7. Ellicott City, MD: Icon Development Solutions, 2009. [Google Scholar]
- 7. Harling K. Perl speaks NONMEM (PsN). Uppsala, 2015.
- 8. Wahlby U, Jonsson EN, Karlsson MO. Comparison of stepwise covariate model building strategies in population pharmacokinetic‐pharmacodynamic analysis. AAPS PharmSci 2002; 4: 68–79. [DOI] [PMC free article] [PubMed] [Google Scholar]
- 9. Bergstrand M, Hooker AC, Wallin JE, Karlsson MO. Prediction‐corrected visual predictive checks for diagnosing nonlinear mixed‐effects models. AAPS J 2011; 13: 143–151. [DOI] [PMC free article] [PubMed] [Google Scholar]
- 10. Nasser AF, Henderson DC, Fava M, Fudala PJ, Twumasi‐Ankrah P, Kouassi A, et al. Efficacy, safety, and tolerability of RBP‐7000 once‐monthly risperidone for the treatment of acute schizophrenia: an 8‐week, randomized, double‐blind, placebo‐controlled, multicenter phase 3 study. J Clin Psychopharmacol 2016; 36: 130–140. [DOI] [PubMed] [Google Scholar]
- 11. Feng Y, Pollock BG, Coley K, Marder S, Miller D, Kirshner M, et al. Population pharmacokinetic analysis for risperidone using highly sparse sampling measurements from the CATIE study. Br J Clin Pharmacol 2008; 66: 629–639. [DOI] [PMC free article] [PubMed] [Google Scholar]
- 12. Vermeulen A, Piotrovsky V, Ludwig EA. Population pharmacokinetics of risperidone and 9‐hydroxyrisperidone in patients with acute episodes associated with bipolar I disorder. J Pharmacokinet Pharmcodyn 2007; 34: 183–206. [DOI] [PubMed] [Google Scholar]
- 13. Gomeni R, Lavergne A, Merlo‐Pich E. Modelling placebo response in depression trials using a longitudinal model with informative dropout. Eur J Pharm Sci 2009; 36: 4–10. [DOI] [PubMed] [Google Scholar]
- 14. Goyal N, Gomeni R. A latent variable approach in simultaneous modeling of longitudinal and dropout data in schizophrenia trials. Eur Neuropsychopharmacol 2013; 23: 1570–1576. [DOI] [PubMed] [Google Scholar]
- 15. Gobburu JVS, Lesko LJ. Quantitative disease, drug, and trial models. Annu Rev Pharmacol Toxicol 2009; 49: 291–301. [DOI] [PubMed] [Google Scholar]
- 16. Pilla Reddy V, Kozielska M, Johnson M, Suleiman AA, Vermeulen A, Liu J, et al. Modelling and simulation of the Positive and Negative Syndrome Scale (PANSS) time course and dropout hazard in placebo arms of schizophrenia clinical trials. Clin Pharmacokinet 2012; 51: 261–275. [DOI] [PubMed] [Google Scholar]
- 17. Pilla Reddy V, Kozielska M, Suleiman AA, Johnson M, Vermeulen A, Liu J, et al. Pharmacokinetic‐pharmacodynamic modeling of antipsychotic drugs in patients with schizophrenia Part I: the use of PANSS total score and clinical utility. Schizophr Res 2013; 146: 144–152. [DOI] [PubMed] [Google Scholar]
- 18. Rabinowitz J, Davidov O. The association of dropout and outcome in trials of antipsychotic medication and its implications for dealing with missing data. Schizophr Bull 2008; 34: 286–291. [DOI] [PMC free article] [PubMed] [Google Scholar]
- 19. Friberg L, de Greef R, Kerbusch T, Karlsson M. Modeling and simulation of the time course of asenapine exposure response and dropout patterns in acute schizophrenia. Clin Pharmacol Ther 2009; 86: 84–91. [DOI] [PubMed] [Google Scholar]
- 20. Kane JM, Eerdekens M, Lindenmayer J‐P, Keith SJ, Lesem M, Karcher K. Long‐acting injectable risperidone: efficacy and safety of the first long‐acting atypical antipsychotic. Am J Psychiatry 2003; 160: 1125–1132. [DOI] [PubMed] [Google Scholar]
- 21. Marder SR, Meibach RC. Risperidone in the treatment of schizophrenia. Am J Psychiatry 1994; 151: 825–835. [DOI] [PubMed] [Google Scholar]
- 22. Marder SR, Davis JM, Chouinard G. The effects of risperidone on the five dimensions of schizophrenia derived by factor analysis: combined results of the North American trials. J Clin Psychiatry 1997; 58: 538–546. [DOI] [PubMed] [Google Scholar]
- 23. Potkin SG, Cohen M, Panagides J. Efficacy and tolerability of asenapine in acute schizophrenia: a placebo‐ and risperidone‐controlled trial. J Clin Psychiatry 2007; 68: 1492–1500. [DOI] [PubMed] [Google Scholar]
- 24. Kapur S, Agid O, Mizrahi R, Li M. How antipsychotics work – from receptors to reality. NeuroRx 2006; 3: 10–21. [DOI] [PMC free article] [PubMed] [Google Scholar]


