

Abstract
Neuroendocrine control of reproduction by brain-secreted pulses of gonadotropin-releasing hormone (GnRH) represents a longstanding puzzle about extracellular signal decoding mechanisms. GnRH regulates the pituitary gonadotropin's follicle-stimulating hormone (FSH) and luteinizing hormone (LH), both of which are heterodimers specified by unique β subunits (FSHβ/LHβ). Contrary to Lhb, Fshb gene induction has a preference for low-frequency GnRH pulses. To clarify the underlying regulatory mechanisms, we developed three biologically anchored mathematical models: 1) parallel activation of Fshb inhibitory factors (e.g. inhibin α and VGF nerve growth factor-inducible), 2) activation of a signaling component with a refractory period (e.g. G protein), and 3) inactivation of a factor needed for Fshb induction (e.g. growth differentiation factor 9). Simulations with all three models recapitulated the Fshb expression levels obtained in pituitary gonadotrope cells perifused with varying GnRH pulse frequencies. Notably, simulations altering average concentration, pulse duration, and pulse frequency revealed that the apparent frequency-dependent pattern of Fshb expression in model 1 actually resulted from variations in average GnRH concentration. In contrast, models 2 and 3 showed “true” pulse frequency sensing. To resolve which components of this GnRH signal induce Fshb, we developed a high-throughput parallel experimental system. We analyzed over 4,000 samples in experiments with varying near-physiological GnRH concentrations and pulse patterns. Whereas Egr1 and Fos genes responded only to variations in average GnRH concentration, Fshb levels were sensitive to both average concentration and true pulse frequency. These results provide a foundation for understanding the role of multiple regulatory factors in modulating Fshb gene activity.
Keywords: follicle-stimulating hormone (FSH), G protein, gene expression, gene regulation, mathematical modeling, GnRH pulse frequency, average GnRH concentration, gonadotrope
Introduction
The evolution and function of the multicellular organism depends on intracellular and intercellular communication mediated by biological chemicals. One form of biological information transfer relies on sensing and responding to signaling chemical concentration. The mammalian endocrine system predominantly encodes intercellular communication as chemical concentrations (e.g. in the control of metabolic rate by thyroid hormone). Frequency- and pattern-encoded communication supports much higher-fidelity and -capacity information transfer. The specialized, high-capacity information transfer of the nervous system is associated with stimulus pattern-based electrochemical biological information transfer protocols, such as neurochemically regulated synaptic potentials and the all-or-none action potential. Although the mechanisms of information coding and decoding of many concentration-based biological chemical signals are well understood, the frequency and pulse pattern-signal information transfer protocols are largely unknown. At one key interface between the nervous system and the endocrine system, the hypothalamus controls the reproductive system largely via the release of gonadotropin-release hormone (GnRH)5 in short discrete pulses that vary in frequency during the reproductive cycle (1). Since the discovery of this apparently frequency-sensitive, brain-endocrine information transfer system in the 1970s, the mechanisms underlying the GnRH signal information decoding by the recipient pituitary gonadotrope cell have been an area of widespread research interest.
Pulsatile release of GnRH from specialized hypothalamic neurons orchestrates the biosynthesis and secretion of the pituitary gonadotropin hormones follicle-stimulating hormone (FSH) and luteinizing hormone (LH), which in turn regulate gonadal development and steroidogenesis (1). Reproductive disorders such as hypogonadotropic hypogonadism and anosmia (Kallmann syndrome) show impaired GnRH pulse secretion and subsequent abnormal FSH and LH levels; treatment with either pulsatile GnRH or gonadotropins restores fertility in those patients (for a review, see Ref. 2).
Differential regulation of FSH and LH secretion by GnRH during puberty and throughout the female menstrual cycle is characteristic of the hypothalamic-pituitary-gonadal axis (3). Higher GnRH pulse frequencies result in preferential LH secretion, whereas relatively lower GnRH pulse frequencies favor FSH production. The control of FSH and LH synthesis is linked to the transcription of their specific β subunits, Fshb and Lhb. Moreover, FSH secretion is mainly constitutive, and its synthesis and release are highly correlated (4–7). Thus, elucidating how the pituitary gonadotrope decodes the GnRH pulse signal into an Fshb transcriptional response is important due to its central role in reproductive function and dysfunction and as a paradigm for pulse-encoded signaling.
One barrier to achieving a mechanistic understanding of this regulatory system is that the specific features of the GnRH stimulus responsible for differential gene induction have not been fully considered. The importance of this aspect in studying frequency-dependent phenomena has recently been emphasized (8). In a typical experiment or simulation, changing the GnRH pulse frequency with other stimulus parameters held constant also alters the average GnRH concentration. As illustrated in Fig. 1A, high-frequency pulses (30-min cycle period) represent 4 times the average GnRH concentration per cycle period relative to lower-frequency pulses (120-min cycle period) of the same pulse duration (or width) and pulse amplitude (or height; concentration). Thus, whether the gonadotrope is responding to a specific pulse frequency or to a specific average GnRH concentration cannot be determined by only varying pulse frequency. Previous mathematical studies of GnRH signaling have largely neglected the effects of changes in average concentration delivered via altered pulse frequency on differential induction of Fshb. The various characteristics of the signal (pulse width, shape, height, and frequency) responsible for downstream responses may be complex and have non-linear relationships (9). The limited published experimental data relevant to this question about GnRH signal features (10, 11) are also inconclusive in establishing true frequency sensing due to the limited sampling possible in perifusion systems and other technical considerations, such as non-linearity of receptor stimulus-response systems (12). To test the effects of altered pulse frequency at constant average concentration, the pulse duration or the pulse amplitude can be altered (Fig. 1, B and C). However, to compensate by concentration, the concentration of the stimulus has to be in the near-linear regime of the concentration-response curve. Compensating by altering pulse duration requires testing stimulus patterns unrelated to normal physiology that may elicit complex short-term signaling regulation responses. Furthermore, the gonadotropin gene response may vary over time, and sampling that is beyond the capacity of the experimental protocols used to study these responses is needed to obtain reliable mapping of this complex parameter space. We have addressed the question of which components of GnRH pulse stimulation are responsible for Fshb induction using simple, biologically inspired mathematical models of the gonadotrope and the development of a new high-throughput experimental system.
Figure 1.

Comparison of a standard experiment with a pulse duration- and a pulse amplitude-compensated experiment. A, illustration of a standard experiment, where GnRH pulses of similar duration (τ = 5 min) and similar amplitude (A = 1 nm) are applied periodically every 30 min (top) or 120 min (middle). Average GnRH concentration, which is calculated as Aτ/T over a cycle period, is plotted for four different cycle periods (T = 30, 60, 120, and 240 min; bottom). B, in the pulse duration-compensated experiment, GnRH pulses of 5-min duration are applied every 30 min (top), whereas pulses of 20-min duration are applied every 120 min (middle); pulse amplitude is invariable (A = 1 nm). Subsequent to this pulse duration alteration, average GnRH concentration remains constant across the four different cycle periods (bottom). C, in the pulse amplitude-compensated experiment, GnRH pulses of 1 nm amplitude are applied every 30 min (top), whereas pulses of 4 nm amplitude are applied every 120 min (middle); pulse duration is invariable (τ = 5 min). Subsequent to this pulse amplitude change, average GnRH concentration remains constant across the four different cycle periods (bottom). GnRH concentration and average concentration values were expressed in arbitrary units (AU).
Results
Construction of model 1
We previously reported that Gαs activation by GnRH promoted Lhb but suppressed Fshb gene expression in LβT2 cells and found that this differential effect was mediated, at least in part, via the secretion of autocrine factors including inhibin α (13) and VGF nerve growth factor-inducible (VGF)/neuroendocrine regulatory peptide-1 (NERP-1) (14). In contrast with Fshb gene expression, Inha and Vgf were preferentially induced by high GnRH pulse frequency. Thus, we hypothesized that secreted inhibitory factors might contribute to the lower GnRH pulse frequency preference of Fshb induction. To explore this possibility, we constructed a simple mathematical model that recreated the dependence of Fshb expression on GnRH pulsatile signal and its negative regulation by inhibitory factor(s). Model 1 comprised the GnRH stimulus, Fshb, and inhibitory factor(s) (IF), with IF exerting a negative feedback on Fshb synthesis rate (Fig. 2i); see model 1 equations under “Experimental procedures”). Although this reduced model was not a complete description of the gonadotrope network, it isolated the role of inhibitory autocrine or intracellular factors to investigate minimal requirements for the Fshb gene response to low GnRH pulse frequency.
Figure 2.
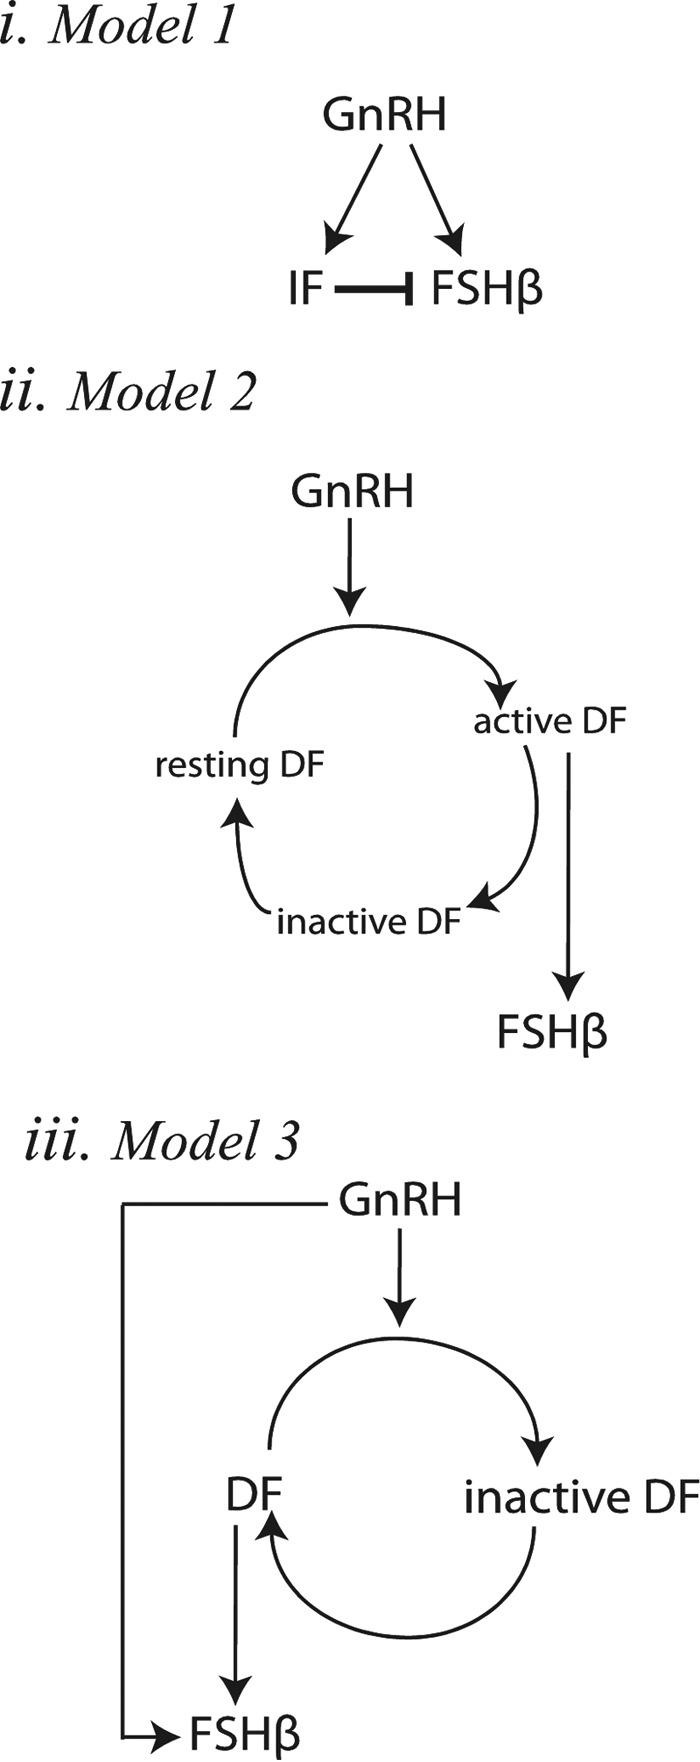
Schematic representation of models 1, 2, and 3. i, in model 1, GnRH stimulates the expression of both Fshb and an IF, which in turn inhibits Fshb expression. ii, in model 2, GnRH promotes the activation of a desensitizing factor from a resting state (DFr) to a transiently active state (DFa), which rapidly inactivates (DFi). Active DF (DFa) stimulates Fshb expression. iii, in model 3, GnRH causes the inactivation of a DF. Both GnRH and active DF stimulate Fshb expression.
Model 1 is consistent with experimental data
To model the conditions of the standard experiment protocol (Fig. 1A), we set pulse duration at 5 min and varied the pulse period without compensating for average concentration changes, which occur when altering frequency in this protocol. Cooperativity among the inhibitory factor(s) was required for the GnRH low-frequency (long cycle period) preference of the Fshb gene (n > 1; see Equation 4). As shown in Fig. 3, when n = 1, Fshb expression increases monotonically with decreasing GnRH period. By contrast, when n = 2 or n = 3, Fshb gene expression shows a U-shaped GnRH frequency-response relationship with a maximum at a period of roughly 120 min. Both the GnRH stimulus for Fshb production and the inhibitory factor level increase with increasing frequency. Without cooperativity, the effect of this inhibitory factor remains proportional to the Fshb-stimulating GnRH stimulus, and a monotonic curve results. With cooperativity, the inhibitory effect increases more than the stimulatory effect at increasing frequency, generating a U-shaped response curve. n = 3 was used as the cooperativity parameter in the fitting of model 1 to experimental data. Consistent with experimental data on the inhibitory factor VGF (14), in model simulations, the inhibitory factor showed increasing expression at decreasing GnRH pulse period (Fig. 4A), whereas Fshb showed maximal expression at about a 120-min cycle period (Fig. 4B). The model simulations showed good agreement with experimental data for Vgf and Fshb obtained using the same protocol (14) (Fig. 4).
Figure 3.
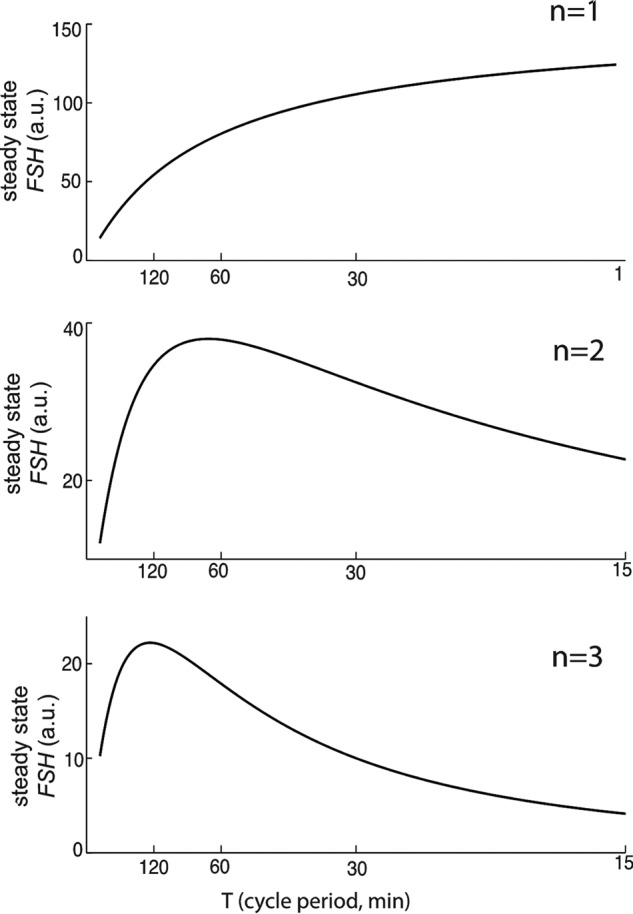
Cooperativity of inhibitory factors is required for the GnRH low-frequency preference of the Fshb gene in model 1. Mean Fshb gene expression calculated over one cycle at steady state is plotted over a range of GnRH periods for different values of n. When n = 1, Fshb increases to a saturated level with decreased GnRH period. When n = 2, Fshb is expressed maximally when GnRH period is 120 min. When n = 3, Fshb still has the same frequency preference (120-min period), but the curve is more sharply tuned to this frequency.
Figure 4.

Analysis of IF and Fshb induction by GnRH pulse stimulation for model 1. i, the model was simulated for 20 h for two different periods of the GnRH stimulus: T = 30 min (solid line) and T = 120 min (dashed line). At the end of each simulation, the total accumulated concentrations of IF (A) and Fshb (B) were plotted in AU. ii, modeling the effects of GnRH on average IF and Fshb mRNA expression at varied cycle periods. Average levels of IF (A) and Fshb (B) mRNAs were calculated over a single cycle at steady state and expressed in AU. Plotted are the model simulated data (dotted line) and the experimental data (black squares), which were obtained using LβT2 cells stimulated for 8 h with 2 nm GnRH pulses of 5-min duration (τ = 5 min) at the indicated cycle periods and harvested 30 min after the last pulse. iii, model predictions for the effects of GnRH on average IF and Fshb mRNA expression at varied cycle periods with pulse duration compensation (where τ/T = 0.1). Average levels of IF (A) and Fshb (B) mRNA were calculated over a single cycle at steady state and expressed in AU. iv, model predictions for the effects of GnRH on average IF (A) and Fshb (B) mRNA levels for many combinations of pulse duration (τ) and cycle period (T). Results were plotted as a filled contour map. Color scales representing steady-state concentrations are shown on the right of each plot. Solid black lines indicate constant GnRH concentration by varying pulse duration to compensate for changes in pulse period (constant τ/T). The dotted horizontal line corresponds with ii and represents a standard experiment with a 5-min pulse duration (as depicted in Fig. 1A). Parameter values were as follows. A = 1; n = 3. T values varied from 15 to 250 min. τ values varied from 1 to 20 min. Error bars represent S.E.
Fshb gene induction in model 1 responds to average GnRH concentration
As noted above, changing GnRH pulse frequency in the standard protocol also alters the average GnRH concentration stimulus. To determine whether model 1 was a true frequency decoder, we carried out simulations where cycle period was varied while keeping average GnRH concentration constant by adjusting pulse duration. This compensated simulation completely eliminated the apparent frequency sensitivity seen in the standard protocol (Fig. 4). Conversely, when average GnRH concentration was varied while holding cycle period constant, a concentration sensitivity was observed (data not shown) that paralleled the results obtained with the standard protocol (Fig. 4B (ii)). Thus, in model 1, Fshb gene activity is actually dependent on the average GnRH concentration, with the standard uncompensated protocol using GnRH pulse frequency changes as a mechanism for delivering different average GnRH concentrations. These effects can be seen more clearly in the contour plots shown in Fig. 4, A and B (iv), which summarize the results of many simulations performed at finely varied pulse durations and cycle periods. For instance, in the Fshb contour plot (Fig. 4B (iv)) the color, from dark blue to dark red, represents the level of Fshb expression. The result of simulation under any conditions can be determined from this plot. For example, the dotted horizontal line reflects a standard experiment (shown in Fig. 4B (ii)) with pulse duration held constant. The solid black lines represent coordinate variation of pulse duration and period, such that average GnRH concentration is held constant (constant τ/T) while the pulse frequency is changed. The level of Fshb can be seen to depend entirely on average GnRH concentration, because Fshb is unchanging along any constant average GnRH concentration (constant τ/T). Fshb induction has an optimum average concentration that corresponds to the concentration delivered by the 120-min GnRH pulse period in the standard 5-min pulse duration protocol.
Construction of model 2
A pulse frequency-sensitive model has been proposed by the Goldbeter group (15) to explain the effect of periodic stimuli on cellular response. The model included a receptor system capable of desensitization toward its ligand. According to this desensitization paradigm, a fast process of desensitization and a slower resensitization process were required for optimal stimulus frequency. Desensitization schemes were suggested to play a role in the GnRH system as well as in other systems (16–18). Moreover, recent experimental studies showed that the Gαq pathway, unlike Gαs, is subject to rapid desensitization in response to pulse stimulation (19, 20) and slowly resensitizes (21). Thus, we evaluated a model in which, in response to GnRH stimulus, a desensitizing stimulatory factor (DF) rapidly moves from a resting state (DFr) to an active state (DFa) and then rapidly inactivates into an inactive state (DFi); in the absence of GnRH, DFi slowly resensitizes to the resting state. As illustrated in Fig. 2 (ii), Fshb production depends on active DF (DFa). Model 2 equations are provided under “Experimental procedures.”
Model 2 is consistent with experimental data
Computer simulations of this model were carried out at two different cycle periods of GnRH stimulus: 30 and 120 min. Pulse duration (5 min) was unchanged from model 1. As in model 1, simulations showed that Fshb expression was optimal at the long cycle period (120 min). DFa also showed maximal expression at the 120-min cycle period (Fig. 5, A and B (i)); at the long cycle period, DFa first desensitized and then was able to resensitize between pulses, whereas at the short cycle period (30 min), DFa desensitized quickly and then did not have time to resensitize. Fshb reached steady state levels after ∼13 h. We fitted the model to previously reported experimental data (14). As shown in Fig. 5B (ii), this produced a cycle period-Fshb response curve with a maximum at the 120-min cycle period, which was consistent with the data. In contrast, the cycle period-response plot for mean DFi decreased monotonically as cycle period increased (Fig. 5A (ii)).
Figure 5.

Analysis of DF and Fshb induction by GnRH pulse stimulation for model 2. i, the model was simulated for 20 h for two different periods of the GnRH stimulus: T = 30 min (solid line) and T = 120 min (dashed line). At the end of each simulation, the total accumulated concentrations of active DF (DFa; A) and Fshb (B) were plotted in AU. ii, modeling the effects of GnRH on average inactive DF (DFi) and Fshb expression at varied cycle periods. Average levels of DFi (A) and Fshb mRNA (B) were calculated over a single cycle at steady state and expressed in AU. Plotted are the model simulated data (dotted line) and the experimental data (black squares). iii, model predictions for the effects of GnRH on average DFi and Fshb expression at varied cycle periods with pulse duration compensation (where τ/T = 0.1). Average levels of DF (A) and Fshb mRNA (B) were calculated over a single cycle at steady state and expressed in AU. iv, model predictions for the effects of GnRH on average DFi (A) and Fshb mRNA (B) expression for many combinations of pulse duration (τ) and cycle period (T). Results were plotted as a filled contour map. Color scales representing steady-state concentrations are shown on the right of each plot. Solid black lines indicate constant GnRH concentration by varying pulse duration to compensate for changes in pulse period (constant τ/T). Along these lines, average DFi decreased with increased cycle period and pulse duration. Along most lines, with the exception of τ/T = 0.5, average Fshb peaked for a particular GnRH cycle period. The dotted horizontal line corresponds with ii and represents a standard experiment with a 5-min pulse duration (as depicted in Fig. 1A). Parameter values were as follows. A = 1. T values varied from 15 to 250 min. τ values varied from 1 to 30 min. Error bars represent S.E.
Fshb gene response in model 2 is dependent on GnRH pulse frequency
To determine whether model 2 was a true frequency decoder, we carried out further simulations where cycle period was varied while keeping average GnRH concentration constant, by adjusting pulse duration. As shown in Fig. 5, A and B (iii), the plots for DFi and Fshb exhibited similar shapes as in Fig. 5A (ii), with the characteristic cycle period-Fshb response curve peaking at the 120-min cycle period. This indicated that model 2 was a true frequency decoder.
As for model 1, we examined the effects of variations in the stimulus parameters, namely cycle period and pulse duration, on Fshb and DFi steady state values. As illustrated in Fig. 5, A and B (iv), mean DFi decreased monotonically as pulse duration and cycle period increased. By contrast, mean Fshb was maximal in a specific region of cycle period values of 100–200 min and low pulse duration and decreased as both cycle period and pulse duration decreased. These results corroborated that Fshb gene response in model 2 was contingent upon frequency of the GnRH stimulus.
Construction of model 3
We previously identified GDF9 as a secreted autocrine factor, which induces the Fshb gene but is preferentially decreased by high-frequency GnRH pulses (22). Knockdown experiments also suggested that GDF9 contributes to the regulation of GnRH pulse frequency preference of the Fshb gene. We studied a model where GnRH initiates rapid inactivation of a DF (e.g. GDF9); in the absence of GnRH stimulation, the inactive form of DF slowly resensitizes, and DF then activates Fshb gene expression. As illustrated in Fig. 2 (iii), Fshb production depends on both DF and the GnRH stimulus. Model 3 equations are provided under “Experimental procedures.”
Model 3 is consistent with experimental data
Computer simulations of this model were carried out at two different cycle periods of GnRH stimulus: 30 and 120 min. Pulse duration (5 min) was unchanged from model 1. As in model 1, simulations showed that Fshb expression was optimal at the long cycle period (120 min). DF also showed maximal expression at the 120-min cycle period (Fig. 6, A and B (i)); at the long cycle period, DF was able to resensitize between pulses, whereas at the short cycle period (30 min), DF desensitized quickly and then did not have time to resensitize. Fshb reached steady state levels after ∼13 h. This model also was consistent with experimental data, as represented in Fig. 6B (ii). The cycle period-response plot for mean DF increased monotonically as cycle period increased (Fig. 6A (ii)).
Figure 6.

Analysis of DF and Fshb induction by GnRH pulse stimulation for model 3. i, the model was simulated for 20 h for two different periods of the GnRH stimulus: T = 30 min (solid line) and T = 120 min (dashed line). At the end of each simulation, the total accumulated concentrations of DF (A) and Fshb (B) were plotted in AU. ii, modeling the effects of GnRH on average DF and Fshb expression at varied cycle periods. Average levels of DF (A) and Fshb mRNA (B) were calculated over a single cycle at steady state and expressed in AU. Plotted are the model simulated data (dotted line) and the experimental data (black squares). iii, model predictions for the effects of GnRH on average DF and Fshb expression at varied cycle periods with pulse duration compensation (where τ/T = 0.1). Average levels of DF (A) and Fshb mRNA (B) were calculated over a single cycle at steady state and expressed in AU. iv, model predictions for the effects of GnRH on average DF (A) and Fshb mRNA (B) expression for many combinations of pulse duration (τ) and cycle period (T). Results were plotted as a filled contour map. Color scales representing steady-state concentrations are shown on the right of each plot. Solid black lines indicate constant GnRH concentration by varying pulse duration to compensate for changes in pulse period (constant τ/T). Along these lines, average DF increased with increased cycle period and pulse duration. Along most lines, with the exception of τ/T = 0.5, average Fshb peaked for a particular GnRH cycle period. The dotted horizontal line corresponds with ii and represents a standard experiment with a 5-min pulse duration (as depicted in Fig. 1A). Parameter values were as follows. A = 1. T values varied from 15 to 250 min. τ values varied from 1 to 30 min. Error Bars represent S.E.
Fshb gene response in model 3 is dependent on GnRH pulse frequency
To determine whether model 3 was a true frequency decoder, we carried out further simulations where cycle period was varied while keeping average GnRH concentration constant, by adjusting pulse duration. As shown in Fig. 6, A and B (iii), the plots for DF and Fshb exhibited similar shapes as in Fig. 6A (ii), with the characteristic cycle period-Fshb response curve peaking at the 120-min cycle period. This demonstrated that model 3 showed true frequency decoding.
As in model 1, we examined the effects of variations in the stimulus parameters, namely cycle period and pulse duration, on Fshb and DF steady-state values. As illustrated in Fig. 6, A and B (iv), mean DF increased monotonically as pulse duration and cycle period increased. By contrast, mean Fshb was maximal in a specific region of cycle period values of 100–200 min and low pulse duration and decreased as both cycle period and pulse duration increased. These results corroborated that Fshb gene response in model 3 was contingent upon frequency of the GnRH stimulus.
Experimental investigation of the signal components mediating Fshb induction
The model simulations revealed that experimental data obtained using the standard protocol, which does not compensate for average concentration changes that occur when GnRH pulse frequency is altered, were consistent with mechanistically distinct models. In the case of the inhibitory factor model 1, changes in GnRH pulse frequency alter Fshb levels only because they alter the average GnRH concentration to which the cells are exposed. The research community has accepted for decades the view that Fshb is GnRH frequency-controlled. Nonetheless, the modeling results led us to the question of what components of the GnRH signal were in fact being sensed by the gonadotrope and the gene control mechanisms underlying Fshb induction. Previous attempts to evaluate GnRH frequency sensing by compensating for changes in average concentration are inconclusive due to the assumption of linearity of compensation effects, limited assays, and lack of non-gonadotropin gene response controls (11, 23). The gonadotrope cell shows non-linear GnRH concentration stimulus-response curves for both proximal signaling responses and early gene induction that have narrow linear-response ranges (12, 24–28). Moreover, the effect of average concentration changes via pulse duration alterations on Fshb response cannot be assumed to be linear, due to the potential for rapid desensitization. Therefore, extensive study of variation of signal parameters in conjunction with comparing the responses of Fshb versus other control genes is required to definitively address this question.
Due to the number of confounding variables to evaluate, conclusive pulse duration- or pulse amplitude-compensated GnRH stimulation experiments require analysis of a large number of samples. Such studies are not feasible using perifusion systems due to their limited sample throughput. To overcome this limitation, we developed a high-sample throughput cell-on-coverslip transfer protocol that can be operated either manually or using a programmable articulated joint robot arm, allowing large numbers of samples to be assayed under varying treatment protocols and time points (see “Experimental procedures”). Mechanical stimulation (such as removing media) can alter gene expression in gonadotrope cells (data not shown). We tested whether the transfer protocol limited mechanical effects by comparing the expression of the early genes Egr1 (early growth response 1) and Fos (FBJ osteosarcoma oncogene) in cells that either (i) remained in medium (no pulse, no handling control), (ii) were exposed to vehicle pulses (vehicle pulse, handling control), or (iii) were exposed to GnRH pulses. As shown in Fig. 7A, no differences in Egr1 or Fos mRNA levels were seen between the no-pulse controls (i) and the vehicle-pulse samples (ii), whereas robust phasic gene responses were observed after each GnRH pulse (iii). Furthermore, Fshb induction was detected only with GnRH exposure (Fig. 7B). Similar to Fig. 7A, Egr1 and Fos exhibited robust phasic gene responses after each GnRH pulse, both at the 60-min (Fig. 7C (ii)) and 240-min cycle periods (Fig. 7C (iii)). In contrast, at the 30-min cycle period, the early gene responses remained analogous throughout the GnRH pulses (Fig. 7C (i)).
Figure 7.

Comparison of immediate-early gene responses to mechanical stress, vehicle-pulse stimulation, and GnRH-pulse stimulation. A and B, LβT2 cells were incubated in low serum-containing medium overnight and subjected to one of the following treatments for 8 h: no pulse (i), 5-min vehicle pulses at T = 120 min (ii), or 5-min pulses of 2 nm GnRH at T = 120 min (iii). Cells were harvested at the indicated time points (150–570 min), with time 0 corresponding to pulse 1. B, average Fshb mRNA expression levels were calculated over the eight time points and plotted. C, cells were stimulated for 12 h with 5-min pulses of 2 nm GnRH at T = 30 min (i), 60 min (ii), or 240 min (iii). Shown as an inset is the no-pulse control. Cells were harvested at the indicated time points (480–720 min), with time 0 corresponding to pulse 1. Egr1, Fos, and Fshb mRNA expression levels were determined by qPCR. Data represented by green bar graphs are median ± S.E. (error bars) of three biological replicates, with markers (+) denoting the individual data points. The data shown are from one experiment and are representative of n = 20 (A and B), n = 2 (C (i and iii)), and n = 10 (C (ii)) independent experiments.
To guide time point selection and data summarization, we evaluated the detailed temporal responses of gene changes in cells exposed to multiple pulses of GnRH. Shown in Fig. 8 is an example of the Fshb, Egr1, and Fos time trajectories obtained with low GnRH pulse frequency (120-min cycle period). Fshb levels increased steadily from pulse to pulse (Fig. 8A). In contrast, the early genes Egr1 (Fig. 8B) and Fos (Fig. 8C) showed a high level of expression 30 min after the pulse and then decreased to basal level within 60 min following the pulse.
Figure 8.

Temporal responses of Fshb, Egr1, and Fos to GnRH pulse stimulation at low GnRH frequency. LβT2 cells were stimulated for 12 h with 5-min pulses of 2 nm GnRH at T = 120 min. Shown as insets are the no-pulse controls. Cells were harvested at the indicated time points (160–540 min), with time 0 corresponding to pulse 1. Fshb, Egr1, and Fos mRNA expression levels were determined by qPCR. Data represented by green bar graphs are the median ± S.E. (error bars) of three biological replicates, with markers (+) denoting the individual data points. Of note, the nominal copy numbers for Fos differ from those in Fig. 7, due to the use of a different PCR primer set, as indicated under “Experimental procedures.”
Based on the results of a series of parameter exploration experiments that were deposited in GEO (GSE85179), we quantified gene expression levels by averaging gene copy numbers of all of the samples collected between 4 and 8 h after the initial pulse (i.e. nine time points; Fig. 9). We examined the effects of altered GnRH pulse frequency on the induction of Fshb, Egr1, and Fos by performing either pulse duration- or pulse amplitude-compensated experiments; gene responses to GnRH pulses administered every 60 min versus 120 min were compared at constant average GnRH concentration by varying either the duration (τ) or the amplitude (A) of the individual pulses. In pulse duration-compensated experiments, Fshb levels were reproducibly higher at the 120-min cycle period (T) than at the 60-min period for the same average GnRH concentration (Fig. 9, A and B). In contrast, Egr1 and Fos levels were insensitive to changes in GnRH pulse frequency when average GnRH concentration was unchanged. For the frequency patterns tested, these early genes responded only to the average GnRH concentration with no actual sensitivity to GnRH pulse frequency other than the effect of frequency changes on average GnRH concentration. These effects can be seen more clearly in the contour plots shown in Fig. 9B. At a given average GnRH concentration (where pulse duration/pulse period (τ/T) is constant), there was more Fshb at the 120-min cycle period than at the 60-min cycle period, whereas there was no such effect for Egr1 and Fos. Comparable results for Fshb and early gene induction were obtained in pulse amplitude-compensated experiments (Fig. 9C). Notably, whereas Fshb is responsive to GnRH pulse frequency, it is also responsive to changes in average concentration. At a given frequency, Fshb levels increase with increasing average GnRH concentration. These results suggest that both the concentration-sensitive (model 1) and frequency-sensitive (models 2 and 3) circuits may be relevant to aspects of Fshb gene control by GnRH.
Figure 9.

Comparison of Fshb, Egr1, and Fos frequency responses in pulse duration- versus pulse amplitude-compensated experiments. A, pulse duration compensation. LβT2 cells were stimulated with 2 nm GnRH pulses for 8 h at different cycle periods (T = 60 and 120 min, in red and blue, respectively) and pulse durations (τ = 2.5, 5, and 10 min), with or without pulse duration compensation (where average GnRH concentration, Aτ/T, was constant). Fshb, Egr1, and Fos mRNA expression levels were determined by qPCR, and their respective average expression levels over the last nine time points were calculated and plotted. The data shown are median ± S.E. (error bars) of three biological replicates from four independent experiments and representative of n = 6 (A) and from one experiment (C). B, results from A were plotted as a filled contour map. Color values are shown on the right of each graph. Dotted lines along which average GnRH concentration remains constant were labeled with the value of the τ/T ratio multiplied by 100. Along these lines, Fshb average expression levels increased with increased cycle period and pulse duration. Along most lines, Egr1 and Fos average expression levels remained constant. C, pulse amplitude compensation. LβT2 cells were stimulated with 5-min GnRH pulses for 8 h at different cycle periods (T = 60 and 120 min, in red and blue, respectively) and pulse amplitudes (A = 0.5, 1, and 2 nm), with or without pulse amplitude compensation.
Discussion
The regulation of Fshb by pulsatile GnRH involves the interaction of multiple factors (for reviews, see Refs. 7 and 29). Our analysis of simple mathematical models derived from various molecular mechanisms and modeling efforts demonstrated that, although a model may be consistent with experimental GnRH pulse response data, it may not actually represent a frequency-sensing regulatory mechanism. In particular, the Fshb response seen in model 1, which is based on GnRH stimulating both Fshb and an Fshb-suppressing factor, was unaffected by compensated changes in GnRH pulse frequency that held average GnRH concentration constant and responded only to changes in the average GnRH concentration.
These simulation results made it crucial to determine experimentally whether Fshb is responding to pulse frequency itself or to average concentration changes caused by variations in pulse frequency. Studies of this fundamental question to date have been limited, in part by the potential confounds of compensating concentration experimentally. Furthermore, only a small number of samples can be feasibly studied in perifusion systems, which does not provide the resolution needed to accurately determine the effects of different GnRH stimulus features. As shown by Fletcher et al. (8), for output frequency decoding, stimulus amplitude cannot compensate for variations in stimulus frequency when a non-linearity in stimulus amplitude is present in the signaling from input to output. Additionally, we studied responses of the intact Fshb gene, thereby avoiding the potential problems of non-physiological levels of expression and responses introduced by transfected receptors or reporter constructs. We assayed early genes as controls. Our results, replicated in thousands of separate samples, demonstrated conclusively that Egr1 and Fos levels change only in response to GnRH average concentration, whereas Fshb levels are sensitive both to changes in average GnRH concentration and to the actual frequency of GnRH pulses.
Many factors have been implicated in the control of Fshb gene expression or specifically in contributing to its GnRH frequency sensitivity, including ERK1/2 (30), dual-specificity phosphatases 1 and 4 (DUSP1/4) (31, 32), calcium signaling (33, 34), PKA/cyclic AMP-responsive element-binding protein (CREB) (35), inducible cyclic AMP early repressor (ICER) (23, 36), ski-oncogene-like protein (SKIL)/TG-interacting factor (TGIF1) (37), c-Jun-dimerization protein 2 (JDP2 (38)), Mullerian inhibiting substance (39), activin (16), growth differentiation factor 9 (GDF9) (22), β-catenin (40), breast cancer metastasis-suppressor 1-like (Brms1L) (40), inhibin (13, 16), GnRH receptor (11, 41), VGF/NERP-1 (14), and Six6/Six3 (42). Although these efforts have uncovered many interesting candidates for mediating GnRH frequency decoding, which factors determine the preferential low-frequency GnRH induction of Fshb and how they work together to regulate this system have not been established. Our results underscore the importance, both in simulations and in experimental studies, of discriminating GnRH pulse frequency effects from average concentration effects. Our simulations and data support the formulation that different gonadotrope regulatory circuits may work together to cause the GnRH concentration and frequency sensitivity of Fshb induction.
Desensitization schemes were previously suggested to have a critical role in the frequency sensitivity of various systems (16–18). Li and Goldbeter (15) discussed the application of their desensitization model to cyclic AMP signaling in Dictyostelium cells and to GnRH pulse stimulation of pituitary cells. We constructed model 2 based on a modified Goldbeter scheme and validated it experimentally. In model 2, the slow resensitization of a DF results in a refractory-like period (in a manner similar to an action potential), which suppresses further Fshb stimulation in response to high-frequency GnRH pulses. Several mechanisms of desensitization of the response to GnRH stimulation have been described, including desensitization of the Gq signal (20), induction of regulator of G protein signaling protein (RGS) (43, 44), induction of MAPK phosphatases (31), and down-regulation of inositol 1,4,5-trisphosphate receptors (45).
The mature murine gonadotrope LβT2 cell line that we have studied (46, 47) may not fully recapitulate the physiology of the gonadotrope cell in vivo. Pituitary cell heterogeneity and the small proportion of gonadotropes in vivo have made primary culture and in vivo gonadotrope studies challenging. The recent advent of high-throughput single-cell transcriptomic experimental and computational approaches (48–50) may facilitate testing and refining hypotheses developed in cell line models using data obtained from gonadotropes.
Which molecular mechanisms are most important for sensing different components of the GnRH stimulus remains to be determined. Experimentally, using a standard GnRH pulse protocol that does not distinguish frequency from concentration effects, we found that knockdown of the model 1-like factor Inha changed Fshb amplitude but not Fshb response to frequency changes (22). In contrast, knockdown of Gdf9, which forms a circuit topology corresponding to model 3 that shows “true” frequency sensitivity in simulations, shifted the frequency preference of the Fshb response (22). However, further study will be required to determine which among modulators we have studied and those investigated by other groups contribute to sensing components of the GnRH signal in vitro and in vivo. Our results clarify the questions about GnRH pattern that must be resolved to understand the control mechanisms of Fshb and provide prototype models for the underlying mechanisms. Developing a predictive gonadotropin expression model, which incorporates intracellular and extracellular regulatory loci and is validated in vivo, has the potential to improve our understanding of frequency-encoded signaling and to advance the rational treatment of many diseases that are sensitive to the function of the hypothalamic-pituitary-gonadal axis.
Experimental procedures
Mathematical modeling
Definitions and concepts used in the models
For simplicity, we consider only the case of an idealized square-wave GnRH pulse having constant concentration during the pulse as well as any test-pulse exposure occurring at a single frequency having regular (constant) pulse intervals. Within these constraints, several parameters of the GnRH stimulus can be varied experimentally and in simulations: pulse amplitude, which is the concentration of GnRH during each GnRH pulse (A), pulse duration or width (τ), and cycle period or the interval between the onset of each pulse (T). As mentioned above, most experiments and models addressing frequency decoding have thus far considered only variations in GnRH cycle period. Notably, changes to any of these three parameters also cause changes to the average GnRH concentration (Aτ/T).
To help separate the effects of frequency differences from the effects of average concentration differences, we use a working definition of frequency decoding. Our goal is to use the definition to assess whether a model or experimental system is actually sensitive to the frequency of the incoming stimulus or whether downstream effects depend only on average stimulus concentration.
Consider an arbitrary biological system or mathematical model that takes a square pulse stimulus, S(t), as input and leads to a response, R(t). The square pulse stimulus function, S(t), has pulse amplitude (A), pulse duration (τ), and cycle period (T), such that the following is true,
| (Eq. 1) |
for n = 0, 1, 2, 3…
The average value of S(t) over one cycle period, at steady state, is given by the following.
| (Eq. 2) |
When GnRH pulse frequency (ω = 1/T) is increased (i.e. cycle period is decreased) without changing pulse amplitude (A) or pulse duration (τ), there is a consequential increase in average stimulus concentration. Thus, it is impossible to tell whether changes in R(t) are due to changes in the stimulus concentration or in the frequency of pulses.
To try to distinguish the effects of pulse frequency from that of concentration, we can use changes to pulse duration or pulse amplitude to compensate for the changes in average stimulus concentration as cycle period is varied. In other words, as we vary T, we also vary either A or τ so that Aτ/T remains constant (see Fig. 1).
If the model is frequency-insensitive, then we expect that average response, <R>, depends only upon the average concentration of the stimulus, 〈S〉, and because 〈S〉 is constant, 〈R〉 will be constant for all T. If the model is frequency-sensitive, then we expect that when T varies while the average concentration of S(t) is constant, the output 〈R〉 is sensitive to T.
Furthermore, we differentiate here between frequency sensitivity and frequency decoding. Frequency sensitivity refers to changes in <R> as frequency varies. Frequency decoding specifically refers to the case where <R> has a maximum for a particular frequency of stimulation. At frequencies higher or lower than this preferred frequency, <R> is smaller than the maximum. A model may be frequency-sensitive, but not a frequency decoder. However, all frequency decoders are also frequency-sensitive.
However, compensating the changes in frequency by either changes in pulse amplitude or changes in pulse duration is only partly satisfactory. For each pulse, the system may have a threshold concentration, a maximal activating concentration, and a highly non-linear relationship between the two (20). Hyperbolic stimulus-response relationships are known for GnRH receptor activation (12), and inverted U concentration-response curves are not uncommon. However, achieving equivalent average concentration at different frequency patterns by changes of pulse duration also has the limitation that complex activating or inhibitory regulatory mechanisms may be activated at different pulse durations. Thus, concentration compensation studies of frequency sensitivity need to be interpreted cautiously, and parameter space needs thorough exploration due to non-linearity of response curves and other confounding effects. For evaluating the three prototype models, we focused on pulse width compensation at constant pulse concentration. The actual biology of the system is more complex than the models, and our subsequent detailed experiments compared both pulse concentration and pulse width compensation effects.
Model 1
Model 1 is based on GnRH activation of a factor that suppresses FSH levels (see Fig. 2), such as inhibin (13), and consists of two equations
| (Eq. 3) |
| (Eq. 4) |
where IF represents an inhibitory factor, α1 is the inhibition constant, and n reflects cooperativity of the inhibitory mechanism. Because we focused on pulse duration-compensated experiments, we have set the pulse amplitude to 1. The model parameters are found in Table 1. Both IF and Fshb depend directly on S(t) and follow first-order decay. There is a single negative-feedback term, which multiplies the expression rate parameter of Fshb.
Table 1.
Model parameters
| Model | Symbol | Description | Value |
|---|---|---|---|
| 1 | g1 | Expression rate constant for IF | 1,350 h−1 |
| 1 | g2 | Expression rate constant for Fshb | 720 h−1 |
| 1 | λ1 | Decay rate constant for IF | 0.35 h−1 |
| 1 | λ2 | Decay rate constant for Fshb | 0.35 h−1 |
| 1 | α1 | Inhibition constant for IF | 0.0035 |
| 2 | k1 | Activation rate constant for DFa | 22 h−1 |
| 2 | k2 | Transformation rate constant for DFa | 10 h−1 |
| 2 | k3 | Transformation rate constant for DFr | 0.5 h−1 |
| 2 | k4 | Expression rate constant for Fshb | 1,390 h−1 |
| 2 | k5 | Decay rate constant for Fshb | 0.35 h−1 |
| 3 | γ1 | Deactivation rate constant for DF | 22 h−1 |
| 3 | γ2 | Resensitization rate constant for DF | 0.5 h−1 |
| 3 | γ3 | Expression rate constant for Fshb | 1,710 h−1 |
| 3 | γ4 | Decay rate constant for Fshb | 0.35 h−1 |
Using Equations 3 and 4, we consider the case where IF and FSH have reached a periodic steady state, with IF(0) = IF(T) and FSH(0) = FSH(T). Based on our definition of frequency decoding above, we want to evaluate the following quantities.
| (Eq. 5) |
and
| (Eq. 6) |
Decay rates for IF and Fshb mRNAs (0.35/h for both) were derived from the measured half-lives of GnRH-induced inhibitory factor Vgf (14) and Fshb, respectively. Fshb half-life was 2.68 ± 0.20 h (40) and approximately the same for Vgf.6 A decay rate (λ) is calculated as λ = t½/ln 2, where t½ is the half-life.
Model 2
Model 2, shown schematically in Fig. 2, is based on GnRH activating an intermediate that leads to Fshb induction and that spontaneously desensitizes and cannot be immediately reactivated. In response to the GnRH stimulus, DF moves rapidly from a resting state (DFr) to a transiently active state (DFa) and then rapidly into an inactive state (DFi). The return to the resting state occurs at a much slower rate. Only DF in the active state can induce Fshb expression. This active, inactive and resting DF approximates the behavior of GnRH intermediates such as G proteins.
Model 2 comprises five equations.
| (Eq. 7) |
| (Eq. 8) |
| (Eq. 9) |
| (Eq. 10) |
| (Eq. 11) |
Similar to model 1, we consider the case where DFr, DFa, DFi, and FSH have reached a periodic steady state, with DFr(0) = DFr(T), DFa(0) = DFa(T), DFi(0) = DFi(T), and FSH(0) = FSH(T). As above, to check for true frequency decoding, we evaluate the average values of each component at steady state (see Equations 5 and 6). Model parameters are listed in Table 1.
Model 3
Model 3 includes an intermediate (DF) that stimulates Fshb and that is inactivated by GnRH stimulation (see Fig. 2). This corresponds to the behavior of GDF9 (22). The GnRH stimulus (S(t) as in Equation 1) causes a rapid deactivation of a desensitizing factor (DF) to a desensitized state (DF′), whereas in the absence of stimulus, DF′ slowly resensitizes and returns to the active state (DF). DF has some maximal level in the absence of GnRH stimulation. Model 3 comprises four equations.
| (Eq. 12) |
| (Eq. 13) |
| (Eq. 14) |
| (Eq. 15) |
The model parameters are listed in Table 1. In the model, Fshb concentration depends on both DF2(t) and S(t) and follows first-order decay.
Again, we consider the case where all model components have reached a periodic steady state and evaluate their average values over a cycle period to check for frequency decoding (see models 1 and 2 and Equations 5 and 6).
Simulations
We used the ODE45 solver in MATLAB to simulate the models while varying patterns of the GnRH stimulus (S(t)).
Materials and cell culture
GnRH was purchased from Bachem (Torrance, CA). LβT2 cells were obtained from Dr. Pamela Mellon (University of California San Diego, La Jolla, CA). Cells were cultured at 37 °C in DMEM (Mediatech, Herndon, VA) supplemented with 10% fetal bovine serum (FBS; Gemini, Calabasas, CA) in a humidified air atmosphere of 5% CO2. Our LβT2 cell line was regularly tested (every 3–6 months) for mycoplasma and interspecies contamination and authenticated by analysis of short tandem repeat DNA profiling using 27 mouse-specific microsatellite markers (Mouse Cell Check Plus, IDEXX BioResearch, Columbia, MO). Cell line authentication was achieved by comparing our cells with an original aliquot of LβT2 cells provided by Dr. P. Mellon and used as a standard reference. Our results confirmed that our LβT2 cells were mycoplasma-free, were of mouse origin, and had similar markers as the original cell line aliquot.
High-throughput parallel pulse experiments
750,000 authenticated LβT2 cells were seeded on each tissue culture-treated coverslip (Thermanox, Thermo Fisher Scientific, Waltham, MA) and were grown for 2 days in DMEM supplemented with 10% FBS. Cells were incubated in DMEM supplemented with 2% charcoal-treated FBS (Gibco) and 20 mm HEPES (Mediatech, Herndon, VA) overnight before the pulse experiment. Coverslips were placed in inert coverslip racks, and pulse patterns were achieved by moving racks among GnRH, wash, and resting solutions in chambers maintained at 37 °C in a water bath. The chamber solution in the water bath was DMEM supplemented with 2% charcoal-treated FBS and 20 mm HEPES. For each condition/time point, a minimum of 3 biological replicates were collected.
Quantitative real-time PCR
Coverslips were collected with forceps directly in the chamber and placed immediately in 360 μl of guanidium thiocyanate RNA lysis buffer (4 m guanidium thiocyanate, 25 mm sodium citrate, pH 7, 0.5% sarcosyl (N-lauroyl sarcosine), and 0.1 m 2-mercaptoethanol). Total RNA was isolated with the “Absolutely RNA 96 microprep” kit (Agilent, Santa Clara, CA) according to the manufacturer's protocol, subjected to an ethanol precipitation to remove salts, and resuspended in elution buffer (Agilent). RNA concentrations were determined with Quant-iT RiboGreen RNA reagent (Invitrogen) using a fluorescence microplate reader (SpectraMax M3, Molecular Devices, Sunnyvale, CA). After reverse-transcription of 1 μg of RNA with the Affinity Script reverse transcriptase (Agilent), samples were diluted 1:20 in molecular biology grade H2O (Cellgro, Manassas, VA). Later, SYBR Green qPCR assays were performed (40 cycles) in an ABI Prism 7900HT thermal cycler (Applied Biosystems, Foster City, CA) using 5 μl of cDNA template and 5 μl of master mix containing the specific primers for the targeted gene, Platinum® TaqDNA polymerase, and the required qPCR buffer, according to manufacturer's recommendations. Three technical qPCR replicates were run for each biological replicate. Results were exported as cycle threshold (Ct) values, and Ct values of target genes were normalized to that of RPS11 in subsequent analysis. Data were expressed as arbitrary units by using the formula, E = 2,500 × 1.93(rps11 Ct value − gene of interest Ct value), where E is the expression level in arbitrary units. Primer sequences (5′–3′) were as follows: Fshb-sense, ACGAGACCGTAAGATTGCCT; Fshb-antisense, CGGCAATGTCCATCGTCGTT; Egr1-sense, ACGTCTTGGTGCCTTTTGTG; Egr1-antisense, ACATTCTGGAGACCGAAAGC; Fos-sense, GTGTTCCTGGCAATAGCGTG; Fos-antisense, GCAAGAAGGTGGTCGCATTC (used in Fig. 8); Fos-sense2, TTCCTGGCAATAGCGTGTTC; Fos-antisense2, TTCAGACCACCTCGACAATG (used in Fig. 7); Rps11-sense, CGTGACGAAGATGAAGATGC; Rps11-antisense, GCACATTGAATCGCACAGTC. All qPCR data, which represented 36 independent experiments (with over 4,000 samples), were deposited in Gene Expression Omnibus (GEO; GSE85179).
Statistical analysis
Statistical calculations were performed using the GraphPad Prism statistical software package version 5 (GraphPad Inc., La Jolla, CA). Data were analyzed for normality followed by calculation of analysis of variance. Statistical significance was set as indicated in the figure legends with at least p < 0.05.
Author contributions
E. S., F. R.-Z., L. Z.-K., S. G. C., and S. C. S. designed the research; E. S., F. R.-Z., L. Z. K., and S. G. C. performed the research; F. H. and C. S. P. contributed new reagents or analytic tools; E. S., F. R.-Z., L. Z.-K., S. G. C., H. P., F. H., J. L. T., and S. C. S. analyzed the data; and E. S., H. P., F. R.-Z., and S. C. S. wrote the paper.
Acknowledgment
qPCR assays were conducted at the Icahn School of Medicine at the Mount Sinai Quantitative PCR Core.
This work was supported by National Institutes of Health Grant DK46943. The authors declare that they have no conflicts of interest with the contents of this article. The content is solely the responsibility of the authors and does not necessarily represent the official views of the National Institutes of Health.
All qPCR data were deposited in Gene Expression Omnibus under accession no. GSE 85179.
S. G. Choi, Q. Wang, and S. C. Sealfon, unpublished data.
- GnRH
- gonadotropin-releasing hormone
- LH
- luteinizing hormone
- qPCR
- quantitative real-time PCR
- IF
- inhibitory factor(s)
- DF
- desensitizing stimulatory factor
- AU
- arbitrary units.
References
- 1. Burger L. L., Haisenleder D. J., Dalkin A. C., and Marshall J. C. (2004) Regulation of gonadotropin subunit gene transcription. J. Mol. Endocrinol. 33, 559–584 [DOI] [PubMed] [Google Scholar]
- 2. Dodé C., and Hardelin J. P. (2009) Kallmann syndrome. Eur. J. Hum. Genet. 17, 139–146 [DOI] [PMC free article] [PubMed] [Google Scholar]
- 3. Marshall J. C., Dalkin A. C., Haisenleder D. J., Paul S. J., Ortolano G. A., and Kelch R. P. (1991) Gonadotropin-releasing hormone pulses: regulators of gonadotropin synthesis and ovulatory cycles. Recent Prog. Horm. Res. 47, 155–187; discussion 188–159 [DOI] [PubMed] [Google Scholar]
- 4. Farnworth P. G. (1995) Gonadotrophin secretion revisited. How many ways can FSH leave a gonadotroph? J. Endocrinol. 145, 387–395 [DOI] [PubMed] [Google Scholar]
- 5. McNeilly A. S., Crawford J. L., Taragnat C., Nicol L., and McNeilly J. R. (2003) The differential secretion of FSH and LH: regulation through genes, feedback and packaging. Reprod. Suppl. 61, 463–476 [PubMed] [Google Scholar]
- 6. Nicol L., McNeilly J. R., Stridsberg M., and McNeilly A. S. (2004) Differential secretion of gonadotrophins: investigation of the role of secretogranin II and chromogranin A in the release of LH and FSH in LbetaT2 cells. J. Mol. Endocrinol. 32, 467–480 [DOI] [PubMed] [Google Scholar]
- 7. Bernard D. J., Fortin J., Wang Y., and Lamba P. (2010) Mechanisms of FSH synthesis: what we know, what we don't, and why you should care. Fertil. Steril. 93, 2465–2485 [DOI] [PubMed] [Google Scholar]
- 8. Fletcher P. A., Clément F., Vidal A., Tabak J., and Bertram R. (2014) Interpreting frequency responses to dose-conserved pulsatile input signals in simple cell signaling motifs. PLoS One 9, e95613. [DOI] [PMC free article] [PubMed] [Google Scholar]
- 9. Purvis J. E., and Lahav G. (2013) Encoding and decoding cellular information through signaling dynamics. Cell 152, 945–956 [DOI] [PMC free article] [PubMed] [Google Scholar]
- 10. Dalkin A. C., Haisenleder D. J., Ortolano G. A., Ellis T. R., and Marshall J. C. (1989) The frequency of gonadotropin-releasing-hormone stimulation differentially regulates gonadotropin subunit messenger ribonucleic acid expression. Endocrinology 125, 917–924 [DOI] [PubMed] [Google Scholar]
- 11. Bédécarrats G. Y., and Kaiser U. B. (2003) Differential regulation of gonadotropin subunit gene promoter activity by pulsatile gonadotropin-releasing hormone (GnRH) in perifused L β T2 cells: role of GnRH receptor concentration. Endocrinology 144, 1802–1811 [DOI] [PubMed] [Google Scholar]
- 12. Yuen T., Wurmbach E., Ebersole B. J., Ruf F., Pfeffer R. L., and Sealfon S. C. (2002) Coupling of GnRH concentration and the GnRH receptor-activated gene program. Mol. Endocrinol. 16, 1145–1153 [DOI] [PubMed] [Google Scholar]
- 13. Choi S. G., Jia J., Pfeffer R. L., and Sealfon S. C. (2012) G proteins and autocrine signaling differentially regulate gonadotropin subunit expression in pituitary gonadotrope. J. Biol. Chem. 287, 21550–21560 [DOI] [PMC free article] [PubMed] [Google Scholar]
- 14. Choi S. G., Wang Q., Jia J., Chikina M., Pincas H., Dolios G., Sasaki K., Wang R., Minamino N., Salton S. R., and Sealfon S. C. (2016) Characterization of gonadotrope secretoproteome identifies neurosecretory protein VGF-derived peptide suppression of follicle-stimulating hormone gene expression. J. Biol. Chem. 291, 21322–21334 [DOI] [PMC free article] [PubMed] [Google Scholar]
- 15. Li Y., and Goldbeter A. (1989) Frequency specificity in intercellular communication: influence of patterns of periodic signaling on target cell responsiveness. Biophys. J. 55, 125–145 [DOI] [PMC free article] [PubMed] [Google Scholar]
- 16. Bertram R., and Li Y. X. (2008) A mathematical model for the actions of activin, inhibin, and follistatin on pituitary gonadotrophs. Bull. Math. Biol. 70, 2211–2228 [DOI] [PMC free article] [PubMed] [Google Scholar]
- 17. Li Y., and Goldbeter A. (1990) Frequency encoding of pulsatile signals of cAMP based on receptor desensitization in Dictyostelium cells. J. Theor. Biol. 146, 355–367 [DOI] [PubMed] [Google Scholar]
- 18. Martiel J. L., and Goldbeter A. (1987) A model based on receptor desensitization for cyclic AMP signaling in Dictyostelium cells. Biophys. J. 52, 807–828 [DOI] [PMC free article] [PubMed] [Google Scholar]
- 19. Mukhopadhyay S., and Ross E. M. (1999) Rapid GTP binding and hydrolysis by G(q) promoted by receptor and GTPase-activating proteins. Proc. Natl. Acad. Sci. U.S.A. 96, 9539–9544 [DOI] [PMC free article] [PubMed] [Google Scholar]
- 20. Tsutsumi R., Mistry D., and Webster N. J. (2010) Signaling responses to pulsatile gonadotropin-releasing hormone in LbetaT2 gonadotrope cells. J. Biol. Chem. 285, 20262–20272 [DOI] [PMC free article] [PubMed] [Google Scholar]
- 21. Adjobo-Hermans M. J., Goedhart J., van Weeren L., Nijmeijer S., Manders E. M., Offermanns S., and Gadella T. W. Jr. (2011) Real-time visualization of heterotrimeric G protein Gq activation in living cells. BMC Biol. 9, 32. [DOI] [PMC free article] [PubMed] [Google Scholar]
- 22. Choi S. G., Wang Q., Jia J., Pincas H., Turgeon J. L., and Sealfon S. C. (2014) Growth differentiation factor 9 (GDF9) forms an incoherent feed-forward loop modulating follicle-stimulating hormone β-subunit (FSHβ) gene expression. J. Biol. Chem. 289, 16164–16175 [DOI] [PMC free article] [PubMed] [Google Scholar]
- 23. Magill J. C., Ciccone N. A., and Kaiser U. B. (2013) A mathematical model of pulse-coded hormone signal responses in pituitary gonadotroph cells. Math. Biosci. 246, 38–46 [DOI] [PMC free article] [PubMed] [Google Scholar]
- 24. Ballesteros J., Kitanovic S., Guarnieri F., Davies P., Fromme B. J., Konvicka K., Chi L., Millar R. P., Davidson J. S., Weinstein H., and Sealfon S. C. (1998) Functional microdomains in G-protein-coupled receptors. The conserved arginine-cage motif in the gonadotropin-releasing hormone receptor. J. Biol. Chem. 273, 10445–10453 [DOI] [PubMed] [Google Scholar]
- 25. Davidson J. S., Flanagan C. A., Zhou W., Becker I. I., Elario R., Emeran W., Sealfon S. C., and Millar R. P. (1995) Identification of N-glycosylation sites in the gonadotropin-releasing hormone receptor: role in receptor expression but not ligand binding. Mol. Cell. Endocrinol. 107, 241–245 [DOI] [PubMed] [Google Scholar]
- 26. Flanagan C. A., Becker I. I., Davidson J. S., Wakefield I. K., Zhou W., Sealfon S. C., and Millar R. P. (1994) Glutamate 301 of the mouse gonadotropin-releasing hormone receptor confers specificity for arginine 8 of mammalian gonadotropin-releasing hormone. J. Biol. Chem. 269, 22636–22641 [PubMed] [Google Scholar]
- 27. Kitanovic S., Yuen T., Flanagan C. A., Ebersole B. J., and Sealfon S. C. (2001) Insertional mutagenesis of the arginine cage domain of the gonadotropin-releasing hormone receptor. Mol. Endocrinol. 15, 390–397 [DOI] [PubMed] [Google Scholar]
- 28. Zhou W., Rodic V., Kitanovic S., Flanagan C. A., Chi L., Weinstein H., Maayani S., Millar R. P., and Sealfon S. C. (1995) A locus of the gonadotropin-releasing hormone receptor that differentiates agonist and antagonist binding sites. J. Biol. Chem. 270, 18853–18857 [DOI] [PubMed] [Google Scholar]
- 29. Pincas H., Choi S. G., Wang Q., Jia J., Turgeon J. L., and Sealfon S. C. (2014) Outside the box signaling: secreted factors modulate GnRH receptor-mediated gonadotropin regulation. Mol. Cell. Endocrinol. 385, 56–61 [DOI] [PMC free article] [PubMed] [Google Scholar]
- 30. Kanasaki H., Bedecarrats G. Y., Kam K. Y., Xu S., and Kaiser U. B. (2005) Gonadotropin-releasing hormone pulse frequency-dependent activation of extracellular signal-regulated kinase pathways in perifused LβT2 cells. Endocrinology 146, 5503–5513 [DOI] [PubMed] [Google Scholar]
- 31. Lim S., Pnueli L., Tan J. H., Naor Z., Rajagopal G., and Melamed P. (2009) Negative feedback governs gonadotrope frequency-decoding of gonadotropin releasing hormone pulse-frequency. PLoS One 4, e7244. [DOI] [PMC free article] [PubMed] [Google Scholar]
- 32. Purwana I. N., Kanasaki H., Mijiddorj T., Oride A., and Miyazaki K. (2011) Induction of dual-specificity phosphatase 1 (DUSP1) by pulsatile gonadotropin-releasing hormone stimulation: role for gonadotropin subunit expression in mouse pituitary LbetaT2 cells. Biol. Reprod. 84, 996–1004 [DOI] [PubMed] [Google Scholar]
- 33. Armstrong S. P., Caunt C. J., Fowkes R. C., Tsaneva-Atanasova K., and McArdle C. A. (2009) Pulsatile and sustained gonadotropin-releasing hormone (GnRH) receptor signaling: does the Ca2+/NFAT signaling pathway decode GnRH pulse frequency? J. Biol. Chem. 284, 35746–35757 [DOI] [PMC free article] [PubMed] [Google Scholar]
- 34. Washington T. M., Blum J. J., Reed M. C., and Conn P. M. (2004) A mathematical model for LH release in response to continuous and pulsatile exposure of gonadotrophs to GnRH. Theor. Biol. Med. Model. 1, 9. [DOI] [PMC free article] [PubMed] [Google Scholar]
- 35. Thompson I. R., Ciccone N. A., Xu S., Zaytseva S., Carroll R. S., and Kaiser U. B. (2013) GnRH pulse frequency-dependent stimulation of FSHβ transcription is mediated via activation of PKA and CREB. Mol. Endocrinol. 27, 606–618 [DOI] [PMC free article] [PubMed] [Google Scholar]
- 36. Ciccone N. A., Xu S., Lacza C. T., Carroll R. S., and Kaiser U. B. (2010) Frequency-dependent regulation of follicle-stimulating hormone β by pulsatile gonadotropin-releasing hormone is mediated by functional antagonism of bZIP transcription factors. Mol. Cell. Biol. 30, 1028–1040 [DOI] [PMC free article] [PubMed] [Google Scholar]
- 37. Mistry D. S., Tsutsumi R., Fernandez M., Sharma S., Cardenas S. A., Lawson M. A., and Webster N. J. (2011) Gonadotropin-releasing hormone pulse sensitivity of follicle-stimulating hormone-β gene is mediated by differential expression of positive regulatory activator protein 1 factors and corepressors SKIL and TGIF1. Mol. Endocrinol. 25, 1387–1403 [DOI] [PMC free article] [PubMed] [Google Scholar]
- 38. Jonak C. R., Lainez N. M., Roybal L. L., Williamson A. D., and Coss D. (2017) c-JUN dimerization protein 2 (JDP2) is a transcriptional repressor of follicle-stimulating hormone β (FSHβ) and is required for preventing premature reproductive senescence in female mice. J. Biol. Chem. 292, 2646–2659 [DOI] [PMC free article] [PubMed] [Google Scholar]
- 39. Bédécarrats G. Y., O'Neill F. H., Norwitz E. R., Kaiser U. B., and Teixeira J. (2003) Regulation of gonadotropin gene expression by Mullerian inhibiting substance. Proc. Natl. Acad. Sci. U.S.A. 100, 9348–9353 [DOI] [PMC free article] [PubMed] [Google Scholar]
- 40. Wang Q., Chikina M., Zaslavsky E., Pincas H., and Sealfon S. C. (2013) β-Catenin regulates GnRH-induced FSHβ gene expression. Mol. Endocrinol. 27, 224–237 [DOI] [PMC free article] [PubMed] [Google Scholar]
- 41. Kaiser U. B., Sabbagh E., Katzenellenbogen R. A., Conn P. M., and Chin W. W. (1995) A mechanism for the differential regulation of gonadotropin subunit gene expression by gonadotropin-releasing hormone. Proc. Natl. Acad. Sci. U.S.A. 92, 12280–12284 [DOI] [PMC free article] [PubMed] [Google Scholar]
- 42. Xie H., Hoffmann H. M., Meadows J. D., Mayo S. L., Trang C., Leming S. S., Maruggi C., Davis S. W., Larder R., and Mellon P. L. (2015) Homeodomain proteins SIX3 and SIX6 regulate gonadotrope-specific genes during pituitary development. Mol. Endocrinol. 29, 842–855 [DOI] [PMC free article] [PubMed] [Google Scholar]
- 43. Karakoula A., Tovey S. C., Brighton P. J., and Willars G. B. (2008) Lack of receptor-selective effects of either RGS2, RGS3 or RGS4 on muscarinic M3- and gonadotropin-releasing hormone receptor-mediated signalling through Gαq/11. Eur. J. Pharmacol 587, 16–24 [DOI] [PubMed] [Google Scholar]
- 44. Wurmbach E., Yuen T., Ebersole B. J., and Sealfon S. C. (2001) Gonadotropin-releasing hormone receptor-coupled gene network organization. J. Biol. Chem. 276, 47195–47201 [DOI] [PubMed] [Google Scholar]
- 45. Willars G. B., Royall J. E., Nahorski S. R., El-Gehani F., Everest H., and McArdle C. A. (2001) Rapid down-regulation of the type I inositol 1,4,5-trisphosphate receptor and desensitization of gonadotropin-releasing hormone-mediated Ca2+ responses in αT3–1 gonadotropes. J. Biol. Chem. 276, 3123–3129 [DOI] [PubMed] [Google Scholar]
- 46. Alarid E. T., Windle J. J., Whyte D. B., and Mellon P. L. (1996) Immortalization of pituitary cells at discrete stages of development by directed oncogenesis in transgenic mice. Development 122, 3319–3329 [DOI] [PubMed] [Google Scholar]
- 47. Thomas P., Mellon P. L., Turgeon J., and Waring D. W. (1996) The LβT2 clonal gonadotrope: a model for single cell studies of endocrine cell secretion. Endocrinology 137, 2979–2989 [DOI] [PubMed] [Google Scholar]
- 48. Macosko E. Z., Basu A., Satija R., Nemesh J., Shekhar K., Goldman M., Tirosh I., Bialas A. R., Kamitaki N., Martersteck E. M., Trombetta J. J., Weitz D. A., Sanes J. R., Shalek A. K., Regev A., and McCarroll S. A. (2015) Highly parallel genome-wide expression profiling of individual cells using nanoliter droplets. Cell 161, 1202–1214 [DOI] [PMC free article] [PubMed] [Google Scholar]
- 49. Satija R., Farrell J. A., Gennert D., Schier A. F., and Regev A. (2015) Spatial reconstruction of single-cell gene expression data. Nat. Biotechnol. 33, 495–502 [DOI] [PMC free article] [PubMed] [Google Scholar]
- 50. Zheng G. X., Terry J. M., Belgrader P., Ryvkin P., Bent Z. W., Wilson R., Ziraldo S. B., Wheeler T. D., McDermott G. P., Zhu J., Gregory M. T., Shuga J., Montesclaros L., Underwood J. G., Masquelier D. A., et al. (2017) Massively parallel digital transcriptional profiling of single cells. Nat. Commun. 8, 14049. [DOI] [PMC free article] [PubMed] [Google Scholar]