

Abstract
The mammalian post-implantation embryo has been extensively investigated at the tissue level. However, to unravel the molecular basis for the cell-fate plasticity and determination, it is essential to study the characteristics of individual cells. In particular, the individual definitive endoderm (DE) cells have not been characterized in vivo. Here, we report gene expression patterns in single cells freshly isolated from mouse embryos on days 5.5 and 6.5. Initial transcriptome data from 124 single cells yielded signature genes for the epiblast, visceral endoderm, and extra-embryonic ectoderm and revealed a unique distribution pattern of fibroblast growth factor (FGF) ligands and receptors. Further analysis indicated that early-stage epiblast cells do not segregate into lineages of the major germ layers. Instead, some cells began to diverge from epiblast cells, displaying molecular features of the premesendoderm by expressing higher levels of mesendoderm markers and lower levels of Sox3 transcripts. Analysis of single-cell high-throughput quantitative RT-PCR data from 441 cells identified a late stage of the day 6.5 embryo in which mesoderm and DE cells emerge, with many of them coexpressing Oct4 and Gata6. Analysis of single-cell RNA-sequence data from 112 cells of the late-stage day 6.5 embryos revealed differentially expressed signaling genes and networks of transcription factors that might underlie the segregation of the mesoderm and DE lineages. Moreover, we discovered a subpopulation of mesoderm cells that possess molecular features of the extraembryonic mesoderm. This study provides fundamental insight into the molecular basis for lineage segregation in post-implantation mouse embryos.
Keywords: development, differentiation, embryo, gene regulation, transcriptomics, definitive endoderm, extraembryonic mesoderm, mesoderm, gastrulation, single-cell RNA-Seq
Introduction
The development of mammalian embryo from a fertilized egg to a gastrulating embryo consists of a precisely controlled series of lineage specification and axis-patterning events. A group of pluripotent cells, the epiblast (EPI),3 is set aside from two extra-embryonic lineages, the trophectoderm (TE) and primitive endoderm (PrE), during the first few days of mouse embryonic development (1). Cells from the EPI, PrE, and TE of preimplantation embryos can be clearly distinguished according to their quantitative gene expression profiles (2–5). Following implantation at about embryonic day (E) 4.5, the PrE gives rise to the parietal endoderm (PE), which directly contacts the maternal tissue, and the visceral endoderm (VE), which remains in contact with the embryo and further develops into the endoderm of the visceral yolk sac. The TE develops into the ectoplacental cone (EPC) and extra-embryonic ectoderm (EXE), which are progenitors of the placenta. The EPI transforms into the egg cylinder, an elongated cup-like single layer of an epithelial structure, which later gives rise to both somatic tissues and the germ cell lineage of the embryo proper (6).
At around E6.0, a unique group of VE cells assemble at the distal tip of the egg cylinder and move to the prospective anterior side of the embryo to form the anterior visceral endoderm (AVE). The EPI cells converge toward the posterior proximal pole of the embryo to form the primitive streak (PS). Over the next 24 h, the PS lengthens and ultimately occupies the entire proximal-distal length of the posterior side of the embryo (1, 6–9). The PS formation morphologically marks the onset of gastrulation, through which three primary germ layers are generated, and the basic body plan of the embryo is established. EPI cells that undergo epithelial-mesenchymal transition and ingress at the PS constitute the mesoderm (ME) and definitive endoderm (DE), whereas EPI cells that do not pass through the PS specify the neuroectoderm (NE) and surface ectoderm (6, 10). The anterior and posterior regions of the PS are associated with distinct ME and DE lineages. The anterior and intermediate regions of the PS give rise to the lateral plate, paraxial and cardiac mesoderm, whereas the extreme anterior tip of the PS give rise to the prechordal plate, the notochord, the node, and the DE cell lineage (6, 11). The posterior PS cells give rise to extraembryonic mesoderm (EXEM) and blood islands. Nevertheless, signaling-induced cell regionalization does not necessarily indicate an irreversible lineage commitment. The cells may retain pluripotency when they are subject to a different environment (12–14).
Various strategies have been utilized to identify key signaling pathways and developmentally regulated transcription factors in post-implantation mouse embryos at the tissue level. For examples, Wnt, Bmp4, FGF, and Nodal signaling are known to be critical for the cell lineage allocation and axis patterning in the post-implantation mouse embryo (1, 7–9, 15–21). However, the molecular basis for the cell-fate plasticity and lineage segregation remains elusive. A recently developed technique of single-cell RNA sequencing (scRNA-Seq) and single-cell high-throughput quantitative RT-PCR (qRT-PCR) provide opportunities to address these fundamental questions at a high resolution. Thus far, the single-cell techniques have been used to reveal pluripotency state transition and lineage segregation of embryonic stem cells and distinct cell types of preimplantation embryos (2–5, 22–26). More recently, the technology was also used to decipher the mesodermal lineage diversification toward the hematopoietic system in the post-implantation embryo (27, 28), and to compare the pluripotency state between preimplantation and post-implantation embryos (5, 29). However, it still remains a challenge to obtain gene expression profiles of embryonic cells that specify earliest in the EPI and to know how they segregate into ME and DE in the PS in vivo.
In this study, we have used scRNA-Seq in combination with single-cell qRT-PCR to investigate the transcription signature and molecular heterogeneity in freshly isolated cells from mouse embryos on embryonic days (E) 5.5 and E6.5. The single-cell gene expression dataset allows us to visualize the differentiation state of individual cells at early post-implantation stages, improving our understanding of how early embryonic cells make cell fate decision into ME and DE lineages and potentially guiding in vitro differentiation of pluripotent stem cells for the clinical use.
Results
Unique transcriptional signatures of the EPI, VE, and EXE at the early post-implantation stage
Mouse embryos undergo rapid growth at E5.5 and E6.5 (Fig. 1A). To obtain the global picture of transcriptional signatures of individual cells at these stages, we initially generated the transcriptomes of 124 cells from three embryos (E5.5 (I), E5.5 (II), and E6.5 (III)) by the scRNA-Seq method (supplemental Table S1). Briefly, embryos containing only the EPI, VE, and EXE were dissociated into single-cell suspension after the PE and EPC were removed with digestion. mRNA of each cell was reverse-transcribed and amplified to obtain cDNA, and the expression of the EPI marker Oct4 (30–34), the VE marker Gata6 (35–37), and the EXE marker Hand1 (38, 39) was examined by qRT-PCR. Because of our primary interest in EPI cells, most of the cells selected for scRNA-Seq were expressing Oct4 (108 Oct4+ cells in total, 19 cells in each of the two E5.5 embryos, and 70 cells in the E6.5 embryo). Theoretically, there are about 120 cells in the epiblast of the E5.5 mouse embryo, and about 660 cells in the epiblast of the E6.5 mouse embryo (40). Thus, sequenced EPI cells accounted for about 10% of total EPI cells in each embryo. In addition to 108 EPI cells, we sequenced 8 Gata6+ and 8 Hand1+ cells, making a sum of 124 initially sequenced cells.
Figure 1.

Molecular characterizations of EPI, VE, and EXE cell types in early post-implantation embryos. A, images of E5.5 and E6.5 embryos. Scale bars, 100 μm. B, PC projections of 124 initially sequenced cells collected from embryos I, II, and III with transcriptome data as an input. Different symbols are used to indicate the embryo membership of sequenced cells, and different colors of the symbol are used to present the key molecular feature of the cells in terms of expression of Oct4, Gata6, and Hand1. RPKM >1 was considered expressed. Cells expressing Oct4, Gata6, and Hand1 formed distinct clusters, which were defined as the EPI, VE, and EXE, respectively. Most of the cells expressed only one of the markers (indicated by brown, rose, or light blue colors), except three VE cells that expressed a high level of Gata6 and a low level of Oct4 (indicated by a deep blue color) and one EPI cell that expressed a high level of Oct4 and a low level of Hand1 (indicated by black color). C, the heatmap showing expression patterns of representative specific genes in EPI, VE, and EXE cells. The whole list of genes specific to each cell type is provided in supplemental Table S2. The upper bar indicates the embryo membership of cells, and the lower bar indicates the lineage of cells. The left-hand-side bar indicates different categories of specific genes. Cells were clustered by the euclidian distance and ward linkage. D, differentially expressed FGF ligands and receptors in EPI, VE, and EXE cells, which are arranged in the same order and denoted in the same way as in C.
Principal component analysis (PCA) on transcriptome data of 124 samples was conducted to visualize the relationship among distinct cell types in the embryo. As anticipated, data clustered according to the expression of Oct4, Gata6, or Hand1 (Fig. 1B). Unsupervised hierarchical clustering of expression profiles was consistent with the PCA results (supplemental Fig. S1A). Analysis of the correlation between different samples identified a pair of highly similar EPI cells (arrow in supplemental Fig. S1A), whose correlation coefficient was greater than 0.99. The correlation coefficient between other pairs of samples was 0.56–0.89, revealing variable correlations among EPI cells at the early post-implantation stages.
With the availability of transcriptome data, we sought for genes specifically expressed in the three clusters (Mann Whitney U test, false discovery rate (FDR) <5%) (supplemental Table S2). As expected, there were many signature genes for EPI, VE, and EXE cells (supplemental Table S2 and Fig. 1C). Thus, the three clusters were concordantly defined as the EPI, VE, and EXE. Moreover, to obtain comprehensive signature genes of these three cell types, we compared our dataset with that from a recently published study (27), generating common lists of cell type-specific genes (supplemental Fig. S1B and Table S2). On the one hand, 748 genes were enriched in VE cells as compared with EPI cells, including known marker genes of the VE (Afp, Amn, Bmp2, Cer1, Cubn, Dab2, Foxa2, Foxq1, Gata4, Gata6, Hhex, Hnf4a, Lhx1, Sfrp1, Sfrp5, Sox7, and Sox17) (Fig. 1C) (4, 7), many signaling genes (Apoa1, Chrd, Dkk1, F2, F10, Fga, Fgb, Fgf10, Fgf8, Fgfbp1, Fgfr4, Fgfrl1, Fzd5, Igf2, Nog, and Rbp4), and tissue development-related genes (Cxcr4, Gsc, Hnf1a, and Hnf1b) (supplemental Fig. S1C and Table S2); 533 genes were enriched in EXE cells as compared with EPI cells, including known marker genes of the EXE (Bmp4, Bmp8b, Cdx2, Elf5, Esrrb, Ets2, Fgfr2, Gata3, Id2, Pcsk6, and Smad3) (Fig. 1C) (2, 7) and genes involved in the placenta development such as Gjb3, Gjb5, and Wnt7b (supplemental Fig. S1C and Table S2); 117 genes had higher expression levels in both VE and EXE cells compared with EPI cells, including Cited1, Eomes, Fgfbp1, Fgfr4, Igf2, Krt8, Krt18, Krt19, Rhox5, Tbx3, Tead1, and Tead4. On the other hand, 210 genes had higher expression levels in EPI cells compared with both VE and EXE cells, including many developmental process-related genes (Dnmt3a, Dnmt3b, Fgf15, Fgf4, Foxd3, Foxp1, Fzd2, Gdf1, Ifitm3, Lin28b, Nanog, Pou5f1, Sall2, Sfrp2, Sox11, and Tdgf1) (Fig. 1C and supplemental Table S2). Analyzing datasets from both studies, we noticed that Sox2 was expressed by the majority of EXE and EPI cells but was rarely expressed by VE cells, whereas Otx2 was expressed by the most of VE and EPI cells but was rarely expressed by EXE cells (supplemental Table S2). The finding is in agreement with their known distributions (41, 42). Identification of these cell type-specific genes will aid in our understanding of how different cell types form and interact during early embryonic development.
Notably, many ligands and receptors of FGF signaling showed cell type-specific expression patterns (Fig. 1D and supplemental Table S2). For example, Fgf15 and Fgf4 were specifically expressed in EPI cells, whereas Fgfbp1 and Fgfr4 were enriched in VE and EXE cells. Interestingly, Fgf5, a well known marker for EPI cells (12), was expressed in the most of the EPI cells as well as in all of the VE cells but in none of the EXE cells. Fgfr2 was highly expressed by all of EXE cells but rarely detected in VE or EPI cells. The finding suggests that the expression of FGF ligands and receptors are spatially regulated in embryonic and extraembryonic cells.
Pre-MEN cells diverge from the EPI cells
We then focused our analyses on EPI cells. The anterior-posterior polarity of the mouse embryo is established at around E6.0, marked by the establishment of the AVE and formation of the PS. NE forms later in the anterior side, although the ME and DE are derived from the PS region at the posterior side of the embryo (1, 6). We speculated that cells from the anterior and posterior parts of the EPI could be distinguished by their expression patterns of germ layer markers and that distinct molecular subtypes of these two regions could be identified. Therefore, we analyzed the expression of an annotated set of 90 expressed germ layer markers (Fig. 2A), chosen because they are known to regulate the specification of early lineages or are expressed in specific regions of early embryos, in the 108 sequenced EPI cells. The markers were divided into the following five groups: the anterior ME/DE/anterior PS/node; the posterior PS; the PS or the posterior EPI; the NE; and the epidermis (supplemental Experimental procedures). The first three groups were all related to the formation of the mesendoderm (MEN) in the PS.
Figure 2.

Identification and analysis of the pre-MEN subgroup in EPI cells. A, heatmap showing distribution of 90 germ-layer markers in 108 EPI cells collected from embryos I–III. The markers were classified into five categories as indicated on the right side. The bars above the heatmap indicate PC2 scores, the embryo membership, and lineages of cells, respectively. Cells are arranged according to their PC2 scores (B) so that pre-MEN cells are on the left. Fgf8, Eomes, Nanog, Tdgf1, Wnt3, Nodal, and Sox3 are colored in red. B, the PCA of 108 EPI cells by 90 germ-layer markers. A dashed line was drawn according to the clustering of cells. The cells below the dashed line were named pre-MEN cells. C, PC projections of 90 germ-layer markers. There are mainly MEN markers in the bottom region of PC2 axis, whereas NE marker Sox3 is in the top region of the PC2 axis. D, a negative correlation between Sox3 and MEN markers in sequenced cells. For clarity, only some of the genes at the two ends of the PC2 axis in C are shown. The cells on the x axis were sorted according to their projection scores for the PC2 so that pre-MEN cells below the dashed line in B are on the left, and the other EPI cells are on the right. The traces represent moving averages of the given gene's expression level in overlapping windows of 20 cells.
We found that the most of these 90 markers scattered in different EPI cells, whereas certain markers were expressed by nearly all EPI cells examined, including Tdgf1, Nanog, Ifitm3, Otx2, Pou3f1, Churc1, and Krt18 (Fig. 2A and supplemental Table S3). To learn whether some EPI cells were biased toward distinct subtypes, we further analyzed the expression of the 90 markers by PCA, as PC projections of genes could help identify the most information-rich genes in classifying cell types (2). PC projections of both cells and genes were calculated. The PC1 axis reflected a gene's expression percentage in the cell population, whereas the PC2 axis seemed to associate with the germ layer differentiation status. Marker genes related to MEN such as Fgf8, Eomes, Nanog, Tdgf1, Wnt3, and Nodal were located in the bottom region of the PC2 axis, whereas an NE marker Sox3 was located on the top of the PC2 axis (Fig. 2, B and C). Moving average analysis by ordering the cells according to their PC2 scores confirmed an inverse correlation between the posterior markers and Sox3 (Fig. 2D). This result suggests that cells positioning in the bottom region of the PC2 axis might be the perspective MEN lineage (described as pre-MEN cells hereafter). Notably, some of the pre-MEN cells were obtained from E5.5 embryos (Fig. 2B), implicating that EPI cells begin to exhibit different characteristics even at E5.5 when distinct germ layers have not formed.
To substantiate our findings further, we carried out single-cell high-throughput qRT-PCR analysis of 98 Oct4+Gata6−Hand1− cells from additional three embryos (E5.5 (IV), E5.5 (V), and E6.5 (VI)). Out of the set of 90 germ layer marker genes, 45 genes were detected in at least one of these cells (supplemental Table S3). The posterior markers Fgf8, Eomes, Nanog, Tdgf1, Wnt3, and Nodal showed the same reverse correlation with Sox3 along the PC2 axis (supplemental Fig. S2, A–C). The pre-MEN cells were again identified, including EPI cells from E5.5 embryos (supplemental Fig. S2A). This result supports the existence of pre-MEN cells in the EPI at the early post-implantation stage.
Therefore, pre-MEN cells seem to prime toward the MEN lineage compared with the rest of the EPI cells at the early post-implantation stages, discriminated by elevated expression of a combination of posterior markers and reduced expression of Sox3. These cells could represent one type of the earliest specified cells among all EPI cells after implantation.
E6.5_Late embryos have distinct characteristics compared with E6.5_Early embryos
To further investigate gene expression profiles of single embryonic cells, we also conducted single-cell high-throughput qRT-PCR for 343 Oct4+ cells collected from an additional four embryos (E6.5 (VII, VIII, IX, and X)), using primers for the set of 65 successfully detected lineage marker genes (supplemental Tables S4 and S5). We unexpectedly found that these cells had markedly increased percentages of cells double-positive for Oct4 and Gata6 (Oct4+Gata6+) (Fig. 3A, dark green and light green). This caught our attention, as expression of Oct4, Gata6, and Hand1 was largely mutually exclusive in an individual cell from the embryos that we examined earlier (embryos I–VI). Both Oct4 and Gata6 have been reported to be expressed in the PS region at the gastrulation stage, in addition to their respective distribution in the EPI and VE before gastrulation (31, 32, 35, 43, 44). We inferred that Oct4+Gata6+ cells could be in the PS region of the late-stage E6.5 embryos after gastrulation had begun (embryos VII–X were named E6.5_Late and their EPI was named Late EPI). In contrast, the E6.5 embryos we examined earlier (embryos III and VI) contained very few Oct4+Gata6+ cells, being named E6.5_Early. Furthermore, the E5.5 and E6.5_Early embryos (I–VI), either having no PS or a very small one, were uniformly named as Early embryos, and their EPI was named Early EPI accordingly.
Figure 3.

E6.5_Late embryos exhibit distinct molecular characteristics. A, increase in the percentages of Oct4+ Gata6+ cells in E6.5_Late embryos. The levels of Oct4, Gata6, and Hand1 were measured by qRT-PCR. The percentage of cells being single, double, or triple positive for Oct4, Gata6, and Hand1 are shown in different colors. The percentage of Oct4+ Gata6+ cells (including Oct4+Gata6+Hand1− cells and Oct4+Gata6+Hand1+ cells, indicated by deep and light green colors, respectively), increased in cells from E6.5_Late embryos (embryos VII, VIII, IX, and X), compared with cells from E5.5 and E6.5_Early embryos (embryos II, III, IV, V, and VI). Embryo I was an E5.5 embryo, for which the expression of Oct4, Gata6, and Hand1 was only partially analyzed. Thus, cells from the embryo I were not used in the statistical analysis in A. B, coexpression of Gata6 and Oct4 in an E6.5_Late embryo (XII) but not in an E6.5_Early embryo (XI). Whole embryos were double-immunostained with anti-Oct4 and anti-Gata6 antibodies. Confocal images were acquired as z-stacks of xy images. However, only one of the xy images is shown for clarity. Images containing Gata6 staining were processed once by the median filter (at the parameter 3*3) in the Image-Pro Plus software to reduce background noises. Schematic figures of E6.5_Early and E6.5_Late embryos are shown on the right side. Scale bars, 100 μm. C, the heatmap showing the decrease in the expression of some pluripotency markers in E6.5_Late embryos. Only cells being single-positive for Oct4 (Oct4+Gata6−Hand1−) were included in the analysis. The levels of Fgf4, Dppa2, Dppa4, and Gdf3 were measured by single-cell high-throughput qRT-PCR and normalized to the level of Gapdh. D, an image of the embryo E6.5_Late (VII). Scale bar, 100 μm.
To provide further evidence for the existence of E6.5_Early and E6.5_Late embryos, we first examined the coexpression of Oct4 and Gata6 at a single cell level through immunofluorescence staining. In an E6.5_Early embryo (embryo XI), Oct4 and Gata6 were detected in EPI and VE, respectively, whereas in an E6.5_Late embryo (embryo XII), the two proteins were found coexpressed in a subset of cells (yellow) clustering in the PS region, in addition to their respective distribution in EPI and VE cells (Fig. 3B). Second, based on the PCA map constructed using qRT-PCR data of the 65 successfully detected germ-layer markers (supplemental Fig. S3, A and B, and Table S5), the majority of Oct4+Gata6+ cells formed a cluster distinct from the majority of Oct4+Gata6− cells in the E6.5_Late embryos, although a few Oct4+Gata6− cells also appeared in the Oct4+Gata6+ cluster. Some MEN markers (such as Bmp7, Cdh2, Evx1, Lhx1, and T) became coexpressed in cells of the Oct4+Gata6+ cluster (supplemental Fig. S3C), in which some NE markers (Pou3f1, Sox2, and Sox3) were down-regulated (one-sided Mann-Whitney U test, FDR <0.1). Our results support the notion that the most of the Oct4+Gata6+ were MEN cells from the PS region. Interestingly, PCA analysis of cells in the Oct4+Gata6+ cluster revealed that DE signature genes Cer1, Sox17, and Foxa2 were clustered together (supplemental Fig. S3, D and E), suggesting that cells in the Oct4+Gata6+ cluster might segregate into DE and ME lineages. Third, we compared expression levels of some pluripotency-associated markers (Dppa2, Dppa4, Fgf4, and Gdf3) between the Oct4+ cells from E5.5 and E6.5_Early embryos and those Oct4+ cells from E6.5_Late embryos, and we found greatly reduced expression of these four genes in the Oct4+ cells from E6.5_Late embryos (Fig. 3C and supplemental Table S5). This finding also indicates that E6.5_Late embryos were at a later developmental stage than E6.5_Early embryos. Taken together, our results suggest that E6.5_Late embryos are distinct from E6.5_Early embryos, with MEN cells (many of them are Oct4+Gata6+) emerging from the PS region of E6.5_Late embryos. The morphology of one E6.5_Late embryo is shown in Fig. 3D.
Segregation of E6.5_Late cells into ME and DE lineages
To obtain a genome-wide transcriptional profiling of cells in E6.5_Late embryos, we conducted scRNA sequencing for 76 cells from the Oct4+Gata6+ cluster and 36 cells from the Oct4+Gata6− cluster (supplemental Fig. S3, A and B). Whole transcriptome data of these 112 E6.5_Late cells (embryos VII, VIII, and X) were compared with those of 124 cells from the early embryos (embryos I–III) to construct a PCA map. The segregation of embryonic (EPI) and extraembryonic (VE and EXE) lineages could be seen from the PC4-PC5-PC6 projection (supplemental Fig. S4A). Of the 112 E6.5_Late cells, two cells clustered with the eight early VE cells (thus named “VE-like” in supplemental Table S1), and four cells clustered with the eight early EXE cells (thus named “EXE-like” in supplemental Table S1). The rest of 106 E6.5_Late cells clustered with the 108 early EPI cells. These 214 cells were considered as embryonic cells and used for further analyses.
We next applied the diffusion map dimensionality reduction (28) to the 214 cells using the expression of the same 90 germ-layer markers (Fig. 2A) as an input. This analysis revealed that a proportion of E6.5_Late cells split into two branches, and most of the cells on the two branches were Oct4+Gata6+ (deep green and light green in supplemental Fig. S4B). The PCA map revealed that the cells on one branch should be DE cells, because they expressed higher levels of DE signature genes (Cer1, Foxa2, Hhex, and Sox17); and the cells on the other branch should be ME cells, as they enriched ME signature genes (Mesp1, Lefty2, Ifitm1, and Evx1) (supplemental Fig. S4C). We then divided the 214 cells into four groups according to their distribution on the diffusion map: EPI, DE, ME, and a group containing three intermediate cells and one cell that did not seem to cluster with any other cells (these four cells were designated as “Other” hereafter) (Fig. 4A). The EPI cluster included four subgroups as follows: Early pre-MEN, the rest of the Early EPI, Late pre-MEN, and the rest of Late EPI (Fig. 4A). On the diffusion map, pre-MEN cells from the Early EPI (defined in Fig. 2) were closer to DE and ME cells than the rest of Early EPI cells (Fig. 4A), and the Late EPI subgroup also contained some cells close to the ME and DE cells (named Late pre-MEN cells), suggesting the continued existence of pre-MEN cells in the E6.5_Late embryos. To avoid biased grouping caused by the utilization of only 90 germ layer markers, we combined the 90 germ layer markers with all genes associated with GO categories “Mesoderm,” “Endoderm,” and “Ectoderm” to generate a list of 822 marker genes (supplemental Table S6). With the extended markers, cells were similarly clustered into the three major groups (EPI, DE, and ME) on the diffusion map (supplemental Fig. S4D), validating the segregation of DE and ME lineages. However, Early pre-MEN cells mixed with the rest of Early EPI cells, and Early EPI was separated from Late EPI. This might be caused by the inclusion of some developmental stage-associated genes in the 822 genes in addition to germ layer markers, which could mask the germ layer-associated feature.
Figure 4.

Segregation of ME and DE lineages in cells from E6.5_Late embryos. A, diffusion map representation of 214 sequenced cells, including 108 cells from E6.5_Early embryos (I, II, and III) and 106 cells from E6.5_Late_embryos (VII, VIII, and X). The 214 cells were identified to be embryonic cells in supplemental Fig. S4A. The same 90 germ-layer markers used in Fig. 2A were used as the input. The first two diffusion components (DC1 and DC2) are shown. Shapes indicate the embryo membership of cells, and colors indicate the lineages. Clusters are designated as the EPI, DE, and ME according to markers enriched in them. The Early pre-MEN and the rest of Early EPI cells were from E5.5 and E6.5_Early embryos (I, II, and III), defined according to the position of cells on the PCA map (see Fig. 2B). Late pre-MEN and the rest of Late EPI cells were from E6.5_Late embryos (VII, VIII, and X), defined here according to the distance to the branching point of DE and ME cells. Therefore, the EPI cluster contains four subgroups: Early Pre-MEN, the rest of Early EPI, Late pre-MEN, and the rest of Late EPI. B, the heatmap showing expression patterns of 90 germ-layer markers in 214 embryonic cells. The bars above the heatmap indicate the embryo membership and lineages, respectively. Cells are arranged according to their positions on the diffusion map as in A, with EPI cells and ME cells arranged from the bottom to top of the DC2 axis, and DE cells arranged from the left to right of the DC1 axis. Markers are arranged and grouped in the same way as in Fig. 2A. The markers specific for EPI, ME, and DE groups (against the other two groups, Mann-Whitney U test, FDR <0.05) are highlighted in red, green, and purple, respectively. C, statistical analysis revealing coexpressed patterns of DE and ME marker genes in DE and ME cells, respectively. DE and ME markers are highlighted as in B and are listed in the lower panel. The average number of expressed DE and ME markers (RPKM >1) in a single cell of each cell type (Early pre-MEN, the rest of Early EPI, Late pre-MEN, the rest of Late EPI, DE, and ME) was calculated and displayed. Data are represented as mean ± S.D. The number of expressed DE and ME markers significantly increased (Mann-Whitney U test, p < 0.01, denoted by stars) in DE and ME cells, respectively, compared with the other types of cells. D, expression patterns of several genes across the developmental trajectories. The expression levels of individual genes were overlaid onto the diffusion plot.
To gain detailed information for the distribution of marker genes in different groups of cells, we compared the expression of the 90 germ-layer markers (divided into five groups in Fig. 2A) among EPI, DE, and ME groups and marked genes specific for each group (Mann-Whitney U test, FDR <0.05) (Fig. 4B). As expected, most markers of the first three groups were enriched in DE or ME cells. Interestingly, NE markers Six1 (45) and Six3 (46) and epidermis marker Krt8 (12) were found to enrich in the DE lineage in the E6.5_Late embryos, suggesting their dynamic distribution in different lineages. Moreover, the DE and ME cells significantly coexpressed their respective lineage markers, whereas pre-MEN cells did not coexpress the DE or ME markers (Fig. 4C). Among 90 markers, Cer1, Krt18, Mesp1, and Lefty2 were with the most extreme PC loadings when DE and ME cells were clustered by PCA (supplemental Fig. S4C), indicating that they were the most discriminating markers for the DE (Cer1, Krt18) and ME (Mesp1, Lefty2) lineages, respectively. The expression of these four markers was plotted on the diffusion map (Fig. 4D), together with Fgf8 and Sox3, which were up-regulated and down-regulated, respectively, in Early pre-MEN cells (Fig. 2). Collectively, this analysis first reveals the molecular feature in the segregation of the DE and ME in post-implantation embryos at a single cell level.
Lineage-specific genes across developmental stages
To look for more stage-specific and lineage-specific genes that were differentially regulated during segregation of DE and ME lineages, we compared transcriptome data between Early EPI and Late EPI as well as among Late EPI, DE, and ME. As cDNA libraries for E6.5_Late embryonic cells were constructed using two different methods, we analyzed data from the two batches separately for comparisons and selected the common genes (supplemental Table S6) to minimize batch effects. 5600 genes were down-regulated from Early EPI to Late EPI (one-sided Mann-Whitney U test, FDR <0.25). Many of down-regulated genes associated with the GO term “cellular metabolic process” (Rank 1, p < 10−121) or “gene expression” (Rank 24, p < 10−38). Although GO analyses with the 5600 genes did not identify terms related to “pluripotency” (p > 0.1), many pluripotency-associated genes were down-regulated from Early EPI to Late EPI, including Dppa2, Dppa4, Fgf4, Gdf3 (consistent with Fig. 3C), and Utf1. 149 genes were up-regulated from Early EPI to Late EPI (one-sided Mann-Whitney U test, FDR <0.25). Many of the up-regulated genes are related to the GO terms “nucleic acid metabolic process” (Rank 1, p < 10−21), “gene expression” (Rank 28, p < 10−14), or “developmental process” (Rank 29, p < 10−14), including Gdf9, Gsk3b, Hmga2, Lef1, Lhx1, Mycn, Pten, Sall4, and Sox11.
Compared with Late EPI, 124 and 76 genes (one-sided Mann-Whitney U test, FDR <0.25) were enriched in ME and DE groups, respectively. Both categories contained genes related to the GO term “tissue development” (Rank 2, p < 10−30, and Rank 2, p < 10−17, respectively), including genes such as Bmp7, Cdh2, Cxcr4, Fn1, Gata4, Gata6, Lhx1, and Tdgf1 (supplemental Table S6). In contrast, compared with Late EPI group, 149 and 16 genes were down-regulated in ME and DE groups (one-sided Mann-Whitney U test, FDR <0.25), respectively, both categories including genes such as Dnmt3a, Dnmt3b, L1td1, Pou3f1, and Utf1 (supplemental Table S6).
In addition, we found 10 genes enriched in ME cells compared with DE cells (Ccnd2, Cdh11, Gas1, Meis2, Mesp1, Mycn, Rbms1, Snai1, Wnt3, and Wnt5a), and 129 genes enriched in DE cells compared with ME cells (one-sided Mann-Whitney U test, FDR <0.25) (supplemental Table S6). Interestingly, “Wnt signaling pathway” was identified for genes enriched in the DE group compared with the ME group (Rank 14, p < 10−6), including Wnt receptor genes (Fzd5, Fzd6, and Fzd8) and genes involved in “negative regulation of Wnt signaling pathway” (Rank 28, p < 10−5, Cdh1, Cer1, Gsc, Sfrp1, Sfrp5, Shisa2, Six3, and Sox17) (supplemental Table S6 and Fig. 5A). In contrast, Wnt agonists Wnt3 and Wnt5a as well as Wnt downstream gene Ccnd2 were enriched in ME cells compared with DE cells (Fig. 5A). These results suggest that Wnt signaling might function in both autocrine and paracrine manners in DE and ME lineages. It will be interesting to test the function of these molecules during the segregation of DE and ME lineages.
Figure 5.

Differential expression of Wnt signaling genes in DE and ME cells and TF regulatory networks in E6.5_Late cells. A, differential expression of Wnt signaling genes in ME and DE cells. B, hierarchical clustering by the CSI of differentially expressed TFs. The genes formed three module cliques (MC1–3). The names of TFs specific for the EPI, DE, and ME (higher than the other two lineages) are highlighted in red, purple, and deep green, respectively. The names of TFs enriched in both DE and ME (compared with EPI) are highlighted in light green. Three submodule cliques (sMC1–3) are also denoted. C, heatmaps display the expression of differentially expressed TFs. The upper panel is a heatmap showing the expression of each TF in each cell. Genes are arranged in the same sequence as in B. The lower panel is a heatmap showing the average expression values (after z-score normalization) of MC1-, MC2-, and MC3-TFs in each cell. The bars above the heatmap denote the embryo membership and lineage. Cells are arranged according to lineages and embryos, not hierarchically clustered. D, coexpression network of TFs based on CSI values (CSI >0.7). MC1, MC2, and MC3 genes are denoted by different colored nodes. Edge weights are proportional to the CSI values of two correlated nodes. Red lines indicate positive correlation, and green lines indicate negative correlation.
To characterize transcriptional regulation networks that might underlie the segregation of DE and ME lineages, unsupervised hierarchical clustering analysis was performed based on the Connection Specificity Index (CSI) (21, 47) of differentially expressed transcription factors (TFs, GO: 0003700) among Late EPI, DE, and ME lineages (supplemental Table S6). TFs formed three major module cliques (MC1–MC3, Fig. 5B), in which ME-, EPI-, and DE-specific TFs were enriched, respectively (Fig. 5C). There were also highly connected subclusters (sMC1–sMC3). Genes co-up-regulated in ME and DE cells (Lhx1, Gata6, and Mixl1) appeared in sMC1, whereas sMC2 included genes specific for ME cells (Mesp1, Snai1, Wnt5a, and Meis2), and sMC3 contained genes specific for EXEM cells (Hand1, Tbx3, Msx2, discussed below). Coexpression networks based on the expression correlation CSI recapitulated MC1–3 (Fig. 5D), suggesting that TFs of each group are systematically regulated. Because negative correlation often occurs between genes regulating alternative cellular states (21, 48), the negative correlation between TFs of MC3 and MC1 (Otx2/Zfp516, Otx2/Tbx3, Otx2/Hand1, Foxa2/Lef1, Aff1/Tbx3, and Aff1/Msx2) suggested that these TFs might account for the fate choice of DE and ME lineages. Mycn, which was expressed at a higher level in both Late EPI and ME cells than in DE cells (one sided Mann-Whitney U test, FDR <0.25), might also play a critical role in the segregation of DE and ME lineages, because it had negative correlations with several MC3 TFs (Sox17, Six3, Hhex, Prdm1, Foxa1, and Foxa2). Our finding would be of great help to deepen the understanding of lineage segregation of DE and ME in vivo.
It is important to understand the regulation of pluripotency-associated genes during the in vivo development process. Pluripotency-associated genes were selected from published studies (5, 49) and GO terms related to pluripotency (supplemental Table S6). Some pluripotency-associated genes also act as lineage specifiers having additional functions during early phases of germ layer specification and commitment, such as Sox2 (50), Tdgf1 (51, 52), and Tbx3 (53, 54). We performed CSI analyses on differentially expressed pluripotency-associated genes among Early EPI, Late EPI, DE, and ME lineages (Mann-Whitney U test, FDR <0.25) (supplemental Table S6 and Fig. S5, A–C). Three major module cliques (MC1–MC3) were identified, which contained genes enriched in Early EPI, E6.5_Late cells (including Late EPI, DE, and ME cells), and DE cells, respectively (supplemental Fig. S5B). Genes in a sub-module clique (sMC2) were highly connected and enriched in the Early EPI, including Fgf4, Med30, Paf1, Dppa4, Dppa5a, Gdf3, Dnmt3l, and Dppa2 (supplemental Fig. S5, A and B). Genes in another sub-module clique (sMC1) were enriched in both Early EPI and Late EPI, including Cdh1, Sox2, Dnmt3a, Dnmt3b, Utf1, L1td1, and Phc1 (supplemental Fig. S5, A and B). Hierarchical clustering revealed that the majority of cells from E5.5 and E6.5_Early embryos were in the same cluster, separating from cells of E6.5_Late embryos, using either differentially expressed genes (supplemental Fig. S5B) or all 249 pluripotency-associated genes as the input (data not shown), suggesting that cells from E6.5_Early embryos were more similar to cells from E5.5 embryos than to cells from E6.5_Late embryos. Coexpression networks on the basis of CSI revealed the connections among pluripotency-associated genes (supplemental Fig. S5C). In particular, we found that Mycn, which was negatively connected with several DE-specific genes (Fzd5, Sfrp1 and Kit), was closely related to Tet1. It has recently been reported that TET-mediated DNA demethylation regulates the expression of Lefty2 and is essential for the development of ME (55). The finding hints of a potential role of Mycn for the ME formation. It will be interesting to investigate how different modules or submodules are regulated during embryonic developmental processes.
Subpopulation of ME cells exhibits characteristics of the EXEM
We consistently noticed a positive correlation among genes Hand1, Tbx3, and Bmp4 when cells from E6.5_Late embryos were analyzed by PCA using the germ layer markers (supplemental Fig. S3, D and E). The analyses related to the expression correlation CSI of TFs also revealed that Tbx3, Hand1, and Msx2 formed a special cluster (sMC3 in Fig. 5B). To precisely illustrate such a pattern, we analyzed the cells on the two branches of diffusion map (DE, ME, and Other clusters in Fig. 4A, together called MEN cells, all from E6.5_Late embryos) by PCA using RNA-Seq data of the 822 markers as an input. As expected, DE and ME cells could be discriminated from PC2 to PC3 axes (Fig. 6A). Interestingly, genes such as Hand1, Tbx3, Bmp4, Msx2, Igf2, Krt18, Krt8, and Foxf1 were at the top end of the PC4 axis and were enriched in cells at the top end of PC4. In contrast, genes such as Tdgf1, Mixl1, Fgf8, Otx2, Dusp6, and Zic2 were at the bottom end of the PC4 axis and were down-regulated in cells at the top end of PC4 (Fig. 6, A and B). A recent study reported that the expression of Hand1, Bmp4, Tbx3, Msx2, Krt8, Krt18, and Foxf1 was higher and that the expression of Otx2, Tdgf1, Dusp6, Mixl1, Lefty2, and Lhx1 was lower in EXEM cells (known to arise from the posterior PS) compared with cells from the embryonic part of the ME in E7.0 and E7.5 mouse embryos (27). These results support the notion that the cells at the top end of PC4 should be EXEM cells. Gene Set Enrichment Analysis (GSEA) (55, 56) further revealed the similarities between the gene set down-regulated or up-regulated in E6.5_Late EXEM cells and the gene set down-regulated (Gene set 1, normalized enrichment score (NES) = 1.89, FDR = 0, Fig. 6C) or up-regulated (Gene set 2, NES = −2.18, FDR = 0, Fig. 6D) in E7.0/E7.5 EXEM cells (27), respectively.
Figure 6.

Identification of EXEM cells in E6. 5_Late embryos. A, the PCA of 75 identified MEN cells by 822 germ-layer markers. The projection components PC2-PC3-PC4 are displayed. The 75 cells were from the DE, ME, and Other clusters shown in Fig. 4A. Expression levels of the 822 germ-layer markers determined by RNA-Seq were used as the input. The left panel is PC projections of cells. Cells clustered at the top end of PC4 are marked by the light rose, denoting putative EXEM cells. The right panel is PC projection of genes. Some genes with extreme PC4 loadings are shown. B, expression patterns of representative genes overlaid on the PCA map. Cells at the top of the PC4 axis in A exhibit distinct gene expression patterns from the rest of MEN cells. C, GSEA reveals similarities between genes down-regulated in E6.5_Late EXEM cells and those down-regulated in E7.0 EXEM cells. Genes down-regulated in E7.0 EXEM cells as compared with the rest of E7.0 ME cells were obtained from the published data (27), designated as “Gene Set 1,” including 330 genes. The cells in A were divided into EXEM cells and the rest of MEN cells. All genes (the total number was 19,104) were ranked according to the correlation with the classification of the two groups. The lower portion of the left figure shows the rank-ordered genes for EXEM cells compared with the rest of MEN cells, with genes being highly down-regulated to the far left and up-regulated genes to the right. Each black line represents a hit from Gene Set 1 in the rank-ordered gene list. The upper part of the left panel shows the running enrichment score (RES), which was calculated by walking down the rank-ordered gene list, and increasing the score when a gene was met in the Gene Set 1 and decreasing it when it is not. The NES and the FDR, which reflect the correlations in GSEA, were calculated and exhibited in the bottom region. The right panel is a heatmap revealing the expression of 330 genes of Gene Set 1 in EXEM cells and the rest of MEN cells. Genes are ordered according to their ranks in the left panel, and cells are ordered according to their PC4 loadings in A. D, GSEA reveals similarities between genes up-regulated in E6.5_Late EXEM cells and those up-regulated in E7.0 EXEM cells. Genes up-regulated in E7.0 EXEM cells as compared with the rest of E7.0 ME cells were obtained from the published data (27), designated as “Gene Set 2,” including 84 genes. All genes (the total number was 19,104) were ranked and arranged in the same way as in C. Each black line represents a hit from the Gene Set 2 in the rank-ordered gene list. The RES, NES, and FDR values are shown. The right panel is a heatmap revealing the expression of 84 genes of Gene Set 2 in EXEM and the rest of MEN cells. Genes are ordered according to their ranks in the left panel, and cells are ordered according to their PC4 loadings in A.
To find genes that might underlie the divergence of the EXEM from embryonic MEN cells, we compared the expression of secreted molecules and TFs (GO: 0003700) between the cells at the top of the PC4 axis and the rest of MEN cells. Genes encoding secreted molecules such as Bmp2, Bmp4, Bmp5, Fgf2, Fgf10, Fgf15, Igf2, Igfbp4, Plac1, Tgfb1, Vegfb, and Vegfc and those encoding TFs such as Cdx2, Cdx4, Foxf1, Gata2, Hand1, Hand2, Msx1, Msx2, Pitx1, Smad6, Tbx3, and Tbx20 were all enriched in the cells at the top of the PC4 axis (one-sided Mann-Whitney U test, FDR <0.25), whereas genes encoding secreted molecules such as Fgf8, Igfbp2, Lefty2, and Tgfbr3 and genes encoding TFs such as Etv1, Eomes, Etv5, Hhex, Lhx1, Mesp2, Mixl1, Nanog, Otx1, Otx2, Sox2, Sox4, Sox7, T, Zic2, Zic3, and Zic5 were enriched in the rest of MEN cells (one-sided Mann-Whitney U test, FDR <0.25) (supplemental Table S7). These identified genes could play important roles in the generation of EXEM and embryonic MEN cells during early embryonic development.
Discussion
Here, we apply scRNA-Seq and high-throughput qRT-PCR approaches to investigate gene expression patterns in nearly 600 cells harvested from E5.5, E6.5_Early, and E6.5_Late mouse embryos. Our study provides rich single-cell gene expression data for visualizing the pluripotency and differentiation state of cells at the early post-implantation stages. The distinct groups of cells identified in this study (pre-MEN, DE, ME, and EXEM) are summarized in Fig. 7. Genes enriched in these groups should be important for corresponding developmental processes. The transcriptomes revealed here for single cells of both embryonic and extra-embryonic origins would enhance our understanding how different cell lineages are continuously specified and established after implantation.
Figure 7.
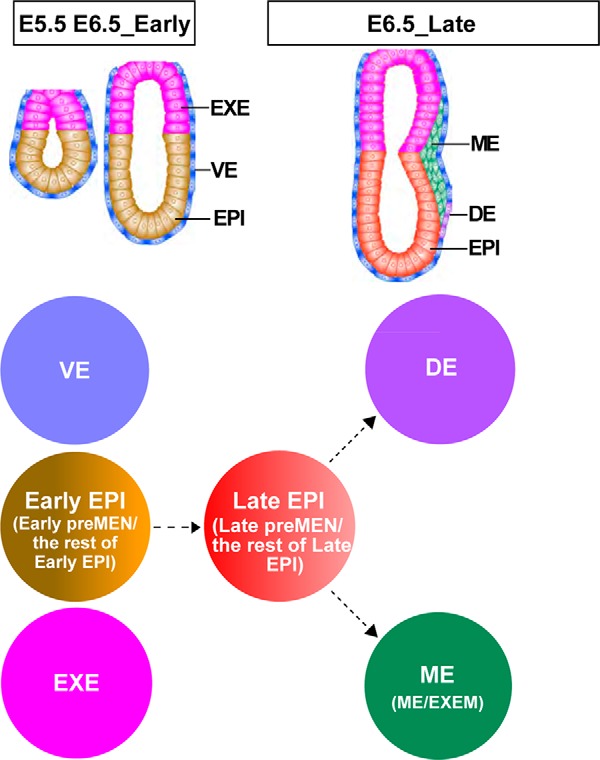
Schematic presentation of cell populations analyzed in this study. The distinct lineages are marked by different colors. The Early EPI are EPI cells from E5.5 and E6.5_Early embryos, containing Early pre-MEN and the rest of Early EPI; the Late EPI are EPI cells from E6.5_Late embryos, containing Late pre-MEN and the rest of Late EPI. The ME is also a mixed population, containing the EXEM and ME. Dashed lines are used to denote the putative relationship among different populations.
Our RNA-Seq data were mainly generated from Oct4+ embryonic cells. Analyses of these data reveal that the pluripotency and differentiation status of embryonic cells changed greatly around the gastrulation stage. Interestingly, we found that EPI cells from E6.5_Early embryos were more similar to those from E5.5 embryos than to those from E6.5_Late embryos (Fig. 3C and supplemental Fig. S5B). The EPI contains founder cells of all somatic lineages in amniotes. One of the key unsolved questions is when and how the MEN and NE are segregated. In E5.5 and E6.5_Early embryos, it was difficult to identify typical pre-MEN cells or pre-NE cells, because many MEN and NE markers are scattered in a broad range of cells (Fig. 2A). The expression of multiple kinds of pluripotency markers and coexpression of different categories of germ-layer markers in individual EPI cells would provide the molecular basis for the developmental plasticity of cells at the early stages. A previous study proposed that an initial phase of stochastic gene expression followed by signal reinforcement may drive lineage segregation through antagonistically separating a cohort of initially equivalent cells when PrE and EPI segregate within the inner cell mass of mouse blastocysts (4). Similar mechanisms might underlie the segregation of MEN and NE within the post-implantation EPI. However, the emergence of pre-MEN cells and DE and ME cells but not NE cells in our study suggests that the NE might form later than the MEN. This is consistent with the fact that signals secreted by the anterior MEN are essential for the induction of the NE (6). Pre-MEN cells had higher levels of Nodal, Wnt3, and Fgf8 ligands, which are all signaling molecules required for the generation of the MEN (6). Previous reports suggested that potential common MEN progenitors exist transiently that subsequently give rise to either DE or ME (57–61) and that Cdh1, Pdgfra, Gsc, and Foxa2 are the key markers for MEN progenitor cells in vitro (59). We found that these markers were coexpressed in a small subset of our pre-MEN cells (3 of 21 identified pre-MEN cells expressed 3 or 4 of these four markers). We consider that pre-MEN cells are more prone to differentiate into MEN cells than the rest of EPI cells. However, further experimental evidence is needed to verify this notion and to test whether signal enforcement is required for further differentiation of pre-MEN cells.
Our results indicate that ME and DE cells emerge around E6.5, when some ME markers and DE markers became significantly coexpressed in ME cells and DE cells, respectively. Using our RNA-seq data, we identified many genes specifically expressed in the DE and ME. These results are highly consistent with a previous in vitro result that Foxa2, Sox17, Cdh1, and Krt18 are selective markers for the DE, whereas Cad11 and Pdgfra are selective markers for the ME (supplemental Table S6) (59), providing the evidence for the reliability of our data. It is interesting that Wnt ligands (Wnt3 and Wnt5a) were up-regulated in ME cells, whereas Wnt receptors and some negative components of the Wnt pathway were enriched in DE cells (Fig. 5A). In mice, Wnt3 is necessary for the formation of the PS and emergence of the DE (62). Wnt signaling should be required for DE induction and maintenance, because conditional loss of β-catenin in MEN cells results in the production of ectopic cardiac mesoderm at the expense of the DE (63) and conditional deletion of β-catenin in DE and VE results in the loss of Sox17 expression (64), which is necessary for the segregation of the gut endoderm from the ME (65). Enriched expression of Wnt ligands in ME cells might offer a paracrine mechanism for the induction of DE formation, whereas expression of negative components of the Wnt pathway in DE could be a feedback strategy to confine the signal at a balanced level. Our work provides systematic and novel insights into how the segregation of ME and DE is regulated in terms of both transcriptional networks and signaling cross-talk.
Most of the DE and ME cells coexpressed Oct4 and Gata6, indicating important roles of Oct4 and Gata6 in the MEN development. It was reported that the Gata6 transcript was detected in the ME and DE in wild-type mice (35, 44). However, chimeric experiments showed that Gata6−/− cells contributed effectively to the heart and gut. It is possible that Gata4 or other members of the Gata family could compensate for the absence of Gata6 in the MEN development. Noticeably, some Oct4+Gata6− cells clustered with Oct4+Gata6+ cells and also acquired ME- or DE-related characteristics in E6.5_Late embryos (supplemental Fig. S3, A and B), suggesting that Gata6 might not be the earliest marker of cells on the differentiation path. Nevertheless, our finding is consistent with the importance of Oct4 in cells of the PS region (43, 66).
Recently, two groups reported their single-cell transcriptomic analyses of mouse early post-implantation embryos (21, 27, 29). However, characteristics of the pre-MEN cells and the divergence between ME and DE cells were not included in these studies. We analyzed those two datasets using our methods to check whether they could validate our finding in terms of pre-MEN, DE, and ME cells (supplemental Fig. S6). The 481 E6.5 embryonic cells in Scialdone's dataset (27) were from seven embryos, which possibly contained both E6.5_Early and E6.5_Late embryos. They all expressed high levels of Oct4 (RPKM >5.88), in contrast to their 20 EXE or VE cells, which expressed low levels of Oct4 (RPKM between 0 and 3.39). 29 of their embryonic cells clustered with our ME cells in the diffusion map using expression of the 90 germ-layer markers as an input (supplemental Fig. S6A). Their embryonic cells contained 13 Oct4+Gata6+ cells in total, of which 10 cells were in the ME cluster. Therefore, their data support the notion that most of the Oct4+Gata6+ cells are MEN cells from the PS region. The rest of cells (452/481) clustered with our EPI cells. The pre-MEN cells could be identified from 452 cells in the EPI cluster, although Early pre-MEN cells from E6.5_Early embryos and Late pre-MEN cells from E6.5_Late embryos could not be distinguished (supplemental Fig. S6B). Genes enriched in DE or ME cells, including 5730457N03Rik, Amot, Ccnd2, Cdh11, Eomes, Evx1, Fgf8, Foxa2, Frzb, Gsc, Prtg, T, Tdgf1, Tgfbr3, and Wnt3, were up-regulated, and genes such as Dusp4, Epcam, Fgf4, Igfbp2, Krt18, Phc1, Sox3, Uchl1, and Utf1 were down-regulated, in both Scialdone's (27) pre-MEN cells and our pre-MEN cells (Mann-Kendall tests over PC2, FDR <0.1) (supplemental Table S3). None of the Scialdone et al. (27) cells were similar to our DE cells (supplemental Fig. S6A). In another study by Nakamura et al. (29), 16 cells from E5.5 embryos and 18 cells from E6.5 embryos were sequenced and analyzed. Diffusion map analysis showed that some of Nakamura's embryonic cells (all expressing T) were also similar to our ME cells, although the size of their samples was small, and no cells were similar to our DE cells (supplemental Fig. S6C). In addition, two published studies (21, 27) analyzed genes and signals involved in the anterior-posterior regionalization in the PS of E7.0 and E7.5 embryos. Our study extends this issue to an earlier stage (E6.5) and uncovers more aspects of signals and transcription factors that may govern the segregation of EXEM cells and embryonic ME cells. Finally, we examined whether EXEM cells could be identified from the Scialdone et al. (27) or the Nakamura et al. (29) E6.5 ME cells. Our analysis showed that no EXEM cells were identified from the Scialdone et al. (27) dataset (supplemental Fig. S6D), whereas one cell from the Nakamura et al. (29) dataset was close to the EXEM cluster we identified (supplemental Fig. S6E). The lack of DE and EXEM cells in these two datasets might be due to technical reasons, especially in the manner to dissociate embryonic cells. It is also possibly caused by the mouse strain difference or stage difference.
Collectively, our large scale single-cell gene expression analysis of early post-implantation mouse embryos should be valuable for understanding the pluripotency and differentiation states of cells at this particular developmental window. Our identification of specific groups with characteristic gene expression patterns of pre-MEN, ME, DE, and EXEM cells is significant for understanding how the early somatic lineages are initiated. The in-depth analysis of these data would reveal further insights into the mammalian development and help to develop efficient strategies to differentiate pluripotent stem cells into regenerative medicine-relevant cells.
Experimental procedures
Embryo collection and single cell isolation
Surgical procedures were performed in compliance with protocols approved by the Animal Committee of the Institution of Health Sciences. Embryos of the C57BL/6 strain were collected at E5.5 and E6.5 (noon of the day when the vaginal plug was detected was designated as E0.5) in M15 medium. One single embryo was used at a time, which was incubated in EGTA/PBS and then treated by trypsin. The PE and EPC were easily removed, and the remaining embryo was transferred into DMEM with 10% FBS before dissociating into single-cell suspension. The single cells were transferred into a lysate buffer by a glass pipette assembled on a micromanipulator. The embryos used are listed in supplemental Table S4.
Preparation of single-cell cDNAs
For cells from E5.5 and E6.5_Early embryos (I–VI), and cells from embryos E6.5_Late (IX) and E6.5_Late (X), cDNAs were prepared according to previous methods (67, 68). Briefly, oligo(dT) primers, which were complementary to poly(A) tails of mRNAs, were incorporated into the 5′-end of the first-strand cDNAs during the reverse transcription step. Then a poly(A) tail was added to the 3′-end of the first-strand cDNAs by terminal deoxynucleotidyltransferase. After the second strands were synthesized, cDNAs were amplified by 20 + 12 cycles of PCR. For cells from embryos E6.5_Late (VII) and E6.5_Late (VIII), mRNAs were reverse-transcribed by SMARTScribeTM reverse transcriptase and then directly amplified by 18 + 12 cycles. To find genes differentially expressed among Early EPI, Late EPI, DE, and ME groups, cells from embryos VII/VIII were considered as one batch, and cells from embryo X were considered as the other batch, and the two batches of EPI, DE, and ME cells were compared separately. The common differentially expressed genes were obtained.
Single-cell qRT-PCR or high-throughput qRT-PCR
Amplified cDNAs without purification from single cells were equally diluted (1:10) and combined with the TaqMan Universal PCR Master Mix, primers, and probes and examined either by qRT-PCR in 384-plates on 7900HT PCR System (ABI) or by high-throughput qRT-PCR in 96.96 Dynamic Arrays on BioMark System (Fluidigm). Ct values were calculated by the system software. Sequences of TaqMan probes and corresponding primers are shown in supplemental Experimental procedures.
Single-cell RNA-seq and data processing
The samples were purified either by gel electrophoresis or Agencourt AMPure XP beads and subsequently sequenced by single-end sequencing at 50 bp length on the Illumina Hiseq2000 or Hiseq2500 platform. Reads that contained poly(A), low quality, and adapters were pre-filtered before mapping. The remaining reads were mapped to the mm10 genome. Base calls were performed using CASAVA version 1.7, and sequences were aligned with tophat 2.0. After mapping, only unique reads that mapped to a single locus of the genome were used for downstream analyses. Only samples with unique reads of >0.5 million were used. Cufflinks 2.2.1 was used for calling RPKM values.
Genes that were detected (RPKM >0.01) in at least one cell were kept. During purification, transcripts with a length >500 bp were recovered to reduce the contamination of short primer polymers. Accordingly, we removed the transcripts shorter than 500 bp from the gene list.
PCA, diffusion map analysis, GO analysis, GSEA, and hierarchical clustering analyses were achieved on the R platform. PCA and diffusion map analyses are both feature-extraction methods, which are frequently used in single-cell studies (2, 26, 28, 29). Mann-Whitney U test and Mann-Kendall tests were also performed on the R platform. Multiple test correction was performed to adjust p values using the Benjamini-Hochberg method.
The pairwise expression Pearson correlation coefficient (PCC) of TFs or pluripotency genes was used to calculate CSI scores (21, 47). Hierarchical clustering was performed based on the CSI scores. Next, the CSI coexpression network was constructed based on CSI scores. We also added the edges with negative PCC, where corresponding CSI scores were calculated based on the absolute pairwise PCC.
Immunostaining and image acquisition
E6.5 embryos were fixed in 4% paraformaldehyde overnight and immunostained according to previous methods (69) with some modifications (supplemental Experimental procedures). Primary antibodies used are as follows: anti-OCT4 (1:250, N124) (70) and anti-GATA6 (1:100, R&D Systems AF1700). Secondary antibodies used were as follows: Cy3-conjugated donkey anti-rabbit IgG (1:200, Jackson ImmunoResearch, catalog no. 711-165-152) and Alexa Fluor 647-conjugated donkey anti-goat IgG (1:500, Life Technologies, Inc., catalog no. A-21447).
Confocal images were acquired using a Zeiss LSM 880 NLO laser-scanning microscope as z-stacks of xy images taken at 5-μm z-intervals (×20). Raw data were processed using the Image Pro-Plus software.
Availability of data and materials
The RNA-Seq data set supporting results of this article is available in the GEO database (www.ncbi.nlm.nih.gov), GSE70713.
Author contributions
J. W. and Y. J. designed the study and interpreted data; J. W., Y. Z., and Y. J. wrote the manuscript; J. W., Z. F., J. G., L. G., F. T., J. H., Y. C., and J. W. performed the experiments; Y. Z., Z. Q., K. Z., S. L., and Y. S. performed the bioinformatic analyses and interpreted the data. All authors read and approved the final manuscript.
Supplementary Material
This work was supported by Ministry of Science and Technology of China Grants 2016YFA0100101, 2013CB966801, and 2013CB967101 and Chinese Academy of Science Grants XDB19020103 and XDA01010102. The authors declare that they have no conflicts of interest with the contents of this article.
This article contains supplemental Tables S1–S7, Figs. S1–S6, Experimental procedures, and additional references.
This article was selected as one of our Editors' Picks.
The RNA-Seq data set supporting results of this article is available in the GEO database under accession number GSE70713.
- EPI
- epiblast
- DE
- definitive endoderm
- TE
- trophectoderm
- PrE
- primitive endoderm
- PE
- parietal endoderm
- VE
- visceral endoderm
- E
- embryonic day
- EPC
- ectoplacental cone
- EXE
- extra-embryonic ectoderm
- AVE
- anterior visceral endoderm
- PS
- primitive streak
- NE
- neuroectoderm
- ME
- mesoderm
- EMEM
- extraembryonic mesoderm
- qRT
- quantitative RT
- PCA
- principal component analysis
- MEN
- mesendoderm
- scRNA-Seq
- single-cell RNA sequencing
- FDR
- false discovery rate
- TF
- transcription factor
- CSI
- Connection Specificity Index
- NES
- normalized enrichment score
- GSEA
- gene set enrichment analysis
- RPKM
- reads per kilobase per million mapped reads
- PCC
- Pearson correlation coefficient
- PC
- principal component.
References
- 1. Tam P. P., and Loebel D. A. (2007) Gene function in mouse embryogenesis: get set for gastrulation. Nat. Rev. Genet. 8, 368–381 [DOI] [PubMed] [Google Scholar]
- 2. Guo G., Huss M., Tong G. Q., Wang C., Li Sun L., Clarke N. D., and Robson P. (2010) Resolution of cell fate decisions revealed by single-cell gene expression analysis from zygote to blastocyst. Dev. Cell 18, 675–685 [DOI] [PubMed] [Google Scholar]
- 3. Yan L., Yang M., Guo H., Yang L., Wu J., Li R., Liu P., Lian Y., Zheng X., Yan J., Huang J., Li M., Wu X., Wen L., Lao K., et al. (2013) Single-cell RNA-Seq profiling of human preimplantation embryos and embryonic stem cells. Nat. Struct. Mol. Biol. 20, 1131–1139 [DOI] [PubMed] [Google Scholar]
- 4. Ohnishi Y., Huber W., Tsumura A., Kang M., Xenopoulos P., Kurimoto K., Oleś A. K., Araúzo-Bravo M. J., Saitou M., Hadjantonakis A. K., and Hiiragi T. (2014) Cell-to-cell expression variability followed by signal reinforcement progressively segregates early mouse lineages. Nat. Cell Biol. 16, 27–37 [DOI] [PMC free article] [PubMed] [Google Scholar]
- 5. Boroviak T., Loos R., Lombard P., Okahara J., Behr R., Sasaki E., Nichols J., Smith A., and Bertone P. (2015) Lineage-specific profiling delineates the emergence and progression of naive pluripotency in mammalian embryogenesis. Dev. Cell 35, 366–382 [DOI] [PMC free article] [PubMed] [Google Scholar]
- 6. Arnold S. J., and Robertson E. J. (2009) Making a commitment: cell lineage allocation and axis patterning in the early mouse embryo. Nat. Rev. Mol. Cell Biol. 10, 91–103 [DOI] [PubMed] [Google Scholar]
- 7. Pfister S., Steiner K. A., and Tam P. P. (2007) Gene expression pattern and progression of embryogenesis in the immediate post-implantation period of mouse development. Gene Expr. Patterns 7, 558–573 [DOI] [PubMed] [Google Scholar]
- 8. Posfai E., Tam O. H., and Rossant J. (2014) Mechanisms of pluripotency in vivo and in vitro. Curr. Top. Dev. Biol. 107, 1–37 [DOI] [PubMed] [Google Scholar]
- 9. Takaoka K., and Hamada H. (2012) Cell fate decisions and axis determination in the early mouse embryo. Development 139, 3–14 [DOI] [PubMed] [Google Scholar]
- 10. Lu C. C., Brennan J., and Robertson E. J. (2001) From fertilization to gastrulation: axis formation in the mouse embryo. Curr. Opin. Genet. Dev. 11, 384–392 [DOI] [PubMed] [Google Scholar]
- 11. Lawson K. A. (1999) Fate mapping the mouse embryo. Int. J. Dev. Biol. 43, 773–775 [PubMed] [Google Scholar]
- 12. Li L., Liu C., Biechele S., Zhu Q., Song L., Lanner F., Jing N., and Rossant J. (2013) Location of transient ectodermal progenitor potential in mouse development. Development 140, 4533–4543 [DOI] [PubMed] [Google Scholar]
- 13. Tam P. P., and Zhou S. X. (1996) The allocation of epiblast cells to ectodermal and germ-line lineages is influenced by the position of the cells in the gastrulating mouse embryo. Dev. Biol. 178, 124–132 [DOI] [PubMed] [Google Scholar]
- 14. Tsakiridis A., Huang Y., Blin G., Skylaki S., Wymeersch F., Osorno R., Economou C., Karagianni E., Zhao S., Lowell S., and Wilson V. (2015) Distinct Wnt-driven primitive streak-like populations reflect in vivo lineage precursors. Development 142, 809–809 [DOI] [PMC free article] [PubMed] [Google Scholar]
- 15. Mitiku N., and Baker J. C. (2007) Genomic analysis of gastrulation and organogenesis in the mouse. Dev. Cell 13, 897–907 [DOI] [PubMed] [Google Scholar]
- 16. Rivera-Pérez J. A., and Magnuson T. (2005) Primitive streak formation in mice is preceded by localized activation of Brachyury and Wnt3. Dev. Biol. 288, 363–371 [DOI] [PubMed] [Google Scholar]
- 17. Robertson E. J., Norris D. P., Brennan J., and Bikoff E. K. (2003) Control of early anterior-posterior patterning in the mouse embryo by TGF-β signalling. Philos. Trans. R. Soc. Lond. B Biol. Sci. 358, 1351–1358 [DOI] [PMC free article] [PubMed] [Google Scholar]
- 18. Tam P. P., Loebel D. A., and Tanaka S. S. (2006) Building the mouse gastrula: signals, asymmetry and lineages. Curr. Opin. Genet. Dev. 16, 419–425 [DOI] [PubMed] [Google Scholar]
- 19. Gonçalves L., Filipe M., Marques S., Salgueiro A. M., Becker J. D., and Belo J. A. (2011) Identification and functional analysis of novel genes expressed in the anterior visceral endoderm. Int. J. Dev. Biol. 55, 281–295 [DOI] [PubMed] [Google Scholar]
- 20. Frankenberg S., Smith L., Greenfield A., and Zernicka-Goetz M. (2007) Novel gene expression patterns along the proximo-distal axis of the mouse embryo before gastrulation. BMC Dev. Biol. 7, 8. [DOI] [PMC free article] [PubMed] [Google Scholar]
- 21. Peng G., Suo S., Chen J., Chen W., Liu C., Yu F., Wang R., Chen S., Sun N., Cui G., Song L., Tam P. P., Han J. D., and Jing N. (2016) Spatial transcriptome for the molecular annotation of lineage fates and cell identity in mid-gastrula mouse embryo. Dev. Cell 36, 681–697 [DOI] [PubMed] [Google Scholar]
- 22. Tang F., Barbacioru C., Bao S., Lee C., Nordman E., Wang X., Lao K., and Surani M. A. (2010) Tracing the derivation of embryonic stem cells from the inner cell mass by single-cell RNA-seq analysis. Cell Stem Cell 6, 468–478 [DOI] [PMC free article] [PubMed] [Google Scholar]
- 23. Xue Z., Huang K., Cai C., Cai L., Jiang C. Y., Feng Y., Liu Z., Zeng Q., Cheng L., Sun Y. E., Liu J. Y., Horvath S., and Fan G. (2013) Genetic programs in human and mouse early embryos revealed by single-cell RNA sequencing. Nature 500, 593–597 [DOI] [PMC free article] [PubMed] [Google Scholar]
- 24. Boroviak T., Loos R., Bertone P., Smith A., and Nichols J. (2014) The ability of inner-cell-mass cells to self-renew as embryonic stem cells is acquired following epiblast specification. Nat. Cell Biol. 16, 516–528 [DOI] [PMC free article] [PubMed] [Google Scholar]
- 25. Kolodziejczyk A. A., Kim J. K., Tsang J. C., Ilicic T., Henriksson J., Natarajan K. N., Tuck A. C., Gao X., Bühler M., Liu P., Marioni J. C., and Teichmann S. A. (2015) Single cell RNA-sequencing of pluripotent states unlocks modular transcriptional variation. Cell Stem Cell 17, 471–485 [DOI] [PMC free article] [PubMed] [Google Scholar]
- 26. Petropoulos S., Edsgärd D., Reinius B., Deng Q., Panula S. P., Codeluppi S., Plaza Reyes A., Linnarsson S., Sandberg R., and Lanner F. (2016) Single-cell RNA-seq reveals lineage and X chromosome dynamics in human preimplantation embryos. Cell 165, 1012–1026 [DOI] [PMC free article] [PubMed] [Google Scholar]
- 27. Scialdone A., Tanaka Y., Jawaid W., Moignard V., Wilson N. K., Macaulay I. C., Marioni J. C., and Göttgens B. (2016) Resolving early mesoderm diversification through single-cell expression profiling. Nature 535, 289–293 [DOI] [PMC free article] [PubMed] [Google Scholar]
- 28. Moignard V., Woodhouse S., Haghverdi L., Lilly A. J., Tanaka Y., Wilkinson A. C., Buettner F., Macaulay I. C., Jawaid W., Diamanti E., Nishikawa S., Piterman N., Kouskoff V., Theis F. J., Fisher J., and Göttgens B. (2015) Decoding the regulatory network of early blood development from single-cell gene expression measurements. Nat. Biotechnol. 33, 269–276 [DOI] [PMC free article] [PubMed] [Google Scholar]
- 29. Nakamura T., Okamoto I., Sasaki K., Yabuta Y., Iwatani C., Tsuchiya H., Seita Y., Nakamura S., Yamamoto T., and Saitou M. (2016) A developmental coordinate of pluripotency among mice, monkeys and humans. Nature 537, 57–62 [DOI] [PubMed] [Google Scholar]
- 30. Brons I. G., Smithers L. E., Trotter M. W., Rugg-Gunn P., Sun B., Chuva de Sousa Lopes S. M., Howlett S. K., Clarkson A., Ahrlund-Richter L., Pedersen R. A., and Vallier L. (2007) Derivation of pluripotent epiblast stem cells from mammalian embryos. Nature 448, 191–195 [DOI] [PubMed] [Google Scholar]
- 31. Hart A. H., Hartley L., Ibrahim M., and Robb L. (2004) Identification, cloning and expression analysis of the pluripotency promoting Nanog genes in mouse and human. Dev. Dyn. 230, 187–198 [DOI] [PubMed] [Google Scholar]
- 32. Schöler H. R., Dressler G. R., Balling R., Rohdewohld H., and Gruss P. (1990) Oct-4: a germline-specific transcription factor mapping to the mouse T-complex. EMBO J. 9, 2185–2195 [DOI] [PMC free article] [PubMed] [Google Scholar]
- 33. Gu P., Goodwin B., Chung A. C., Xu X., Wheeler D. A., Price R. R., Galardi C., Peng L., Latour A. M., Koller B. H., Gossen J., Kliewer S. A., and Cooney A. J. (2005) Orphan nuclear receptor LRH-1 is required to maintain Oct4 expression at the epiblast stage of embryonic development. Mol. Cell. Biol. 25, 3492–3505 [DOI] [PMC free article] [PubMed] [Google Scholar]
- 34. Kopper O., Giladi O., Golan-Lev T., and Benvenisty N. (2010) Characterization of gastrulation-stage progenitor cells and their inhibitory crosstalk in human embryoid bodies. Stem Cells 28, 75–83 [DOI] [PubMed] [Google Scholar]
- 35. Morrisey E. E., Ip H. S., Lu M. M., and Parmacek M. S. (1996) GATA-6: a zinc finger transcription factor that is expressed in multiple cell lineages derived from lateral mesoderm. Dev. Biol. 177, 309–322 [DOI] [PubMed] [Google Scholar]
- 36. Wallingford M. C., Angelo J. R., and Mager J. (2013) Morphogenetic analysis of peri-implantation development. Dev. Dyn. 242, 1110–1120 [DOI] [PubMed] [Google Scholar]
- 37. Nowotschin S., Xenopoulos P., Schrode N., and Hadjantonakis A. K. (2013) A bright single-cell resolution live imaging reporter of Notch signaling in the mouse. BMC Dev. Biol. 13, 15. [DOI] [PMC free article] [PubMed] [Google Scholar]
- 38. Cserjesi P., Brown D., Lyons G. E., and Olson E. N. (1995) Expression of the novel basic helix-loop-helix gene eHAND in neural crest derivatives and extraembryonic membranes during mouse development. Dev. Biol. 170, 664–678 [DOI] [PubMed] [Google Scholar]
- 39. Barnes R. M., Firulli B. A., VanDusen N. J., Morikawa Y., Conway S. J., Cserjesi P., Vincentz J. W., and Firulli A. B. (2011) Hand2 loss-of-function in hand1-expressing cells reveals distinct roles in epicardial and coronary vessel development. Circ. Res. 108, 940–949 [DOI] [PMC free article] [PubMed] [Google Scholar]
- 40. Snow M. H. (1977) Gastrulation in the mouse: Growth and regionalization of the epiblast. J. Embryol. Exp. Morphol. 42, 293–303 [Google Scholar]
- 41. Mallamaci A., Di Blas E., Briata P., Boncinelli E., and Corte G. (1996) OTX2 homeoprotein in the developing central nervous system and migratory cells of the olfactory area. Mech. Dev. 58, 165–178 [DOI] [PubMed] [Google Scholar]
- 42. Wood H. B., and Episkopou V. (1999) Comparative expression of the mouse Sox1, Sox2 and Sox3 genes from pre-gastrulation to early somite stages. Mech. Dev. 86, 197–201 [DOI] [PubMed] [Google Scholar]
- 43. DeVeale B., Brokhman I., Mohseni P., Babak T., Yoon C., Lin A., Onishi K., Tomilin A., Pevny L., Zandstra P. W., Nagy A., and van der Kooy D. (2013) Oct4 is required similar to E7.5 for proliferation in the primitive streak. PLoS Genet. 9, e1003957. [DOI] [PMC free article] [PubMed] [Google Scholar]
- 44. Koutsourakis M., Langeveld A., Patient R., Beddington R., and Grosveld F. (1999) The transcription factor GATA6 is essential for early extraembryonic development. Development 126, 723–732 [PubMed] [Google Scholar]
- 45. Chng Z., Teo A., Pedersen R. A., and Vallier L. (2010) SIP1 mediates cell-fate decisions between neuroectoderm and mesendoderm in human pluripotent stem cells. Cell Stem Cell 6, 59–70 [DOI] [PubMed] [Google Scholar]
- 46. Pankratz M. T., Li X. J., Lavaute T. M., Lyons E. A., Chen X., and Zhang S. C. (2007) Directed neural differentiation of human embryonic stem cells via an obligated primitive anterior stage. Stem Cells 25, 1511–1520 [DOI] [PMC free article] [PubMed] [Google Scholar]
- 47. Fuxman Bass J. I., Diallo A., Nelson J., Soto J. M., Myers C. L., and Walhout A. J. (2013) Using networks to measure similarity between genes: association index selection. Nat. Methods 10, 1169–1176 [DOI] [PMC free article] [PubMed] [Google Scholar]
- 48. Xue H., Xian B., Dong D., Xia K., Zhu S., Zhang Z., Hou L., Zhang Q., Zhang Y., and Han J. D. (2007) A modular network model of aging. Mol. Syst. Biol. 3, 147. [DOI] [PMC free article] [PubMed] [Google Scholar]
- 49. Zhao W., Ji X., Zhang F., Li L., and Ma L. (2012) Embryonic stem cell markers. Molecules 17, 6196–6236 [DOI] [PMC free article] [PubMed] [Google Scholar]
- 50. Zhou C., Yang X., Sun Y., Yu H., Zhang Y., and Jin Y. (2016) Comprehensive profiling reveals mechanisms of SOX2-mediated cell fate specification in human ESCs and NPCs. Cell Res. 26, 171–189 [DOI] [PMC free article] [PubMed] [Google Scholar]
- 51. Fiorenzano A., Pascale E., D'Aniello C., Acampora D., Bassalert C., Russo F., Andolfi G., Biffoni M., Francescangeli F., Zeuner A., Angelini C., Chazaud C., Patriarca E. J., Fico A., and Minchiotti G. (2016) Cripto is essential to capture mouse epiblast stem cell and human embryonic stem cell pluripotency. Nat. Commun. 7, 12589. [DOI] [PMC free article] [PubMed] [Google Scholar]
- 52. Jin J. Z., and Ding J. (2013) Cripto is required for mesoderm and endoderm cell allocation during mouse gastrulation. Dev. Biol. 381, 170–178 [DOI] [PMC free article] [PubMed] [Google Scholar]
- 53. Weidgang C. E., Russell R., Tata P. R., Kühl S. J., Illing A., Müller M., Lin Q., Brunner C., Boeckers T. M., Bauer K., Kartikasari A. E., Guo Y., Radenz M., Bernemann C., Weiss M., et al. (2013) TBX3 directs cell-fate decision toward mesendoderm. Stem Cell Reports 1, 248–265 [DOI] [PMC free article] [PubMed] [Google Scholar]
- 54. Niwa H., Ogawa K., Shimosato D., and Adachi K. (2009) A parallel circuit of LIF signalling pathways maintains pluripotency of mouse ES cells. Nature 460, 118–122 [DOI] [PubMed] [Google Scholar]
- 55. Subramanian A., Tamayo P., Mootha V. K., Mukherjee S., Ebert B. L., Gillette M. A., Paulovich A., Pomeroy S. L., Golub T. R., Lander E. S., and Mesirov J. P. (2005) Gene set enrichment analysis: a knowledge-based approach for interpreting genome-wide expression profiles. Proc. Natl. Acad. Sci. U.S.A. 102, 15545–15550 [DOI] [PMC free article] [PubMed] [Google Scholar]
- 56. Subramanian A., Kuehn H., Gould J., Tamayo P., and Mesirov J. P. (2007) GSEA-P: a desktop application for gene set enrichment analysis. Bioinformatics 23, 3251–3253 [DOI] [PubMed] [Google Scholar]
- 57. Moody S. A. (ed) (2014) in Principles of Developmental Genetics, pp. 245, Academic Press, New York [Google Scholar]
- 58. Zorn A. M., and Wells J. M. (2009) Vertebrate endoderm development and organ formation. Annu. Rev. Cell Dev. Biol. 25, 221–251 [DOI] [PMC free article] [PubMed] [Google Scholar]
- 59. Tada S., Era T., Furusawa C., Sakurai H., Nishikawa S., Kinoshita M., Nakao K., Chiba T., and Nishikawa S. (2005) Characterization of mesendoderm: a diverging point of the definitive endoderm and mesoderm in embryonic stem cell differentiation culture. Development 132, 4363–4374 [DOI] [PubMed] [Google Scholar]
- 60. Lawson K. A., Meneses J. J., and Pedersen R. A. (1991) Clonal analysis of epiblast fate during germ layer formation in the mouse embryo. Development 113, 891–911 [DOI] [PubMed] [Google Scholar]
- 61. Kinder S. J., Tsang T. E., Wakamiya M., Sasaki H., Behringer R. R., Nagy A., and Tam P. P. (2001) The organizer of the mouse gastrula is composed of a dynamic population of progenitor cells for the axial mesoderm. Development 128, 3623–3634 [DOI] [PubMed] [Google Scholar]
- 62. Liu P., Wakamiya M., Shea M. J., Albrecht U., Behringer R. R., and Bradley A. (1999) Requirement for Wnt3 in vertebrate axis formation. Nat. Genet. 22, 361–365 [DOI] [PubMed] [Google Scholar]
- 63. Lickert H., Kutsch S., Kanzler B., Tamai Y., Taketo M. M., and Kemler R. (2002) Formation of multiple hearts in mice following deletion of β-catenin in the embryonic endoderm. Dev. Cell 3, 171–181 [DOI] [PubMed] [Google Scholar]
- 64. Engert S., Burtscher I., Liao W. P., Dulev S., Schotta G., and Lickert H. (2013) Wnt/β-catenin signalling regulates Sox17 expression and is essential for organizer and endoderm formation in the mouse. Development 140, 3128–3138 [DOI] [PubMed] [Google Scholar]
- 65. Viotti M., Nowotschin S., and Hadjantonakis A. K. (2014) SOX17 links gut endoderm morphogenesis and germ layer segregation. Nat. Cell Biol. 16, 1146–1156 [DOI] [PMC free article] [PubMed] [Google Scholar]
- 66. Funa N. S., Schachter K. A., Lerdrup M., Ekberg J., Hess K., Dietrich N., Honoré C., Hansen K., and Semb H. (2015) β-Catenin regulates primitive streak induction through collaborative interactions with SMAD2/SMAD3 and OCT4. Cell Stem Cell 16, 639–652 [DOI] [PubMed] [Google Scholar]
- 67. Tang F., Barbacioru C., Wang Y., Nordman E., Lee C., Xu N., Wang X., Bodeau J., Tuch B. B., Siddiqui A., Lao K., and Surani M. A. (2009) mRNA-seq whole-transcriptome analysis of a single cell. Nat. Methods 6, 377–382 [DOI] [PubMed] [Google Scholar]
- 68. Luo Y., Coskun V., Liang A., Yu J., Cheng L., Ge W., Shi Z., Zhang K., Li C., Cui Y., Lin H., Luo D., Wang J., Lin C., Dai Z., et al. (2015) Single-cell transcriptome analyses reveal signals to activate dormant neural stem cells. Cell 161, 1175–1186 [DOI] [PMC free article] [PubMed] [Google Scholar]
- 69. Renier N., Wu Z., Simon D. J., Yang J., Ariel P., and Tessier-Lavigne M. (2014) iDISCO: a simple, rapid method to immunolabel large tissue samples for volume imaging. Cell 159, 896–910 [DOI] [PubMed] [Google Scholar]
- 70. Liao B., and Jin Y. (2010) Wwp2 mediates Oct4 ubiquitination and its own auto-ubiquitination in a dosage-dependent manner. Cell Res. 20, 332–344 [DOI] [PubMed] [Google Scholar]
Associated Data
This section collects any data citations, data availability statements, or supplementary materials included in this article.
Supplementary Materials
Data Availability Statement
The RNA-Seq data set supporting results of this article is available in the GEO database (www.ncbi.nlm.nih.gov), GSE70713.