Significance
Trial-and-error learning requires variation in successive trials, but the source of such variability is unknown. We describe a unique striatal glutamatergic neuron in the zebra finch. This neuron exerts a potent, dopamine-regulated action on pallidal output neurons that modifies neuronal firing statistics in the circuit known to contribute to vocal variability. A simple model reveals how this microcircuit could be influenced by social context and striatal dopamine to switch between firing patterns that modify song variability essential for vocal learning.
Keywords: songbird, learning, variability, basal ganglia, dopamine
Abstract
Learning and maintenance of skilled movements require exploration of motor space and selection of appropriate actions. Vocal learning and social context-dependent plasticity in songbirds depend on a basal ganglia circuit, which actively generates vocal variability. Dopamine in the basal ganglia reduces trial-to-trial neural variability when the bird engages in courtship song. Here, we present evidence for a unique, tonically active, excitatory interneuron in the songbird basal ganglia that makes strong synaptic connections onto output pallidal neurons, often linked in time with inhibitory events. Dopamine receptor activity modulates the coupling of these excitatory and inhibitory events in vitro, which results in a dynamic change in the synchrony of a modeled population of basal ganglia output neurons receiving excitatory and inhibitory inputs. The excitatory interneuron thus serves as one biophysical mechanism for the introduction or modulation of neural variability in this circuit.
The basal ganglia are implicated in the acquisition, initiation, and selection of motor acts (1, 2). Striatal dopamine plays a critical role in regulating these processes (3–5), but little is known about how dopamine modulates basal ganglia microcircuitry to change behavior.
Song, used by male songbirds for territory defense and mate selection, is learned through trial and error. Songbirds possess discrete forebrain nuclei whose roles in song learning and production have been partially mapped (Fig. 1A) (6). Due to this relatively well-characterized functional anatomy, the birdsong learning circuit has been a rich testing ground for the development of biologically plausible models of skill learning (7–10). The model of reinforcement learning establishes an important role for variability in learning. Although, following crystallization, adult song is a highly stereotyped motor behavior, it is affected by social context: courtship song is considerably less variable than song produced in isolation (11). This ongoing variability could support song maintenance or adult learning (12–15). Songbirds thus pose a unique opportunity to determine the circuit mechanisms underlying context-dependent switching and the role of variability in a learned social behavior.
Fig. 1.
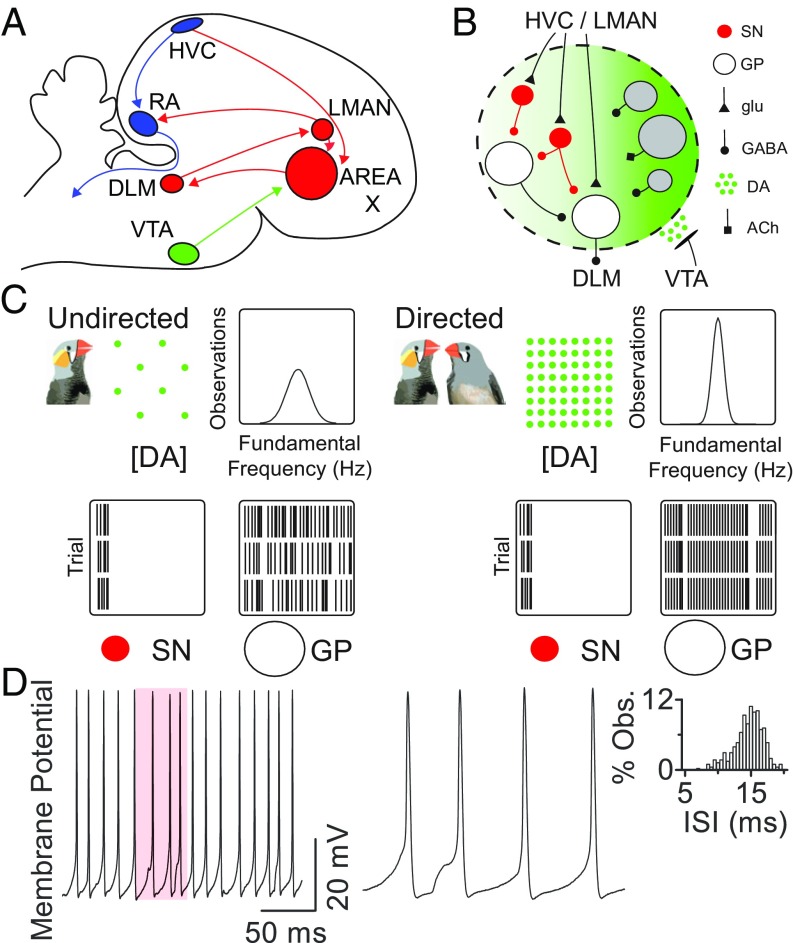
Effects of social context and dopamine on area X neuron firing. (A) Diagram of the songbird brain. Blue, motor pathway; red, learning pathway; green, midbrain dopamine input. (B) Circuitry within area X. Red, spiny neurons (SN); gray; local interneurons; white, pallidal neurons (GP). ACh, acetylcholine; DA, dopamine; glu, glutamate. (C) Schematic of social context-dependent changes in behavior and neural activity in area X (after refs. 20 and 23). During courtship, area X DA rises, narrowing the distribution of fundamental frequency across song trials. Simultaneously, area X GP output neuron firing becomes less variable. Input SNs maintain precise firing. (D) Regular pallidal neuron firing. (Left) Example pallidal neuron recording in current-clamp configuration with no current injection. (Center) Magnification of shaded region at Left illustrates underlying synaptic potentials. (Right) Interspike interval (ISI) distribution for this neuron.
A basal ganglia loop is essential for song learning (16, 17). Area X is the basal ganglia structure of the song system; it contains many spiny neurons (Fig. 1B) and fewer pallidal output neurons (18). One of its roles is to regulate song variability (Fig. 1C) (19). Although variability reaches the motor pathway through the cortex-like output area lateral magnocellular nucleus of the anterior nidopallium (LMAN) (20, 21), its exact source and the mechanism for its generation are unknown. Area X transforms stereotyped inputs from the premotor, cortex-like nucleus HVC (proper name) (22) into variable firing of its output neurons (23); this transformation could contribute to modulating vocal variability. During courtship, when birds sing directed song, dopaminergic neurons in the midbrain, homologous to those carrying reward signals in mammals (24–26), increase dopamine levels in area X (27). This increased dopamine acts through D1 receptors to reduce vocal variability (28).
How could dopamine affect the microcircuitry of area X to modulate variability? Time-locked inputs from HVC (29) drive very similar firing patterns in area X spiny neurons independent of social context (23, 29, 30). Spiny neurons inhibit the pallidal output neurons, which, in contrast, show changes in firing variability with social context (Fig. 1C) (23, 31–34). The mechanism underlying this transformation in area X, which could contribute to modulating firing variability in downstream nuclei, is not understood.
To determine how dopamine influences the circuit properties within area X to shape the firing properties of its output, we recorded intracellularly from area X pallidal neurons in brain slices, focusing on their synaptic inputs. We report a unique, local, spontaneously active glutamatergic neuron type, which shifts the circuitry of this basal ganglia nucleus from strictly inhibitory to mixed inhibitory–excitatory. This excitatory component of area X contributes to variability in pallidal neuron firing. Such an excitatory component could serve as a functional analog of subthalamic nucleus input, which is lacking in area X. A simple model suggests a powerful mechanism for dopaminergic modulation. We propose a unique microcircuit switch that could allow dopamine to control the variability and synchrony of the pallidal population and in turn to shape motor output according to social context.
Results
Rhythmic Excitatory Inputs to Pallidal Neurons.
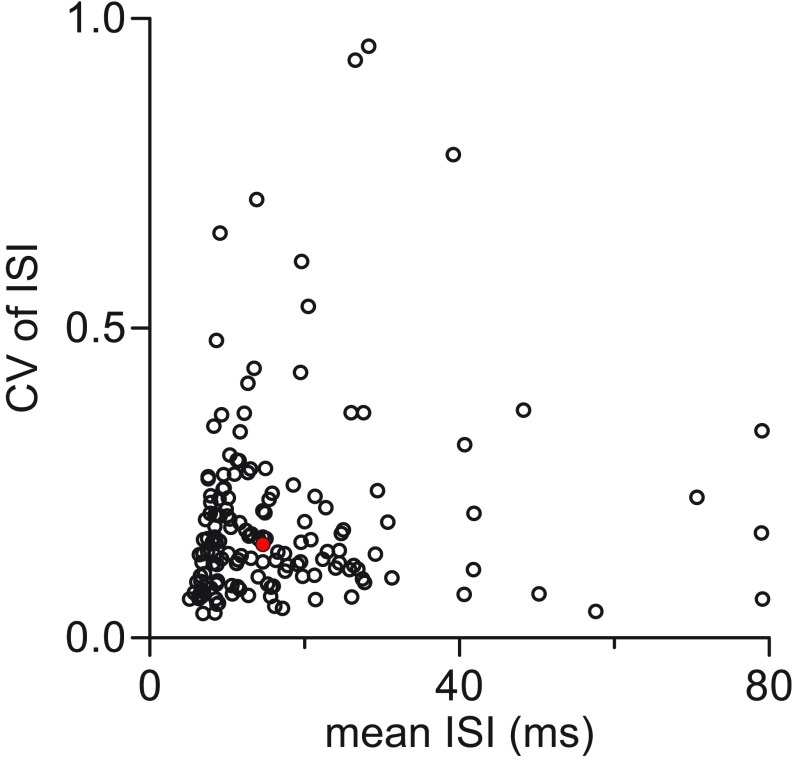
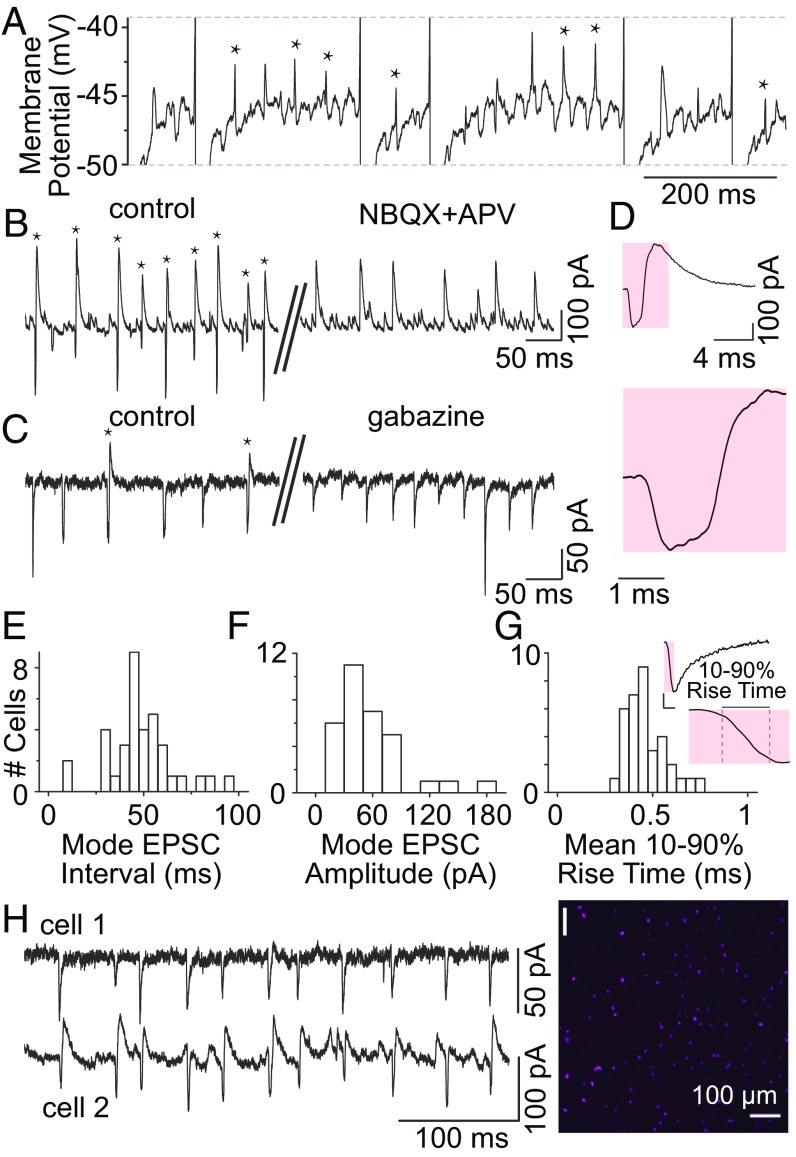
We visually targeted pallidal neurons for recording in isolated area X brain slices. They showed regular, spontaneous firing at nearly 60 Hz [mean interspike interval (ISI) of 17.3; SD = 13.8 ms; mean coefficient of variation (CV) of ISI of 0.19; SD = 0.15; n = 153, Fig. 1D and Fig. S1]. We hypothesized that synaptic potentials contributed to the spread in the ISI distribution. Injecting hyperpolarizing current to block spontaneous firing revealed substantial spontaneous synaptic activity (Fig. 2A). Many events were inhibitory, consistent with the overwhelming dominance of GABAergic neurons in basal ganglia (18, 32, 34–37). Surprisingly, however, many synaptic events were excitatory. Excitatory postsynaptic potentials (EPSPs) tended to occur at regular intervals, and 23.1% (SD = 19.1%; n = 31) were closely followed by inhibitory postsynaptic potentials (IPSPs) (Fig. 2A, asterisks).
Fig. S1.
Mean interspike interval (ISI) and coefficient of variation (CV) of ISI values for all pallidal neurons recorded; n = 153 cell-attached and current-clamp recordings. Filled red circle indicates the neuron illustrated in Fig. 1D. Mean ISI, 17.3 ± 13.8 ms; mean CV of ISI, 0.19 ± 0.15 (±SD).
Fig. 2.
Large, regular, unitary glutamatergic synaptic events impinge on area X pallidal neurons. (A) Current-clamp recording showing large regular EPSPs (asterisks) observed during steady injection of hyperpolarizing current. Dashed lines indicate truncated action potentials. (B) In voltage-clamp mode, EPSCs were often observed linked with IPSCs (asterisks). EPSCs were blocked by the AMPA receptor antagonist NBQX. (C) IPSCs were blocked by the GABAA receptor antagonist gabazine. (D) Expanded views of a linked EPSC/IPSC event. (E) Inter-EPSC interval mode across 36 neurons, indicating a rate of ∼20 Hz. (F) EPSC amplitude mode across 32 neurons, indicating strong excitatory inputs to pallidal cells. (G) EPSCs had fast rise times (mean rise time, 0.47 ± 0.10 ms; n = 35 neurons), consistent with a unitary origin. (H) Example paired recording showing that two pallidal cells receive simultaneous EPSCs. The most likely explanation is that they arise from a single presynaptic excitatory neuron. (I) Low-power in situ hybridization showing sparse cells expressing mRNA for vGluT2 in area X (magenta).
Voltage-clamp recordings revealed prominent glutamatergic excitatory postsynaptic currents (EPSCs) and GABAergic inhibitory postsynaptic currents (IPSCs) in all pallidal neurons. EPSCs were blocked by glutamate receptor blockers 2,3-dioxo-6-nitro-1,2,3,4-tetrahydrobenzo[f]quinoxaline-7-sulfonamide (NBQX) and d, l-aminophosphonovalerate (APV) (Fig. 2B). IPSCs were blocked by the GABAA receptor antagonist gabazine (Fig. 2C). As in current-clamp mode, EPSCs were frequently followed by IPSCs (Fig. 2 B and C, asterisks). Expanded views of such EPSCs followed by IPSCs, which we termed “linked events,” are shown in Fig. 2D.
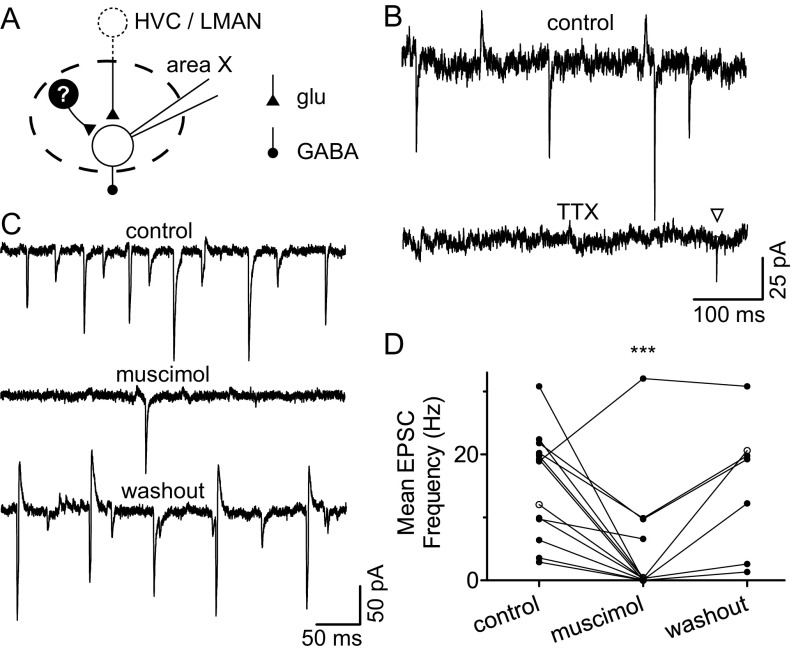
These excitatory inputs likely arise within area X, because EPSCs were present when area X was removed from surrounding tissue, depended on action potentials, and slowed with application of the GABAA receptor agonist muscimol (Fig. S2). EPSCs were regular; the inter-EPSC interval mode averaged 48.6 ± 17.5 ms (Fig. 2E). Together, these results show that a glutamatergic neuron in area X firing at ∼20 Hz excites pallidal neurons. Such EPSCs were not seen in 15 spiny neurons (data from this study and ref. 38).
Fig. S2.
Spontaneous glutamatergic synaptic currents arise locally within area X. (A) Schematic depicting potential sources of glutamate in the isolated area X slice preparation: severed synaptic terminals from afferent projections, or a unique excitatory cell type within area X. (B) Current recorded from a pallidal neuron in whole-cell voltage-clamp configuration at a holding potential of −60 mV. (Top) Control; (Bottom) in the presence of 1 μM TTX. TTX decreased EPSC frequency (control, 7.3 ± 0.58 Hz, vs. TTX, 1.1 ± 0.19 Hz; mean of differences, 6.17; 95% CI, 3.43 to 8.92; P = 0.01; n = 3). Inverted triangle highlights a putative miniature EPSC. (C) Current recorded from a pallidal neuron in whole-cell voltage-clamp configuration at a holding potential of −65 mV. The 10 μM muscimol reversibly decreased EPSC frequency. (D) Muscimol (1–10 μM) significantly decreased mean EPSC frequency (control, 14.27 ± 2.67 Hz, vs. muscimol, 1.66 ± 1.01 ms; P = 0.001; mean of differences, 12.62; 95% CI, 6.50 to 18.73; n = 11). ***P ≤ 0.001. Example in C indicated by open circles. Error bars represent SEM.
The spontaneous EPSCs can influence pallidal neuron firing. EPSCs were often large (mean amplitude, 64.18 ± 31.02 pA; n = 32) and could exceed 100 pA (Fig. 2F). They had a fast, smooth rising phase (Fig. 2G), consistent with a unitary input arising from a single presynaptic neuron. These EPSCs are thus able to deliver potent excitation to pallidal neurons, as we saw in current-clamp mode, where EPSPs were frequently on the order of 3–5 mV (Fig. 2A). In a few cases, we recorded simultaneously from two nearby pallidal neurons and observed many coincident EPSCs, suggesting that the putative excitatory neuron is divergent, simultaneously driving a population of pallidal output cells (Fig. 2H).
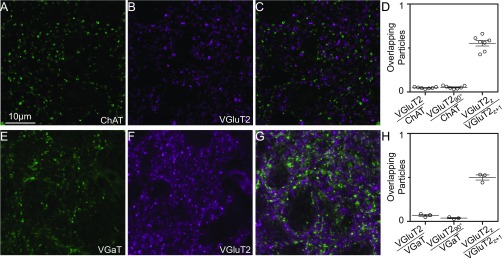
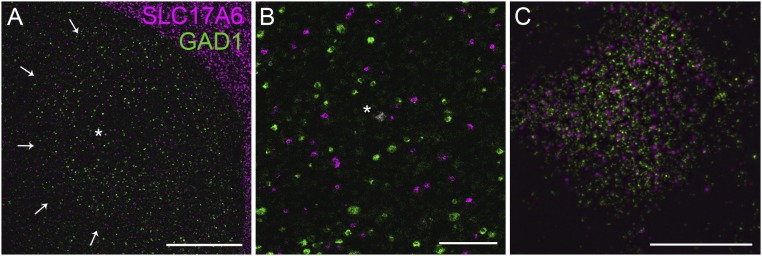
Previous unpublished work suggested that a population of area X neurons express VGluT2 mRNA (ZEBrA database; Oregon Health and Science University; www.zebrafinchatlas.org). We confirmed this finding (Fig. 2I and Fig. S3B) and found that, unlike in mammals (39, 40), area X cholinergic interneurons are not glutamatergic (Fig. S3 A–D). We found that some vGluT2+ neurons in area X also express mRNA for glutamic acid decarboxylase 1 (GAD1), a marker for GABAergic neurons (Figs. S4 and S5), although some vGluT2 neurons do not appear to be GABAergic (Figs. S5 and S6).
Fig. S3.
Glutamatergic, cholinergic, and GABAergic synaptic terminal arrangement in area X. (A and B) Sections of area X tissue immunolabeled with antibodies against ChAT (A) and VGluT2 (B). (C) Merged image of A and B. (D, Left) Low probability of overlap of VGluT2+ and ChAT+ puncta (n = 7 birds); (Center) Same low probability of overlap when the VGluT2 image was rotated 90°; (Right) high probability of overlap of VGluT2-positive puncta in adjacent optical sections. (E–H) Same as in A–D, for immunolabeling for vesicular GABA transporter (VGaT) and VGluT2 puncta.
Fig. S4.
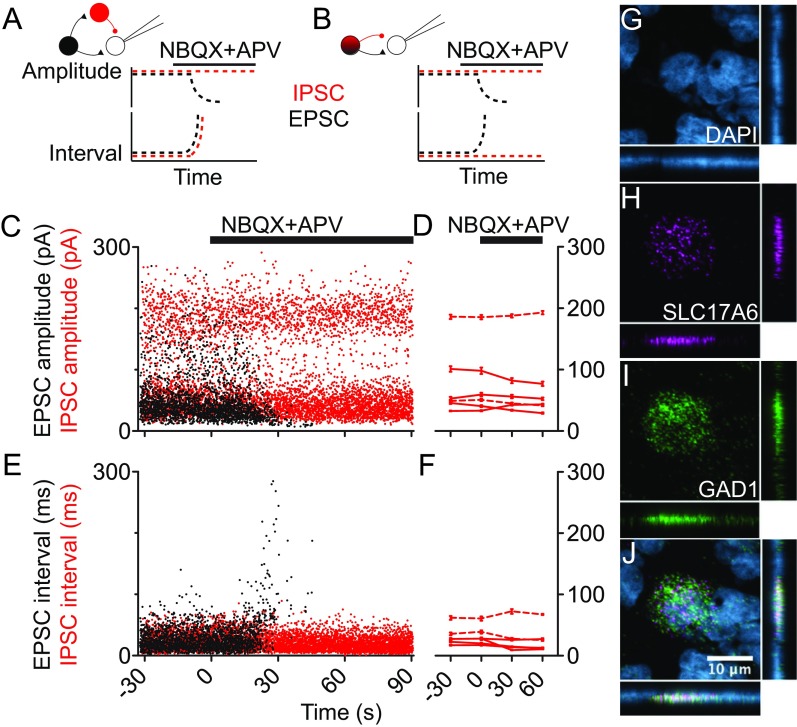
Origin and modulation of coupled EPSC–IPSCs. (A) Expected effect of glutamatergic blockade on synaptic events resulting from disynaptic inhibition. In cartoons, inhibitory element is shown in red. (B) Same as A for synaptic events resulting from glutamate/GABA corelease. (C) Time course of synaptic event amplitude for one pallidal neuron during application of NBQX (20 μM) and APV (100 μM). (D) Summary time course of IPSC amplitude for n = 6 distinct IPSC populations from five pallidal neurons. In one neuron, shown in C, two rhythmic IPSC populations of distinct sizes were analyzed separately. Example case is marked by dashed lines. (E) Time course of synaptic event intervals. Same neuron as in C. EPSC intervals continued increasing beyond 300 ms but were truncated for figure clarity. (F) Summary time course of IPSC interval for n = 6 datasets from five pallidal neurons. Example case marked by dashed lines. (G–J) Evidence for coexpression in some area X pallidal neurons of mRNA for SLC17A6 (which makes the VGluT2 protein) and GAD1. (G) Staining with the nuclear marker DAPI. (H) Expression of SLC17A6 in a single neuron in area X (magenta). (I) Expression of GAD1 in the same neuron (green). (J) Merged image showing intermingled label for the two genes. Each main image is a maximum intensity projection from a set of optical sections through the 20-µm section. In G–J, orthogonal views are shown to the Right and below each image.
Fig. S5.
Overview of expression of mRNA for SLC17A6 (vGluT2; magenta) and GAD1 (green) in pallium and area X. (A) Low-power view showing pallium with dense cells expressing vGlut2 mRNA, and much sparser expression in basal ganglia. Arrowheads indicate area X. Asterisk illustrates a cell with coexpression of vGluT2 and GAD1 mRNA. (Scale bar: 500 µm.) (B) Higher-power view within area X. (Scale bar: 100 µm.) (C) High-power image of a single neuron illustrating coexpression of vGluT2 and GAD1. (Scale bar: 10 µm.)
Fig. S6.
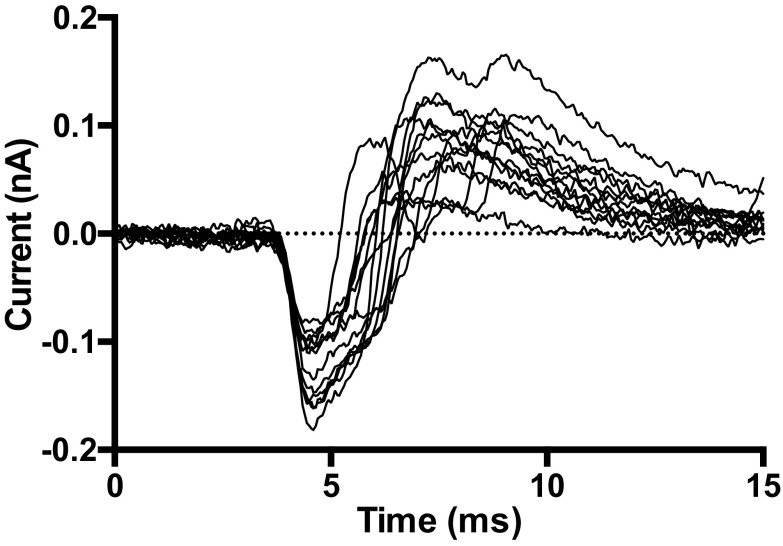
Example set of linked EPSC/IPSCs recorded from a single pallidal neuron. They have been aligned horizontally at the onset of the EPSC, and vertically at the baseline current before EPSC onset. The latency to positive current (emergence of the IPSC) was measured for over 100 linked events in each of nine neurons. The mean latency was 2.29 ± 0.36 ms (n = 9 neurons); the SD of that latency was 0.74 ± 0.16 ms. We consider these values, in particular the SD of the latency, to be much higher than expected for a simple corelease mechanism underlying the linked events.
Two Distinct Microcircuit Configurations Modulated by Dopamine.
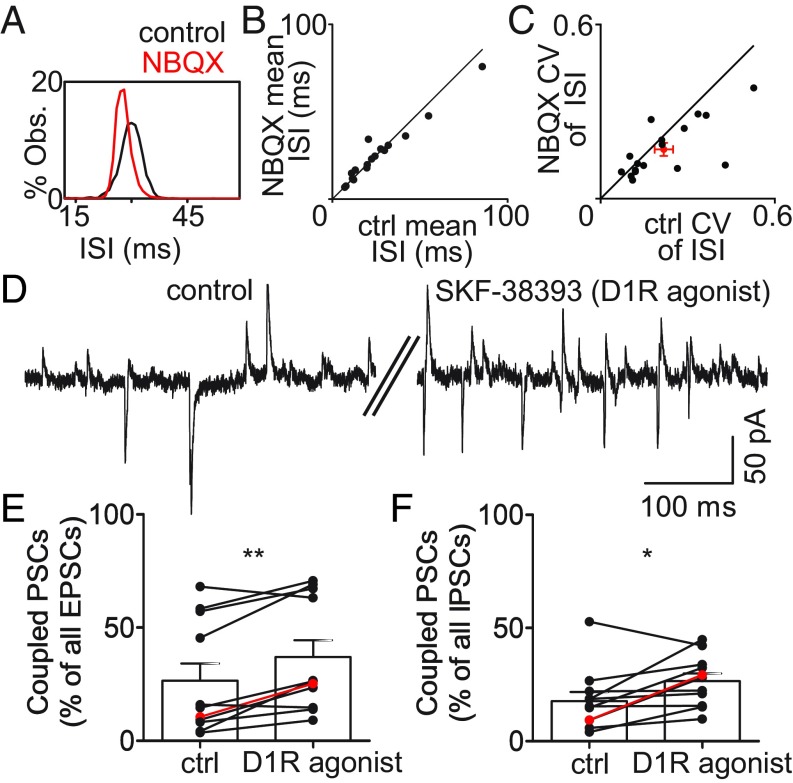
These strong inputs influence pallidal firing variability. Blocking AMPA glutamate receptors with NBQX decreased the variability of spontaneous pallidal neuron firing without changing the overall firing rate (Fig. 3 A–C).
Fig. 3.
EPSCs introduce variability into pallidal neuron firing and are modulated by DA. (A) ISI distribution for one example neuron before and after application of 10 μM NBQX, illustrating reduction in ISI variability. (B) Scatter plot of mean ISI; 10 μM NBQX did not change mean ISI (control, 25.9 ± 4.81 ms, vs. NBQX, 25.6 ± 4.12 ms; P = 0.78; n = 17 neurons). (C) NBQX significantly decreased variability of pallidal firing (control CV, 0.22 ± 0.03, vs. NBQX CV, 0.17 ± 0.02; P = 0.045). Error bars represent SEM. (D) The D1 dopamine receptor agonist SKF-38393 increased the incidence of linked synaptic events. (E and F) Summary data for n = 11 pallidal neurons in 10 μM SKF-38393. Example in D is indicated in red. (E) D1R agonist significantly increased the percentage of all EPSCs that led an IPSC by at most 4 ms (control, 26.7 ± 7.51 ms, vs. D1R agonist, 37.1 ± 7.46 ms; P = 0.003; mean of differences, −10.4; 95% CI, −16.3 to −4.48). (F) D1R agonist significantly increased the percentage of all IPSCs that are preceded by an EPSC within 4 ms (control, 17.8 ± 4.06 ms, vs. D1R agonist, 26.6 ± 3.38 ms; P = 0.024; mean of differences, −8.85; 95% CI, −16.2 to −1.47). Error bars represent SEM. *P ≤ 0.05 and **P ≤ 0.01.
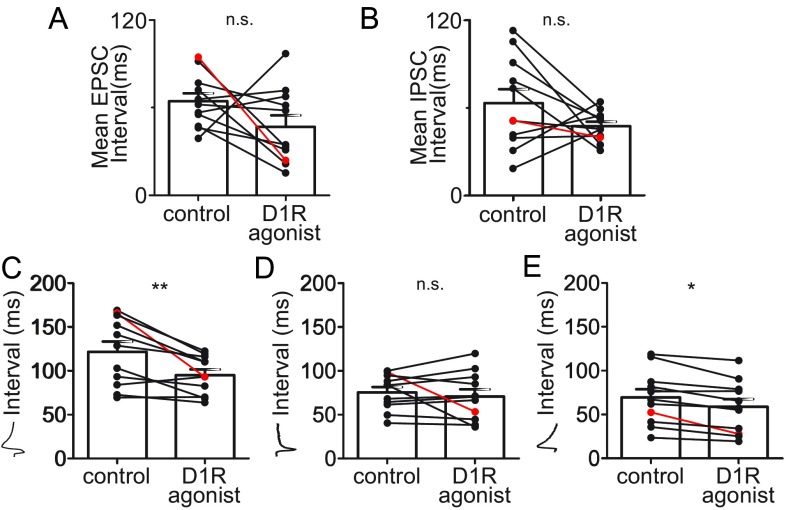
The D1 receptor agonist SKF-38393 did not alter the overall frequency of EPSCs or IPSCs; rather, it increased the proportion of coupled events (Fig. 3 D–F). It also increased the absolute rate of coupled events (Fig. S7). The modulation of these coupled events by dopamine represents a mechanism for altering the configuration of area X microcircuitry.
Fig. S7.
Effects of the D1 dopamine agonist on EPSCs and IPSCs recorded in area X pallidal neurons. (A and B) Summary data for n = 11 pallidal neurons in 10 μM SKF-38393. Example in Fig. 3C is indicated in red. (A) Mean EPSC interval for all EPSCs, whether or not each was followed by a linked IPSC, was not altered significantly (control, 64.3 ± 5.47 ms, vs. D1R agonist, 46.9 ± 7.77 ms; P = 0.142; mean of differences, 17.4; 95% CI, −6.91 to 41.8). (B) Mean IPSC interval for all IPSCs, whether or not each was preceded by a linked EPSC, was not altered significantly (control, 63.2 ± 9.40 ms, vs. D1R agonist, 47.4 ± 3.11 ms; P = 0.149; mean of differences, 15.8; 95% CI, −6.72 to 38.4). (C) Mean interval between linked EPSC–IPSC events decreased significantly in the presence of SKF-38393 (control, 121.9 ± 11.65 ms, vs. D1R agonist, 95.33 ± 6.52 ms; P = 0.0047; mean of differences, 26.6; 95% CI, 10.21 to 42.99). (D) Mean interval between isolated EPSCs, those not followed by a linked IPSC, was not altered by SKF-38393 (control, 75.63 ± 6.09 ms, vs. D1R agonist, 70.89 ± 8.18 ms; P = 0.50; mean of differences, 4.74; 95% CI, −10.26 to 19.75). (E) Mean interval between isolated IPSCs, those not preceded by a linked EPSC, was slightly decreased by SKF-38393 (control, 69.4 ± 9.27 ms, vs. D1R agonist, 58.54 ± 8.93 ms; P = 0.001; mean of differences, 10.87; 95% CI, −5.38 to 16.35). *P ≤ 0.05; **P ≤ 0.01; n.s. indicates P > 0.05. Error bars represent SEM.
Given the divergence of the excitatory input, we considered the microcircuit motif defined by this neuron, its coupled inhibitory partner, and the population of pallidal neurons that they drive. We explored how switching the microcircuit from isolated to coupled EPSCs and IPSCs (Fig. 3 E and F) might contribute to dopaminergic modulation of pallidal neuron firing variability during courtship singing. We used a simple model of a pallidal neuron with experimentally determined phase response curves (PRCs) to predict how its firing regularity was affected by excitatory inputs alone or excitatory and inhibitory inputs together. We explored the robustness of this behavior to changes in multiple parameters, and to the observed dopamine-driven increase in coupled synaptic inputs. This model also allowed us to evaluate the firing properties of a population of pallidal neurons receiving the same microcircuit synaptic inputs.
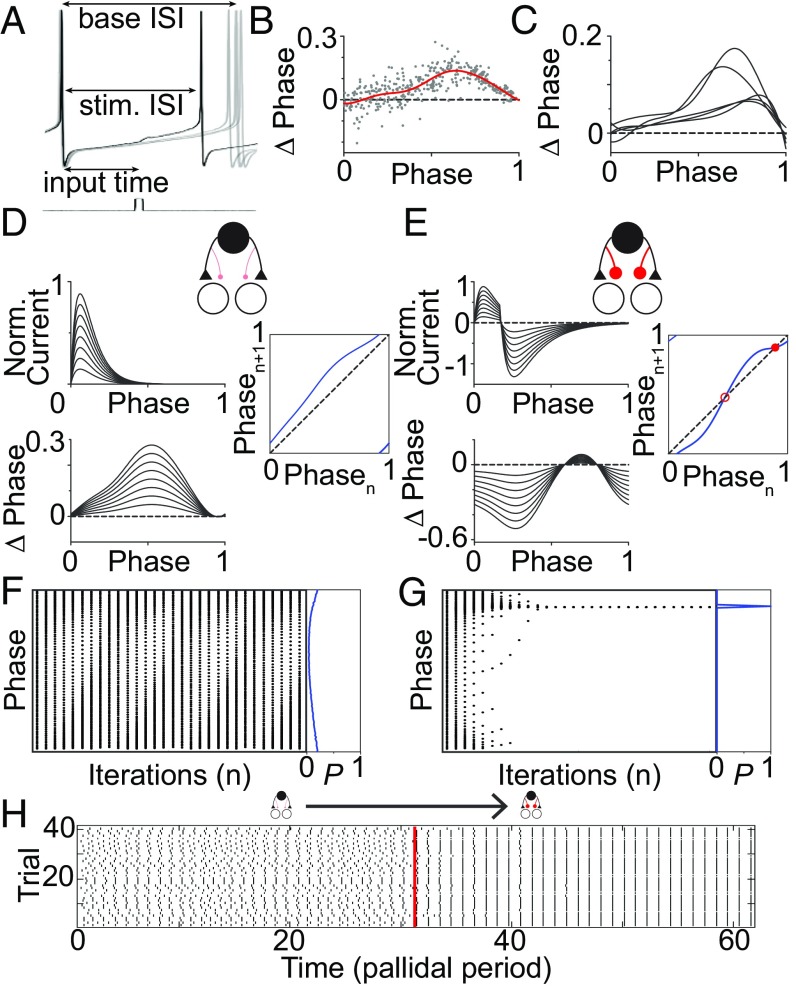
We modeled the intrinsically, regularly firing pallidal neurons using a model whose only state variable is phase (41). The experimentally measured infinitesimal PRC (iPRC), which describes the shift in phase on the next spike as a function of the phase at which a perturbation is provided, allowed realistic modeling of the interaction between oscillating neuron types (Fig. 4 A–C) (42). We fit EPSC and coupled EPSC–IPSC waveforms (Fig. 4 D and E) and convolved them with the iPRC. See Table S1 for fit parameters. The resulting “microcircuit PRCs” capture the effect of each input type on pallidal neuron spike timing (43). We then built firing maps relating the pallidal phase of the arrival of one synaptic input to that of the next synaptic input (44, 45) (rightmost panels of Fig. 4 D and E). We determined the model response to ongoing, periodic input of either EPSCs alone or coupled EPSC–IPSC events, to simulate the effect of dopamine (Fig. 4 F and G). We found that EPSCs alone could cause cycle-to-cycle changes to the pallidal phase at which synaptic input arrives, implying irregular pallidal neuron firing. We can model a population of desynchronized pallidal neurons or a single neuron on different trials by initializing the simulation at different initial phases. This led to a broad phase distribution (Fig. 4F, Right, blue curve). In contrast, with coupled EPSC–IPSC events, regardless of initial phase, the phase distribution collapsed to a single value, implying both regular pallidal neuron firing (Fig. 4G, Right) and population-level synchrony. Such a transition could also occur if synaptic inputs became coupled during a trial (Fig. 4H).
Fig. 4.
Experimentally measured pallidal iPRC constrains simple model of how DA affects the area X microcircuit. (A) Example of pallidal phase shifts caused by small current pulse (50 pA, 2 ms). (B) Phase shifts caused by single current pulses in a pallidal neuron. Red curve represents analytic fit to those points (R2 = 0.52). (C) Individual fits to five pallidal neurons show qualitative similarity. (D) We convolved the normalized EPSC (Upper Left) with the parameterized iPRC (C) to obtain the microcircuit PRC (Lower Left). Multiple synaptic strengths are shown. (Right) Firing map iteratively relating the phase of the pallidal neuron at the onset of one input to its phase at the time of the next input. (E) Same as in D but for linked excitatory–inhibitory (EI) synaptic events. Filled red circle in firing map indicates a stable fixed point; open red circle indicates unstable fixed point. (F) Trajectory of the firing phases of pallidal neuron ensemble relative to excitatory neuron under excitatory (E) microcircuit drive. (Left) Pallidal phase ensemble evolution under firing map drive across multiple initial conditions (Fig. 4D). (Right) Blue line plots the resulting phase probability distribution. Note lack of convergence to a single phase (high entropy, low synchrony). (G) Same as in F for EI microcircuit drive. Note convergence of pallidal ensemble to a single phase (low entropy, high synchrony). (H) Change in firing of pallidal ensemble over time as microcircuit shifts from excitation only to mixed excitation and inhibition. Each dot represents a pallidal neuron firing event, and each row indicates the progression of a single trial with a different, randomly selected initial phase. Vertical red line indicates the time when the microcircuit switched.
Table S1.
Fit parameters for the iPRC
| Parameter | Value | Confidence interval, 95% |
| a0 | 0.0556 | (0.041, 0.071) |
| a1 | −0.0612 | (−0.095, −0.028) |
| a2 | −0.00686 | (−0.029, 0.016) |
| a3 | −0.00553 | (−0.012, 0.0012) |
| b1 | −0.0333 | (−0.078, 0.011) |
| b2 | 0.0154 | (−0.00075, 0.032) |
| b3 | −0.00149 | (−0.012, 0.0086) |
| w | 5.85 | (4.72, 6.98) |
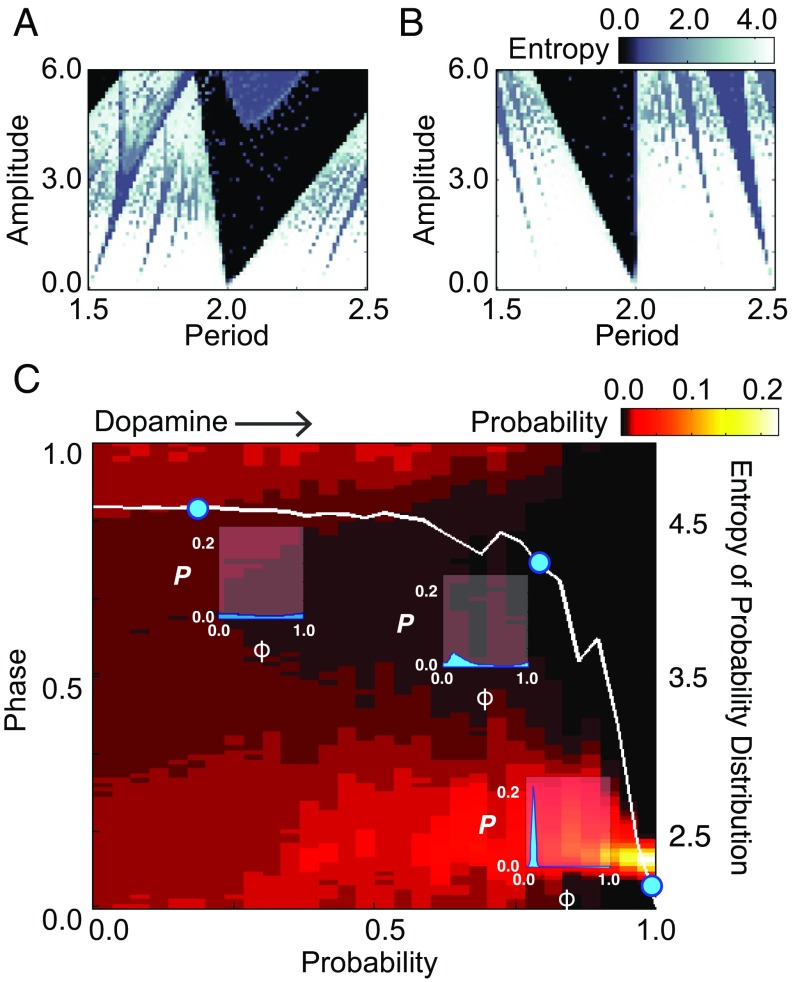
This switch between regular and irregular firing occurred over a large range of realistic input parameter settings (Fig. 5 A and B). We varied the strength and period of the synaptic input relative to the pallidal neuron firing period. We measured firing variability by computing the entropy, a measure of the width of the phase probability distribution (45). Large areas of parameter space showed stark differences in entropy under the two microcircuit configurations (Fig. 5 A and B), indicating that the observed synaptic changes caused by dopamine could cause a change in firing variability and synchrony.
Fig. 5.
Neural firing entropy from a simple model of the area X microcircuit in different conditions. (A) The entropy of the distribution of pallidal firing phase varies with synaptic amplitude and period of E microcircuit drive relative to pallidal period. (B) Same as A, but for EI microcircuit. (C) Effects of probabilistic inclusion of the inhibitory element on firing-phase distribution. Pallidal neuron intrinsic firing had low variability (CV = 0.05). Heat map shows the effect on the pallidal phase–probability distribution as the probability of selecting the EI microcircuit varied from 0 to 1 (abscissa). For each EI probability, the resulting phase (left ordinate) probability distribution is plotted as a column of heat values. Entropy from each column is plotted (right ordinate) as a white line. Insets show the probability distribution at three example EI probability values, corresponding to blue circles.
Because our experiments showed that excitatory events couple to inhibitory events in a probabilistic manner, we explored smoothly changing the probability of isolated and coupled events. We found that changes in the probability of coupled events on the order of those recorded experimentally (dopamine receptor activation increased the fraction of coupled synaptic events in most neurons by between approximately 0 and +200%) could cause substantial changes in the entropy of the phase–probability distribution (Fig. 5C). Together, our simulation results show that a simple and highly constrained model microcircuit of area X can explain the observed effects of dopamine on variability of pallidal neuron firing. Small dopamine-induced shifts in the prevalence of coupled synaptic events could thus provide a continuous adjustment to the degree of pallidal neuron firing variability and population synchrony.
Discussion
Our main findings are as follows: a regularly firing excitatory neuron type located within area X makes strong synaptic connections to multiple area X output neurons; this excitatory input is temporally tightly coupled to inhibitory input; it contributes to pallidal firing variability and potentially the synchrony of output subpopulations; and these inputs are modulated by dopamine. Such synaptic inputs drive irregular firing in simple model output neurons, as during variable singing when a bird is alone. Dopamine-induced changes shift a modeled population of pallidal neurons from irregular to regular firing, or from asynchrony to synchrony. Such context-dependent changes in circuit dynamics are well placed to modulate behavioral variability to drive learning.
We have provided evidence for a unique glutamatergic excitatory basal ganglia neuron type. A subset of these neurons may corelease GABA. It is not the cholinergic neuron type, which also releases glutamate in mammals (40, 46), but may nonetheless have similar function. In mammals, neurons of the subthalamic nucleus (STN) fire rhythmically and excite pallidal output neurons (47). Loss of dopamine, as occurs in Parkinson’s disease, leads to inappropriately synchronized and oscillatory firing of STN and pallidal neurons. The avian STN homolog (48) is not connected to area X (31). Local glutamatergic activity in area X may thus be functionally analogous to that provided by the STN; perhaps packaging these neurons within the nucleus allows for fine temporal precision, as required for song.
The unique glutamatergic cell type is likely rare, as it has not been recorded previously (18) and it appears to be relatively sparse (Fig. 2I). However, the ubiquity and potency of spontaneous EPSCs in pallidal neurons suggests that the glutamatergic neuron exerts widespread impact on its postsynaptic targets, consistent with simultaneous EPSCs in pairs of pallidal neurons.
Our modeling suggests that the frequent coupling of EPSCs and IPSCs is an important feature of the circuitry in area X. Changing model parameters according to observed effects of dopamine could easily switch the circuit into a regime of low pallidal firing variability. This variability may be key for creating firing pauses whose timing can drive activity in the medial portion of the dorsolateral nucleus of the anterior thalamus (DLM) (49–51). The precise source of coupling is not entirely clear, yet its persistence after glutamate blockade argues against a glutamate-driven disynaptic origin. Although we found some neurons coexpressing glutamatergic and GABAergic markers, the variable timing of the IPSC relative to the EPSC (Fig. S6) argues against corelease of glutamate and GABA as the main mechanism for coupling the events (52–57). A possible alternative mechanism is gap-junction coupling between the glutamatergic and GABAergic neurons.
Although we have shown one way in which area X may contribute to or regulate variability in the song learning circuit, variability is often attributed to nucleus LMAN (12, 19, 58, 59). Area X can exert a strong, precisely timed influence on LMAN via DLM (50, 51, 60, 61). A change between synchronous and asynchronous activity in the area X pallidal population could affect its ability to propagate signals through DLM, allowing basal ganglia to temporally modulate variability generated within LMAN. Area X projections to DLM neurons are thought to be one-to-one, but ensembles of DLM neurons converge on LMAN neurons (62–64), allowing area X to have a potentially dramatic effect on LMAN firing. Furthermore, these inputs preserve a myotopic organization of connectivity that runs throughout the learning circuit to the output motor drive (65–67). Momentary coherence of multiple area X pallidal neurons could thus control the activity of coordinated downstream neuron groups. The DLM input could cause recurrent networks such as those within LMAN to undergo stimulus-dependent suppression of their intrinsic, potentially chaotic activity (68). Indeed, highly correlated firing of neurons in HVC and in LMAN, presumably sustained through the polysynaptic basal ganglia loop, suggests a high degree of synchronous firing among local neuronal populations, perhaps within area X (69). Temporal variations in area X dopamine could not only create social context-dependent changes in variability but could also generate precisely timed shifts in variability that are presumably required for the ability of adult birds to learn to produce changes in specific song syllables (69, 70). Temporarily pooling specific subsets of area X output neurons could therefore act to create temporally precise, task-specific signals.
Glutamatergic neurons intrinsic to area X are thus well placed to contribute to the rapid changes in network dynamics induced by different social and learning contexts. Furthermore, they fire in microcircuit motifs that can strongly influence their downstream impact. Dopamine modulation of these coupled synaptic events provides a unique biophysical mechanism for rapidly switching area X firing patterns. Our model predicts that dopamine acts on the glutamatergic neuron type to orchestrate a transition between a regime of asynchronous and/or variable firing to one of synchronous and/or less variable firing. Silencing the excitatory neuron should then disrupt context-dependent transitions in pallidal neuron synchrony and perhaps also vocal variability. These predictions remain to be tested through simultaneous recordings from multiple pallidal neurons in vitro and in vivo.
We propose a specific biophysical mechanism contributing to modulating behavioral variability that is important for learning precise skilled movements. Similar mechanisms could underlie action selection, a hypothesized function of the basal ganglia (2, 71). Loss of dopamine, as in Parkinson’s disease, results in synchronous pallidal firing and more variable movement dynamics. More broadly, outside the motor domain, neural variability could give rise to adaptive phenomena such as effective foraging or creativity, or to maladaptive phenomena such as intrusive thoughts or attention deficit hyperactivity disorder (ADHD). Just as the presence of a female songbird raises striatal dopamine in the male and increases song stereotypy, stimulants acting through dopamine receptors reduce impulsive behaviors and enhance mental focus in patients with ADHD. The readily quantified song behavior and its discrete underlying neural circuit offer a promising pathway for detailed mechanistic analysis of basal ganglia function in health and disease.
Materials and Methods
Electrophysiology.
The 250-μm parasagittal brain slices were collected from 40 adult male zebra finches as in ref. 18. We cut around area X in each slice, thereby removing the cell bodies of projections to area X. Recordings from isolated area X slices were performed in artificial cerebrospinal fluid (ACSF) at 30 °C with high-chloride intracellular solution. See Supporting Information for detailed methods and data-inclusion criteria. The following drugs were bath applied: NBQX, muscimol, SKF-38393 hydrobromide, dl-APV (Tocris); gabazine/SR-95531 (Sigma-Aldrich); TTX (Calbiochem).
iPRC Measurement.
iPRC experiments were conducted following ref. 42 (Supporting Information). The 2-ms current pulses were injected at a frequency of 2 Hz, with four stimulus presentations per sweep, and repeated at different amplitudes (±50/100/250 pA). Phase change was defined as the difference between the baseline ISI and the stimulated ISI divided by the mean baseline ISI. The experimental iPRC was fit to an analytical form.
Firing Map Construction.
The was calculated by convolving the iPRC with either an excitatory synaptic input (E) or a coupled excitatory–inhibitory input (EI). Synaptic waveforms for E and EI inputs were drawn directly from fits to the two classes of synaptic input observed in our data (Supporting Information). We constructed the firing map as follows:
where Tmc is the period of the microcircuit inputs and Tp is the period of the pallidal cell. is the pallidal phase at which the nth synaptic input arrives.
Calculation of Entropy.
We calculated the entropy of phase distributions by approximating the steady state probability density function of a cell ensemble. Phase (0–1) was discretized, and a probability mass function was estimated by normalizing the counts of cells in each phase bin. Entropy was defined as follows:
Modeling of Noise in ISI Distribution and Likelihood of E–I vs. E Microcircuit.
We consider two aspects of noise: η models variability in the pallidal ISI as a Gaussian random variable; we model probabilistic jumps between microcircuit states as Bernoulli draws of firing maps f and g, the firing maps of the respective E and EI microcircuit drives. The probability of either the E or EI microcircuit occurring at any one input is as follows:
Results in Fig. 5C were computed by varying the Bernoulli probability of the EI firing map on a single draw from zero to 1.
Statistics.
Calculations are specified as mean ± SD or SEM. ISI variability was quantified using the CV (CV = SD/mean). Synaptic events before and after applications of NBQX, APV, TTX, muscimol, and SKF-38393 were quantified with paired two-tailed t tests. Coupled events were quantified by the percentage of all synaptic events of the relevant type (EPSC or IPSC). Traces and summary data depicted in figures are available from the corresponding author upon request.
SI Results
Pallidal neurons fired spontaneously at ∼60 Hz and quite regularly, as indicated by coefficient of variation (CV) of interspike interval (ISI) of ∼0.2 (Fig. S1). In n = 113 cell-attached recordings of pallidal neurons in such isolated area X slices, we observed a mean ISI of 16.22 ± 11.80 ms and a mean CV of ISI of 0.19 ± 0.15 (±SD). In whole-cell recordings, pallidal neurons fired action potentials spontaneously in current-clamp configuration, with a mean ISI of 18.92 ± 10.16 ms and a mean ISI CV of 0.22 ± 0.20 (n = 19). Notably, neither mean ISI nor CV of ISI differed significantly between cell-attached (n = 132) and current-clamp (n = 19) recordings in the isolated preparation (mean of differences of mean ISI, 0.003; 95% CI, −0.008 to 0.003, P = 0.35; and mean of differences of mean CV of ISI, 0.04; 95% CI, −0.11 to 0.04; P = 0.36, unpaired t tests). We also confirmed that pallidal neuron firing in neurons in the isolated preparation (n = 132) was not significantly different from neurons in intact parasagittal area X slices (n = 21) (mean of differences of mean ISI, 0.005; 95% CI, −0.011 to 0.001; P = 0.13; and mean of differences of mean CV of ISI, 0.03; 95% CI, −0.04 to 0.10; P = 0.47, unpaired t tests).
Excitatory synaptic events in area X pallidal neurons could arise from neurons within area X or from afferents (Fig. S2A). In all experiments, area X was surgically isolated from surrounding tissue. EPSCs were action potential dependent, as they were abolished by application of the sodium channel blocker tetrodotoxin (Fig. S2B). Application of the GABAA receptor agonist muscimol reversibly reduced the rate of EPSCs (Fig. S2 C and D).
Upon obtaining evidence of neurons expressing VGluT2 in area X, we initially hypothesized that the cholinergic interneurons are also glutamatergic. In mammals, striatal cholinergic interneurons corelease glutamate with acetylcholine (39, 40). To address whether area X cholinergic interneurons could release glutamate, we tested for colocalization of VGluT2 and choline acetyl transferase (ChAT) immunoreactivity in synaptic terminals. Although we observed dense terminal labeling for both enzymes, we found no significant colocalization of VGluT2+ and ChAT+ terminals, strongly suggesting that cholinergic interneurons are not the source of glutamate in area X (Fig. S3 A–D).
Glutamate can also be coreleased from GABA neurons in the developing nervous system (72, 73) and in the adult brain (52, 53, 55–57). To test whether one of the previously described GABA interneurons in area X—spiny neurons, fast-spiking interneurons, low-threshold spike interneurons, or a subpopulation of pallidal neurons that may not project to the thalamus (33, 74)—could release glutamate, we double-immunolabeled for VGluT2 and vesicular GABA transporter (VGaT). We found no significant colocalization of VGluT2+ and VGaT+ terminals (Fig. S3 E–H).
We propose that isolated and IPSC-coupled excitatory synaptic events represent two available microcircuit configurations providing input to pallidal neurons. Although many excitatory inputs arrived alone, many were followed immediately by inhibitory events (Fig. 2). About one-quarter (23.1 ± 19.1%) of EPSCs were closely followed by an IPSC. Conversely, 17.1 ± 11.6% of IPSCs followed an EPSC. The rate of coupled events was much higher than expected by chance (Monte Carlo shuffling for EPSCs: mean of differences, 14.9; 95% CI, 9.14 to 20.7; P < 0.0001; Monte Carlo shuffling for IPSCs: mean of differences, 10.1; 95% CI, 6.27 to 14.0; P < 0.0001; n = 31 neurons ± SD).
These coupled events could arise from a simple feedforward disynaptic microcircuit where the glutamatergic neuron drives a GABAergic neuron to fire with short latency (Fig. S4A) or from corelease of glutamate and GABA from the presynaptic interneuron (Fig. S4B). These models make different predictions about synaptic activity after blockade of fast glutamatergic transmission. In the disynaptic model, glutamatergic receptor blockade would prevent firing of the GABAergic interneuron, decreasing the frequency of IPSCs. In the corelease model, glutamatergic blockade would not alter the rate of IPSCs made by the spontaneously firing neuron. Although we observed a sudden decrease in EPSC amplitude and simultaneous increase in EPSC interval during the application of the glutamatergic blockers NBQX and APV, neither IPSC amplitude nor interval was affected (Fig. S4 C and E). Summary findings (Fig. S4 D and F, n = 6) are consistent with the idea that synaptic release of GABA is not dependent on glutamate receptor activation, but rather that the two neurotransmitters are released simultaneously, either from the same or from different nerve terminals.
To test for possible colocalized glutamatergic and GABAergic transmitter phenotype, we tested whether single neurons in area X express mRNA for SLC17A6, which makes VGluT2, and for GAD1, which makes one of the isoforms of glutamic acid decarboxylase. We observed sparse neurons expressing both genes; an example is shown in Fig. S4 G–J, and an overview is shown in Fig. S5. Counts from two animals gave a density of ∼200 labeled neurons per square millimeter in 10-μm-thick sections.
The timing of the linked events potentially leads to a different conclusion. A disynaptic mechanism would be expected to have some timing variability between the EPSC and the IPSC, whereas corelease should have highly synchronized release. We aligned the rising phase of multiple linked EPSC/IPSC events from a single neuron and noted that the timing of the IPSC relative to the EPSC onset was quite variable (Fig. S6). This relationship was maintained even if we selected for EPSCs of a single size class. This timing variability is consistent with separate neurons giving rise to the EPSC and the IPSC, although the temporal linking is not highly precise and not dependent on AMPA receptors. One possibility is that gap junctions couple the glutamatergic and GABAergic neurons, causing nearly synchronized, but sometimes probabilistic linking of EPSCs and IPSCs.
To test the effect of dopamine D1 receptor activation on synaptic events in area X pallidal neurons, we measured the inter-EPSC interval before and after application of the D1 receptor agonist SKF-38393. Fig. S7 A and B illustrates that the agonist did not affect the mean interval between EPSCs and between IPSCs, respectively, when both isolated synaptic events and linked EPSCs and IPSCs were included. Fig. S7C illustrates that D1 receptor activation significantly reduced the mean interval between linked EPSC–IPSC events. Fig. S7D illustrates that D1 receptor activation did not affect the interval between isolated EPSCs. Fig. S7E illustrates that D2 receptor activation caused a very small, but statistically significant reduction in the mean interval between isolated IPSCs.
SI Materials and Methods
Slicing Procedure.
All procedures were approved by the Institutional Animal Care and Use Committee at the University of Washington, in line with the Guide for the Care and Use of Laboratory Animals (75). Male zebra finches were either purchased from a local supplier or obtained from our breeding facility. Birds were communally housed in cages on a 14/10-h light/dark cycle. Birds were anesthetized by isoflurane inhalation and euthanized by decapitation. The brain was removed rapidly and submerged in ice-cold cutting solution containing the following (in mM): sucrose, 205; KCl, 2.5; MgCl2, 7.5; CaCl2, 0.5; NaH2PO4, 1; NaHCO3, 26.2; d-glucose, 11, at an osmolality of 310 mOsm, and bubbled with a mixture of 95% O2/5% CO2. Sections containing area X were sliced on a vibrating microtome (Oxford). An ophthalmic microsurgical blade was used to cut around area X in each slice, thereby removing the cell bodies of projections to area X. Isolated area X slices were stored for >45 min in warm (30 °C) ACSF (in mM: NaCl, 119; KCl, 2.5; MgSO4, 1.3; CaCl2, 2.5; NaH2PO4, 1; NaHCO3, 26.2; d-glucose, 11) with 400 μM ascorbate (final pH of 7.4, osmolality of 300 mOsm, bubbled with 95% O2/5% CO2).
Electrophysiological Recording.
Slices were transferred to a recording chamber perfused at ∼2.5 mL/min with prebubbled ACSF heated to 30 °C. Recording pipettes were pulled to a resistance of 3–5 MΩ and filled with internal solution containing the following (in mM): KMeSO4, 120; Hepes, 10; NaCl, 8; EGTA, 2; MgSO4, 2; phosphocreatine, 10; ATP-Mg, 2; GTP, 0.3; biocytin, 0.2–0.5% (Sigma-Aldrich) for post hoc histological reconstruction, at a final osmolality of 290–295 mOsm and pH 7.3. In a subset of supporting voltage-clamp recordings, KMeSO4 was replaced with CsMeSO4 and 5 mM QX314 bromide (Tocris) was included in the pipette for maintaining better voltage clamp. Cells were subjected to a series of current pulses after whole-cell mode was established to measure intrinsic electrophysiological properties. In the supporting voltage-clamp recordings using Cs-based solution, it was not possible to confirm cell identity based on intrinsic electrophysiological properties. These cells were identified based on soma size and spontaneous activity during seal formation.
Electrophysiological signals were amplified with a MultiClamp 700B amplifier (Molecular Devices) and digitized at 20 kHz with a Digidata 1322A analog–digital converter (Molecular Devices). Recordings were collected and low-pass filtered (4 kHz for voltage clamp, 10 kHz for current clamp) in Clampex 9.0 software (Axon Instruments). Cell-attached recordings were collected in voltage-clamp mode. Input and series resistances were monitored in every recording sweep with a 250-ms hyperpolarizing test pulse. Mean series resistance was 15.5 MΩ across recordings and ranged between 7.62 and 27.64 MΩ. Data were excluded from analysis if series resistance changed by more than ±25% during the recording or between conditions for pharmacological manipulations. For muscimol perfusion, experiments were conducted in a mix of pallidal and nonpallidal neurons. In some muscimol perfusion experiments, washout condition was accompanied by a greater than 25% increase in series resistance from baseline. Nonetheless, we included these data in analysis of EPSC frequency, as this change in recording stability would be expected to reduce EPSC detection, resulting in an underestimation of their frequency. In two cases, series resistance remained very stable after washout of 1 μM muscimol, allowing a second perfusion at 5 μM. Results at both drug concentrations are displayed in Fig. S2D, but only the higher concentration was included in statistical analysis of this experiment, so that each data point arose from an independent neuron. For cell-attached and current-clamp recordings cells were excluded from analysis if their spontaneous firing rate decreased by more than 20% over the course of the experiment. The following drugs were bath applied in these experiments: NBQX, muscimol, SKF-38393 hydrobromide, dl-APV (Tocris); gabazine/SR-95531 (Sigma-Aldrich); TTX (Calbiochem). iPRC recordings were made in the presence of gabazine and NBQX (each 10 μM).
Cell Type Identification.
Aspiny fast firing neurons of area X (pallidal neurons) were identified based on previously described criteria (18): (i) large soma size; (ii) spontaneous activity of >10 Hz; (iii) fast action potentials, and (iv), in a subset of cells that was reconstructed histologically, morphological confirmation of large soma and aspiny dendritic processes. Cells were subjected to a series of current pulses after whole-cell mode was established to measure intrinsic electrophysiological properties. In recordings using Cs solution, pallidal cells were identified based on soma size and spontaneous activity during seal formation.
Histology and Immunohistochemistry.
Slices were fixed in 4% paraformaldehyde in 0.1 M phosphate buffer (PB) at 4 °C overnight, and then cryoprotected in 30% sucrose in 0.1 M PB. Fixed slices were resectioned (50 μm) on a freezing microtome and washed in 0.1 M PB. For VGluT2/ChAT and VGluT2/VGaT double immunostaining, sections were washed in 0.3% Triton X in 0.1 M PB (PBT), incubated in PBT with 3% BSA for 30 min, and then with mouse anti-VGluT2 antibody (1:200; Millipore) and either goat anti-ChAT antibody (1:200; Millipore) or rabbit anti-VGaT antibody (1:200; Synaptic Systems) in 0.1 M PB for 48 h at 4 °C. Slices were then washed with 0.1 M PB and incubated for 2 h at 27 °C with Alexa 488-conjugated donkey anti-goat and Alexa 568-conjugated donkey anti-mouse secondary antibodies (1:200; Molecular Probes). If sections contained neurons that had been used in electrophysiology experiments, Alexa 633-conjugated streptavidin was also included (1:300; Molecular Probes). Stained slices were washed and mounted in 0.1 M PB on glass slides, and coverslipped with Fluoromount-G (Southern Biotech). The same protocol was applied when sections were processed for morphological reconstruction: goat anti-ChAT antibody was used for enhanced visualization of the area X border, and Alexa 594-conjugated streptavidin (1:300) along with Alexa 488-conjugated donkey anti-goat antibody were used for the secondary incubation.
In Situ Hybridization.
Adult zebra finch brains were flash frozen, and 20-μm parasagittal sections were cryosectioned and slide mounted on SuperFrost Plus slides (Fisher Scientific; 12-550-15). Sections were fixed in 4% paraformaldehyde for 15 min at 4 °C, dehydrated in ethanol, and air-dried at room temperature, followed by 30-min protease pretreatment (Protease 4; catalog no. 322340; Advanced Cell Diagnostics). Fluorescent in situ hybridization (ISH) was performed using an RNAscope Fresh Frozen Multiplex Fluorescent kit (catalog no. 320851; Advanced Cell Diagnostics) according to the manufacturer’s protocol to perform target probe hybridization and signal amplification. Probes were purchased from Advanced Cell Diagnostics: GAD1 mRNA, Tgu-GAD1-C1 (catalog no. 300031-C1), and vGluT2 mRNA, Tgu-SLC17A6-C3 (catalog no. 320269-C3).
Confocal Microscopy.
Confocal images were acquired with an Olympus FV-1000 microscope with a 100× objective, 2× optical zoom, and a confocal aperture of 120 μm. Images collected were 64 × 64 μm in size, with a section depth of either 0.36 or 0.43 μm. Laser wavelengths used for excitation were 488, 561, and 633 nm. Image brightness and contrast for example figures were adjusted using ImageJ (National Institutes of Health). Filled cells were inspected in ImageJ to confirm cell type based on previously described morphological characteristics (18). A minimum of five sequential images from one to two locations in seven birds (VGluT2/ChAT) and three birds (VGluT2/VGaT) were used to determine the degree of signal colocalization. The threshold-based Particle Analyzer function was applied to the images in ImageJ, and the centroid of each particle was exported for further analysis in Matlab where a custom script was used to quantify the proportion of centroids found in the ChAT or VGaT channel that could be matched with a nearby (<0.4 μm), unique centroid in the VGluT2 channel. This quantification was compared with that for a 90° rotated version of the VGluT2 channel. Finally, the proportion of overlap between sequential VGluT2 images in the stack was calculated.
Electrophysiology Analysis.
Spike times were analyzed in Matlab by measuring action potential peak time. Pallidal firing statistic comparisons between isolated vs. intact slices or cell-attached vs. current-clamp recording configuration were made with unpaired, two-tailed t tests. Use of low-chloride internal solution permitted simultaneous recording of opposite sign excitatory and inhibitory spontaneous synaptic activity in pallidal cells. Holding potential was tuned individually for each cell (mean, −56.41 mV; range, −50 to −65 mV) to maximize EPSC/IPSC isolation while minimizing unclamped action potentials. Similarly, holding current was adjusted for each current-clamp recording. In four cases, voltage-clamp recordings were performed with Cs and QX314 in the internal solution, which permitted even better EPSC/IPSC isolation at a holding potential of −45 mV. Spontaneous currents were analyzed with Mini Analysis (Synaptosoft). A minimum consecutive window of 25 s was analyzed for each recording. Events found during the test pulse period were discarded from analysis. Event features (peak time, peak amplitude, 10–90% rise time, interevent interval) for 36 pallidal neurons were exported for further analysis in Matlab. EPSC interval and amplitude mode summaries were determined by taking the most prominent normally distributed peak in the EPSC interval histogram (bin size, 5 ms) and amplitude histogram (bin size, 5 pA) for each neuron. Voltage-clamp recordings performed with Cs and QX314 in the internal solution were included in summary data of interevent interval and 10–90% rise time, but not amplitude. A subset of pallidal neurons (n = 31) with good isolation of EPSCs/IPSCs and a minimum spontaneous IPSC frequency of 2 Hz were included in analysis of coupled synaptic events. An EPSC was categorized as coupled, or linked, when its peak time was followed by an IPSC peak time within 4 ms, with no other intervening events. For Monte Carlo analysis, IPSC times for each pallidal neuron (n = 31) were shuffled with replacement 1,000 times; the percentage of coupled events was calculated for each individual permutation. Mean shuffled and observed percentages of linked events (out of all events) were compared with a paired, one-tailed t test. This procedure was repeated for the percentage of linked IPSCs out of all IPSCs.
Infinitesimal Phase Response Curve Measurement.
iPRC experiments were conducted in five pallidal neurons in the presence of gabazine and NBQX (10 μM), following previously described methods, which are illustrated in Fig. 4 (42). Briefly, 2-ms current pulses were injected at a frequency of 2 Hz, with four stimulus presentations per sweep, and repeated at different amplitudes (±50/100/250 pA). Each stimulated ISI was associated with a pool of spontaneous ISIs occurring within 30 s of the ISI in question. The baseline ISI for that stimulation was defined as the mean of ISIs in this pool longer than the stimulated ISI. If there were fewer than 10 ISIs from which to make this calculation, the associated pool of spontaneous ISIs was approximated by a Gaussian distribution with mean and SD equal to that of the spontaneous ISIs occurring within 30 s of the stimulation. Input phase for a given stimulus was determined by dividing its input time by the mean baseline ISI, where the input time was the time between the peak of the preceding spike and midpoint of the current pulse. Phase change was the difference between the baseline ISI and the stimulated ISI (the time between the peak of the preceding spike and the peak of the spike following current injection) divided by the mean baseline ISI.
Firing Map Construction.
The experimental iPRC was fit to an analytical form of sum of sines and cosines:
All cells measured showed qualitative similarity in their iPRC: almost entirely phase advancing with the biggest phase advance occurring approximately two-thirds of the way into the oscillation cycle. Because of this similarity, we chose an analytic iPRC fit to a single representative cell. For this cell, the R-squared value of the fit parameters is 0.52. The parameters of the fit are provided in Table S1.
Synaptic Waveforms.
PRCs were generated by convolving a representative iPRC at +50-pA current injection with two classes of synaptic input observed in our data: an excitatory synaptic input and a coupled excitatory–inhibitory input. Excitatory synaptic input was modeled by a difference of exponentials:
Coupled excitatory–inhibitory input was modeled by summing two such differences of exponentials, one representing the excitatory component and the other representing the inhibitory component of the event:
Coupled EPSCs from six pallidal neurons were collected and fit with the above equation to directly draw the distribution of parameters for events from the data. The following τ parameters yielded the best fit after examining both individual and coupled synaptic events: = 1.2 ms; = 0.7 ms; = 2.5 ms; = 0.7 ms. These parameters were inserted as constants back into the above equations. Excitatory components of coupled events observed in our dataset precede inhibitory components, which could be explained by different activation and deactivation time courses of the underlying synaptic conductances, or simply a delay in the onset of the inhibitory component. We found that the best fits to our data occurred when activation time courses and were equivalent, but a short delay was imposed on the inhibitory component (mean/SD delay, 2.25 ± 0.61 ms; n = 231 from six cells). This step activation was approximated by a hyperbolic tangent function so that x in both rising and falling phases of the inhibitory component was replaced with , where d is delay and c = 1,000. The above constants, and allowing the inhibitory component of the equation to shift in time, resulted in robust synaptic event fits (mean R-squared, 0.96 ± 0.03; n = 231 coupled EPSCs). The synaptic event amplitudes and pauses between excitation and inhibition that were explored in the parameter space of our model were thus drawn directly from fits to the observed data. The PRC was then calculated by convolving the iPRC with the synaptic waveform constructed from fits to observed data described in the previous section in SI Materials and Methods. The firing map was built using this PRC to be the following:
where Tmc is the period of the inputs and Tp is the period of the pallidal cell. is the pallidal phase at which the “nth” synaptic input arrives and the map computes the pallidal phase, of the arrival of the next synaptic event.
Calculation of Entropy of a Cell Ensemble.
The entropy of the cell ensemble was estimated by approximating the steady-state probability density function of a cell ensemble. One thousand initial phases were drawn from a uniform distribution and then iterated 200 times under each realization of the firing map. Phase (0–1) was divided into 100 bins, and a probability mass function was estimated by normalizing the counts of cells in each phase bin. Phase locations of the cell ensemble were summed over the last 10 iterations of the trials to account for potential nonstationarity of the final distribution. (Note that this choice of averaging is equivalent to the interpretation of the cell ensemble as being independent realizations of variability of a single cell. As a check, similar calculations were performed wherein the entropy was averaged over the last 10 iterations with very similar results.) Entropy was defined as follows:
where M = 100 is the total number of discrete phase partitions. Note the upper bound of this entropy metric is 4.61. At the highest intensity of synaptic input used to compute the entropy parameter scape, the greatest magnitude phase shift caused by the EI microcircuit is 0.50 (in units of pallidal phase) and the greatest magnitude phase shift caused by the E microcircuit is 0.37 (in units of pallidal phase). The ratio of these values was chosen by our fits to the experimental measurements.
Modeling of Noise in ISI Distribution and Likelihood of E–I vs. E Microcircuit.
We modeled two aspects of noise: η represents variability in the pallidal ISI and was modeled as an independent Gaussian random variable with zero mean and variance, σ = 0.05, in units of pallidal phase; probabilistic jumps between microcircuit states we modeled as Bernoulli draws of firing maps f and g, the firing maps of the respective E and EI microcircuit drives:
and
where
and
The probability of either the E or EI microcircuit firing at any one input is as follows:
Results in Fig. 5C were computed by varying the Bernoulli probability of the E firing map on a single draw from 0 to 1 and then calculating the time-averaged distribution of each random iterated map substantiated by a single Bernoulli probability of drawing the E firing map. To compute each probability distribution, an initial ensemble of 1,000 phases was drawn from a uniform distribution between 0 and 1 and then allowed to iterate 500 times. The time average of the distribution was calculated by combining the phase locations of the cell ensemble over the last 400 iterations.
Acknowledgments
We thank Dr. Pankaj Sah for suggesting the analysis of EPSC-IPSC relative timing as shown in Fig. S6. This work was funded by NIH Grant R01MH066128 (to D.J.P.) and National Science Foundation Award IIS 1421245 (to A.L.F.). A.D. was also funded through NIH Training Grant 1T90DA032436, and A.B. through Grants T32DC000033 and T32GM007108. A.L.F. acknowledges the support of the Washington Research Foundation.
Footnotes
The authors declare no conflict of interest.
This article is a PNAS Direct Submission.
This article contains supporting information online at www.pnas.org/lookup/suppl/doi:10.1073/pnas.1611146114/-/DCSupplemental.
References
- 1.Graybiel AM. The basal ganglia: Learning new tricks and loving it. Curr Opin Neurobiol. 2005;15:638–644. doi: 10.1016/j.conb.2005.10.006. [DOI] [PubMed] [Google Scholar]
- 2.Graybiel AM, Grafton ST. The striatum: Where skills and habits meet. Cold Spring Harb Perspect Biol. 2015;7:a021691. doi: 10.1101/cshperspect.a021691. [DOI] [PMC free article] [PubMed] [Google Scholar]
- 3.Bromberg-Martin ES, Matsumoto M, Hikosaka O. Dopamine in motivational control: Rewarding, aversive, and alerting. Neuron. 2010;68:815–834. doi: 10.1016/j.neuron.2010.11.022. [DOI] [PMC free article] [PubMed] [Google Scholar]
- 4.Schultz W. Updating dopamine reward signals. Curr Opin Neurobiol. 2013;23:229–238. doi: 10.1016/j.conb.2012.11.012. [DOI] [PMC free article] [PubMed] [Google Scholar]
- 5.Wise RA. Roles for nigrostriatal—not just mesocorticolimbic—dopamine in reward and addiction. Trends Neurosci. 2009;32:517–524. doi: 10.1016/j.tins.2009.06.004. [DOI] [PMC free article] [PubMed] [Google Scholar]
- 6.Fee MS, Scharff C. The songbird as a model for the generation and learning of complex sequential behaviors. ILAR J. 2010;51:362–377. doi: 10.1093/ilar.51.4.362. [DOI] [PubMed] [Google Scholar]
- 7.Doya K, Sejnowski TJ. A computational model of birdsong learning by auditory experience and auditory feedback. In: Poon P, Brugge J, editors. Central Auditory Processing and Neural Modeling. Plenum; New York: 1998. pp. 77–88. [Google Scholar]
- 8.Rao RP, Sejnowski TJ. Spike-timing-dependent Hebbian plasticity as temporal difference learning. Neural Comput. 2001;13:2221–2237. doi: 10.1162/089976601750541787. [DOI] [PubMed] [Google Scholar]
- 9.Farries MA, Fairhall AL. Reinforcement learning with modulated spike timing dependent synaptic plasticity. J Neurophysiol. 2007;98:3648–3665. doi: 10.1152/jn.00364.2007. [DOI] [PubMed] [Google Scholar]
- 10.Fiete IR, Fee MS, Seung HS. Model of birdsong learning based on gradient estimation by dynamic perturbation of neural conductances. J Neurophysiol. 2007;98:2038–2057. doi: 10.1152/jn.01311.2006. [DOI] [PubMed] [Google Scholar]
- 11.Sossinka R, Böhner J. Song types in the zebra finch Poephila guttata castanotis. Z Tierpsychol. 1980;53:123–132. [Google Scholar]
- 12.Ali F, et al. The basal ganglia is necessary for learning spectral, but not temporal, features of birdsong. Neuron. 2013;80:494–506. doi: 10.1016/j.neuron.2013.07.049. [DOI] [PMC free article] [PubMed] [Google Scholar]
- 13.Andalman AS, Fee MS. A basal ganglia-forebrain circuit in the songbird biases motor output to avoid vocal errors. Proc Natl Acad Sci USA. 2009;106:12518–12523. doi: 10.1073/pnas.0903214106. [DOI] [PMC free article] [PubMed] [Google Scholar]
- 14.Sakata JT, Brainard MS. Online contributions of auditory feedback to neural activity in avian song control circuitry. J Neurosci. 2008;28:11378–11390. doi: 10.1523/JNEUROSCI.3254-08.2008. [DOI] [PMC free article] [PubMed] [Google Scholar]
- 15.Tumer EC, Brainard MS. Performance variability enables adaptive plasticity of “crystallized” adult birdsong. Nature. 2007;450:1240–1244. doi: 10.1038/nature06390. [DOI] [PubMed] [Google Scholar]
- 16.Bottjer SW, Miesner EA, Arnold AP. Forebrain lesions disrupt development but not maintenance of song in passerine birds. Science. 1984;224:901–903. doi: 10.1126/science.6719123. [DOI] [PubMed] [Google Scholar]
- 17.Scharff C, Nottebohm F. A comparative study of the behavioral deficits following lesions of various parts of the zebra finch song system: Implications for vocal learning. J Neurosci. 1991;11:2896–2913. doi: 10.1523/JNEUROSCI.11-09-02896.1991. [DOI] [PMC free article] [PubMed] [Google Scholar]
- 18.Farries MA, Perkel DJ. A telencephalic nucleus essential for song learning contains neurons with physiological characteristics of both striatum and globus pallidus. J Neurosci. 2002;22:3776–3787. doi: 10.1523/JNEUROSCI.22-09-03776.2002. [DOI] [PMC free article] [PubMed] [Google Scholar]
- 19.Kao MH, Doupe AJ, Brainard MS. Contributions of an avian basal ganglia-forebrain circuit to real-time modulation of song. Nature. 2005;433:638–643. doi: 10.1038/nature03127. [DOI] [PubMed] [Google Scholar]
- 20.Kao MH, Brainard MS. Lesions of an avian basal ganglia circuit prevent context-dependent changes to song variability. J Neurophysiol. 2006;96:1441–1455. doi: 10.1152/jn.01138.2005. [DOI] [PubMed] [Google Scholar]
- 21.Olveczky BP, Andalman AS, Fee MS. Vocal experimentation in the juvenile songbird requires a basal ganglia circuit. PLoS Biol. 2005;3:e153. doi: 10.1371/journal.pbio.0030153. [DOI] [PMC free article] [PubMed] [Google Scholar]
- 22.Reiner A, et al. Avian Brain Nomenclature Forum Revised nomenclature for avian telencephalon and some related brainstem nuclei. J Comp Neurol. 2004;473:377–414. doi: 10.1002/cne.20118. [DOI] [PMC free article] [PubMed] [Google Scholar]
- 23.Woolley SC, Rajan R, Joshua M, Doupe AJ. Emergence of context-dependent variability across a basal ganglia network. Neuron. 2014;82:208–223. doi: 10.1016/j.neuron.2014.01.039. [DOI] [PMC free article] [PubMed] [Google Scholar]
- 24.Bottjer SW. The distribution of tyrosine hydroxylase immunoreactivity in the brains of male and female zebra finches. J Neurobiol. 1993;24:51–69. doi: 10.1002/neu.480240105. [DOI] [PubMed] [Google Scholar]
- 25.Lewis JW, Ryan SM, Arnold AP, Butcher LL. Evidence for a catecholaminergic projection to area X in the zebra finch. J Comp Neurol. 1981;196:347–354. doi: 10.1002/cne.901960212. [DOI] [PubMed] [Google Scholar]
- 26.Gerfen CR, Surmeier DJ. Modulation of striatal projection systems by dopamine. Annu Rev Neurosci. 2011;34:441–466. doi: 10.1146/annurev-neuro-061010-113641. [DOI] [PMC free article] [PubMed] [Google Scholar]
- 27.Sasaki A, Sotnikova TD, Gainetdinov RR, Jarvis ED. Social context-dependent singing-regulated dopamine. J Neurosci. 2006;26:9010–9014. doi: 10.1523/JNEUROSCI.1335-06.2006. [DOI] [PMC free article] [PubMed] [Google Scholar]
- 28.Leblois A, Wendel BJ, Perkel DJ. Striatal dopamine modulates basal ganglia output and regulates social context-dependent behavioral variability through D1 receptors. J Neurosci. 2010;30:5730–5743. doi: 10.1523/JNEUROSCI.5974-09.2010. [DOI] [PMC free article] [PubMed] [Google Scholar]
- 29.Hahnloser RHR, Kozhevnikov AA, Fee MS. An ultra-sparse code underlies the generation of neural sequences in a songbird. Nature. 2002;419:65–70. doi: 10.1038/nature00974. [DOI] [PubMed] [Google Scholar]
- 30.Kozhevnikov AA, Fee MS. Singing-related activity of identified HVC neurons in the zebra finch. J Neurophysiol. 2007;97:4271–4283. doi: 10.1152/jn.00952.2006. [DOI] [PubMed] [Google Scholar]
- 31.Person AL, Gale SD, Farries MA, Perkel DJ. Organization of the songbird basal ganglia, including area X. J Comp Neurol. 2008;508:840–866. doi: 10.1002/cne.21699. [DOI] [PubMed] [Google Scholar]
- 32.Carrillo GD, Doupe AJ. Is the songbird area X striatal, pallidal, or both? An anatomical study. J Comp Neurol. 2004;473:415–437. doi: 10.1002/cne.20099. [DOI] [PubMed] [Google Scholar]
- 33.Farries MA, Ding L, Perkel DJ. Evidence for “direct” and “indirect” pathways through the song system basal ganglia. J Comp Neurol. 2005;484:93–104. doi: 10.1002/cne.20464. [DOI] [PubMed] [Google Scholar]
- 34.Reiner A, Laverghetta AV, Meade CA, Cuthbertson SL, Bottjer SW. An immunohistochemical and pathway tracing study of the striatopallidal organization of area X in the male zebra finch. J Comp Neurol. 2004;469:239–261. doi: 10.1002/cne.11012. [DOI] [PubMed] [Google Scholar]
- 35.Gittis AH, Kreitzer AC. Striatal microcircuitry and movement disorders. Trends Neurosci. 2012;35:557–564. doi: 10.1016/j.tins.2012.06.008. [DOI] [PMC free article] [PubMed] [Google Scholar]
- 36.Luo M, Perkel DJ. A GABAergic, strongly inhibitory projection to a thalamic nucleus in the zebra finch song system. J Neurosci. 1999;19:6700–6711. doi: 10.1523/JNEUROSCI.19-15-06700.1999. [DOI] [PMC free article] [PubMed] [Google Scholar]
- 37.Luo M, Perkel DJ. Long-range GABAergic projection in a circuit essential for vocal learning. J Comp Neurol. 1999;403:68–84. [PubMed] [Google Scholar]
- 38.Thompson JA, Perkel DJ. Endocannabinoids mediate synaptic plasticity at glutamatergic synapses on spiny neurons within a basal ganglia nucleus necessary for song learning. J Neurophysiol. 2011;105:1159–1169. doi: 10.1152/jn.00676.2010. [DOI] [PMC free article] [PubMed] [Google Scholar]
- 39.Guzman MS, et al. Elimination of the vesicular acetylcholine transporter in the striatum reveals regulation of behaviour by cholinergic-glutamatergic co-transmission. PLoS Biol. 2011;9:e1001194. doi: 10.1371/journal.pbio.1001194. [DOI] [PMC free article] [PubMed] [Google Scholar]
- 40.Higley MJ, et al. Cholinergic interneurons mediate fast VGluT3-dependent glutamatergic transmission in the striatum. PLoS One. 2011;6:e19155. doi: 10.1371/journal.pone.0019155. [DOI] [PMC free article] [PubMed] [Google Scholar]
- 41.Ermentrout GB, Kopell N. Parabolic bursting in an excitable system coupled with a slow oscillation. SIAM J Appl Math. 1986;46:233–253. [Google Scholar]
- 42.Farries MA, Wilson CJ. Phase response curves of subthalamic neurons measured with synaptic input and current injection. J Neurophysiol. 2012;108:1822–1837. doi: 10.1152/jn.00053.2012. [DOI] [PMC free article] [PubMed] [Google Scholar]
- 43.Netoff T, Schwemmer M, Lewis T. 2012. Experimentally estimating phase response curves of neurons: Theoretical and practical issues. Phase Response Curves in Neuroscience: Theory, Experiment, and Analysis. Springer Series in Computational Neuroscience, eds Schultheiss NW, Prinz AA, Butera RJ (Springer Science & Business Media, New York), Vol 6, pp 95–129.
- 44.Izhikevich EM. Dynamical Systems in Neuroscience. MIT; Cambridge, MA: 2007. [Google Scholar]
- 45.Wilson CJ, Beverlin B, 2nd, Netoff T. Chaotic desynchronization as the therapeutic mechanism of deep brain stimulation. Front Syst Neurosci. 2011;5:50. doi: 10.3389/fnsys.2011.00050. [DOI] [PMC free article] [PubMed] [Google Scholar]
- 46.Gras C, et al. A third vesicular glutamate transporter expressed by cholinergic and serotoninergic neurons. J Neurosci. 2002;22:5442–5451. doi: 10.1523/JNEUROSCI.22-13-05442.2002. [DOI] [PMC free article] [PubMed] [Google Scholar]
- 47.Beurrier C, Congar P, Bioulac B, Hammond C. Subthalamic nucleus neurons switch from single-spike activity to burst-firing mode. J Neurosci. 1999;19:599–609. doi: 10.1523/JNEUROSCI.19-02-00599.1999. [DOI] [PMC free article] [PubMed] [Google Scholar]
- 48.Jiao Y, et al. Identification of the anterior nucleus of the ansa lenticularis in birds as the homolog of the mammalian subthalamic nucleus. J Neurosci. 2000;20:6998–7010. doi: 10.1523/JNEUROSCI.20-18-06998.2000. [DOI] [PMC free article] [PubMed] [Google Scholar]
- 49.Goldberg JH, Fee MS. A cortical motor nucleus drives the basal ganglia-recipient thalamus in singing birds. Nat Neurosci. 2012;15:620–627. doi: 10.1038/nn.3047. [DOI] [PMC free article] [PubMed] [Google Scholar]
- 50.Person AL, Perkel DJ. Unitary IPSPs drive precise thalamic spiking in a circuit required for learning. Neuron. 2005;46:129–140. doi: 10.1016/j.neuron.2004.12.057. [DOI] [PubMed] [Google Scholar]
- 51.Person AL, Perkel DJ. Pallidal neuron activity increases during sensory relay through thalamus in a songbird circuit essential for learning. J Neurosci. 2007;27:8687–8698. doi: 10.1523/JNEUROSCI.2045-07.2007. [DOI] [PMC free article] [PubMed] [Google Scholar]
- 52.Boulland J-L, et al. Vesicular glutamate and GABA transporters sort to distinct sets of vesicles in a population of presynaptic terminals. Cereb Cortex. 2009;19:241–248. doi: 10.1093/cercor/bhn077. [DOI] [PMC free article] [PubMed] [Google Scholar]
- 53.Fattorini G, et al. VGLUT1 and VGAT are sorted to the same population of synaptic vesicles in subsets of cortical axon terminals. J Neurochem. 2009;110:1538–1546. doi: 10.1111/j.1471-4159.2009.06251.x. [DOI] [PubMed] [Google Scholar]
- 54.Kao Y-H, et al. Evidence that certain retinal bipolar cells use both glutamate and GABA. J Comp Neurol. 2004;478:207–218. doi: 10.1002/cne.20221. [DOI] [PubMed] [Google Scholar]
- 55.Root DH, et al. Single rodent mesohabenular axons release glutamate and GABA. Nat Neurosci. 2014;17:1543–1551. doi: 10.1038/nn.3823. [DOI] [PMC free article] [PubMed] [Google Scholar]
- 56.Shabel SJ, Proulx CD, Piriz J, Malinow R. Mood regulation. GABA/glutamate co-release controls habenula output and is modified by antidepressant treatment. Science. 2014;345:1494–1498. doi: 10.1126/science.1250469. [DOI] [PMC free article] [PubMed] [Google Scholar]
- 57.Zander J-F, et al. Synaptic and vesicular coexistence of VGLUT and VGAT in selected excitatory and inhibitory synapses. J Neurosci. 2010;30:7634–7645. doi: 10.1523/JNEUROSCI.0141-10.2010. [DOI] [PMC free article] [PubMed] [Google Scholar]
- 58.Aronov D, Veit L, Goldberg JH, Fee MS. Two distinct modes of forebrain circuit dynamics underlie temporal patterning in the vocalizations of young songbirds. J Neurosci. 2011;31:16353–16368. doi: 10.1523/JNEUROSCI.3009-11.2011. [DOI] [PMC free article] [PubMed] [Google Scholar]
- 59.Goldberg JH, Fee MS. Vocal babbling in songbirds requires the basal ganglia-recipient motor thalamus but not the basal ganglia. J Neurophysiol. 2011;105:2729–2739. doi: 10.1152/jn.00823.2010. [DOI] [PMC free article] [PubMed] [Google Scholar]
- 60.Kojima S, Kao MH, Doupe AJ. Task-related “cortical” bursting depends critically on basal ganglia input and is linked to vocal plasticity. Proc Natl Acad Sci USA. 2013;110:4756–4761. doi: 10.1073/pnas.1216308110. [DOI] [PMC free article] [PubMed] [Google Scholar]
- 61.Leblois A, Bodor AL, Person AL, Perkel DJ. Millisecond timescale disinhibition mediates fast information transmission through an avian basal ganglia loop. J Neurosci. 2009;29:15420–15433. doi: 10.1523/JNEUROSCI.3060-09.2009. [DOI] [PMC free article] [PubMed] [Google Scholar]
- 62.Boettiger CA, Doupe AJ. Intrinsic and thalamic excitatory inputs onto songbird LMAN neurons differ in their pharmacological and temporal properties. J Neurophysiol. 1998;79:2615–2628. doi: 10.1152/jn.1998.79.5.2615. [DOI] [PubMed] [Google Scholar]
- 63.Bottjer SW, Brady JD, Walsh JP. Intrinsic and synaptic properties of neurons in the vocal-control nucleus IMAN from in vitro slice preparations of juvenile and adult zebra finches. J Neurobiol. 1998;37:642–658. [PubMed] [Google Scholar]
- 64.Bottjer SW. Silent synapses in a thalamo-cortical circuit necessary for song learning in zebra finches. J Neurophysiol. 2005;94:3698–3707. doi: 10.1152/jn.00282.2005. [DOI] [PubMed] [Google Scholar]
- 65.Johnson F, Sablan MM, Bottjer SW. Topographic organization of a forebrain pathway involved with vocal learning in zebra finches. J Comp Neurol. 1995;358:260–278. doi: 10.1002/cne.903580208. [DOI] [PubMed] [Google Scholar]
- 66.Luo M, Ding L, Perkel DJ. An avian basal ganglia pathway essential for vocal learning forms a closed topographic loop. J Neurosci. 2001;21:6836–6845. doi: 10.1523/JNEUROSCI.21-17-06836.2001. [DOI] [PMC free article] [PubMed] [Google Scholar]
- 67.Vates GE, Nottebohm F. Feedback circuitry within a song-learning pathway. Proc Natl Acad Sci USA. 1995;92:5139–5143. doi: 10.1073/pnas.92.11.5139. [DOI] [PMC free article] [PubMed] [Google Scholar]
- 68.Rajan K, Abbott LF, Sompolinsky H. Stimulus-dependent suppression of chaos in recurrent neural networks. Phys Rev E Stat Nonlin Soft Matter Phys. 2010;82:011903. doi: 10.1103/PhysRevE.82.011903. [DOI] [PMC free article] [PubMed] [Google Scholar]
- 69.Kimpo RR, Theunissen FE, Doupe AJ. Propagation of correlated activity through multiple stages of a neural circuit. J Neurosci. 2003;23:5750–5761. doi: 10.1523/JNEUROSCI.23-13-05750.2003. [DOI] [PMC free article] [PubMed] [Google Scholar]
- 70.Hoffmann LA, Saravanan V, Wood AN, He L, Sober SJ. Dopaminergic contributions to vocal learning. J Neurosci. 2016;36:2176–2189. doi: 10.1523/JNEUROSCI.3883-15.2016. [DOI] [PMC free article] [PubMed] [Google Scholar]
- 71.Friend DM, Kravitz AV. Working together: Basal ganglia pathways in action selection. Trends Neurosci. 2014;37:301–303. doi: 10.1016/j.tins.2014.04.004. [DOI] [PMC free article] [PubMed] [Google Scholar]
- 72.Boulland J-L, et al. Expression of the vesicular glutamate transporters during development indicates the widespread corelease of multiple neurotransmitters. J Comp Neurol. 2004;480(3):264–280. doi: 10.1002/cne.20354. [DOI] [PubMed] [Google Scholar]
- 73.Gillespie DC, Kim G, Kandler K. Inhibitory synapses in the developing auditory system are glutamatergic. Nat Neurosci. 2005;8(3):332–338. doi: 10.1038/nn1397. [DOI] [PubMed] [Google Scholar]
- 74.Goldberg JH, Adler A, Bergman H, Fee MS. Singing-related neural activity distinguishes two putative pallidal cell types in the songbird basal ganglia: Comparison to the primate internal and external pallidal segments. J Neurosci. 2010;30(20):7088. doi: 10.1523/JNEUROSCI.0168-10.2010. [DOI] [PMC free article] [PubMed] [Google Scholar]
- 75.National Research Council . Guide for the Care and Use of Laboratory Animals. 8th Ed National Academies Press; Washington, DC: 2011. [Google Scholar]


