Significance
The EHD2 protein controls the association of membrane pits termed caveolae to cell surfaces. Caveolae are implicated in muscle, pulmonary, and lipid disorders. We establish functionally, and structurally, how EHD2 cycles between an active, membrane-bound state and an inactive state in solution. We present an approach to resolve the structure of proteins in their membrane-bound state, which is difficult to obtain otherwise. A dramatic conformational change of EHD2 upon membrane binding is demonstrated. ATP binding is required for partial membrane insertion and subsequent oligomerization. In solution, internal regulatory regions inhibit the conformational change. This stringently regulated mechanistic cycle might be prototypical for a large family of proteins involved in membrane fission and may open avenues to control the process in vivo.
Keywords: EHD2, caveolae, membrane-reshaping protein, membrane-bound protein structure, infrared reflection–absorption spectroscopy
Abstract
The EH-domain–containing protein 2 (EHD2) is a dynamin-related ATPase that confines caveolae to the cell surface by restricting the scission and subsequent endocytosis of these membrane pits. For this, EHD2 is thought to first bind to the membrane, then to oligomerize, and finally to detach, in a stringently regulated mechanistic cycle. It is still unclear how ATP is used in this process and whether membrane binding is coupled to conformational changes in the protein. Here, we show that the regulatory N-terminal residues and the EH domain keep the EHD2 dimer in an autoinhibited conformation in solution. By significantly advancing the use of infrared reflection–absorption spectroscopy, we demonstrate that EHD2 adopts an open conformation by tilting the helical domains upon membrane binding. We show that ATP binding enables partial insertion of EHD2 into the membrane, where G-domain–mediated oligomerization occurs. ATP hydrolysis is related to detachment of EHD2 from the membrane. Finally, we demonstrate that the regulation of EHD2 oligomerization in a membrane-bound state is crucial to restrict caveolae dynamics in cells.
The trafficking of molecules by membrane-enclosed vesicles and organelles within cells is fundamental to cellular homeostasis. The shaping of these compartments is based on transient recruitment of specific proteins designed to resculpture the curvature of the lipid membrane. Mammalian cells express four Eps15 homology domain (EHD) proteins (EHD1–4), which are dynamin-related dimeric ATPases that peripherally associate with lipid membranes and participate in intracellular membrane trafficking processes (1). EHD1 functions at the recycling endosomes, whereas EHD3 and EHD4 regulate trafficking at the early to late endosomes (2–4). EHD2 is specifically associated with caveolae where it promotes stable cell surface association of these small invaginations of the plasma membrane (5–7). EHDs are thought to influence membrane curvature through mechanical scaffolding (8, 9). The mechanistic cycle can be separated into three distinct steps: (i) binding of dimeric EHDs to lipid membranes; (ii) assembly into ring-like oligomers that generate and/or stabilize positive membrane curvature; (iii) disassembly of the oligomers and detachment of EHDs from membranes.
Most of the structural and mechanistic insight regarding EHDs is derived from work on EHD2. Crystal structure analyses revealed that EHD2 is composed of an N-terminal GTPase domain (G domain), followed by a helical domain and a C-terminal Eps15 homology domain (EH domain) [Protein Data Bank (PDB) ID code 4CID; Fig. 1A] (8). This structure is thought to represent the EHD2 conformation in solution. It is currently not known whether significant structural changes occur upon membrane binding or oligomerization. It has been established that hydrophobic and positively charged residues at the tips of the two neighboring helical domains of dimeric EHD2 are required for membrane binding (8). Further analysis showed that these residues of the so-called lipid-binding motif insert into the membrane (9). The N-terminal residues are buried in a hydrophobic pocket of the G domain in the crystal structure. In the presence of lipid membranes, they relocate and insert into the lipid bilayer (9). Interestingly, removal of the N-terminal residues promotes stable membrane association of EHD2, suggesting a regulatory role for membrane recruitment (9). EHD2 has been found to form higher molecular-weight complexes in cells (6). The formation of these complexes was dependent on the KPFxxxNPF loop in the G domain. The G domain contains the dimerization interface and a proposed interface for oligomerization (8). EHD2 was proposed to oligomerize into ring-like assemblies around lipid membranes, resulting in a 10-fold increase in intrinsic ATPase activity and tubulation of the membrane (8). The EH domains bind on top of the opposing G domains in the EHD2 dimer crystal structure (Fig. 1A). They were proposed to inhibit oligomerization by blocking the oligomerization interface of the G domain (8).
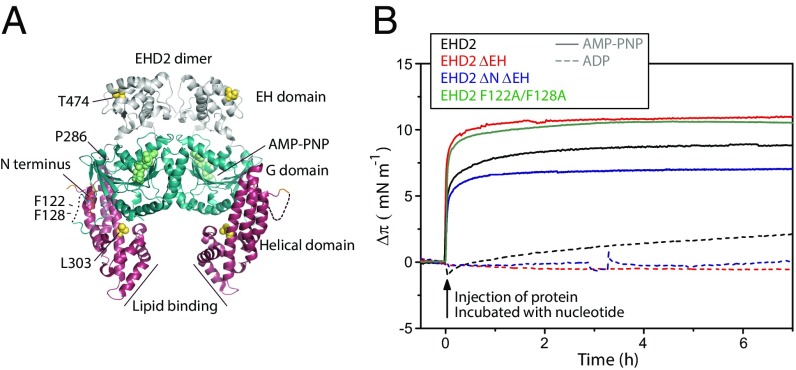
Fig. 1.
Membrane insertion of EHD2 requires ATP. (A) Structure representation of the domains and amino acids discussed in the manuscript based on the crystal structure of EHD2 (PDB ID code 4CID) (8, 9). The helical domain is depicted in purple, the flexible C-terminal EH domain in gray, and the core G domain in blue. (B) Adsorption of various EHD2 variants (wild type, EHD2 ΔEH, EHD2 ΔNΔEH, and EHD2 F122A/F128A) to lipid monolayers. The indicated proteins were incubated with an excess of AMP-PNP (solid lines) or ADP (dashed lines), respectively, before injection of the protein underneath the equilibrated lipid film (DOPC:POPS:PI(4,5)P2 = 70:27:3 mol) at time 0. The initial surface pressure of the lipid film (20–25 mN/m) was subtracted. The monolayer was stable over sufficient time for extensive IRRA spectroscopy.
In cells, EHD2 was suggested to stabilize the connection of caveolae to the plasma membrane by limiting their scission (5–7). However, the physiological role of caveolae appears to require a dynamic balance between surface connection, scission, and flattening of the caveolar membrane structures (10). This implies that the mechanistic cycle for oligomerization of EHD2 around the neck of caveolae has to be stringently controlled. Biochemical and microscopy-based characterizations of selected point mutants have revealed an intricate cooperation between several regions of EHD2 for the regulation of membrane binding and oligomerization (5, 8, 9). However, the role of ATP and the mechanism by which EHD2 binds membranes and associates into stable oligomers has remained elusive. The loss of ATP-binding ability in cells renders EHD2 completely cytoplasmic and altered ATP hydrolysis rates affect both membrane binding and the membrane sculpting ability (5, 6, 8). ATP hydrolysis was proposed to limit the oligomerization of EHD2 and promote its membrane release (8). However, mutations increasing the intrinsic ATP hydrolysis rate stabilize the membrane-bound state of EHD2, indicating that ATP hydrolysis per se is not sufficient to induce release of EHD2 from membranes (5, 6). It is yet unknown whether ATP hydrolysis is important for certain steps in the mechanistic cycle and whether the gained energy is used for structural rearrangements resulting in membrane sculpting as found for other members of the dynamin superfamily.
Here, we have used various biochemical and spectroscopy-based assays to characterize the mechanisms of EHD2 recruitment to membranes. Importantly, we established an infrared (IR) spectroscopy-based approach to demonstrate that EHD2 adopts an open conformation upon membrane binding. Through a series of in vitro experiments, we reveal that ATP binding and hydrolysis are coupled to the membrane assembly and dissociation of EHD2, respectively. We propose a refined mechanistic cycle for EHD2 that is essential for controlling caveolae dynamics, and that this mode of action could be universal to the family of EHD proteins and their distinct cellular functions.
Results
Membrane Insertion of EHD2 Requires ATP Binding.
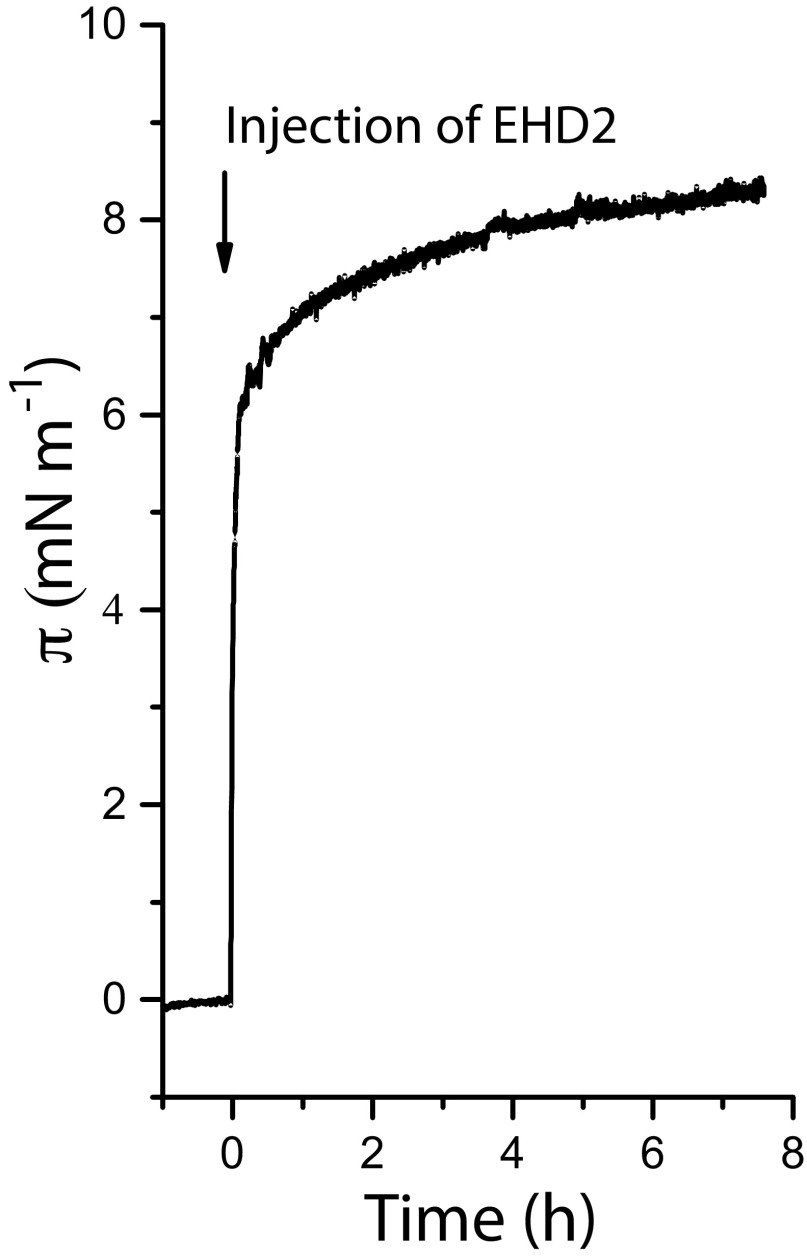
To investigate the first step in the mechanistic cycle of EHD2, the binding of purified wild-type or mutated EHD2 to a lipid monolayer was studied in an adsorption trough. For preparation of the monolayer, we used a lipid composition of 1,2-dioleoyl-sn-glycero-3-phosphocholine (DOPC)/1-palmitoyl-2-oleoyl-sn-glycero-3-phospho-l-serine (sodium salt) (POPS)/l-α-phosphatidylinositol-4,5-bisphosphate (porcine brain, ammonium salt) [PI(4,5)P2], known to bind EHD2 (8). EHD2 was preincubated with the nonhydrolyzable ATP analog AMP-PNP to mimic ATP-binding conditions. Injection of AMP-PNP–bound EHD2 under the equilibrated lipid monolayer resulted in an immediate steep rise in surface pressure (Fig. 1B). This shows that the protein spontaneously adsorbs to and partially inserts into the planar lipid monolayer. In contrast, with an excess of ADP in the protein solution, the surface pressure increased only slightly (Fig. 1B). This demonstrates that ATP is required for EHD2 to bind to membranes by partial insertion. We also found that the mutants, where the EH domain (EHD2 ΔEH 1–404) or the N terminus together with the EH domain (EHD2 ΔNΔEH, 19–404) were deleted, bound to the membrane in a nucleotide-dependent manner similar to the wild-type protein (Fig. 1B and Fig. S1). These domains are thus not essential for membrane insertion.
Fig. S1.
EHD2 bound to ATP adsorbs to a lipid monolayer, related to Fig. 1B. Adsorption of EHD2 purified in the presence of excess ATP to a preformed lipid monolayer. EHD2 was injected underneath the equilibrated lipid film (DOPC:POPS:PIP2 = 70:27:3) at time t = 0 (30 nM EHD2 in bulk, Hepes-buffered saline, pD 7.0 in D2O, T = 10 °C). The initial surface pressure of the lipid film was 23.7 mN/m and was subtracted.
ATP-Dependent Oligomerization of EHD2 Is Mediated via the Loop in the G Domain.
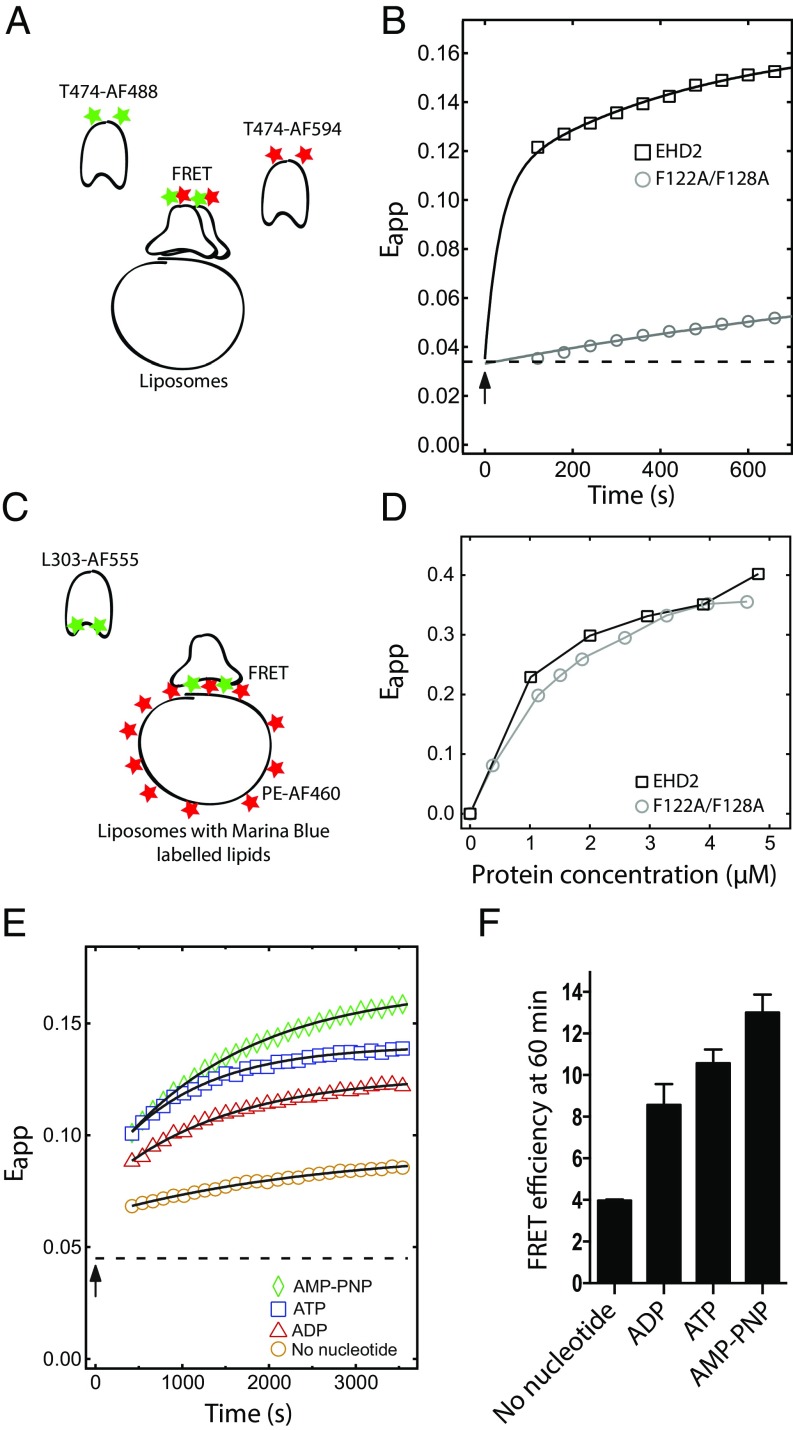
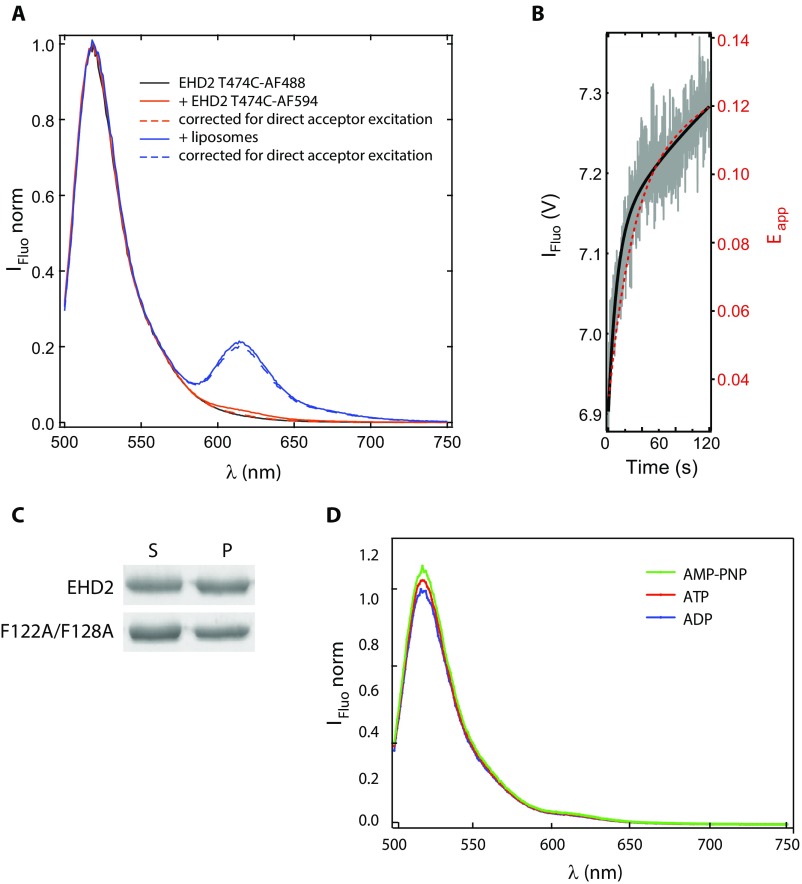
Previous studies have suggested that oligomers of EHD2 on caveolae membranes restrain caveolar dynamics (5, 6). To refine our understanding of the proposed oligomerization of EHD2 on lipid membranes in vitro, we developed an assay based on Förster resonance energy transfer (FRET) that detects oligomerization over time. For this, a cysteine residue was introduced at position 474 in the EH domain (Fig. 1A) in an EHD2 variant devoid of the three internal cysteins. Both cysteines 474 of the EHD2 dimer were then fluorescently labeled by the same partner of the FRET-pair Alexa 488 or Alexa 594 (Förster radius dFRET, ∼60 Å), yielding two populations of differently labeled EHD2 dimers (Fig. 2A), acting as donor and acceptor for FRET. Mixing of the two differently labeled populations together with nucleotides did not result in any detectable energy transfer (Fig. S2A), proving that there is neither an interchange of monomers between EHD2 dimers of the two populations, nor oligomerization under these conditions. However, when the labeled protein populations were added to liposomes in the presence of ATP, a steep increase in the apparent FRET efficiency within the first 100 s was observed (Fig. 2B). The initial steep rise in fluorescence intensity was confirmed by stopped-flow analysis (Fig. S2B). This shows that the EH domains of adjacent EHD2 dimers came into close proximity (in the range of Förster radius) upon membrane binding. The distance between the two dyes, hence the distance between the EH domains, is consistent with an assembly of EHD2 dimers in oligomers rather than binding of isolated EHD2 dimers to the liposomes. When the experiment was repeated with the F122A/F128A mutant that is proposed not to oligomerize, the apparent FRET efficiency was markedly smaller, indicating reduced oligomerization (Fig. 2B).
Fig. 2.
Oligomerization of EHD2 is ATP dependent and mediated via the loop in the G domain. (A) Schematic illustration of the FRET assay used in B and E. (B) FRET assay between EHD2 wild type or F122A/F128A labeled at T474 with AF-488 (donor) and AF-594 (acceptor) bound to AMP-PNP and mixed 1:1 (1 µM each) in presence of Folch liposomes (0.025 mg/mL). Apparent FRET efficiency (Eapp) over a time period of 600 s was determined by exciting the donor fluorophore at 488 nm, and the emission of the donor and acceptor was measured at 518 and 615 nm, respectively. The measurement starts 120 s after the addition of liposomes. Squares and circles represent recorded data, and the solid line represents a guide to the eye obtained from a biexponential fit as described in Methods. The arrow indicates liposome addition, and the dashed line, the initial apparent FRET efficiency before addition of liposomes. (C) Schematic illustration of the FRET assay used in D. (D) Binding curves for Marina Blue DHPE (1%)-labeled Folch liposomes and EHD2 or F122A/F128A protein labeled at L303 with AF-555. The indicated proteins were titrated against fixed concentration of lipids (0.2 mg/mL), and the apparent FRET efficiency was calculated by exciting the donor Marina Blue at 360 nm and measuring the emission of the donor and acceptor (AF-555–labeled protein) at 470 and 570 nm, respectively. (E) Nucleotide-dependent oligomerization of EHD2 wild type determined by FRET assay as described in B. EHD2 labeled at T474 with AF-488 and AF-594 was mixed 1:1 (1 µM each) in presence of indicated nucleotide or no nucleotide, and apparent FRET efficiency was calculated as in B over a time period of 3,600 s. The measurement starts 420 s after the addition of liposomes. Colored symbols represent recorded data, and the solid line represents the monoexponential fit. The arrow indicates liposome addition, and the dashed line, the apparent FRET efficiency before addition of liposomes. (F) Bar graph showing the quantification of apparent FRET efficiency at 3,600 s as performed in E. The data represent mean ± SD from three independent experiments.
Fig. S2.
EHD2 is a stable dimer, and the G domain loop does not affect liposome binding, related to Fig. 2. (A) FRET between two populations of EHD2 wild-type labeled at T474 with AF-488 (donor) and AF-594 (acceptor), respectively, and mixed 1 µM each in the absence or presence of liposomes made from Folch extract. The apparent FRET efficiency was determined by exciting the donor fluorophore at 488 nm, and the emission of the donor and acceptor was measured at 518 and 615 nm, respectively. (B) Fluorescence intensity (IFluo) of EHD2 labeled with AF-594 (acceptor) at T474. The acceptor fluorescence was mediated by FRET from EHD2 labeled with AF-488 (donor), which was directly excited at 488 nm. Therefore, the increasing acceptor fluorescence is in direct relation to an increasing FRET efficiency. The two differently labeled proteins (donor and acceptor) (1 µM each) were mixed with Folch liposomes (0.025 mg/mL), and data were recorded every 0.12 s for 120 s (gray). The solid black line is the fit to the recorded stopped-flow data (IFluo). The red dashed line represents the guide to the eye obtained by a biexponential fit to the FRET (Eapp) of wild-type EHD2 in Fig. 2B. The scale of FRET (Eapp) was adjusted so that the apparent FRET efficiency at the time point of 120 s matched with the fluorescence intensity of the stopped-flow data (IFluo) at 120 s. (C) Liposome cosedimentation assays of EHD2 wild type and F122A/F128A. Proteins were incubated with liposomes in presence of AMP-PNP before centrifugation and analysis of supernatant (S) and pellet (P) fractions by Coomassie-stained SDS/PAGE. (D) FRET between two populations of EHD2 wild type labeled at T474 with AF-488 (donor) and AF-594 (acceptor), respectively, mixed 1:1 (1 µM each) with AMP-PNP, ATP, or ADP in the absence of liposomes. The apparent FRET efficiency was determined as in A to determine the apparent FRET efficiency before addition of liposomes.
We verified that the lower apparent FRET efficiency for the nonoligomerizing mutant was not due to altered ability to bind to membranes (Fig. 2C). In this assay, wild-type EHD2 and F122A/F128A EHD2 were labeled with Alexa 555 as acceptor at position L303 in the helical domain and incubated with liposomes containing 1% Marina Blue-labeled phosphatidylethanolamine lipid as donor dye (Fig. 2D). The FRET in this case is an indicator for membrane binding. Our data showed that both wild-type EHD2 and EHD2 F122A/F128A proteins have the same propensity to bind to membranes. In addition, we confirmed that, in ATP-binding conditions, the F122A/F128A mutant inserts into lipid monolayers (Fig. 1B) and binds to lipid bilayers (Fig. S2C). Taken together, these results imply that the wild-type protein effectively oligomerizes when partially inserted into lipid membranes. The F122A/F128A mutant binds to membranes but does not oligomerize, showing that the KPFxxxNPF loop in the G domain is important for oligomerization. This also demonstrates that oligomerization is not required for membrane binding.
To test how oligomerization at the membrane surface is influenced by nucleotide binding, we preincubated a mix of the two populations of EHD2 labeled with different Alexa dyes together with ATP, ADP, AMP-PNP, or without nucleotides. Before the addition of liposomes, the extent of FRET was low and independent of the type of nucleotide present (Fig. S2D). Addition of liposomes resulted in a marked increase in apparent FRET efficiency. The increase was significantly higher in samples in the presence of ATP or AMP-PNP compared with samples incubated with ADP or without nucleotides (Fig. 2 E and F). This behavior is consistent with our finding in the monolayer experiments (Fig. 1B). Interestingly, the apparent FRET efficiency appeared to reach a plateau within 1 h in the presence of ATP but continued to rise for AMP-PNP. Because ATP can be hydrolyzed but AMP-PNP cannot, we conclude that the total amount of oligomerized EHD2 is limited by ATP hydrolysis. The relative increase in apparent FRET efficiency following addition of liposomes even for the samples without ATP or AMP-PNP shows that EHD2, to some degree, is capable of lipid-induced oligomerization under the in vitro conditions used. Taken together, these results confirm that ATP binding is necessary for membrane binding and that oligomerization is mediated via the KPFxxxNPF loop as a second step of the mechanistic cycle.
EHD2 Inserts into the Membrane in an Open Conformation as Determined by an Analysis Tool for IR Reflection–Absorption Spectroscopy.
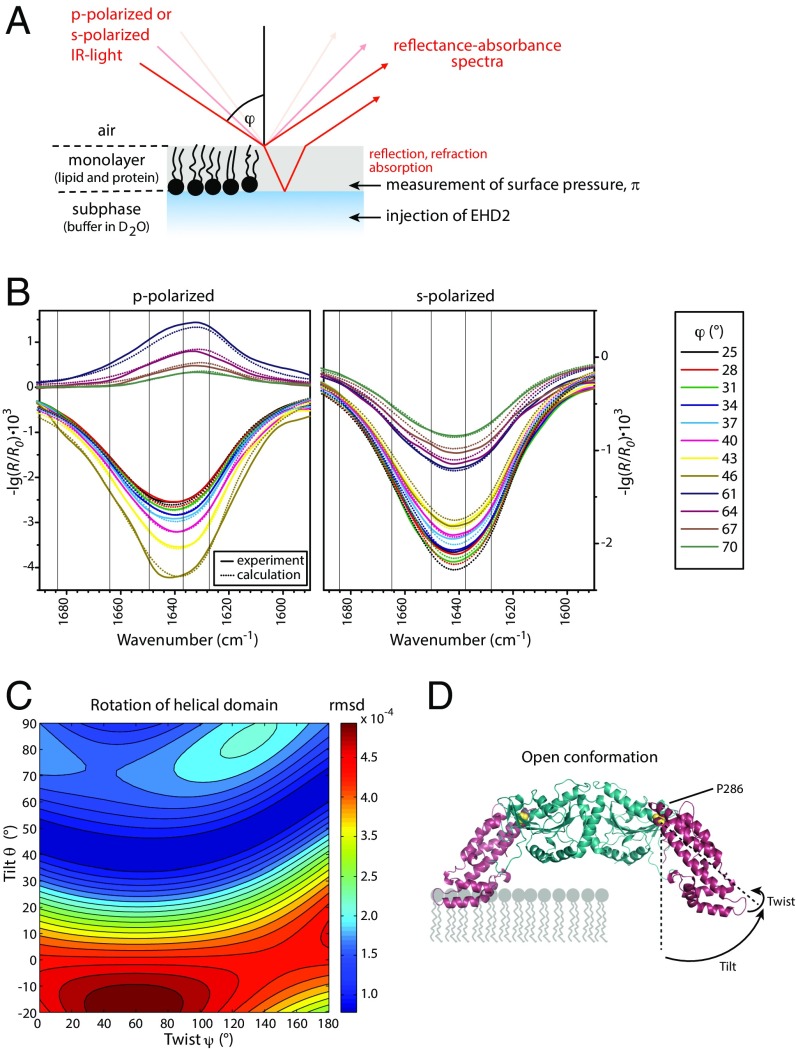
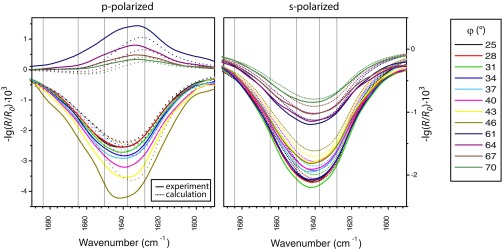
To identify the structure of membrane-bound EHD2, we established a method based on IR reflection–absorption spectroscopy (IRRAS) (11). We hereby pioneer orientational and conformational analysis of large proteins and even oligomerizing proteins by IRRAS. To acquire reflection–absorption spectra of EHD2 in its membrane-bound state, the proteins are injected underneath a lipid monolayer assembled at an air/water interface. Buffer and lipid composition as well as the initial lateral pressure are chosen to mimic natural binding conditions. Adsorption of EHD2 to the lipid layer yields a perfectly oriented sample at the air/water interface including protein and lipids. IRRA spectra of this surface film are recorded as a function of the angle of incidence (φ) and the polarization (p or s) of the incoming IR light (Fig. 3 A and B, and Fig. S3). The intensity of the IR absorption of peptide groups depends on the angle of their transition dipole moments with respect to the direction of the incoming light. Therefore, the data contain information on the orientation of all secondary structural elements with respect to the surface. Fig. 3B shows an IRRAS data set in the amide I′ spectral region for EHD2 ΔEH. This deletion mutant was investigated to reduce the complexity in the IRRAS data analysis. The depicted amide I′ bands contain contributions of all secondary structures elements of EHD2 ΔEH (18 helices, 8 β-strands, unordered loops, turns). However, computed IRRA spectra based on the crystal structure of EHD2 (Fig. 1A, Left) did not reproduce the experimental spectra (Fig. S4), indicating a large-scale conformational change upon binding to the membrane.
Fig. 3.
EHD2 binds to lipid membranes in an open conformation as determined by IRRAS. (A) Scheme of the IRRAS setup: polarized IR light is reflected at the air–water interface covered by the lipid monolayer including adsorbed proteins. The angle of incidence φ is varied from 25° to 70° in steps of 3°. The reflected IR beam is detected and converted to reflectance–absorbance spectra of the surface film. (B) Sets of IRRA spectra of EHD2 ΔEH preincubated with AMP-PNP and adsorbed to a lipid monolayer, shown in the spectral region of the amide I′ vibrations. The spectra are recorded with IR light in p-polarization (Left) and s-polarization (Right) and at different incidence angles φ (see legend). Experimental spectra (solid lines) are shown together with calculated spectra (dotted lines) of EHD2 ΔEH in open conformation, that is, with the helical domains rotated outward (θ = 44°, ψ = 40°). (C) Color-coded error map of cumulative root-mean-square deviation (rmsd) of calculated versus experimental IRRA spectra as function of the tilt angle θ and twist angle ψ of the helical domain. A good accordance between experimental and calculated spectra is colored blue and thereby denotes probable orientations of the helical domains in membrane-bound EHD2 ΔEH. The spectra shown in B result in a minimal rmsd in this error map. A bad accordance between experimental and calculated spectra is colored red and depicts improbable conformations of EHD2 ΔEH bound to lipid monolayers. Note that the crystallized conformation (PDB ID code 4CID) (θ = 0; ψ = 0) is an improbable conformation of the membrane-bound state of EHD2. (D) Predicted conformation of EHD2 ΔEH bound to the lipid monolayer with illustration of tilt angle θ and twist angle ψ of the helical domains (purple) as used in the spectra calculations. The tilt angle is the angle between the helical domain main axis (dotted line) with respect to the monolayer normal. The twist angle is the angle of rotation around the helical domain main axis. Helical domain and G domain are linked at proline 286 (yellow), which is defined as the center of rotation for helical domain tilting. Monolayer lipids are depicted schematically (gray) in scale to the protein.
Fig. S3.
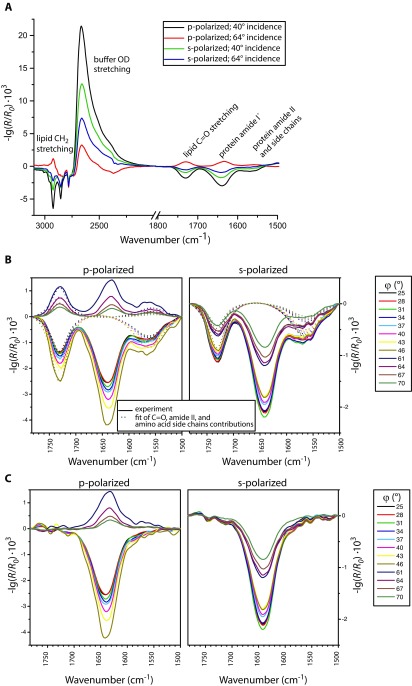
Experimental IRRA spectra of EHD2 ΔEH adsorbed to a lipid monolayer and their pretreatment for conformational analysis. (A) Experimental spectra of EHD2 ΔEH preincubated with AMP-PNP after subtraction of buffer spectra in the wavenumber range showing lipid (CH2 stretching, C=O stretching), subphase buffer (DOD stretching), and protein (amide I′, amide II, side chains) contributions. The intensity of the DOD stretching vibrations is used for determination of the monolayer thickness d. For clarity, only spectra recorded at incidence angles φ = 40° and φ = 64° are shown. (B) Complete set of experimental spectra (solid lines) in the wavenumber range chosen for the conformational analysis of EHD2 ΔEH after subtraction of a polynomial baseline. The spectra are recorded with IR light in p-polarization (Left) and s-polarization (Right) and at various incidence angles φ (see legend). The dashed lines show a fit of the C=O stretching vibrational band and the amide II and amino acid side-chain absorption band. Their subtraction leads to the spectra shown in C. These pretreated spectra are used for comparison with calculated spectra of EHD2 ΔEH in various conformations.
Fig. S4.
Experimental data versus calculated spectra assuming the conformation as in PDB ID code 4CID. Sets of IRRA spectra of EHD2 ΔEH preincubated with AMP-PNP adsorbed to a lipid monolayer, shown in the spectral region of the amide I′ vibrations. The experimental spectra are identical to those depicted in Fig. 3B (main text), Fig. S3C, and Fig. S10A. The spectra are recorded with IR light in p-polarization (Left) and s-polarization (Right) and at various incidence angles φ (see legend). Experimental spectra (solid lines) are shown together with calculated spectra (dotted lines) of EHD2 ΔEH in the conformation of the crystal structure (PDB ID code 4CID), that is, the helical domain is not rotated for the calculations of the spectra (θ = 0°, ψ = 0°). Note that experimental and calculated spectra do not match.
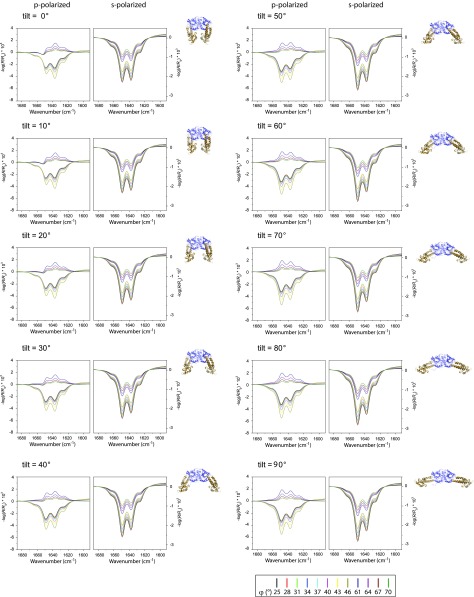
To obtain information on the nature and extent of this conformational change, we calculated theoretical IRRA spectra for many different EHD2 ΔEH conformations. For this, we assumed that each EHD2 ΔEH monomer consists of two rigid domains, the G domain and the helical domain, with their internal structure as determined by X-ray crystallography (PDB ID code 4CID). The internal structures of both domains are assumed to be invariant upon binding to the lipid monolayer. However, the helical domain is allowed to reorient with respect to the G domain, with the proline 286 acting as the hinge for consecutive tilting (angle θ) and twisting (angle ψ) rotations (as defined in Fig. 3D). The conformation of the crystal structure (PDB ID code 4CID) is chosen to be the reference for any rotation, that is, both the tilt angle θ and the twist angle ψ of the helical domain in the crystal structure are equal to zero. The G domain is fixed in the orientation it would have in the crystal structure when the lowermost tips of the helical domains are inserting into the membrane. The tilt angle θ and the twist angle ψ of the helical domain were incremented for calculating a series of IRRA spectra (Methods for details). We confirmed by theoretical calculation that the shapes and intensities of the amide I′ bands (all angles of incidence and both polarizations) of EHD2 ΔEH are sensitive to the reorientation of the helical domain (Fig. S5).
Fig. S5.
IRRA spectra are sensitive to reorientation of the helical domains of EHD2 ΔEH. Calculated IRRA spectra in the amide I′ spectral region for IR light p-polarization (Left) and s-polarization (Right) and various incidence angles φ (see legend). Spectra are calculated for EHD2 ΔEH with systematically increasing tilt angles θ of the helical domains from θ = 0° (crystal structure conformation) to θ = 90° (“open” conformation) as illustrated in the protein sketches (helical domain, gold; G domain, blue) and indicated in the subfigure legends. The orientation of the G domain is constant in all calculations. The helical domain twist angle is ψ = 0°. To reveal the amide I′ band substructure and the effect of conformational change, the spectra are calculated with a reduced bandwidth (fwhm) of their subcomponents (β-sheets, α-helices, random, turns). Note that both band shape and intensity change upon tilting of the helical domain.
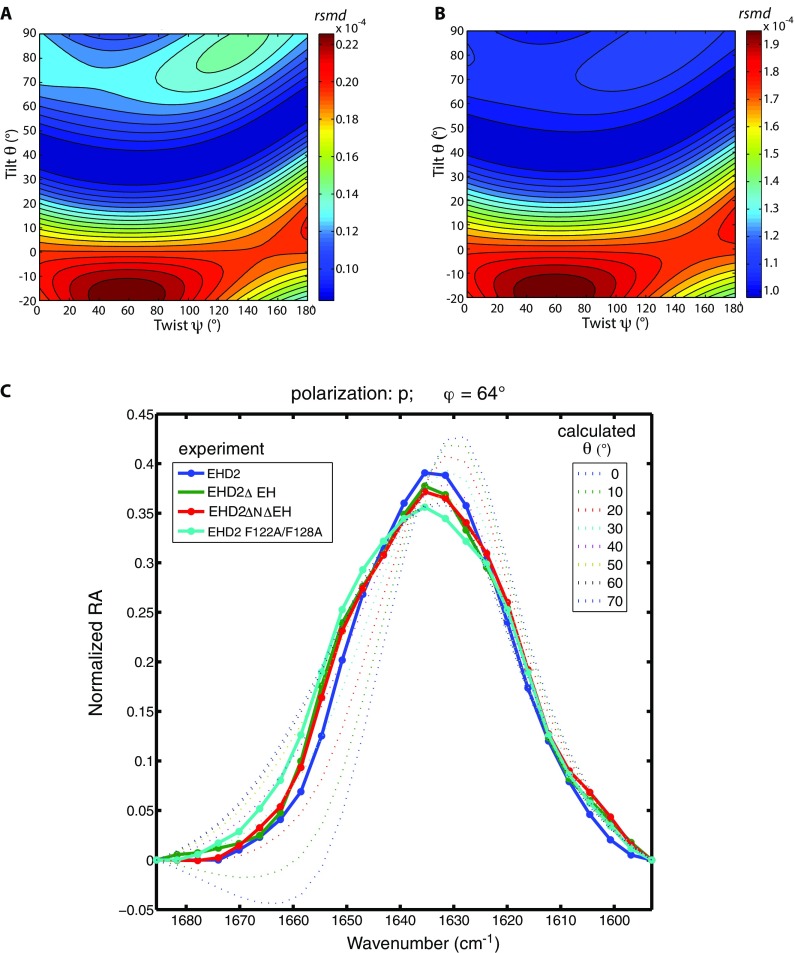
To assess how well the calculated spectra describe the experimental spectra, their difference is evaluated as root-mean-square deviation (rmsd). The cumulative rmsd of the calculated versus experimental spectra for both polarizations and all angles of incidence is color-coded in Fig. 3C (and Fig. S6 A and B for alternative error definitions). To evaluate spectra calculated for many possible orientations of the helical domain, the rmsd is presented as a function of the helical domain tilt angle θ and the twist angle ψ. A blue-colored minimum in this rmsd error map means that the spectra calculated with the respective tilt and twist angels accurately describe the experimental spectra. Such a good agreement between calculated and experimental spectra is observed for helical domain tilt angles θ of 40–60°. The dependence of the rmsd on the twist angle ψ is much less pronounced, that is, there is no pronounced minimum with varying twist angles. This is because the helical domain is mainly composed of parallel α-helices, and the rotation about an α-helix main axis is indistinguishable by IRRAS. This analysis of the IRRA spectra shows that the most plausible conformation and orientation of membrane-bound EHD2 ΔEH is with the G domains upright and the helical domains rotated outward (Fig. 3D and Fig. S7A, Right). Analysis of IRRA spectra of wild-type EHD2 and EHD2 ΔNΔEH showed that these proteins adopt an open conformation as well (Fig. S6C).
Fig. S6.
The conformational analysis is robust, and all investigated mutants of EHD2 as well as the wild type bind lipid monolayers in an open conformation. (A and B) Root-mean-square deviation (rmsd) of calculated versus experimental IRRA spectra after vector normalization of each spectrum (A) and rmsd of the experimental and calculated dichroic ratio spectra (RAp/RAs) (B). The rmsd is shown as color-coded contour map in dependence of the helical-domain tilt angle θ and twist angle ψ. In these maps, the same data are compared as in Fig. 3C (main text), but their similarity to the calculated spectra is defined in different ways. By normalizing the spectra (A) before rmsd calculation, the comparison is based on the band shapes and the intensity information is dismissed. By calculating the rmsd of the dichroic ratios (B), the spectra recorded in s-polarization contribute more to the rmsd than in the analysis of cumulative rmsd shown in Fig. 3C, and the band shape of the spectra measured in p-polarization becomes less important. Note that all different ways of comparing calculated spectra to experimental spectra lead to the same conclusion that the helical domains of EHD2 ΔEH rotate outward (θ = 40–70°) upon binding of the protein to the lipid monolayer. This proves that the developed method of conformational analysis is robust to the way the rmsd is defined. (C) The detailed conformational analysis based on IRRAS was performed on EHD2 ΔEH, but also the other mutants discussed in this report were investigated by IRRAS. To assess their conformation when bound to a lipid monolayer after preincubation with AMP-PNP, we present their vector-normalized spectra measured with p-polarized IR light at an incidence angle of φ = 64° in the amide I′ spectral region (solid lines with symbols). At this specific polarization and incidence angle, the band shape of the amide I′ band is most sensitive to reorientation of the helical domain. All experimental spectra show a similar amide I′ band shape, suggesting a similar protein conformation. Along with the experimental spectra, normalized spectra calculated for various orientations of the EHD2 helical domain (dotted lines) are shown. The twist angle is ψ = 40° in all calculations. The helical-domain tilt angle is systematically increased from θ = 0° to θ = 70° for calculating the spectra. Note that all experimental spectra compare well to spectra calculated with a helical-domain tilt of θ = 30° to 60°, that is, an open conformation of EHD2.
Fig. S7.
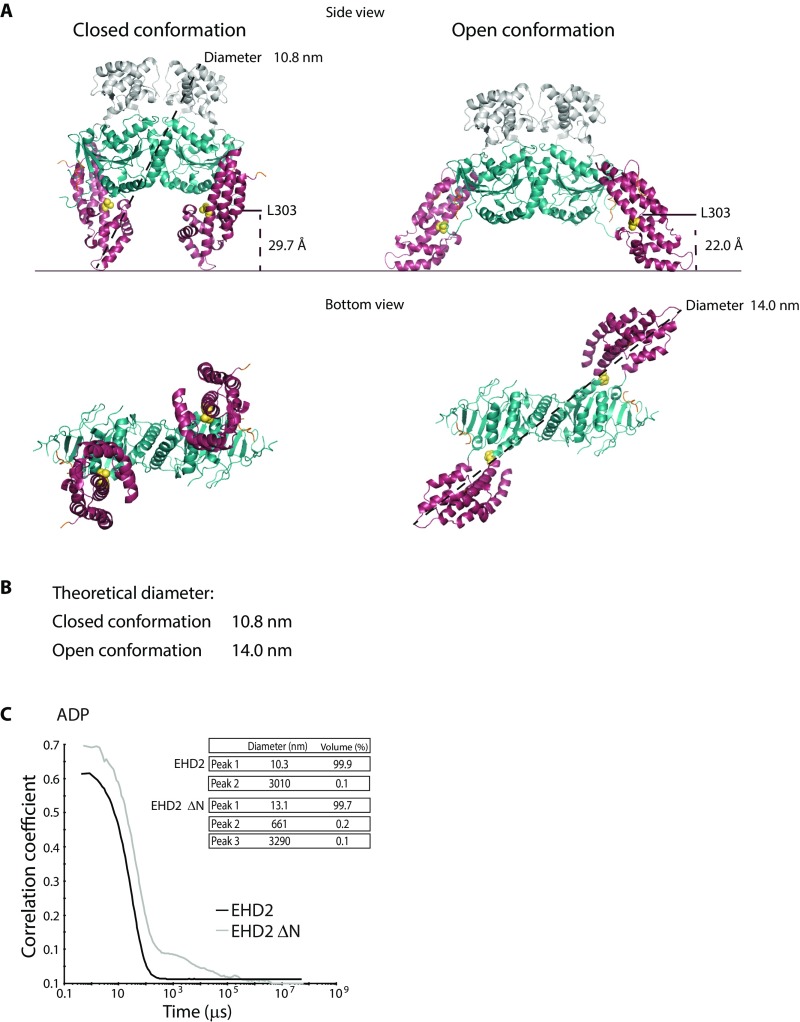
Hydrodynamic diameters of EHD2 in the closed and open conformation, related to Fig. 4. (A) Structure representation of EHD2 in closed and open conformation where the helical domains are tilted in a θ = 50° angle. The indicated distances illustrate the distance from residue L303 (labeled for FRET measurements as in Fig. 2C, main text) to the membrane interface in the two conformations. The horizontal line does not necessarily denote the actual position of the membrane after partial insertion of the lipid binding motif. The diameter is depicted in the side view for closed conformation and in the bottom view for the closed and open conformation. The distance measurements were acquired using the software PyMOL with PDB ID code 4CID as template. (B) Theoretical diameters as determined from the distances measured using PyMOL. (C) DLS autocorrelation curves of EHD2 and EHD2 ΔN in presence of ADP and table summarizing the hydrodynamic diameters deduced for EHD2 and EHD2 ΔN.
EHD2 Is Autoinhibited via the N Terminus and the EH Domain.
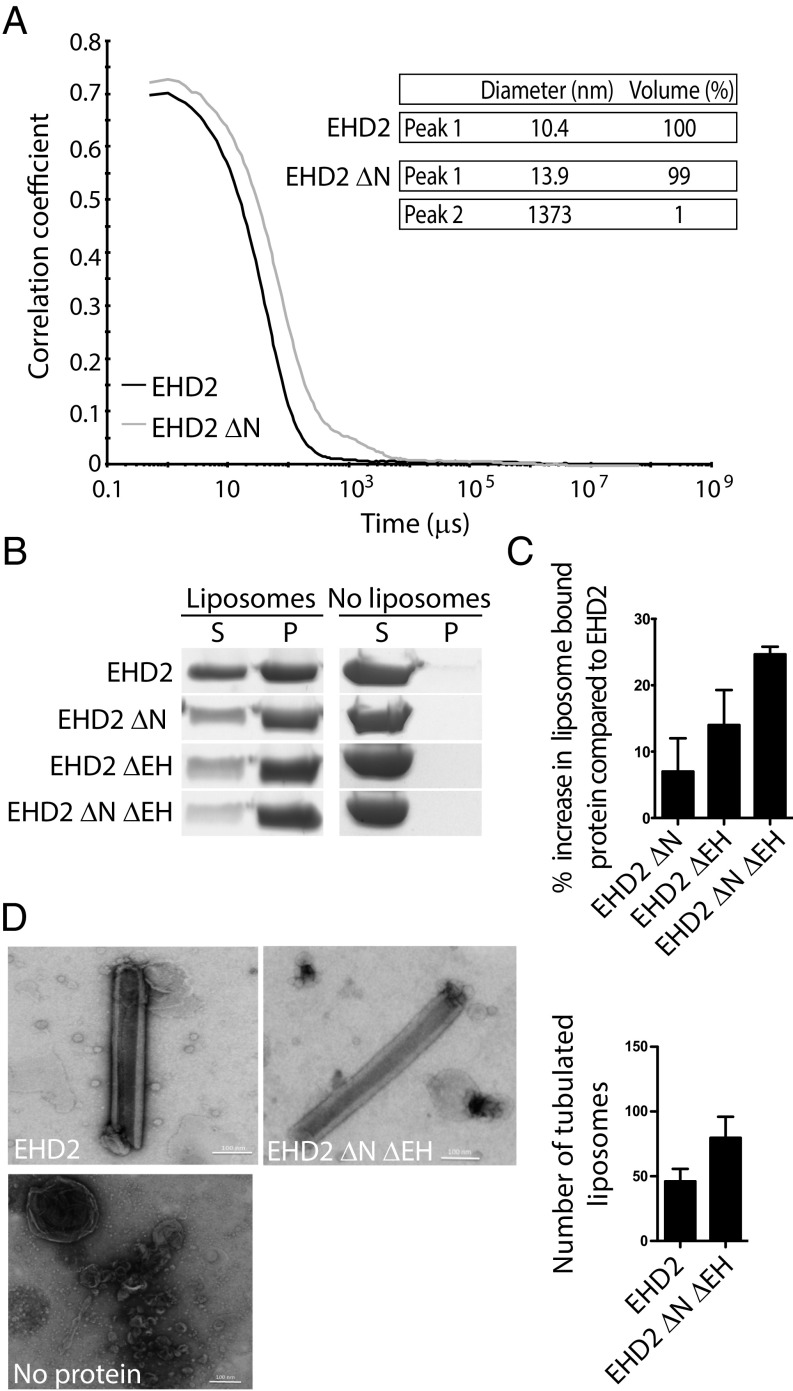
Based on previous findings, we hypothesized that the N terminus and the EH domain of EHD2 might regulate the transition from a closed autoinhibited state to the open membrane-bound state. We determined the diameter of EHD2 loaded with AMP-PNP in solution by dynamic light scattering (DLS). The hydrodynamic diameter was found to be 10.4 nm, which matches the theoretical diameter of an EHD2 dimer in the closed conformation (10.8 nm) (Fig. 4A and Fig. S7). Removal of the N terminus increased the diameter of the protein to 13.9 nm (EHD2 ΔN in Fig. 4A), which correlates with the estimated diameter of the open conformation (14.0 nm) (Fig. S7 A and B). This suggests that the N terminus is involved in restricting the open conformation of EHD2.
Fig. 4.
EHD2 is autoinhibited via the N terminus and EH domain. (A) DLS profiles of EHD2 and EHD2 ΔN in presence of AMP-PNP. Table summarizing the estimated hydrodynamic diameter and subpopulation in protein samples of EHD2 and EHD2 ΔN derived from DLS correlation curves. (B) Liposome cosedimentation assay of EHD2 or truncated EHD2 variants as indicated. Proteins (2.5 µM) were incubated with liposomes (0.5 mg/mL) before centrifugation and analysis of supernatant (S) and pellet (P) fractions by Coomassie-stained SDS/PAGE. (C) Bar graph showing the quantification of percentage of pelleted EHD2 variants compared with wild-type EHD2. The values represent mean ± SD from three independent experiments. (D) Representative scanning electron micrographs of liposomes incubated in the absence or presence of purified EHD2 or EHD2 ΔNΔEH. (Scale bars: 100 nm.) Bar graph shows the quantification of the number of tubular liposomes per 5 mm2 detected by electron microscopy, representing mean ± SD from three independent experiments.
To test whether the N terminus and the EH domains influence the extent of membrane binding of EHD2, we examined cosedimentation of the wild-type and truncated proteins with liposomes in the presence of AMP-PNP. The amount of protein bound to liposomes was significantly increased by the individual removal of the N terminus (EHD2 ΔN) or the EH domain (EHD2 ΔEH) compared with wild-type EHD2 (Fig. 4 B and C). Furthermore, the deletion of both the N terminus and the EH domain (EHD2 ΔNΔEH), resulted in an even higher extent of binding to liposomes (Fig. 4 B and C). This additive effect suggests that the removal of the regulatory regions increases the affinity to membranes by altering both the conformation and the ability of EHD2 to oligomerize. To test whether this effect would subsequently affect membrane curvature, proteins were incubated with liposomes. The amounts of tubulated liposomes were visualized using electron microscopy and quantified by counting the number of tubules per area. As previously shown (8), EHD2 was able to generate tubules from liposomes with a diameter of ∼70 nm (Fig. 4D). Interestingly, our results clearly showed that the amount of tubulated liposomes was almost doubled when the liposomes where incubated with EHD2 ΔNΔEH compared with wild-type EHD2 (Fig. 4D). Our data suggest that removal of the N terminus and EH domain primes the protein for membrane binding and oligomerization, which facilitates membrane tubulation. However, oligomerization is uncontrolled, resulting in increased membrane tubulation without these protein parts.
The Stability of Caveolae Is Mediated by the Tightly Regulated Mechanistic Cycle of EHD2.
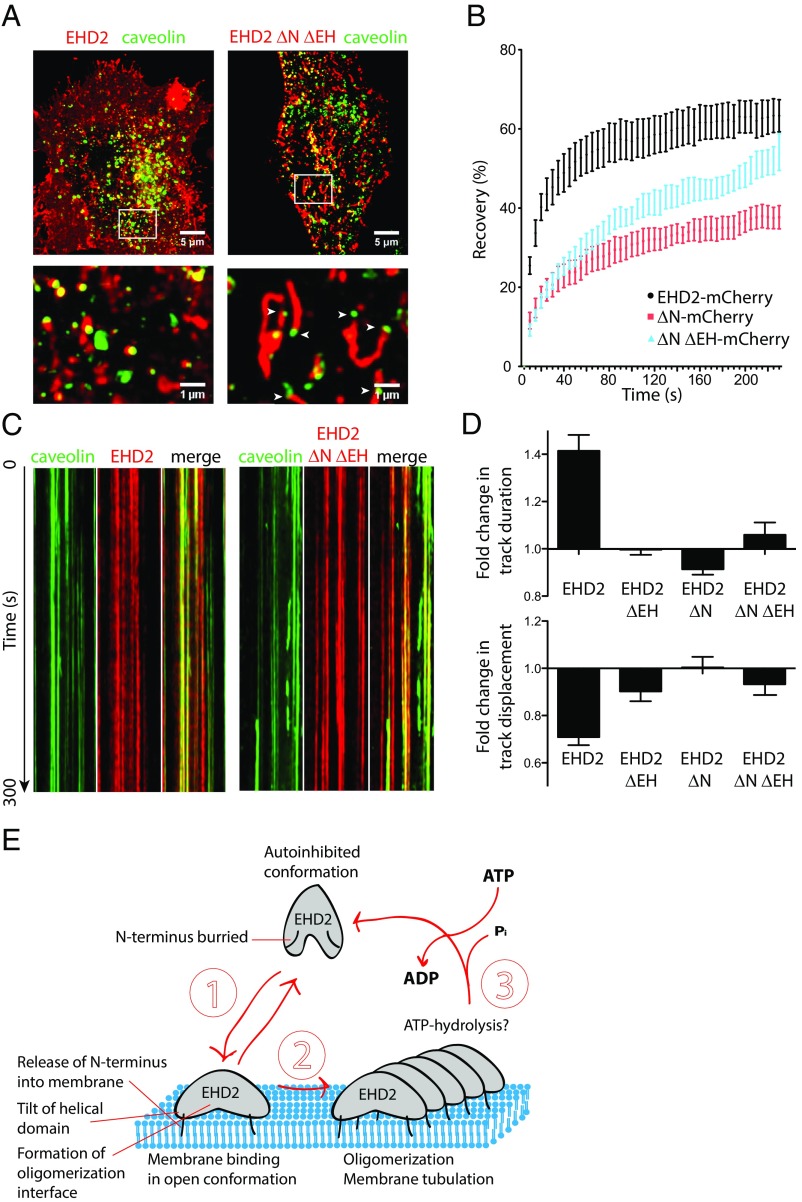
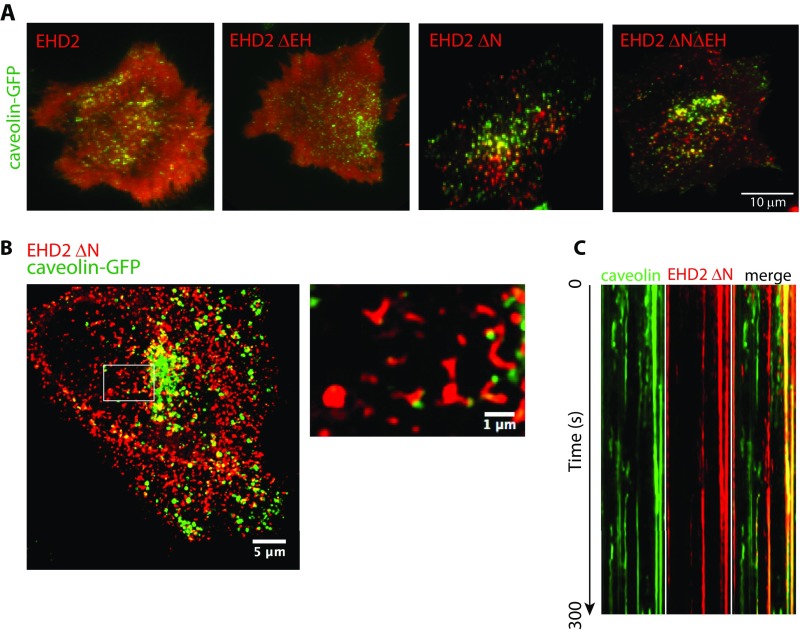
Having clarified the mechanistic cycle of EHD2, we aimed to study how EHD2 influenced caveolae in cells. For this, we expressed mCherry-tagged EHD2 and truncation mutants in caveolin-GFP FlpIn cells, where the integral membrane protein caveolin 1 was used to mark caveolae (7). High-resolution images, obtained by Airyscan confocal microscopy, showed that EHD2-mCherry intensity clustered around caveolae (Fig. 5A, Left), in agreement with previous results (5, 6). However, the EHD2 ΔNΔEH-mCherry mutant was detected in long tubular structures (Fig. 5A, Right). Notably, caveolin-GFP was frequently associated with the tip of the tubules. The EHD2 ΔNΔEH-mCherry mutant was also found in clusters in the absence of caveolae, and a large fraction of caveolae in these cells appeared to lack EHD2 ΔNΔEH-mCherry (Fig. 5A and Fig. S8A). A similar phenotype was observed for EHD2 ΔN-mCherry (Fig. S8 B and C), suggesting that both these deletion mutants were mistargeted to membrane areas without caveolin. Fluorescence recovery after photobleaching (FRAP) revealed that the ΔNΔEH and ΔN deletion mutations reduced the rate and total percentage of fluorescence recovery compared with wild-type EHD2 (Fig. 5B). This shows that EHD2 ΔNΔEH and EHD2 ΔN were more slowly exchanged at caveolae and that the mobile fraction of the deletion mutants was decreased (Fig. 5B). In agreement with our in vitro results, these data suggested that removal of the regulatory domains (the N terminus and the EH domain) led to uncontrolled membrane binding and oligomerization of the protein, resulting in unspecific membrane tubulation and caveolae neck elongation (Fig. 5A).
Fig. 5.
Caveolae dynamics are restrained through the regulated oligomerization of EHD2. (A) Representative maximum projection images of caveolin 1-GFP FlpIn cells transiently expressing EHD2-mCherry or EHD2 ΔNΔEH captured by Airyscan confocal microscopy. Pictures below show magnifications of the indicated areas. Note the tubular localization of the EHD2 ΔNΔEH mutant with caveolin1-GFP associated at the tips of the tubules indicated by white arrows. (B) FRAP of caveolin-GFP–expressing FlpIn cells transfected with EHD2-mCherry constructs. Caveolae enriched in both caveolin 1 and EHD2 wild type (black), EHD2 ΔN (red), or EHD2 ΔNΔEH (blue), were bleached, and the recovery of the fluorescent mCherry signal was traced. Intensities before and directly after bleaching were normalized to 100 or 0%, respectively. Recovery curves are representative from three independent experiments and eight bleached regions each. Error bars represent SD. (C) Kymographs from live-cell TIRF imaging of cells expressing the indicated proteins showing the movement of colocalized and individual caveolin 1 or EHD2 assemblies at the cell surface during a 300-s movie. (D) Bar graphs showing the quantification of the duration time and displacement of caveolae tracks following expression of the indicated proteins. Live-cell TIRF microscopy was used to visualize caveolae, and the Imaris software was used to analyze the data from three independent experiments with at least five cells per condition. The duration time and displacement were related to control cells, where the control was set to 1. (E) Schematic model illustrating the proposed steps involved in mechanistic cycle of EHD2. For detailed description, see Discussion.
Fig. S8.
Deletion of the N terminus of EHD2 affects caveolae stability and morphology, related to Fig. 5. (A) Florescence micrographs that represent the first frame in a live-cell TIRF experiment where caveolin 1-GFP (green) and indicated EHD2 variants (red) are coexpressed. (B) Representative maximum projection image of a caveolin 1-GFP FlpIn cell that transiently expresses EHD2 ΔN. The image was captured by Airyscan confocal microscopy, and the Inset in the image to the Right shows the magnification of the indicated area. (C) Kymograph from live-cell TIRF imaging of a cell showing the movement of colocalized (yellow) and individual caveolin 1 or EHD2 ΔN assemblies at the cell surface during a 300-s movie.
To study whether the mutants were able to stabilize caveolae at the cell surface, we used live-cell total internal reflection fluorescence (TIRF) microscopy. EHD2-mCherry colocalized with assemblies of caveolin-GFP that were stably located in the plane of the membrane (Fig. 5C), as previously shown (7). Software tracking and quantification verified that the caveolae displayed a significantly increased duration time and lowered spatial displacement at the cell surface in cells expressing EHD2-mCherry, compared with control cells without EHD2-mCherry expression (Fig. 5D). Contrarily, in cells expressing the EHD2 ΔNΔEH deletion mutant, the caveolae were not stabilized and EHD2 ΔNΔEH was detected as stable assemblies at the membrane even in areas lacking caveolin-GFP (Fig. 5C). Quantification showed that neither of the deletion mutants was able to stabilize the surface dynamics of caveolae in comparison with EHD2-mCherry (Fig. 5D). This shows that the intrinsic regulation of the mechanistic cycle of EHD2, accomplished by the N terminus and the EH domain, is essential for stabilizing caveolae.
Taking our results together, we conclude that EHD2 regulates caveolae dynamics via ATP-mediated oligomerization of an open state of the protein partially inserting into the membrane.
Discussion
Based on our results, we propose how the membrane binding and oligomerization of EHD2 is regulated. EHD2 is present in an autoinhibited state in solution, which is sustained by the regulatory N-terminal regions and the EH domains (Fig. 5E). These domains apparently prevent the formation of the open conformation and the oligomerization of EHD2 in solution. The protein binds and partially inserts into membranes in an open conformation that is formed by tilting of the helical domains and insertion of the N terminus into the membrane (step 1). In this conformation, the restraint on oligomerization is released, and the protein can form membrane-bound oligomers (step 2). Based on our finding that membrane binding (step 1) is only possible when ATP is bound to EHD2, we propose that ATP enables the open conformation and oligomerization. In the final step of the cycle, the ATP is hydrolyzed, and the oligomers are disassembled and released (step 3). The autoinhibited conformation is restored and ADP is replaced by ATP due to the high affinity and concentration of ATP in cells. How the hydrolysis step is regulated is not clear from our data. It may be that a certain membrane curvature triggers ATP hydrolysis, possibly in conjunction with the regulatory EH domain and the N-terminal stretch.
Studies of structural rearrangements in proteins at the membrane interface have been hampered by the lack of techniques providing sufficient structural details in this context. Here, we present an approach based on IRRAS. This technique, which delivers low-resolution structural information, can be applied to membrane-bound proteins. The sample is prepared by spontaneous adsorption of the protein to a preassembled lipid monolayer at the air/water interface. IRRAS can be conducted at physiological temperature, at desired buffer and lipid compositions, and at low initial protein concentrations. IRRAS has previously been used to determine the orientation of short peptides in lipid monolayers (12–17), and secondary-structure changes of proteins upon adsorption to various interfaces (18–21). Changes in the shape of IRRA bands were also used to postulate protein reorientations (22, 23). Here, we extended the analysis to accurately determine the orientation of entire domains within large peripheral membrane proteins, taking into account their internal structure. All possible orientations are systematically evaluated, and the complete experimental band contours are reproduced by calculated spectra with optimized spectral and geometrical parameters. IRRAS thereby fills a gap between crystallography, NMR, and cryo-electron microscopy, as it is not limited by protein size and as it examines the membrane-bound state of the protein.
We observed that the crystal structure of EHD2 (PDB ID code 4CID) is not consistent with the IRRAS data. We found that the helical domains in the membrane-bound EHD2 are tilted with respect to the crystal structure by θ = 40–60°. We suggest that this movement occurs around proline 286. Prolines at homologous positions in dynamins and MxA (24) mediate nucleotide-dependent conformational changes involving the straightening of the adjacent α-helices (25–28). It is interesting to note that a tilt angle of the helical domain of θ = 50–70° could align the helices 7 and 8 in EHD2 as well, depending on the extent of rotation about the other axes (Fig. S9). Combining these considerations with the results of the IRRAS analysis, we propose a reorientation of the helical domains by a twist of ψ = 40–90° and a tilt of θ = 40–50°. The determined twist angle ψ can be understood as a combination of both (i) the rotation of the helical domain about their main axes and (ii) the direction of the tilting movement in the plane of the membrane (Fig. S7A, Bottom Right). The proposed reorientation is in agreement with the crystal structure of the structurally related N-terminally deleted EHD4 (29). The described conformational change allows the N terminus of EHD2 to be inserted into the lipid layer. Likewise, the amino acids in the lipid-binding motif at the lower tip of the helical domains are facing the lipid layer in the conformation proposed here. Both the N terminus and the lipid-binding motif were previously found to insert into the lipid layer (9). The DLS experiments suggest that the removal of the N terminus might be sufficient to induce the open conformation in solution. The transition between open and closed state might be a dynamic equilibrium, rather than a conformational rearrangement of the helical domains that is caused by ATP binding.
Fig. S9.
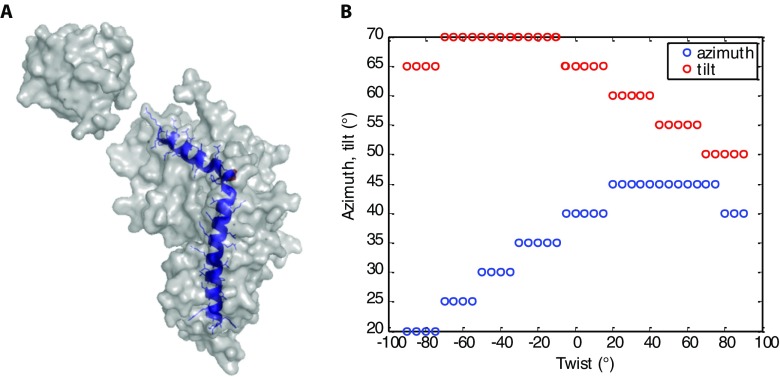
Helical-domain reorientation is consistent with straightening of helix 7 and 8. (A) Structure of EHD2 with helix 7 and 8 highlighted in blue. These helixes might straighten upon rotation of the helical domain with respect to the G domain. (B) Possible combinations of helical domain rotational angels (tilt, twist, azimuth) that lead to helix 7 and 8 alignment. The tilt angles θ overlap with the tilt angle range determined by IRRA spectra analysis in the range of twist angles from ψ = 40–90°. As a consequence, the predicted range of tilt angles of the helical domain is probably further reduced to θ = 40–50°. The tilt angle θ and twist angle ψ are defined in Fig. 3D (main text). The azimuth is the angle of rotation about the z axis (monolayer normal), after tilt and twist rotations were applied.
Our data show that EHD2 forms oligomers and that not only the previously proposed G-domain interface (8) but also the conserved KPFxxxNPF loop in the G domain plays a role in oligomerization. The idea is that the assembly of EHD2 into ring-like structures creates the scaffold that generates and/or stabilizes membrane curvature. Oligomerization was significantly enhanced in the presence of ATP, suggesting that the membrane-inserted open conformation of the EHD2 provides an optimized template for oligomerization. However, under in vitro conditions, EHD2 is to some degree capable of membrane binding and oligomerization in the absence of ATP (Fig. 2) (8). We propose that the multiple regulatory features and structural rearrangements in EHD2 provide stringency to the mechanistic cycle of EHD2 in cells.
This cycle implies a dual role for ATP. Binding of this nucleotide enables membrane insertion in the open conformation. ATP hydrolysis enables detachment of the protein from the membrane. These two steps allow EHD2 to oligomerize when bound to the membranes, but not in solution. The energy that is necessary to deform the membrane is defined by the bending modulus (∼12 kcal/mol for a typical lipid bilayer) (30). It is interesting to note that this energy appears to be drawn from the association of EHD2 into membrane-bound oligomers and not from ATP hydrolysis. Thus, the hydrolysis may primarily control the kinetics of the dissociation of the protein scaffold, which is important for a tight regulation of the process.
Overexpression of EHD2 has been shown to affect the morphology of caveolae by tubulation of the caveolae neck (5). Here, we found that the removal of regulatory N termini and the EH domains appeared to greatly enhance this phenotype and increase the dynamics of caveolae. This shows that the regulation of the formation of functional oligomers of EHD2 at the membrane is a key to controlling caveolae dynamics. Proteins in the dynamin superfamily of GTPases have been found to influence the stability of lipid bilayers in various ways (24). Although dynamins are known to promote membrane scission (31), atlastins are suggested to support membrane fusion (32) and EHDs are proposed to stabilize curved membranes (5, 6). This implies that, within the dynamin family, G-domain–mediated oligomerization and helical reorientation can be adapted to modify the equilibrium between membrane scission and fusion events or to stabilize an intermediate state.
Methods
Protein Purification and Labeling.
Mouse EHD2 constructs (wild-type, ΔN19-543, ΔEH1-404, ΔNΔEH19-404, L303CC96S C138S C356S, T474CC96S C138S C356S, F122A/F128A/L303CC96S C138S C356S F122A/F128A/T474CC96S C138S C356S) were expressed as N-terminal His6-tag fusion proteins in Escherichia coli Rosetta (DE3) and purified as previously described (8). For fluorescent labeling, the DTT was removed from the cysteine mutants using PD-10 columns (GE Healthcare). Ten-time molar excess of Alexa 488 maleimide, Alexa 555 maleimide, or Alexa 594 maleimide (Life Technologies) was added to react with the cysteine overnight at +4 °C. Excess dye was removed by dilution followed by centrifugation in Vivaspin 4 MWCO 50,000 (Sartourius). Labeled protein was separated from uncoupled dye using PD-10 columns. The samples were quantified by measuring the absorbance at λ = 280 nm (ε = 54,890 cm−1⋅M−1) and at the absorption maximum of the specific fluorescence dye (AF-555: λ = 555 nm, ε = 155,000 cm−1⋅M−1; AF-488: λ = 496 nm, ε = 71,000 cm−1⋅M−1; AF-594: λ = 590 nm, ε = 73,000 cm−1⋅M−1) for determination of the protein (60–80 µM) and the dye concentration, respectively. Comparison of both values yielded 1:1 (dye:EHD monomer) labeling ratios for all samples used here.
Surface Activity.
The surface pressure π was recorded as a function of time using a circular polytetrafluoroethylene (PTFE) trough (6-cm diameter, 0.3-cm depth) equipped with a filter paper Wilhelmy plate microbalance (Riegler and Kirstein). The trough was thermostated at 10 °C (Julabo), and the whole setup was contained in a box to prevent temperature and humidity fluctuations. The D2O buffer subphase [99.9 atom % D; Sigma-Aldrich; pD 7.0; 20 mM Hepes (high purity grade; VWR), 300 mM NaCl (pro analysis grade; Merck), 1 mM MgCl2 (pro analysis grade; Merck)] was stirred by a magnetic stirrer.
DOPC, POPS, and PI(4,5)P2 (Avanti Polar Lipids) were dissolved in chloroform/methanol (3:1, vol/vol) (Sigma-Aldrich; Fisher Scientific) and a small amount of H2O to prepare mixtures (DOPC:POPS:PIP2 = 70:27:3) with a total lipid concentration of 1 mM.
The lipid mixture was spread onto the subphase to reach initial surface pressures π0 of 20–25 mN/m. The lipid monolayer was allowed to equilibrate for 1 h before the protein solution was injected through the film using a thin syringe needle.
Proteins were incubated with a 3,000-fold excess (mol) of AMP-PNP (Calbiochem) or ADP (Sigma-Aldrich), respectively, for 20 min. The final protein concentration in the trough was 30 nM.
FRET.
FRET experiments were performed in a cuvette (1-cm path length) on a Cary Eclipse spectrophotometer (Agilent Technologies) at 20 °C. For the donor–acceptor pair AF-488 and AF-594, the donor fluorophore was excited at 488 nm and emission was recorded at 518 and 615 nm. For Marina Blue DHPE and AF555, the donor was excited at 360 nm, and emission was recorded at both 470 and 570 nm using software Cary Eclipse Scan, version 1.1. For FRET analysis between liposomes and protein, wild-type EHD2 or EHD2 F122A/F128A labeled at L303C with AF-555 was titrated against liposomes made from the Folch extract of total bovine brain lipids (Sigma-Aldrich) at final concentration of 0.025 mg/mL containing 1% Marina Blue-labeled DHPE (Life Technologies) in 25 mM Hepes-KOH (pH 7.4), 300 mM NaCl, and 1 mM MgCl2 along with 1 mM AMP-PNP (Calbiochem).
EHD2 wild-type or F122A/F128A labeled at T474C with AF-488 and AF-594 were mixed at 1:1 ratio in 25 mM Hepes-KOH (pH 7.4), 300 mM NaCl, and 1 mM MgCl2 along with 1 mM AMP-PNP. After an incubation of 600 s, Folch liposomes at a final concentration of 0.025 mg/mL were added, and after an incubation of 120 s, the apparent FRET efficiency Eapp was determined every 60 s over a time period of 600 s.
In case of nucleotide influence on oligomerization, EHD2 wild type labeled at T474 with AF-488 and AF-594 was mixed either with AMP-PNP or ATP (Sigma-Aldrich) or ADP (Sigma-Aldrich) at 1 mM concentration or no nucleotide in presence of Folch liposome (0.025 mg/mL final lipid concentration) and 1 mM MgCl2, and incubated in total for 420 s, after which the apparent FRET efficiency Eapp was determined every 120 s over a time period of 3,600 s. For quantification of different nucleotide conditions, the apparent FRET efficiency Eapp was calculated after 3,600 s as mean value with an according SD resulting from three independent experiments:
| [1] |
The apparent FRET efficiency was calculated according to Eq. 1, where Idon and Iacc indicate the fluorescence intensities of the donor and acceptor dye at the wavelength of maximum emission. The measured peak values of fluorescence emission were corrected for background fluorescence before liposome addition. Additionally, the acceptor intensities were corrected for spectral overlapping with the donor emission by fractional subtraction. As the FRET experiment is an ensemble method averaging single distance effects, the FRET efficiency determined in this manner is still labeled as apparent FRET efficiency. The time-dependent measurements (Fig. 2 B and E) were fitted with exponential functions. For the fit in Fig. 2B, a biexponential was applied, where an offset of Eapp = 0.035 (background FRET) at t = 0 s (addition of liposomes) was assumed. This yields an exemplary fit with a fast and a slow component. In Fig. 2E, the experimental data for each condition are fitted with a monoexponential function, where the rates for increase are in the range of 3⋅10−4 to 9⋅10−4 s−1. Here, the instrument time delay of 420 s impedes simulation of an initial fast component with sufficient reliability. The fits were only used to guide the eye in the respective figures.
For stopped-flow experiments, wild-type EHD2 labeled at T474C with AF-488 or AF-594, respectively, were mixed in a 1:1 ratio in 25 mM Hepes-KOH (pH 7.4), 300 mM NaCl, and 1 mM MgCl2. AMP-PNP was added to the mix to yield a final concentration of 1 mM and incubated for 600 s. The acceptor fluorescence of the labeled EHD2 (AF-594) was measured when the labeled protein mixture was mixed with Folch liposomes (0.05 mg/mL) in a 1:1 ratio using a Chirascan spectrometer equipped with a stopped-flow unit (Applied Photophysics) collecting data points every 0.12 s. The measured acceptor fluorescence was mediated by FRET from the donor, which was directly excited at 488 nm. The fluorescence intensity was recorded using a 605-nm cutoff filter (Thor Laboratories) during 120 s using the Pro-Data Chirascan software, version 4.4. The experimental fluorescence data (IFluo), measured by the stopped-flow technique, was fitted with a biexponential yielding a fast rate of 0.1 s−1 and a slow rate of 37⋅10−4 s−1.
IRRAS and Data Reduction.
IRRA spectra were recorded with the equipment as in ref. 33 comprising a Bruker Vertex 70 FTIR spectrometer equipped with an A 511 reflection unit (Bruker) including the film balance trough (Riegler and Kirstein) and an external mercury cadmium telluride (MCT) detector. The reflectance unit is enclosed in a container flushed with dry air to stabilize the humidity in the optical path. The trough system comprises the circular sample trough described above and a reference trough filled with buffer. Sample and reference spectra are recorded within short time intervals by alternately shuttling both troughs into the IR beam. The levels of the subphases were kept constant. The IR light beam was polarized linearly to be parallel (p) or perpendicular (s), and the incidence angle (φ) was varied between 25° and 70° with respect to the normal of the surface. The beam is collected after specular reflection and guided to a narrow band MCT detector. Reflectance–absorbance spectra [−lg(R/R0), with R being the single beam reflectance of the sample and R0 the single beam reflectance of the reference] were recorded with a resolution of 8 cm−1.
For each single beam spectrum, 1,000 scans or 500 scans for p-polarized light and s-polarized light, respectively, were recorded at a scanner frequency of 80 kHz. Zero filling by a factor of 2 was applied to the resulting interferogram, before fast Fourier transformation using Blackman-Harris three-term appodization. Before analysis, all spectra were set to a common baseline level by subtracting the mean intensity in the range of 1,950–1,850 cm−1. For each angle of incidence and polarization, three to six spectra were averaged and corrected by a spectrum of buffer. The spectra were cut from 1,500 to 1,783 cm−1, and a first-order polynomial baseline was subtracted. The C=O stretching vibration and the amide II and amino acid side-chain contributions were fitted with a single band each and subtracted from the spectra (Fig. S3). These pretreated experimental spectra were used for comparison with calculated spectra.
Calculation of IRRA Spectra and Comparison with Experimental Spectra.
Calculation of spectra and a comparison with experimental IRRA spectra were performed using a program written by C.S. in MATLAB.
First, a nonlinear global fit was performed to obtain input parameters [band positions 0, and full width at half-maximum (fwhm)] related to the individual vibrational components, arising from α-helices, β-sheets, unfolded loops, and turns. Then, theoretical spectra were calculated for a large number of protein conformations using these input parameters and compared with the experimental spectra. The individual steps are described in more detail below.
All reflection–absorption spectra were calculated according to the three-layer model of Kuzmin et al. (34), using the optical constants of the subphase D2O as in Bertie et al. (35) and following the procedure as in Schwieger et al. (33) to calculate spectra with multiple-bands contributions of the individual secondary-structure elements [α-helices, β-sheets (including one additional band for antiparallel β-sheets), turns, and unstructured loops]. The absorption of the IR light is not isotropic, that is, it has different components in the x, y, and z directions, depending on the orientation of the respective secondary-structure elements within the monolayer. Spectra are measured and simulated with p-polarized and s-polarized light and angles of incidence between 25° and 70° in steps of 3°. Angles between 52° and 58° were omitted. The effective film thickness d was fitted independently (33) to d = 2.5 nm.
The polarizer quality is set to Γ = 0.007 in all simulations. nmax = 1.41 is the refractive index of the interfacial film in the IR spectral range and was used as reported for lipid monolayers (36).
Nonlinear global fit for vibration components.
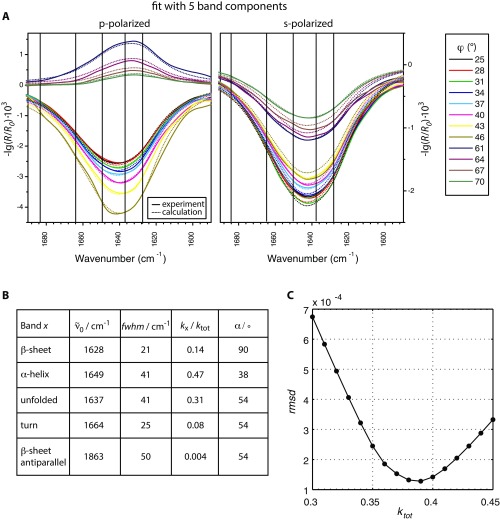
The band positions 0 and fwhm of the vibrations characteristic for the different secondary-structure elements were derived from a global fit of calculated bands with five components x (x = α-helices, β-sheet, antiparallel β-sheets, turns, and unstructured loops) to experimental spectra (Fig. S10 A and B). To account for the absorption strength of the different secondary structure components, each band component was weighted by the respective amount of amino acids organized in the given secondary-structure x (aax). The high-energy component of antiparallel β-sheets is supposed to absorb 19% of the respective low-energy component (37).
Fig. S10.
Determination of amide I′ subcomponent positions, band widths, and the optimal total absorption coefficient ktot for calculating spectra of EHD2 ΔEH. (A) Experimental IRRA spectra of monolayer-bound EHD2 ΔEH preincubated with AMP-PNP (solid lines) measured with p-polarized and s-polarized IR light at various incidence angles φ. Also shown are fitted bands (dotted lines) with five subcomponents representing contributions of β-sheets, unfolded regions, α-helices, turns, and a high-energy component of antiparallel β-sheets (from low to high wavenumbers). The position of the subcomponents 0 (vertical lines) and their full width at half-maximum (fwhm) are free-fit fitting parameters. The contribution of the subcomponents (fwhm · k) to the total amide I′ absorption is set proportional to the relative abundance of the respective secondary structure element in EHD2 ΔEH. Tilt angle θ and twist angel ψ of the α-helix and the β-sheet component and the total absorption coefficient ktot are fitting parameters. The conformation of EHD2 ΔEH is not determined from this fit. This fit is used to retrieve the band parameters 0 and fwhm, which are used as input parameters for the more complex conformational analysis of monolayer-bound EHD2 ΔEH. (B) Parameters determined from the amide I′ band fitting shown in A. 0, band position; fwhm, full width at half-maximum of the band; kx, absorption coefficient of the subcomponent x; and α, angle of the transition dipole moment with respect to the main axis of the structural element. The values of α are constant in the calculations and taken from refs. 37 and 38. α = 54° corresponds to an order parameter of S = 0 and is used for isotropically distributed structures. (C) ktot is the total absorption strength of the protein in the amide I′ region. It is specific to EHD2 ΔEH and how much of the IR light intensity is adsorbed under the specific experimental conditions. The figure depicts the minimal rmsd of repeated conformational analysis under systematic variation of ktot. The optimal ktot is determined from the minimum in this rmsd plot to ktot = 0.39. This value is further used for the final conformational analysis of EHD2 ΔEH.
Modeling protein conformations, calculation of spectra for all conformations, and comparison with experimental spectra.
For determining orientations of the helical domain within the protein that are in agreement with the experimental spectra, the EHD2 ΔEH monomer was described as an assembly of two rigid bodies: the G domain and the helical domain. The relative amount and internal orientation of the individual secondary structure elements in protein domains was taken from PDB ID code 4CID. The axes of the right-handed coordinate system and the angles used to describe the orientation of protein domains and membrane are defined as follows: x–y plane, plane of the membrane; z axis, membrane normal; x axis, axis through the G-domain centers of a EHD2 dimer; tilt θ, rotation about y axis; twist ψ, rotation about helical-domain main axes.
The spectra are calculated applying the optical parameters determined before but with a single band component for every α-helix and every β-strand including an additional component for antiparallel β-strands, one component accounting for all unordered loops, and one component for all turn structures. The absorption strength of each subcomponent is weighted according to their respective number of amino acids. The relative contribution of each subcomponent additionally varies with the orientation of the complete protein domain, resulting in amide I′ bands that change in intensity and shape with protein (domain) reorientation (Fig. S5). The optimal value of the total absorption (ktot) was determined by its systematic variation (Fig. S10C).
The set of IRRA spectra including all angles of incidence and IR-light polarizations were calculated for incremented orientations of the helical domain. The helical domain was reoriented by first applying the twist angle ψ and subsequently applying the tilt angle θ covering tilt angles from θ = −20° to 90° and twist angles from ψ = −90° to 90° in steps of 2°. The orientation of the G domain remained fixed.
For each protein conformation, the calculated spectra were compared with the experimental spectra of all angles of incidence and polarizations.
The match between the calculated set of spectra and the experimental set of spectra in the range of the amide I′ vibration from 1,610 to 1,670 cm−1 is determined as cumulative rmsd of spectra measured using p-polarized light or s-polarized light:
| [2] |
with the following:
| [3] |
where p, s, are the IR light polarizations, N is the total number of data points, φ is the incidence angle of the IR beam with respect to the interface normal, is the wavenumber, and RAexp and RAcal are the experimental and simulated reflectance-absorbance, respectively.
This yields an rmsd map as function of the helical domain tilt angle θ and twist angle ψ, where the minimum (color coded in blue) denotes the orientation of the helical domain in which the calculated spectra match the experimental spectra in the best possible way (Fig. 3C). The theoretical spectra of the initial structure (PDB ID code 4CID; tilt angle θ = 0° and twist angle ψ = 0°) are compared with the experimental spectra as an example for a bad match (Fig. S4).
DLS.
Hydrodynamic diameter of EHD2 wild-type and EHD2 ΔN in presence of AMP-PNP or ADP were analyzed by Zetasizer Nano (Malvern) instrument (measurement range, 0.3 nm to 10 µm) (measuring scattered light at 173°, 630-nm light source). Proteins samples were passed through 0.2-μm filters, and 100-μL samples at 0.5 mg/mL were measured in a BRAND UV cuvettes (Sigma-Aldrich). Each experiment consisted of 50 scans of 120 s, using Stokes–Einstein equation for analysis. The experiments were repeated twice yielding similar results regarding the main peaks: EHD2 AMP-PNP (10.4 nm, 10.4 nm), EHD2 ADP (10.4 nm, 10.3 nm), EHD2 ΔN AMP-PNP (13.9 nm, 13.4 nm), and EHD2 ΔN ADP (13.4 nm, 13.1 nm). The autocorrelation curves were fitted with software provided by the instrument manufacturer.
Liposome Cosedimentation.
The Folch fraction of total bovine brain lipids (Sigma-Aldrich) dissolved in chloroform with methanol were dried under a stream of nitrogen and resuspended in 25 mM Hepes-KOH (pH 7.4), 150 mM NaCl, and sonicated to generate liposomes. EHD2 variants (2.5 μM) were mixed with 1 mM AMP-PNP and 1 mM MgCl2 before incubating with liposomes (final lipid concentration, 0.05 mg/mL) for 10 min at room temperature. The samples were centrifuged at 100,000 × g for 20 min, and supernatant and pellet were analyzed by Coomassie-stained SDS/PAGE. EHD2 wild-type and F122A/F128A were examined as above except for protein concentration of 1 μM and final lipid concentration of 0.025 mg/mL.
In Vitro Liposome Tubulation.
Folch liposomes at final concentration of 0.05 mg/mL were incubated in the presence or absence of EHD2 or EHD2 ΔNΔEH (1 and 2 μM each) in 25 mM Hepes-KOH (pH 7.4), 150 mM NaCl, along with 1 mM AMP-PNP and 1 mM MgCl2 for 5 min. Samples (6 μL) were applied to glow discharged carbon formvar-coated EM grids (Electron Microscopy Sciences) and negative stained with 1.5% (wt/vol) filtered uranyl acetate (Electron Microscopy Sciences). Membrane morphologies were examined using a field-emission scanning electron microscope (Zeiss Merlin) with STEM mode at accelerating voltage of 30 kV and probe current of 300 pA. For quantification of tubulated liposomes, five random regions on the EM grid with total area of ∼5 mm2 were investigated, resulting in 45 images per sample type and concentration with three replicates each.
Cell Culture and Transfection.
The caveolin 1-FlpIn T-Rex HeLa cell line was generated and maintained as previously described (7). The EHD2 constructs were cloned into the pmCherry-N1 vector (Clontech). Transfection was made with Lipofectamine 2000 (Invitrogen) with a 10-fold and 7-fold reduction of DNA and Lipofectamine, respectively, from the manufacturer’s instructions, and the medium was replaced after 6 h. Caveolin 1 was induced with 0.75 ng/mL doxycycline hyclate (Sigma-Aldrich) 1 h before transfection, and the experiments were done after an additional 12–18 h. For live-cell TIRF imaging, 80,000 cells were seeded on 1.5 high-tolerance glass coverslips (25 mm) (Warner Instruments), and for Airyscan confocal microscopy, 20,000 cells were seeded on 12-mm #0 coverslips (Menzel), both 24 h before the start of transfection.
Cell Imaging and Quantification.
For live-cell TIRF microscopy, the media was replaced with live-cell media [DMEM high glucose, no phenol red (Gibco) supplemented with 10% (wt/vol) FBS (Invitrogen) and 1 mM sodium pyruvate (Gibco)] 1–2 h before the start, and the cells were incubated in a live-cell growth chamber (5% CO2, 37 °C). Images were acquired for 5 min at 3-s intervals with each fifth definitive focus using a Zeiss Axio Observer.Z1 inverted microscope that was equipped with an EMCCD camera iXon Ultra from ANDOR and an alpha Plan-Apochromat TIRF 100×/1.46 oil objective controlled by ZEN software. Representative kymographs and movies were made from TIRF imaging with ImageJ (NIH). Each kymograph represents a 20-μm section of the cell. For quantitative analysis of caveolin 1-GFP dynamics, hundreds of caveolin 1-GFP assemblies from individual time series were followed with the Imaris V7.5 (Bitplane) tracking mode as previously described (7). At least four independent movies of one or more cells were compared with control cells (only caveolin 1-GFP positive) in three independent experiments, and the data were summarized with GraphPad Prism (GraphPad Software).
Cells examined by Airyscan confocal microscopy were washed with PBS, fixed in 3% (wt/vol) PFA for 10 min, and washed again before mounting. Confocal images were acquired with a Zeiss Confocal LSM 800 with Airyscan, equipped with an Axio Observer.Z1 inverted microscope and a Plan-Apochromat 63×/1.40 oil objective controlled by ZEN software. Maximum projection images were made with ImageJ.
FRAP.
Cells were grown and transfected as for the live-cell imaging. Cells were imaged on TIRF using the Zeiss Axio Observer.Z1 inverted microscope. Regions with structures positive for both caveolin 1-GFP and EHD2-mCherry were chosen, and three prebleached images were recorded. The region of interest was photobleached for 800 ms using maximum power of the 561-nm laser. FRAP of the chosen structures was measured every 5 s for a total of 45 frames. The intensities of the bleached regions were corrected for background signal and photobleaching of the cell. Fluorescence intensity before bleaching was normalized to 100% and directly after bleaching to 0%. Data from eight bleached regions from each EHD2 construct was plotted as recovery curves using GraphPad Prism. Each experiment was repeated three times independently.
Acknowledgments
We thank Oliver Daumke and Claudio Shah at Crystallography, Max Delbrück Center for Molecular Medicine in Berlin, Germany, for providing expression vectors and Alexa 555-labeled WT EHD2. We thank the Biochemical Imaging Center Umeå and Irene Martinez, Zeiss Microscopy, and Umeå Centre for Electron Microscopy. This work was supported by the Swedish Research Council, Swedish Foundation for Strategic Research, the Kempe Foundations, and Molecular Infection Medicine Sweden. M.H. was funded by European Union Grant FP7-PEOPLE-2013-IEF 624864. C.S. acknowledges funding by Deutsche Forschungsgemeinschaft through Grant FOR1145.
Footnotes
The authors declare no conflict of interest.
This article is a PNAS Direct Submission.
This article contains supporting information online at www.pnas.org/lookup/suppl/doi:10.1073/pnas.1614066114/-/DCSupplemental.
References
- 1.Naslavsky N, Caplan S. EHD proteins: Key conductors of endocytic transport. Trends Cell Biol. 2011;21(2):122–131. doi: 10.1016/j.tcb.2010.10.003. [DOI] [PMC free article] [PubMed] [Google Scholar]
- 2.Grant B, et al. Evidence that RME-1, a conserved C. elegans EH-domain protein, functions in endocytic recycling. Nat Cell Biol. 2001;3(6):573–579. doi: 10.1038/35078549. [DOI] [PubMed] [Google Scholar]
- 3.Lin SX, Grant B, Hirsh D, Maxfield FR. Rme-1 regulates the distribution and function of the endocytic recycling compartment in mammalian cells. Nat Cell Biol. 2001;3(6):567–572. doi: 10.1038/35078543. [DOI] [PubMed] [Google Scholar]
- 4.Shao Y, et al. Pincher, a pinocytic chaperone for nerve growth factor/TrkA signaling endosomes. J Cell Biol. 2002;157(4):679–691. doi: 10.1083/jcb.200201063. [DOI] [PMC free article] [PubMed] [Google Scholar]
- 5.Morén B, et al. EHD2 regulates caveolar dynamics via ATP-driven targeting and oligomerization. Mol Biol Cell. 2012;23(7):1316–1329. doi: 10.1091/mbc.E11-09-0787. [DOI] [PMC free article] [PubMed] [Google Scholar]
- 6.Stoeber M, et al. Oligomers of the ATPase EHD2 confine caveolae to the plasma membrane through association with actin. EMBO J. 2012;31(10):2350–2364. doi: 10.1038/emboj.2012.98. [DOI] [PMC free article] [PubMed] [Google Scholar]
- 7.Mohan J, Morén B, Larsson E, Holst MR, Lundmark R. Cavin3 interacts with cavin1 and caveolin1 to increase surface dynamics of caveolae. J Cell Sci. 2015;128(5):979–991. doi: 10.1242/jcs.161463. [DOI] [PubMed] [Google Scholar]
- 8.Daumke O, et al. Architectural and mechanistic insights into an EHD ATPase involved in membrane remodelling. Nature. 2007;449(7164):923–927. doi: 10.1038/nature06173. [DOI] [PubMed] [Google Scholar]
- 9.Shah C, et al. Structural insights into membrane interaction and caveolar targeting of dynamin-like EHD2. Structure. 2014;22(3):409–420. doi: 10.1016/j.str.2013.12.015. [DOI] [PMC free article] [PubMed] [Google Scholar]
- 10.Parton RG, del Pozo MA. Caveolae as plasma membrane sensors, protectors and organizers. Nat Rev Mol Cell Biol. 2013;14(2):98–112. doi: 10.1038/nrm3512. [DOI] [PubMed] [Google Scholar]
- 11.Mendelsohn R, Mao G, Flach CR. Infrared reflection-absorption spectroscopy: Principles and applications to lipid-protein interaction in Langmuir films. Biochim Biophys Acta. 2010;1798(4):788–800. doi: 10.1016/j.bbamem.2009.11.024. [DOI] [PMC free article] [PubMed] [Google Scholar]
- 12.Xu Z, Brauner JW, Flach CR, Mendelsohn R. Orientation of peptides in aqueous monolayer films. Infrared reflection-absorption spectroscopy studies of a synthetic amphipathic beta-sheet. Langmuir. 2004;20(9):3730–3733. doi: 10.1021/la0304316. [DOI] [PubMed] [Google Scholar]
- 13.Flach CR, Gericke A, Mendelsohn R. Quantitative determination of molecular chain tilt angles in monolayer films at the air/water interface: Infrared reflection/absorption spectroscopy of behenic acid methyl ester. J Phys Chem B. 1997;101(1):58–65. [Google Scholar]
- 14.Gericke A, Flach CR, Mendelsohn R. Structure and orientation of lung surfactant SP-C and L-alpha-dipalmitoylphosphatidylcholine in aqueous monolayers. Biophys J. 1997;73(1):492–499. doi: 10.1016/S0006-3495(97)78087-1. [DOI] [PMC free article] [PubMed] [Google Scholar]
- 15.Ulrich W-P, Vogel H. Polarization-modulated FTIR spectroscopy of lipid/gramicidin monolayers at the air/water interface. Biophys J. 1999;76(3):1639–1647. doi: 10.1016/S0006-3495(99)77323-6. [DOI] [PMC free article] [PubMed] [Google Scholar]
- 16.Cornut I, Desbat B, Turlet JM, Dufourcq J. In situ study by polarization modulated Fourier transform infrared spectroscopy of the structure and orientation of lipids and amphipathic peptides at the air-water interface. Biophys J. 1996;70(1):305–312. doi: 10.1016/S0006-3495(96)79571-1. [DOI] [PMC free article] [PubMed] [Google Scholar]
- 17.Hoernke M, Falenski JA, Schwieger C, Koksch B, Brezesinski G. Triggers for β-sheet formation at the hydrophobic-hydrophilic interface: High concentration, in-plane orientational order, and metal ion complexation. Langmuir. 2011;27(23):14218–14231. doi: 10.1021/la203016z. [DOI] [PubMed] [Google Scholar]
- 18.Meinders MBJ, van den Bosch GGM, de Jongh HHJ. IRRAS, a new tool in food science. Trends Food Sci Technol. 2000;11(6):218–225. [Google Scholar]
- 19.Martin AH, Meinders MBJ, Bos MA, Stuart MAC, van Vliet T. Conformational aspects of proteins at the air/water interface studied by infrared reflection-absorption spectroscopy. Langmuir. 2003;19(7):2922–2928. [Google Scholar]
- 20.Banc A, et al. Structure and orientation changes of omega- and gamma-gliadins at the air-water interface: A PM-IRRAS spectroscopy and Brewster angle microscopy study. Langmuir. 2007;23(26):13066–13075. doi: 10.1021/la702037k. [DOI] [PubMed] [Google Scholar]
- 21.Brehmer T, et al. Negatively charged phospholipids trigger the interaction of a bacterial Tat substrate precursor protein with lipid monolayers. Langmuir. 2012;28(7):3534–3541. doi: 10.1021/la204473t. [DOI] [PubMed] [Google Scholar]
- 22.Meister A, et al. Insertion of lipidated Ras proteins into lipid monolayers studied by infrared reflection absorption spectroscopy (IRRAS) Biophys J. 2006;91(4):1388–1401. doi: 10.1529/biophysj.106.084624. [DOI] [PMC free article] [PubMed] [Google Scholar]
- 23.Mackenzie CD, et al. Ranaspumin-2: Structure and function of a surfactant protein from the foam nests of a tropical frog. Biophys J. 2009;96(12):4984–4992. doi: 10.1016/j.bpj.2009.03.044. [DOI] [PMC free article] [PubMed] [Google Scholar]
- 24.Praefcke GJ, McMahon HT. The dynamin superfamily: Universal membrane tubulation and fission molecules? Nat Rev Mol Cell Biol. 2004;5(2):133–147. doi: 10.1038/nrm1313. [DOI] [PubMed] [Google Scholar]
- 25.Byrnes LJ, et al. Structural basis for conformational switching and GTP loading of the large G protein atlastin. EMBO J. 2013;32(3):369–384. doi: 10.1038/emboj.2012.353. [DOI] [PMC free article] [PubMed] [Google Scholar]
- 26.Gao S, et al. Structural basis of oligomerization in the stalk region of dynamin-like MxA. Nature. 2010;465(7297):502–506. doi: 10.1038/nature08972. [DOI] [PubMed] [Google Scholar]
- 27.Roux A, Uyhazi K, Frost A, De Camilli P. GTP-dependent twisting of dynamin implicates constriction and tension in membrane fission. Nature. 2006;441(7092):528–531. doi: 10.1038/nature04718. [DOI] [PubMed] [Google Scholar]
- 28.Marks B, et al. GTPase activity of dynamin and resulting conformation change are essential for endocytosis. Nature. 2001;410(6825):231–235. doi: 10.1038/35065645. [DOI] [PubMed] [Google Scholar]
- 29.Melo AA, et al. Structural insights into the activation mechanism of dynamin-like Eps15-homology domain proteins. Proc Natl Acad Sci USA. 2017;114:5629–5634. doi: 10.1073/pnas.1614075114. [DOI] [PMC free article] [PubMed] [Google Scholar]
- 30.Kozlov MM, et al. Mechanisms shaping cell membranes. Curr Opin Cell Biol. 2014;29:53–60. doi: 10.1016/j.ceb.2014.03.006. [DOI] [PMC free article] [PubMed] [Google Scholar]
- 31.Faelber K, et al. Structural insights into dynamin-mediated membrane fission. Structure. 2012;20(10):1621–1628. doi: 10.1016/j.str.2012.08.028. [DOI] [PubMed] [Google Scholar]
- 32.Orso G, et al. Homotypic fusion of ER membranes requires the dynamin-like GTPase atlastin. Nature. 2009;460(7258):978–983. doi: 10.1038/nature08280. [DOI] [PubMed] [Google Scholar]
- 33.Schwieger C, Chen B, Tschierske C, Kressler J, Blume A. Organization of T-shaped facial amphiphiles at the air/water interface studied by infrared reflection absorption spectroscopy. J Phys Chem B. 2012;116(40):12245–12256. doi: 10.1021/jp306612k. [DOI] [PubMed] [Google Scholar]
- 34.Kuzmin VL, Romanov VP, Mikhailov AV. Light-reflection on the boundary of liquid-systems and surface-layer structure. Opt Spektrosk. 1992;73(1):3–47. [Google Scholar]
- 35.Bertie JE, Ahmed MK, Eysel HH. Infrared intensities of liquids. 5. Optical and dielectric-constants, integrated-intensities, and dipole-moment derivatives of H2O and D2O at 22-degrees-C. J Phys Chem. 1989;93(6):2210–2218. [Google Scholar]
- 36.Flach CR, Gericke A, Mendelsohn R. Quantitative determination of molecular chain tilt angles in monolayer films at the air/water interface: Infrared reflection/absorption spectroscopy of behenic acid methyl ester. J Phys Chem B. 1997;101(1):58–65. [Google Scholar]
- 37.Buffeteau T, et al. Anisotropic optical constants of α-helix and β-sheet secondary structure in the infrared. J Phys Chem B. 2000;104(18):4537–4544. [Google Scholar]
- 38.Marsh D, Müller M, Schmitt F-J. Orientation of the infrared transition moments for an α-helix. Biophys J. 2000;78(5):2499–2510. doi: 10.1016/S0006-3495(00)76795-6. [DOI] [PMC free article] [PubMed] [Google Scholar]


