Significance
Food is medicine, and diet impacts the risk for and progression of age-related macular degeneration AMD, but we have few clues as to why. We found that wild-type mice fed a high-glycemic-index diet similar in composition to the Western diet developed a disease state that resembles dry AMD. To gain insight into the mechanism, we used LC-MS– and NMR-based metabolomics to discover diet-, metabolic-, and AMD-associated phenotypes. These studies revealed changes in the gut microbiota that altered the production of metabolites that protected against AMD, including serotonin. Changing the diet to a low-glycemic-index diet, even late in life, arrested the development of AMD, offering dietary interventions for AMD.
Keywords: age-related macular degeneration, glycemic index, advanced glycation end-product, gut microbiome, metabolomics
Abstract
Age-related macular degeneration (AMD) is the major cause of blindness in developed nations. AMD is characterized by retinal pigmented epithelial (RPE) cell dysfunction and loss of photoreceptor cells. Epidemiologic studies indicate important contributions of dietary patterns to the risk for AMD, but the mechanisms relating diet to disease remain unclear. Here we investigate the effect on AMD of isocaloric diets that differ only in the type of dietary carbohydrate in a wild-type aged-mouse model. The consumption of a high-glycemia (HG) diet resulted in many AMD features (AMDf), including RPE hypopigmentation and atrophy, lipofuscin accumulation, and photoreceptor degeneration, whereas consumption of the lower-glycemia (LG) diet did not. Critically, switching from the HG to the LG diet late in life arrested or reversed AMDf. LG diets limited the accumulation of advanced glycation end products, long-chain polyunsaturated lipids, and their peroxidation end-products and increased C3-carnitine in retina, plasma, or urine. Untargeted metabolomics revealed microbial cometabolites, particularly serotonin, as protective against AMDf. Gut microbiota were responsive to diet, and we identified microbiota in the Clostridiales order as being associated with AMDf and the HG diet, whereas protection from AMDf was associated with the Bacteroidales order and the LG diet. Network analysis revealed a nexus of metabolites and microbiota that appear to act within a gut–retina axis to protect against diet- and age-induced AMDf. The findings indicate a functional interaction between dietary carbohydrates, the metabolome, including microbial cometabolites, and AMDf. Our studies suggest a simple dietary intervention that may be useful in patients to arrest AMD.
Age-related macular degeneration (AMD) is the leading cause of irremediable blindness in the industrialized world, with 200 million cases projected by 2020, at a cost of $300 billion (1, 2). Dry AMD accounts for the great majority of cases and is associated with photoreceptor cell loss, often preceded by compromise to the retina pigment epithelium (RPE) cells that nourish and remove waste from the photoreceptors. The etiology of AMD remains an enigma but is clearly multifactorial. Stresses associated with AMD include environment, age, and genetics (3). Frustratingly, there are no early biomarkers to anticipate AMD, and there are no therapies or cure.
Recently, we and others observed in epidemiologic studies that, in addition to micronutrients (4–6), macronutrient quality [e.g., consuming a diet with a high glycemic index (GI)] is a significant risk factor for AMD onset and/or progress in nondiabetic humans (7–9). The GI appears to be an attractive dietary intervention target, because simple replacement of small amounts of high-index foods (such as white bread) with lower-index foods (such as whole-grain bread) can significantly reduce glycemic peaks without requiring a change in overall dietary patterns (7). However, human tests to show that these epidemiologic data should be translated into clinical practice or exploited to arrest or reverse AMD await more information about and better understanding of the relationship between AMD and the dietary GI. Henceforth, to emphasize the role of carbohydrates in physiologic responses, we use the term “glycemia.” Americans consume high-glycemia diets, as reflected in the obesity epidemic in this country.
Two publications indicate models in wild-type mice demonstrating that the consumption of lower-glycemia diets is associated with delayed age-related features of AMD (AMDf), but an ability to arrest incipient disease was not an objective of these studies, nor were metabolic alterations that explain the glycemia-AMD relations indicated. Increased levels of advanced glycation end products (AGEs), i.e., covalent posttranslational oxidative and nonoxidative modifications of proteins by sugar-derived metabolites, were observed in the mice fed a high-glycemia (HG) diet (hereafter, “HG mice”) (10, 11). AGEs are cytotoxic (12), and this cytotoxicity is corroborated by the accumulation of AGEs in AMD. Several other age-related diseases, namely diabetes, cardiovascular, neurodegenerative, and inflammatory disease (13), are also associated with accumulation of AGEs, although the diseases are rarely coincident, implying that each has a unique etiology or combinations of etiologies. In this work, we focus on AMDf. We hypothesized that consuming a low-glycemia (LG) diet could be used not only to delay the onset and progress of AMDf but also to arrest AMD if animals were switched from an HG to an LG diet. Further, these salutary effects would involve altered metabolism, perhaps also including the microbiome. Additionally, such metabolomic investigation would lead to biomarkers. Having biomarkers and models in which AMDf development and progression can be monitored would facilitate diagnosis and prognosis as well as further understanding of diet–AMD pathomechanistic etiologies (3).
Despite lacking a macula, the mouse retina shows many AMDf and has been useful for relating risk factors for AMD, including cigarette smoking, diet, and inflammation (10, 14–18). Here we tested the hypothesis that changing from an HG to an LG diet even during maturity can delay or arrest AMDf. We also elucidated functional interactions between dietary glycemia, AMDf, the plasma and urinary metabolomes, and the gut microbiome. These findings resulted in the identification of apparent biomarkers and mechanistic insights into the relationship between AMDf and dietary glycemia.
Results
Effects of Diet on Glycemic Metabolism.
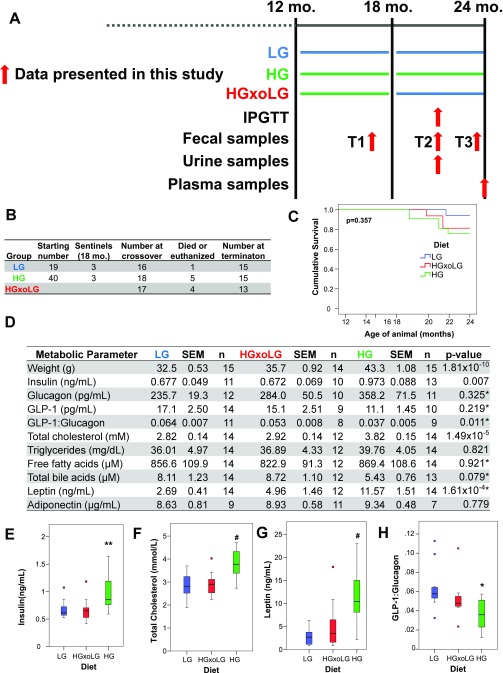
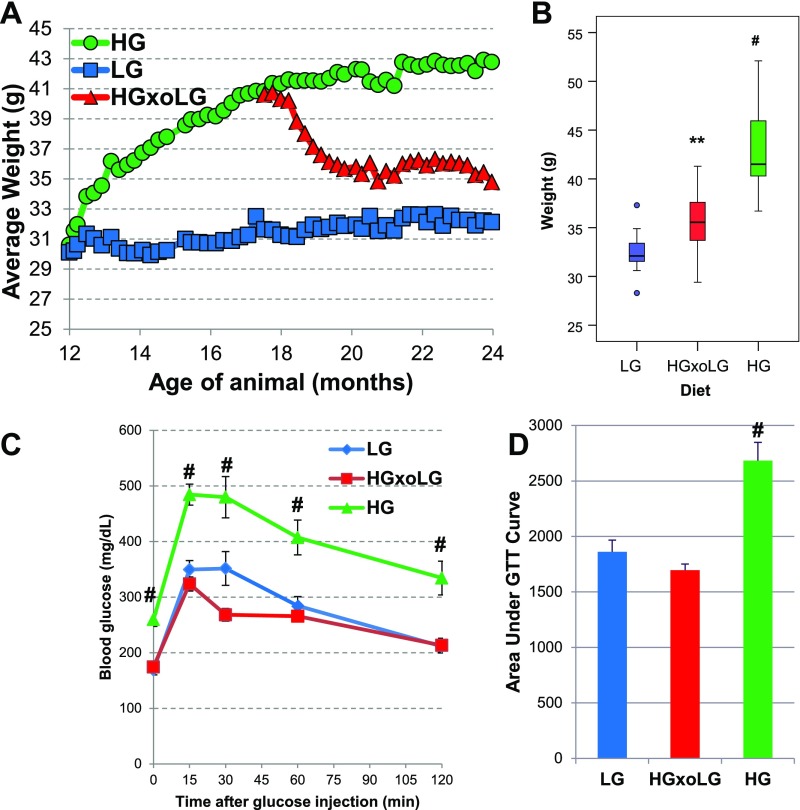
To evaluate the effects of dietary glycemia on development of age-related eye disease, we fed middle-aged (12-mo-old) mice HG and LG diets until they reached old age (24 mo). The HG and LG diets differed only in the ratio of amylose/amylopectin starches and were isocaloric (Methods) (10, 19). Exchanging amylose for amylopectin increases the GI of the diet. To seek proof of principle that age-related HG-diet–induced phenotypes could be delayed or reversed, half of the HG mice consumed the HG diet for 6 mo and then were transferred to the LG diet (hereafter, “HGxoLG mice”) for the last 6 mo of life (see schematic in Fig. S1A). All mice gained weight on their study diet, but HG mice gained weight more rapidly than the mice fed the LG diet (hereafter, “LG mice”) (Fig. S2 A and B). The LG and HGxoLG groups were normoglycemic, whereas HG mice had impaired 6-h fasting glucose, impaired glucose tolerance, and increased fasting insulin levels, indicating insulin resistance (Figs. S1 D and E and S2 C and D) (19, 20). However, based on the observations that the extent of hyperglycemia is at least twofold less than in diabetic mice and that the downward slope of the i.p. glucose tolerance test (IPGTT) curves in the HG versus LG mice indicates only partial glucose intolerance, it appears that the mice are nondiabetic (21, 22). The weight of the HGxoLG mice decreased, eventually stabilizing around 10% heavier than LG mice (Figs. S1D and S2B). HG mice also had significantly higher levels of plasma total cholesterol and plasma leptin than LG and HGxoLG mice, telegraphing a glucose-elicited alteration in lipid metabolism (Fig. S1 D, F, and G). Consistent with better regulation of glucose-associated metabolism, the glucagon-like peptide 1 (GLP-1):glucagon ratio, a measure of anti-hyperglycemic control, was increased in LG and HGxoLG mice relative to HG mice (Fig. S1 D and H). Other metabolic analytes often associated with obesity and metabolic dysfunction did not differ significantly in the HG and LG groups (Fig. S1D). Nine of the HG or HGxoLG mice died, whereas only a single LG animal died during this study (Fig. S1 B and C).
Fig. S1.
Outline of animal-feeding study, samples collections, animal weights, survival, and metabolic parameters. (A) Singly housed 12-mo-old male mice were group pair-fed either LG (blue) or HG (green) diets. At age 18 mo, half of the HG-fed mice had their diets changed to LG diets (HGxoLG). IPGTTs were performed after dietary change. Fecal, urine, and plasma samples were collected at the indicated times. (B) Numbers of mice in different dietary groups and attrition over time. (C) Kaplan–Meier survival plots for mice in the different dietary groups. All surviving mice were killed at age 24 mo. No statistically significant differences in survival rates were observed, as assessed by the log-rank test. (D) Metabolic parameters of mice in different dietary groups. All measurements taken from fasting plasma samples of mice at age 24 mo. (E–H) Quantification of fasting plasma levels of insulin (E), total cholesterol (F), leptin (G), and GLP-1:glucagon ratio (H) in mice at the end of study. Insulin, cholesterol, and leptin were all significantly elevated in HG mice, consistent with diet-induced metabolic syndrome, but were indistinguishable between LG and HGxoLG mice, despite differences in body weight, indicating metabolic reprogramming. The reduced GLP-1:glucagon ratio in HG mice is consistent with reduced GLP-1 secretion from the intestine. Statistics are one-way ANOVA except as indicated by asterisk, which are Kruskal–Wallis nonparametric test. Statistics: *P < 0.05; **P < 0.01; #P < 0.001. In A–C sample sizes at the beginning of the study were n = 20 (HG), n = 19 (LG), n = 18 (HGxoLG); sample sizes at the end of the study were n = 15 (HG and LG), n = 13 (HGxoLG). Sample sizes for E–H are shown in D.
Fig. S2.
Reversal of metabolic dysfunction in HG-fed animals by dietary change to the LG diet. (A) Animals were weighed weekly; the average weights for the dietary groups are shown. HG mice rapidly gained weight, which stabilized. LG mice gained weight slowly over the course of feeding. HGxoLG mice lost significant weight but stabilized after 2 mo of dietary change. (B) Boxplots of mouse weights showing the range of weights for each dietary group at the end of the study. (C) An IPGTT was performed on 21-mo-old mice. Fasting glucose levels were higher in HG mice, which also showed marked glucose intolerance. LG and HGxoLG mice were indistinguishable. (D) Bar graph plots of the average area under the IPGTT curve show glucose intolerance in HG mice. Statistics: **P < 0.01; #P < 0.001. In A and B the sample size at the beginning of the study was n = 20 (HG), n = 19 (LG), n = 18 (HGxoLG); the sample size at the at the end of the study was n = 15 (HG and LG), n = 13 (HGxoLG); In C and D n = 12.
Multiple Retinal Lesions Are More Frequent in HG Mice but Are Arrested or Reversed by Switching to the LG Diet.
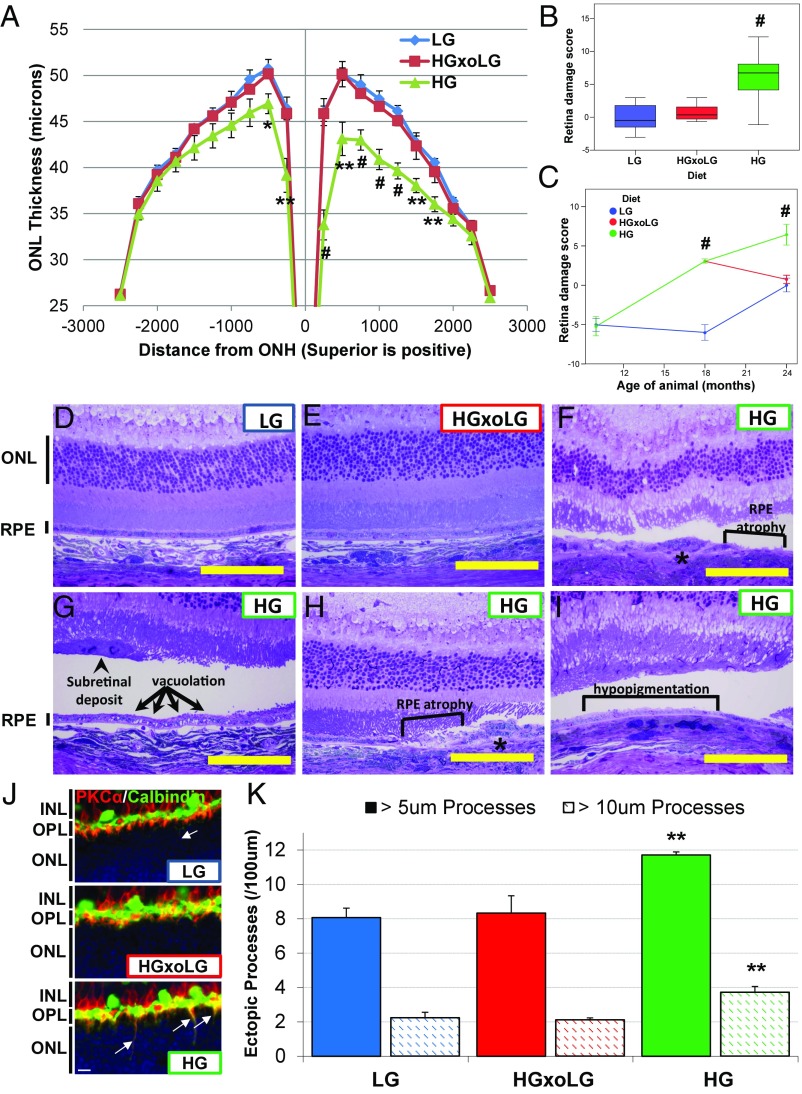
Photoreceptor cell loss was evaluated by the thickness of the layers of photoreceptor cell nuclei (outer nuclear layer, ONL). HG mice (24-mo-old) exhibited significant ONL thinning relative to LG mice, especially near the optic nerve head and on the superior hemisphere of the retina (Fig. 1A) (23). Remarkably, despite their having consumed the HG diet for 6 mo before being switched to the LG diet, the ONL thickness in HGxoLG animals did not differ from that in LG animals. To create an overall retinal damage score, we summed the area under the ONL thickness curve and scaled the parameter so that the greater the amount of photoreceptor cell loss [lower area under the curve (AUC)], the greater was the retinal damage score (Fig. 1B). Mice fed LG or HG diets from 3 mo of age until 10 mo of age did not show differences in photoreceptor cell layer thickness (Fig. 1C) (24). By age 18 mo, however, HG mice showed higher retinal damage scores, which continued to increase until 24 mo. Retinal damage was markedly delayed in LG mice. However, once retinal damage started, at around age 18 mo, the rate of accretion was similar to that observed in the HG mice. Impressively, there was no further photoreceptor cell loss in the HGxoLG group after their change to the LG diet, implying a rapid diet-related arrest or reversal of HG-induced damage.
Fig. 1.
HG-associated AMDf and photoreceptor cell aging in 24-mo-old mice is prevented by changing to the LG diet. (A) Photoreceptor cell layer thickness, measured as the thickness of the ONL, is decreased, particularly in the superior hemisphere, in HG mice. (B) A boxplot of the retinal damage score, calculated based on the area under the ONL thickness plot, shows increased retinal damage score in HG mice. (C) The retinal damage score increases continually over time in HG mice and increases beginning at age 18 mo in LG mice, but photoreceptor cell loss in HGxoLG mice ceases after dietary change. Negative values indicate ONL layers thicker than the reference (i.e., the average in 24-mo-old LG mice) (D–I) Toluidine blue-stained sections through the retinas of LG and HGxoLG mice have normal architecture, whereas retinas of HG mice show the indicated lesions. Square brackets in F, H, and I indicate regions with a missing RPE monolayer or hypopigmentation as indicated. Asterisks in F and H indicate regions of RPE multilayering. The arrows in G point to a region of vacuolated RPE and the arrowhead points to a subretinal deposit. (J) Retinas stained for the rod bipolar marker PKCα (red) and horizontal cell marker Calbindin (green) show ectopic rod bipolar dendrites (yellow) that extend beyond the outer plexiform layer (OPL) into the ONL (arrows) more frequently in HG mice than in HGxoLG or LG mice. (K) The frequency of ectopic rod bipolar cell processes that are greater than 5 μm (solid bars) or 10 μm (hatched bars) was quantified and found to be greater in HG retinas. Abbreviations: INL, inner nuclear layer; IPL, inner plexiform layer; ONL, outer nuclear layer. (Scale bars: 100 μm in D–I; 10 μm in J.) *P < 0.05; **P < 0.01; #P < 0.001; error bars indicate SEM; sample size was n = 7 (LG and HGxoLG), n = 9 (HG) in A and B; n = 4 (LG), n = 5 (HG) for 10-mo-old and n = 3 for 18-mo-old mice in C; and n = 4 in J.
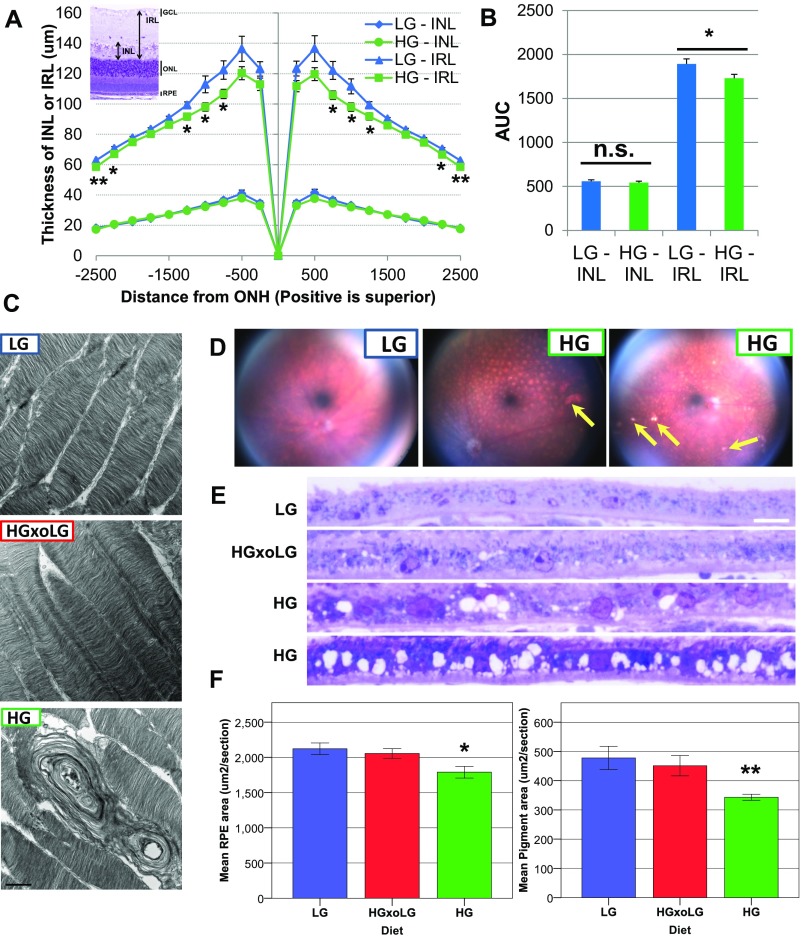
Inner retina layer thinning, photoreceptor disorganization, and swelling of inner segments as well as photoreceptor degeneration were observed in HG but not in LG or HGxoLG mice (Fig. 1F and Fig. S3 A–C). These findings are consistent with neuronal apoptosis or remodeling in HG mice. An independent hallmark of photoreceptor cell aging, the loss of synaptic pruning of rod bipolar cell dendrites (25), was also more extensive in HG than in LG and HGxoLG rod bipolar cells (Fig. 1 J and K).
Fig. S3.
Abnormalities in inner retina layer, photoreceptors, and RPE in HG eyes. (A) Toluidine blue-stained sections were measured to determine the thickness of the inner nuclear layer (INL) and the inner retina layer (IRL), which includes the inner nuclear layer and the inner plexiform layer (see Inset). Quantification of inner nuclear layer and IRL thickness across the retina reveals that the HG inner retina layer is statistically significantly thinner in both hemispheres between 750 and 1,250 microns from the optic nerve head (ONH). Although statistically significant, the difference is less obvious at the extreme periphery. (B) Quantification of the AUC of inner nuclear layer and inner retina layer thickness shows that the overall thickness of the inner retina layer but not the inner nuclear layer was decreased in HG mice. (C) Disorganization and vacuolation of photoreceptor cell outer segments in degenerating HG retinas. Transmission electron micrographs are shown of photoreceptor cell outer segments in retinas from the three dietary groups. Large vacuoles and misalignment of photoreceptor cell outer segments are observed in HG retinas, which have an accompanying loss of photoreceptor nuclei. (D–F) Pigmentary and morphological changes in the eyes and RPE from HG mice. (D) Color fundus images from an LG eye compared with two HG eyes. A spotting pattern is obvious in the HG eyes, which is less prominent in the LG eye and may correspond to areas of localized depigmentation. Bright hyperreflective areas (arrows), which may correspond to areas of RPE atrophy or deposits, are also observed in the HG eyes. (E) Toluidine blue-stained sections through the RPE of eyes from different dietary groups. The HG RPE is vacuolated and is thinner than LG or HGxoLG RPE. (F) Bar graphs showing morphometric quantification of the mean RPE area (Left) and mean pigment area (Right), showing that HG RPE is thinned and hypopigmented relative to LG and HGxoLG RPE. (Scale bars: 1 μm in C; 10 μm in E.) Statistics: *P < 0.05; **P < 0.01; error bars indicate Sem. Sample size is n = 7 (LG, HGxoLG), n = 9 (HG) in A and B; n = 7 (LG, HGxoLG), n = 8 (HG) in F. AUC, area under curve; n.s., not significant.
Dysfunction of the RPE presages photoreceptor cell loss. We observed that the areas with the greatest photoreceptor disorganization were often associated with multilayered or atrophied RPE (Fig. 1 F and H), histological abnormalities that are also hallmarks of human dry AMD (26). HG retinas showed multiple additional AMDf, including subretinal deposits and RPE vacuolation, hypopigmentation, thinning, and disorganization (Figs. 1 F–I and 2A and Fig. S3 D–F). The whole HG mouse retina tissue was more fragile, leading to RPE detachment postprocessing (Fig. 1 F–I) that was seen less frequently in LG or HGxoLG retinas.
Fig. 2.
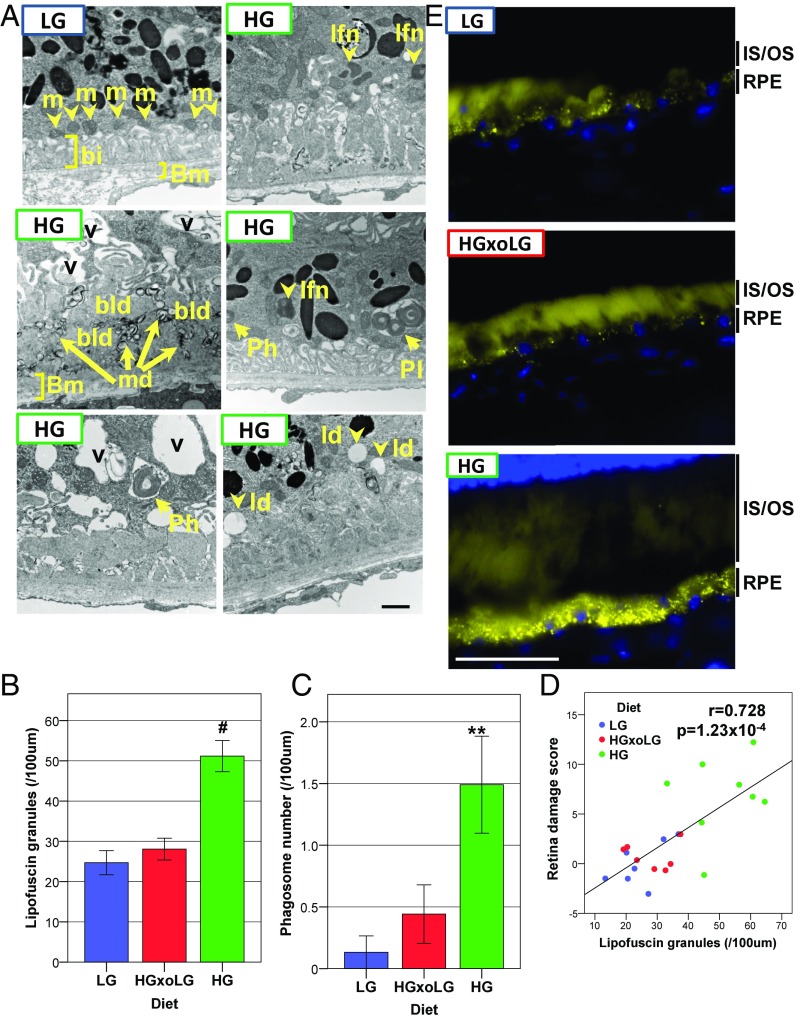
The HG diet induces AMD-related ultrastructural changes and lipofuscin accumulation in the RPE in 24-mo-old mice. (A) Electron micrographs show the loss of basal infoldings, vacuoles, the formation of large basal laminar deposits along with membranous debris, and the accumulation of lipofuscin, phagosomes, and lipid deposits in HG RPE. (B and C) Lipofuscin granules (B) and phagosomes (C) accumulate in HG RPE but not in HGxoLG or LG RPE. (D) The number of lipofuscin granules is linearly related to the extent of retinal degeneration. (E) Autofluorescent puncta (yellow), most likely lipofuscin granules, are dramatically increased in HG RPE relative to LG or HGxoLG RPE. Diffuse autofluorescence within photoreceptor inner and outer segments did not alter by diet. bi, basal infoldings; bld, basal laminar deposits; Bm, Bruch’s membrane; ld, lipid droplets; lfn, lipofuscin granules; m, mitochondria; md, membranous debris; Ph, phagosome; Pl, phagolysosome; v, vacuoles. (Scale bars: 1 μm in A; 50 μm in E.) **P < 0.01; #P < 0.001; error bars indicate SEM; sample size was n = 7 (LG and HGxoLG), n = 8 (HG).
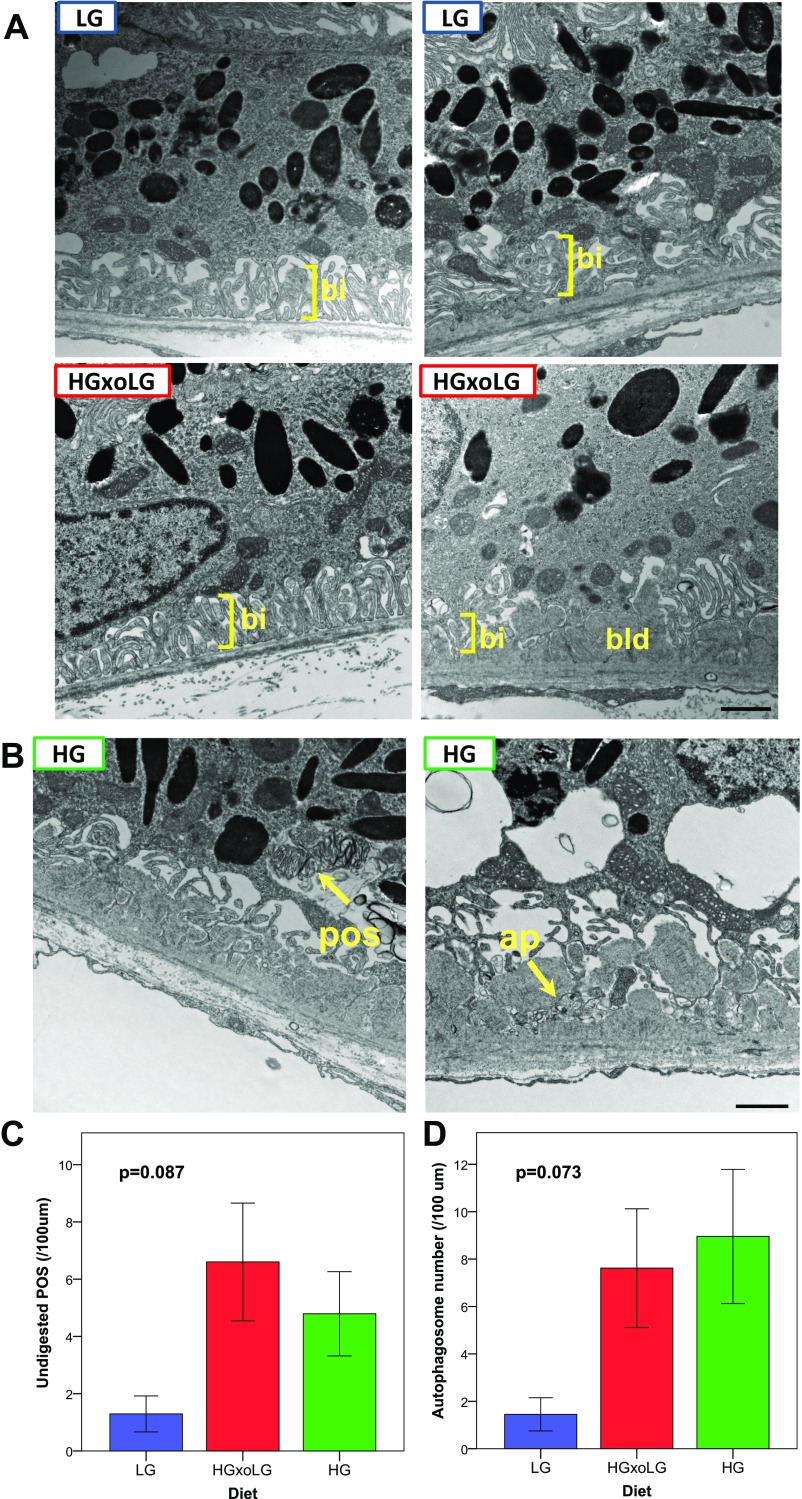
Hallmarks of younger, healthy RPE were similar and more frequent in LG and HGxoLG RPE, including well-maintained basal infoldings with aligned mitochondria and typical numbers of pigment granules (Fig. 2A and Fig. S4A). In contrast, RPE from HG mice frequently showed loss of basal infoldings and the accumulation of large basal laminar deposits associated with several microvacuolar structures that resembled the membranous debris often associated with advanced AMD (27, 28). RPE in HG mice also showed more frequent accumulation of lipid droplets, phagosomes, and lipofuscin granules, the last being quantitatively associated with the degree of photoreceptor cell loss and corroborated by increased autofluorescence (Fig. 2). These features are associated with impaired degradation of phagocytosed photoreceptor outer segments, possibly via autophagy (Fig. S4B) (29).Together, our data indicate that HG mice show photoreceptor cell damage and RPE abnormalities that highly resemble human dry AMD and retina aging. Most of these AMDf were prevented or reversed by consuming the LG diet or by switching from the HG diet to the LG diet during maturity.
Fig. S4.
Ultrastructural analysis of RPE. (A) Additional examples of LG and HGxoLG RPE transmission electron micrographs. LG and HGxoLG RPE often had intact basal infoldings (bi) (Left) as well as basal laminar deposits (bld) (Lower Right). Because basal laminar deposits were present in all groups, they are likely age-related and not indicative of specific pathology. In contrast to HG RPE, the basal laminar deposits were not associated with large amounts of membranous debris or disrupted Bruch’s membrane architecture. (B–D) Accumulation of undigested photoreceptor cell outer segments and autophagosomes in HG and HGxoLG RPE. (B) Transmission electron micrographs from HG RPE showing representative examples of undigested photoreceptor cell outer segments (pos) and autophagosomes (ap). Unlike phagosomes, the photoreceptor cell outer segments are disorganized and are not neatly surrounded by membranes. Autophagosomes have a distinct double membrane structure around them. Although autophagosomes are seen throughout the cytoplasm, they are often observed basally in areas of disrupted basal infoldings. (C and D) Quantification of the frequency of undigested photoreceptor outer segments (C) and autophagosomes (D) in dietary groups. Although not statistically significant at the P < 0.05 cutoff, both features were less commonly observed in LG RPE than in HG or HGxoLG RPE. Error bars indicate SEM. Sample size is n = 7 (LG and HGxoLG), n = 8 (HG). (Scale bars: 1 μm.)
Metabolic and Biochemical Insights into the Etiology of AMDf.
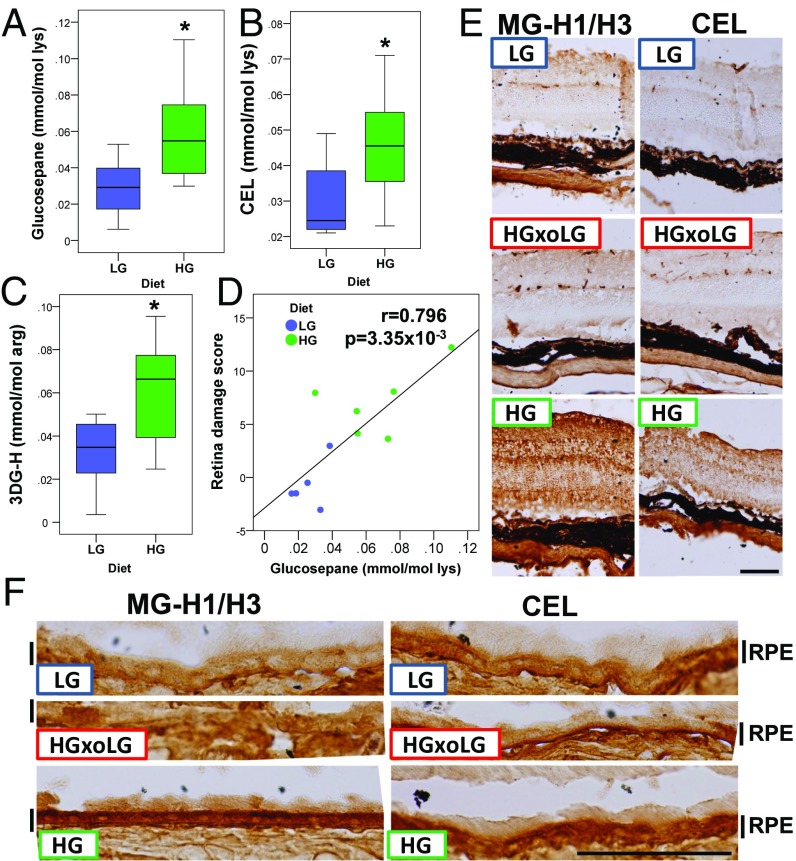
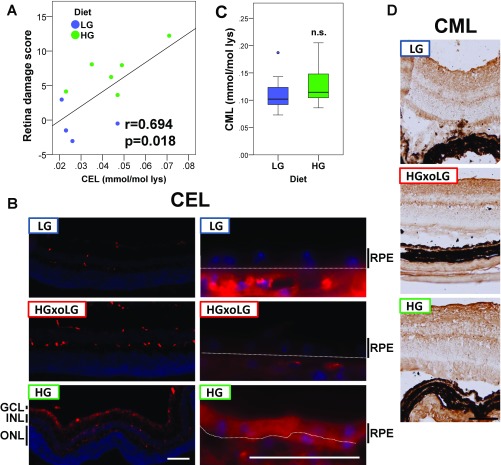
Accumulation of AGEs is diagnostic of many age-related diseases, including AMD, and is a reporter of chronic hyperglycemia and its downstream glycoxidative and other cytotoxic stresses (13, 30–32). Plasma levels of the AGEs, including glucosepane, Nε(1-carboxyethyl)-lysine (CEL), and 3-deoxyglucosone–derived hydroimidazolone (3DG-H), were all higher in these HG nondiabetic mice (Fig. 3 A–C), the first two showing quantitative associations with retinal damage (Fig. 3D and Fig. S5A). This association is corroborated by strong methylglyoxal-derived hydroimidazolone (MG-H1/3) immunoreactivity throughout the retina, particularly in the RPE, of HG mice relative to LG or HGxoLG mice (Fig. 3 E and F). Similar results were observed using two different antibodies against CEL, a derivative of methylglyoxal, consistent with prior reports of CEL expression in Müller glial cells (33). HG-enriched immunostaining was not observed for the highly related Nε(1-carboxymethyl)-lysine (CML), arguing for the specificity of the CEL observations (Fig. 3 E and F and Fig. S5). Together, these results suggest that multiple AGEs probably contribute to the AMDf observed in HG-fed mice, that changing to LG diets can delay, arrest, or reverse the accumulation of AGEs in eye tissues, and that some AGEs appear to be molecular biomarkers of disease.
Fig. 3.
The HG diet leads to increased AGEs in the plasma and retina. (A–C) Boxplots of plasma glucosepane (A), CEL (B), and 3DG-H (C) show increased levels in HG mice. (D) The glucosepane concentration is linearly related to the extent of retinal damage. (E and F) HG neural retina (E) and RPE (F) have higher levels of methylglyoxal-derived hydroimidazolone 1/3 (MG-H1/H3) and CEL. Levels of these AGEs were indistinguishable in HGxoLG and LG neural retina and RPE. *P < 0.05; sample size was n = 8 in A–C. (Scale bars: 100 μm in E; 50 μm in F.)
Fig. S5.
Accumulation of methylglyoxal-derived CEL but not glyoxal-derived CML in HG retinas. (A) The CEL concentration is linearly related to the retinal damage score. (B) Immunofluorescent detection of CEL using an antibody independent of that shown in Fig. 4 E and F confirms that CEL levels are high in HG retina compared with LG or HGxoLG retina. (Left) Staining in the neural retina was largely confined to the inner nuclear layer (INL) with distinct processes that terminate at the outer and inner limiting membranes. This pattern resembles staining within Müller glial cells, which have been reported to express high levels of CEL in diabetic rats. (Right) CEL was expressed at high levels throughout the HG RPE but only weakly in LG and HGxoLG RPE. The white line indicates the separation between the RPE layer and choroid, which shows high background because of anti-mouse secondary antibodies. (C) Boxplot of CML levels in LG and HG plasma show that CM) levels are not different in the dietary groups; n.s, not significant. (D) Immunohistochemical detection of CML shows that it is broadly detected throughout the retinas of mice from all dietary groups. Sample size in C is n = 8. (Scale bars: 100 μm in B, Bottom Left, and D; 50 μm in B, Bottom Right.)
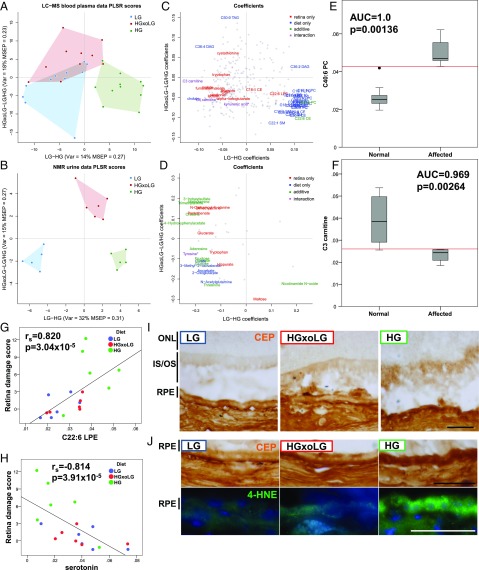
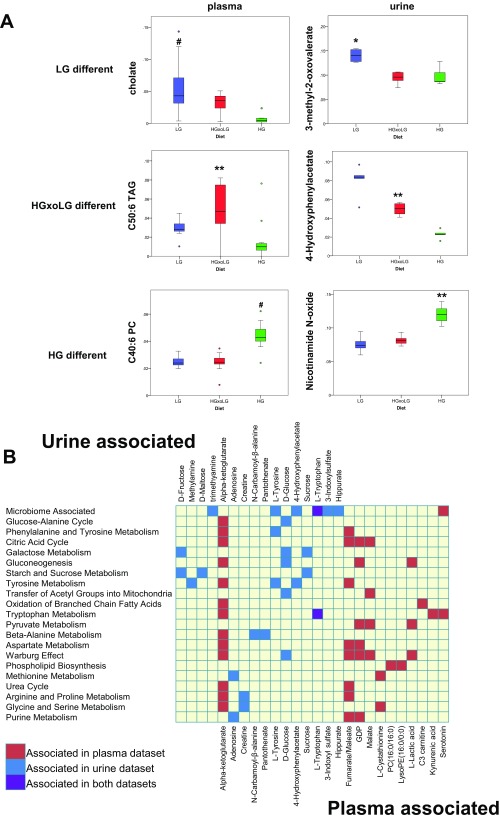
An additional 309 and 47 metabolites were identified in plasma and urine, respectively, using metabolomic approaches. The datasets were complementary, with 26 metabolites found in both fluids. Multivariate partial least squares regression (PLSR) analyses identified metabolites that were enriched in the HG versus the LG groups (shown on the x axis) and/or that were enriched in the HGxoLG group versus HG and LG groups (shown on the y axis) in the plasma or urine, respectively (Fig. 4 A and B). Multiple plasma metabolites were common between the LG and HGxoLG groups but were well separated from the HG group (Fig. 4A). In comparison, urinary metabolites readily separated the three dietary groups from each other (Fig. 4B). ANOVA indicated specific metabolites that associated with diet and/or retinal damage score, be it uniquely, additively, or as a diet–phenotype interaction (Fig. 4 C and D, Fig. S6 A and B, and Tables S1–S5). Statistically significantly associated metabolites then were plotted as loadings and colored to indicate the nature of the retina phenotype or/and diet associations (Fig. 4 C and D). PLSR diet associations were validated at the level of individual metabolites (Fig. S7A). Higher levels of hydrophilic metabolites, including carbohydrates and amino acids, are associated with lower retinal damage scores and consumption of the LG diet, whereas higher levels of lipids are associated with higher retinal damage scores and the HG diet (Fig. 4 C and D).
Fig. 4.
The HG metabolome differs from the LG metabolome. (A and B) PLSR was used to separate HG from LG samples [x axis, variance and mean square error of prediction (MSEP) is noted] or HGxoLG samples from HG and LG samples (y axis) for the plasma metabolome (A) or urine metabolome (B). (C and D) Metabolites that associate with the diet (blue), retinal damage score (red), or both (green, or violet in the case of an additional diet–phenotype interaction) are plotted as loading coefficients because they contribute to PLSR scores for the plasma metabolome (C) or urine metabolome (D). Each individual metabolite is represented by a gray dot. Asterisks indicate metabolites that miss the statistical cutoff by less than 0.001. (E and F) Examples of two plasma metabolites that performed perfectly or nearly perfectly in ROC analysis of the ability of a metabolite to distinguish unaffected (retina damage score <3) from affected retinas. C40:6 phosphatidylcholine (PC) plasma levels are higher in affected individuals (E), whereas C3 carnitine plasma levels are lower in affected individuals (F). (G and H) The retinal damage score is linearly related to plasma C22:6 LPE (G) and plasma serotonin levels (H), but in opposite directions. (I and J) Immunohistochemical detection of CEP shows higher levels in the inner and outer photoreceptor cell segments (IS/OS) of the HG retina (I) and HG RPE (I and J, Upper Row) than in the LG or HGxoLG retina. Immunofluorescent detection of 4-HNE (green) shows strong punctate staining in the HG RPE with weaker staining in LG and HGxoLG RPE (J, Lower Row). Nuclei are counterstained with DAPI (blue). AUC, area under curve. (Scale bars: 50 μm.)
Fig. S6.
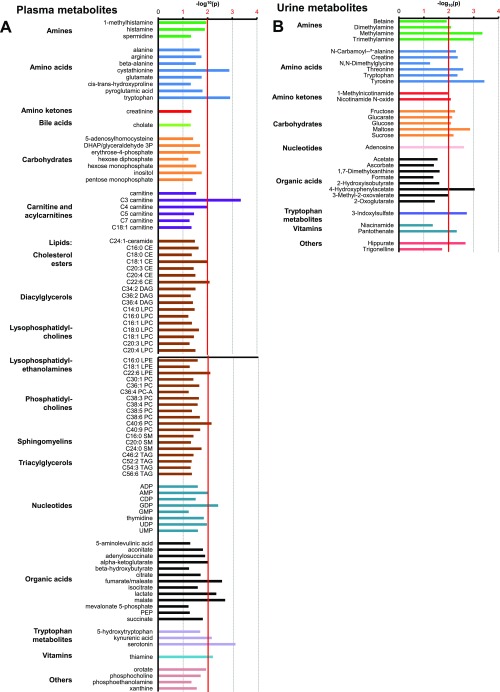
Grouping of metabolites that associate with the retinal damage score, as organized by metabolite class. The bar graphs plot the P value of all plasma metabolites (A) or urinary metabolites (B) that associated with the retinal damage score with at least P < 0.05; the major significance threshold of P < 0.01 is indicated by the red vertical line. The sample size in A is n = 11 (LG), n = 10 (HGxoLG), n = 11 (HG); the sample size in B is n = 4 (LG), n = 5 (HGxoLG), n = 4 (HG).
Table S1.
Plasma metabolites that associate with retinal damage score
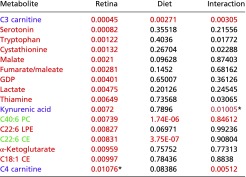 |
Red cells indicate metabolites that associate with retina damage score; green cells indicate metabolites that associate with diet and retina damage score; violet cells indicate a diet–phenotype interaction. P values that meet the P < 0.01 cutoff are shown in red and had FDR q values <0.1.
Values that missed the cutoff but were deemed of special significance.
Table S5.
Urinary metabolites that associate with diet
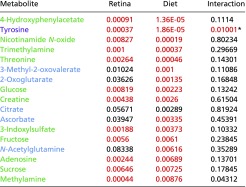 |
Blue cells indicate metabolites that associate with diet; red cells indicate metabolites that associate with retina damage score; green cells indicate metabolites that associate with diet and retina damage score; violet cells indicate a diet–phenotype interaction. P values that meet the P < 0.01 cutoff are shown in red and had FDR q values of <0.1.
Values that missed the cutoff but were deemed of special significance.
Fig. S7.
Examples of metabolites that statistically associate with LG, HGxoLG, or HG diets and pathway analysis of metabolites that associated with the retinal damage score. (A) Boxplots show the distribution of metabolites from the plasma metabolome (Left) or the urine metabolome (Right) that have diet-only associations with the LG diet (Top), the HGxoLG diet (Middle), or the HG diet (Bottom). Full lists of diet-associated metabolites are given in Tables S2 and S5. (B) Chart showing metabolites associated with the retinal damage score from the urine dataset (Top, blue), from the plasma dataset (Bottom, red), or from both (purple) and the metabolic pathways to which they contribute. Only pathways that involve two or more metabolites are listed, and only metabolites that associate with at least one annotated pathway are listed. Statistics: *P < 0.05; **P < 0.01; #P < 0.001. The sample size in A, Left was n = 11 (LG), n = 10 (HGxoLG), n = 11 (HG); the sample size in A, Right was n = 4 (LG), n = 5 (HGxoLG), n = 4 (HG).
Table S2.
Plasma metabolites that associate with diet
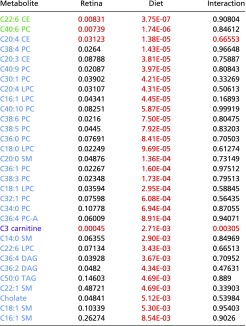 |
Blue cells indicate metabolites that associate with diet; red cells indicate metabolites that associate with retina damage score; green cells indicate metabolites that associate with diet and retina damage score; violet cells indicate a diet–phenotype interaction. P values that meet the P < 0.01 cutoff are shown in red and had FDR q values of <0.1.
Table S4.
Urinary metabolites that associate with retinal damage score
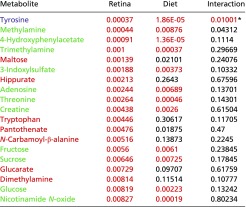 |
Red cells indicate metabolites that associate with retina damage score; green cells indicate metabolites that associate with diet and retina damage score; violet cells indicate a diet–phenotype interaction. P values that meet the P < 0.01 cutoff are shown in red and had FDR q values of <0.1.
Values that missed the cutoff but were deemed of special significance.
We performed receiver operating characteristic (ROC) analysis to identify metabolites as potential biomarkers that could predict AMDf. We identified eight plasma metabolites, including C40:6 PC (phosphatidylcholine) and C3 carnitine (propionylcarnitine), which achieved nearly perfect separation between mice with a retinal damage score >3 and nonaffected animals (area under the ROC curve ≥0.96; P < 0.022) (Methods, Fig. 4 E and F, and Table S3).
Table S3.
Plasma metabolites with significant AUC values
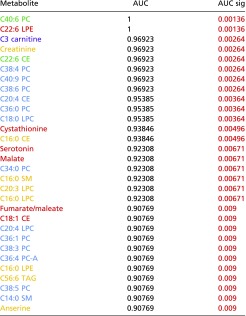 |
Blue cells indicate metabolites that associate with diet; red cells indicate metabolites that associate with retina damage score; green cells indicate metabolites that associate with diet and retina damage score; violet cells indicate a diet–phenotype interaction. Metabolites with an AUC-only association are colored as yellow. P values that meet the P < 0.01 cutoff are shown in red and had FDR q values of <0.1.
Consistent with the positive relationships between lipid metabolism and AMDf (Fig. 4C and Tables S1 and S3), we found that higher plasma C22:6 LPE (lysophosphatidylethanolamine) levels were strongly associated with increased retinal damage (Fig. 5G). Furthermore, C22:6 LPE and related metabolites can be oxidized to form 2-ω-carboxyethyl pyrrole (CEP) protein derivatives (34), whose levels were higher in the photoreceptor cell inner and outer segments and RPE of HG than in LG and HGxoLG mice (Fig. 4 I and J). There also was a strong central-to-peripheral gradient of CEP within photoreceptor segments, with the accumulation occurring in the region with the largest difference in photoreceptor cell layer thickness between HG and LG or HGxoLG retinas (Fig. 1A). The CEP gradient mirrors the spatial pattern of lipid peroxidation observed in the aging human eye (35) and the strong enrichment of its precursor, docosahexaenoic acid (DHA, C22:6n3) in photoreceptors (36). Consistent with these observations, CEP levels are higher in the retina and plasma from AMD patients, and mice immunized with CEP develop AMD-like pathology (37, 38). 4-Hydroxy-2-nonenal (4-HNE), a lipid peroxidation product, also accumulated in the RPE of HG but not LG or HGxoLG mice (Fig. 4J). Together, the findings indicate that, like AGEs, lipid peroxidation and advanced lipid end product formation are hallmarks of HG-associated AMDf.
Fig. 5.
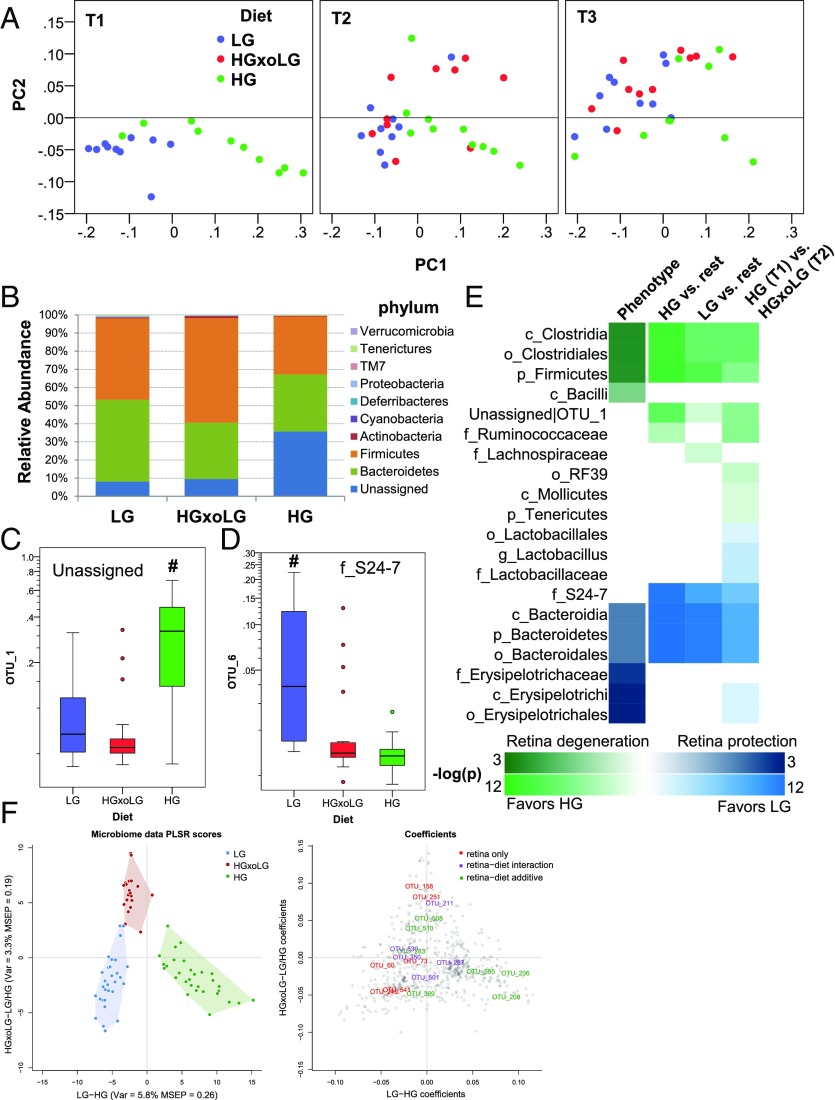
The gut microbiome is altered by diet. (A) Weighted UniFrac analysis of microbiome samples separates HG samples from LG and HGxoLG samples via the PC1 axis and shows aging and dietary changes, particularly in the HGxoLG microbiomes, via the PC2 axis. (B) The relative abundance of the nine phyla within the gut in relation to diet. HG samples have the largest abundance of bacteria whose taxonomy is unassigned (dark blue). (C and D) Relative abundancies of OTU_1 (C), which is HG-associated, and OTU_6 (D), which is LG-associated. (E) Enrichment analysis showing the relative association of taxa with the retinal damage score (phenotype, left column) or with dietary comparisons (right columns). The heat map indicates the P value of enrichment as indicated on the key. The directionality of correlation or enrichment is indicated by green (greater in HG) or blue color (greater in LG). (F, Left) PLSR was used to separate HG from LG microbiome samples [x axis; variance and mean square error of prediction (MSEP) are noted] or HGxoLG samples from HG and LG samples (y axis). (Right) OTUs that associate with the retinal damage score, alone (red) or along with diet (green, or violet in the case of an additional diet–phenotype interaction), are plotted as loading coefficients because they contribute to PLSR scores. Coefficients with positive values on the x axis are more associated with the HG diet, and those with positive values on the y axis are more associated with the HGxoLG diet. Each OTU is represented by a gray circle. Sample size was n = 30 (LG and HG); n = 20 (HGxoLG). #P < 0.001.
Functional integration of urinary and plasma metabolites associated with AMDf via pathway enrichment analysis showed pathways involved in carbohydrate and amino acid metabolism, as well as oxidative phosphorylation (via the citric acid cycle) (Fig. S7B). Microbial cometabolites whose levels are modulated by the abundance of microbiota (39, 40), e.g., serotonin, hippurate, trimethylamine, 4-hydroxyphenylacetate, 3-indoxylsulfate, tyrosine, and tryptophan, were highly enriched among AMDf-associated metabolites (enrichment P = 6.00 × 10⁻⁵). Furthermore, higher serotonin levels associate with protection against retinal damage in a diet-independent manner (Fig. 4H). Serotonin signals through multiple receptors. Agonists and antagonists of these receptors are neuroprotective against retinopathy (41–44).
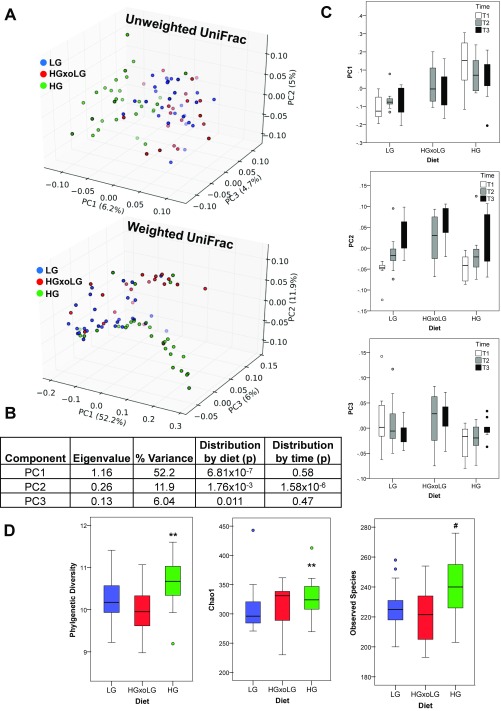
The associations of microbial cometabolites with diet and AMDf (Fig. S7B and Tables S1–S5) suggested that the gut microbiome might be altered by diet. Thus, we characterized gut microbiomes in a diet, time, and AMDf context. A clear relationship between diet and microbiota is corroborated by the separation of the microbiota compositions in the HG group from those of the LG and HGxoLG groups (Fig. 5A and Fig. S8 A–C). With crossover to the LG diet, the gut microbiome was restored to one resembling that in LG mice (Fig. 5B). Aging is also an influence on the microbiota. The principal component 2 (PC2) axis shows that there is also an age/time-dependent but diet-independent shift in gut microbiota (Fig. 5A and Fig. S8 B and C) (45, 46). At T2 (21 mo of age), the microbiome of HGxoLG mice was distinct from that of HG mice and started to resemble LG microbiomes (Fig. 5A, Center). By T3 (24 mo of age), HGxoLG microbiomes were largely comingled with LG microbiomes (Fig. 5A, Right). Further, an influence of age and diet on microbiota was indicated, because LG animals had similar amounts of Bacteroidetes and Firmicutes phyla, whereas HG animals had more bacteria of unknown classification. The shift from the HG to the LG diet was associated with increased Firmicutes and diminished levels of unclassified phyla, thus resembling the microbiomes in LG mice (Fig. 5B). Additional statistical enrichment analysis at each taxonomic level indicated that the microbiome of HG mice is enriched in Firmicutes and Clostridia (Fig. 5E) and that both of these are related to a more advanced retinal damage score (Fig. 5E, Left Column). Conversely, LG mice are enriched in Bacteroidales and Erysipelotrichi classes, and these are associated with protection against AMDf. Analyses at the level of all operational taxonomic units (OTUs) identified specific OTU–diet and OTU–retinal damage score interactions (Fig. 5F). Diet-related changes in microbial composition were also observed at the level of single OTUs, with OTU_6, an S24-7 family member from the Bacteroidetes phylum, showing high abundance only in LG samples, and OTU_1, an unassigned bacterium, showing high abundance only in HG samples (Fig. 5 C–E). Diet-only associations in OTU_1 and S24-7 family and phenotype-only association with the Bacilli class were also observed (Fig. 5E). Surprisingly, three parameters of alpha diversity indicated a statistically significant increase in alpha diversity [usually a feature of healthier microbiomes (47)] in the HG group (Fig. S8D).
Fig. S8.
Alpha and beta diversity of microbiome samples. (A) Analysis of microbiome samples from all three sample collection times separates the microbiota composition in HG samples from that in LG and HGxoLG samples via weighted and unweighted UniFrac. Shown are the top three PC axes that account for the most sample variance (indicated along each axis). Lighter hue of each color indicates greater depth with respect to the set viewpoint. Note that unweighted UniFrac does not take relative abundance into consideration. (B) Statistical parameters of weighted UniFrac data are shown for PC 1–3. (C) Boxplots show breakdown of weighted UniFrac PC 1–3 scores by diet and by time, as indicated. (D) Alpha diversity is increased in HG microbiome. Boxplots are shown for three different measures of alpha diversity: phylogenetic diversity (Left), number of observed species (Center), and Chao1 richness estimator (Right). Statistics: **P < 0.01; #P < 0.001. Sample size is n = 30 (LG, HG) and n = 20 (HGxoLG).
Together, the convergence of phenotype, diet, and microbiota relationships suggest that the diet-induced change in the microbiota in HGxoLG mice also contributes to the arrest of AMDf in these animals.
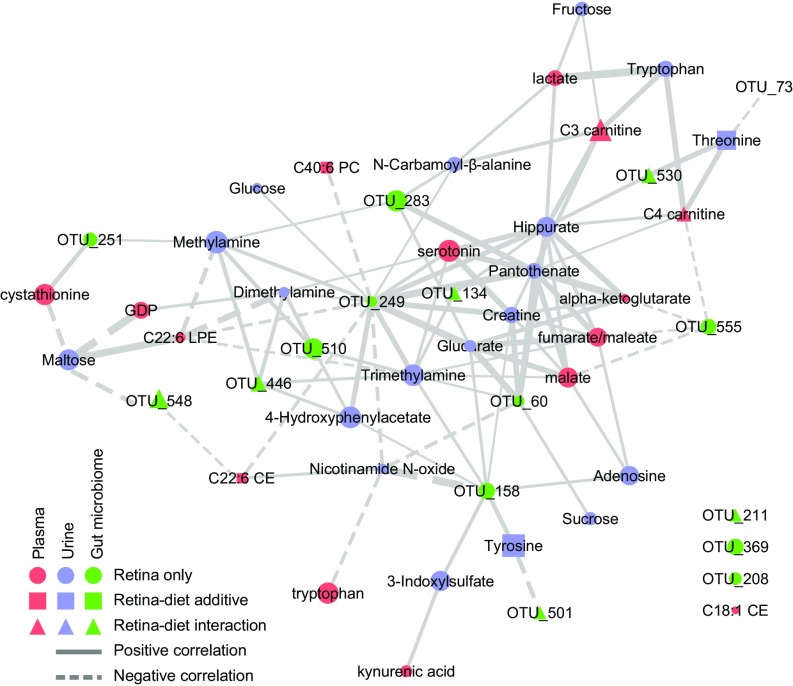
To extract more metabolic insight into the diet–metabolome–AMDf interactions, we used a semiquantitative network diagram that integrated associations of urinary metabolites, plasma metabolites, and the gut microbial OTUs to each other within a retinal damage context (Fig. 6). Nodes that form many connections (edges) are shown more centrally and are likely hubs of physiologically important retina–metabolome–microbiota interactions (Table S6). The most central node is OTU_249. It has 11 positively correlated edges with hydrophilic metabolites and four negatively correlated edges, which include three lipids (Table S6). This large number of metabolite interactions suggests that control of OTU_249 may be key to retinal phenotypic outcomes. Serotonin is among the most central nodes within the network (Table S6) and shows the second strongest association with retina damage based on bivariate correlation analysis (Fig. 4H). The influence of microbiota is corroborated by the serotonin relationship, because serotonin production derives from tryptophan and is stimulated by gut spore-forming bacteria (48). C22:6 LPE is also central within the network and has a remarkably high predictive capacity to separate affected from nonaffected individuals (AUC = 1.0) (Fig. 4G and Table S3).
Fig. 6.
Network analysis of retinal damage reveals connections between metabolites and microbiota. A network was constructed from all retinal damage score-associated metabolites and OTUs (nodes) and their correlations to each other (edges). Only edges that connect nodes between datasets are shown. The size of the node is determined by the P value of association with the retinal damage score, and the thickness of the edge is determined by the correlation score between nodes. Positive associations are show as solid lines, and negative correlations are shown as dashed lines. Colors and shapes indicate datasets and diet associations as indicated in the legend.
Table S6.
Network interaction data
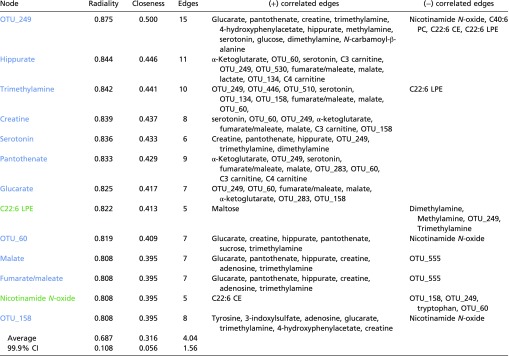 |
Listed are all nodes with a radiality of greater than 0.8 indicating significant differences from average radiality (P < 0.001). These nodes correspondingly had high closeness scores and a large number of edges. Nodes in blue associate with LG and nodes in green associate with HG.
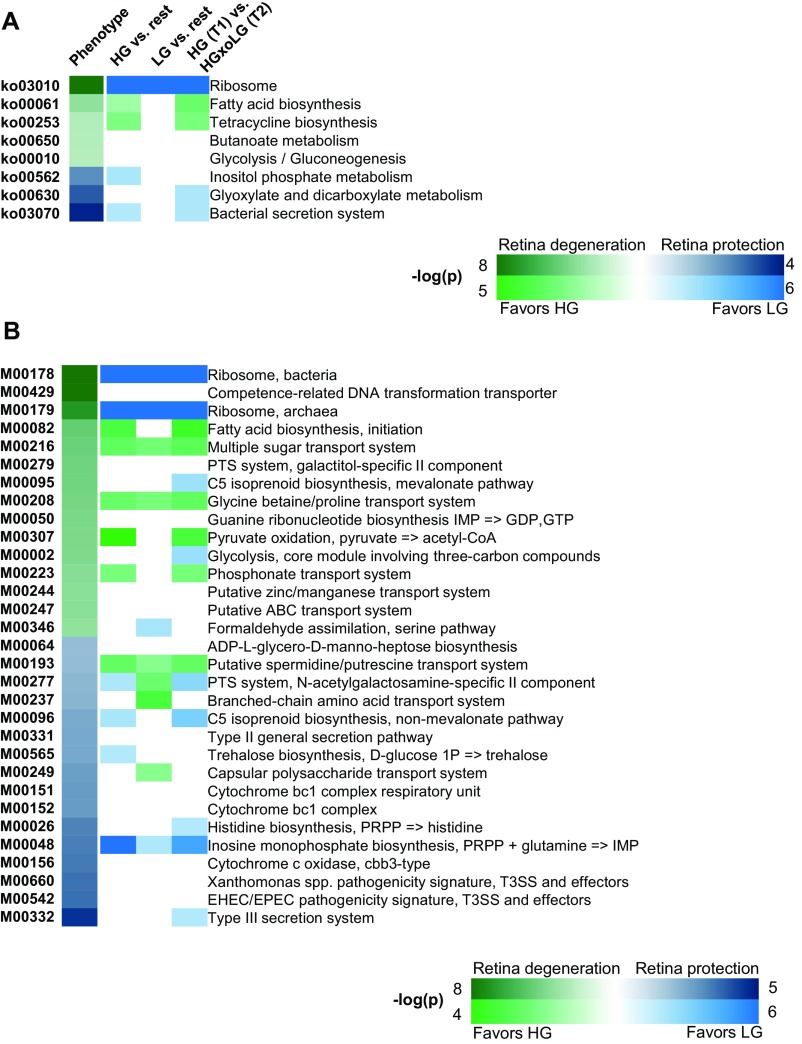
The relationship between microbiota and alterations in the metabolome were further integrated using metagenomic functional KEGG (Kyoto Encyclopedia of Genes and Genomes) pathways of enriched microbiota (Fig. S9). As suggested by the data in Fig. 4C, more advanced AMDf and the HG diet were associated with pathways and modules relating to microbial fatty acid metabolism (ko00061 and M00082) as well as to sugar and amino acid transport (M00216, M00208). Protection from AMDf and the LG diet were associated with carbohydrate metabolism (ko00562, ko00630, and M00565). The association of trehalose biosynthesis with protection from AMDf in LG mice was intriguing, because this module (M00565) can use amylose, which is only found in LG diets, and trehalose has been linked to neuroprotection in a number of neurodegenerative disorders (49, 50).
Fig. S9.
Enrichment of KEGG pathways and modules that associate with the retinal damage score. (A and B) Heat maps of KEGG pathways (A) and KEGG modules (B) indicating the P value of enrichment as indicated on the key (note the different scales for phenotype versus diet association). Enrichment comparisons are the same as presented in Fig. 6E. The directionality of correlation or enrichment is indicated by green or blue color. For HG vs. rest or HG at T1 vs. HGxoLG at T2, positive enrichment is indicated by green (greater in HG); for LG vs. rest, positive enrichment is indicated by blue (greater in LG). KEGG pathways are shown that had an FDR of less than 0.1. Sample size was n = 30 (LG), n = 20 (HGxoLG), and n = 30 (HG).
Collectively, the data show that the blood and urine metabolomes respond to diet and that several of these metabolites also relate to retinal phenotype. As such, they appear to be biomarkers of AMDf.
Discussion
In this work, using wild-type C57BL/6J mice, we advanced a model of human dry AMD that recapitulates many of its key features, including photoreceptor cell loss, RPE atrophy, accumulation of lipofuscin and phagosomes, increased autofluorescence, and the formation of large basal deposits associated with membranous debris. LG diets confer protection for the retina against such age- and disease-related damage. Encouragingly, by demonstrating arrest or reversal of AMDf in the HGxoLG mice, we report that switching to LG diets, even late in life, is salutary. Even synaptic pruning is affected by the switch to the LG diet. As such, the data support human epidemiologic observations that suggest that consuming lower GI diets is associated with delayed progress of early AMD (7–9). The higher levels of AGEs and autofluorescence in HG mice and their delayed or arrested accumulation in LG or HGxoLG mice indicate that the benefit of the LG diet is derived in part from lower glycative stress. The metabolomics, microbiome, and network data further show that these diet-induced phenomena are interrelated and that the concerted reprograming of the metabolome and microbiome that accompanies the switch from an HG to an LG diet is beneficial. These data also complement recent observations regarding the importance of glucose in RPE metabolism (51).
The experiments also revealed multiple potential biomarkers of retinal damage, including blood glucosepane, CEL, serotonin, C3 carnitine, C22:6 LPE, and C40:6 PC, which should offer unprecedented efficiency in earlier diagnosis, in prognosis, and in evaluating the efficacy of new therapies. These results also provide further information about potential modes of retinal maintenance and pathobiologic mechanisms of AMDf. The strong correlation between dietary carbohydrate and lipids within the context of AMDf emphasizes their metabolic connection. C40:6 PC, C22:6 LPE, and C22:6 CE are of particular interest, because soft drusen, an established clinical indication of AMD in humans, contain many such lipids, and variants in cholesterol-related genes are risk factors for AMD (3, 52). Our data also point to downstream lipid peroxidation-related products, specifically CEP and 4-HNE, in the etiology of AMDf (37, 38). Interactions between mutated Complement factor H (CFH), a strong risk factor for human AMD, and high dietary lipids and cholesterol lead to an AMD phenotype that resembles the HG phenotype (15). Although we did not observe changes in Cfh in our mice, the underlying pathobiology may be similar.
The AGEs glucosepane, CEL, and MG-H1 are caused, at least in part, by elevated levels of sugars and subsequent modification by sugar metabolites. The accumulation of AGEs and glucose in the retina has been associated with other conditions of hyperglycemia, notably diabetic retinopathy, and some of the phenotypes noted in this work, such as RPE thinning, RPE vacuolation, photoreceptor degeneration, and thinning of the inner retinal layer, were also observed in humans and experimental models of diabetic retinopathy (33, 53–59). Glycation results in the dysfunction of structural proteins and impaired protein-editing machineries, including autophagy and the ubiquitin proteolytic systems, functions that are required for the degradation of phagosomes and AGEs (11, 29, 60). Combined, insufficient protein editing leads to the accelerated accumulation of damaged proteins and lipofuscin and to cytotoxicity, all of which we observe in HG mice. Fortunately, all these lesions are diminished in LG mice and with the change from the HG to the LG diet.
The diet-induced change in gut microbiota and its effect on the metabolome and retinal health, as exemplified by the inverse relationship between serotonin and frequency of AMDf, substantiates nutritional, specifically carbohydrate nutrition, prophylaxis against AMDf. As products of the microbiome, the metabolic connections among tryptophan, serotonin, and kynurenic acid are intriguing, because they echo relations of the gut–brain axis (48, 61). Additionally, kynurenic acid has been linked to neuroprotection in the eye (62, 63). New studies in mice and humans confirm the important role of gut microbiota in the development of neovascular (wet) AMD (64, 65).
In conclusion, our study reinforces the importance of consuming LG diets, specifically diets with a lower GI, as an effective and attainable way to maintain lower glucose levels and to avoid or to treat early AMD. LG diets are achieved by using whole-grain sources or resistant starches rather than rapidly metabolized polysaccharides. Our findings provide an impetus to develop the biomarkers as new diagnostics and avenues for therapeutic intervention. Having such biomarkers will hasten prognosis and treatment as well as make intervention trials far less expensive.
Methods
Full methods are presented in SI Methods.
Animals and Diets.
C57BL/6J wild-type male mice were purchased from Jackson Laboratories. Animals were fed standard chow (Teklad 7012; Harlan Laboratories) ad libitum until 12 mo of age, at which time they were placed on the study diet. The full dietary regimen, including numbers of animals, is summarized in Fig. S1 A and B. Diets contained identical macronutrient compositions with the exception that the HG starch was composed of 100% amylopectin (Amioca starch; Ingredion, Inc.), whereas the LG starch was composed of 70% amylose/30% amylopectin (HYLON VII starch; Ingredion Incorporated) (10). All diets were formulated by Bio-Serv. All animal work was performed at Tufts Human Nutrition Research Center on Aging and was approved by the Tufts University Institutional Animal Care and Use Committee in adherence with the Association for Research in Vision and Ophthalmology (ARVO) statement for the use of animals in ophthalmic and vision research. Animals deemed to be in poor health were killed and excluded from the analysis.
Statistical Analyses.
For univariate analyses, data were evaluated using either SPSS (IBM) or Microsoft Excel. First, data were evaluated as to whether they fit in a normal distribution, based on kurtosis and skewness. Pairwise data that fit in a normal distribution were analyzed by a two-tailed Student’s t test followed by an F test to determine if the samples had equal variance. For group comparisons, one-way ANOVA was performed followed by Tukey’s Honestly Significant Difference (HSD) test. If the data did not fit a normal distribution, they were evaluated for pairwise comparisons using a Wilcoxon Mann–Whitney U test or for group comparisons using a Kruskal–Wallis test followed by Mann–Whitney U post hoc testing. Kaplan–Meier survival analysis was evaluated using the log-rank test with censored data. Correlation analysis was performed in SPSS using either Pearson correlation for normally distributed data or Spearman correlations. ROC analysis was performed in SPSS, where the P value indicates asymptotic significance. The significance of the number of metabolites achieving high separation was calculated directly using a permutation test.
For multivariate statistical analyses of metabolomics and microbiome data, orthogonal partial least squares (OPLS) regression (66) was performed using the pls R-package (67) and custom R script following the method described in ref. 68. Complexity and performance of the model was estimated using Monte Carlo cross-validation. The Benjamini–Hochberg method was used to estimate false-discovery rate (FDR) values (69), setting a cutoff of q < 0.1.
Determination of Protein Glycation, Oxidation, and Nitration Adducts.
Protein glycation, oxidation, and nitration adducts were determined by stable isotopic dilution analysis LC-MS/MS using the protocol previously described (70).
LC-MS–Based Metabolomics.
Fasting plasma samples taken immediately before mice were killed at age 24 mo were analyzed using three LC-MS/MS spectrometry methods. A full description of the methodology is presented in SI Methods or as published previously (71).
1H NMR-Based Metabolomics.
Free-catch urine was obtained from mice at age 21 mo. A 1H NMR spectrum of each sample was collected at 25 °C on a Bruker Avance 600 spectrometer using 64 scans and a NOE 1D pulse sequence. In addition, a 2D 13C-1H heteronuclear single-quantum coherence (HSQC) spectrum was used to aid in metabolite identification. The data were processed and analyzed using CHENOMX NMR Suite 7.1 for quantification (72). A full description of the methodology is presented in SI Methods.
Taxonomic Microbiota Analysis.
Feces (at least 10 per animal) were obtained from mice at 17, 21, and 23 mo. Samples were processed as previously described (73) using the PowerSoil DNA isolation kit according to the instructions of the manufacturer (MO BIO Laboratories, Inc.). Enrichment analysis of higher-order microbiome taxa and function was done as previously described (74).
Network Generation.
Metabolites and microbiota significantly related to the retinal phenotype were selected using an FDR threshold of 0.05. Selected entities have been represented as nodes of the network and are connected by edges if the R2 between levels in the subset of overlapping animals was greater than or equal to 0.5. Because connections between different data classes were the primary interest, only these were plotted. Network visualization was performed using Cytoscape software (75).
SI Methods
Animals and Diets.
C57BL/6J wild-type male mice were purchased from Jackson Laboratories. Animals were fed standard chow (Teklad 7012; Harlan Laboratories) ad libitum until 12 mo of age, at which time they were placed on the study diet. The full dietary regimen, including numbers of animals, is summarized in Fig. S1 A and B. Fifty-nine mice were randomized into groups of 19 LG-fed mice and 40 HG-fed mice, resulting in ∼20 animals per group, a sample size that was estimated from previous experience (10). Diets contained identical macronutrient compositions, except that the HG starch was composed of 100% amylopectin (Amioca starch; Ingredion Incorporated), and the LG starch was composed of 70% amylose/30% amylopectin (HYLON VII starch; Ingredion Incorporated) (10). All diets were formulated by Bio-Serv. Bomb calorimetry confirmed that the diets and resultant feces were isocaloric. Mice were group pair-fed to ensure equal consumption between diet groups. Pair feeding was not possible with the Teklad 7012 control diet, because that chow was pelleted and had different macronutrient composition and caloric density. At 18 mo of age, three LG and three HG mice were killed. The remaining 35 HG mice were randomized either to remain on the HG diet or to transfer to the LG diet. At 24 mo of age, mice were anesthetized with ketamine and xylazine, the fundus was photographed using a Μicron III retinal microscope (Phoenix Research Laboratories), and mice were subsequently killed. All animal work was performed at Tufts Human Nutrition Research Center on Aging and was approved by the Tufts University Institutional Animal Care and Use Committee in adherence with the ARVO statement for the use of animals in ophthalmic and vision research. Animals deemed to be in poor health were euthanized and excluded from the analysis.
IPGTTs.
IPGTTs were performed at age 17 mo and again at age 21 mo. Mice were fasted for 6 h before the IPGTT. A clean razor blade was used to make a horizontal cut in the lateral tail vein, releasing about 5 μL of blood that was applied to a OneTouch Ultra test strip in a OneTouch Ultra2 glucometer (LifeScan, Inc.) to obtain fasting glucose levels. For the glucose tolerance test, each mouse was injected i.p. with 1 g/kg body weight d-(+)-glucose (≥99.5%) (Sigma) via a 25-5/8–gauge syringe. At 15, 30, 60, and 120 min after injection, the cut tail vein in each mouse was moistened to remove the clot and was dried before the release of another 5 μL of blood. This blood was applied to the test strip in the glucometer to measure the blood glucose level.
Metabolic Analytes.
Fasting plasma samples from 24-mo-old mice were obtained immediately before mice were killed. Insulin, glucagon, and glucagon-like polypeptide 1 levels were determined using the M/R Total Active GLP-1, Insulin, Glucagon Kit (Meso Scale Discovery) and were assayed on a Meso Scale Analyzer, Sector Imager 2400 according to the manufacturer’s instructions. Determination of other metabolic analytes from fasting plasma was performed according to the instructions of the manufacturers of the following kits: total cholesterol (Cell Biolabs, Inc.), triglycerides (Cell Biolabs, Inc.), free fatty acids (ZenBio), total bile acids (Cell Biolabs, Inc.), leptin (Crystal Chem), and adiponectin (Crystal Chem).
Transmission EM and Light Microscopy Analysis.
Eyes were removed and fixed in EM fixative [2.5% glutaraldehyde, 2% paraformaldehyde, with 0.025% (wt/vol) CaCl2 in 0.1 M sodium cacodylate buffer, pH 7.4]. Eyes were washed 2 × 10 min in 0.1 M sodium cacodylate buffer containing 5% sucrose, postfixed for 3.5 h in 1% osmium tetroxide in 0.1 M cacodylate buffer containing 2% sucrose, washed 1 × 10 min in buffer and 1 × 10 min in distilled water, and held in 4% uranyl acetate for 1 h in the dark. Samples then were washed 1 × 10 min in distilled water, dehydrated 2 × 15 min each in graded ethanols (30–100%) and propylene oxide, infiltrated in Embed-812 resin (Electron Microscopy Sciences) for 24 h on a rotator, and polymerized at 70 °C for 48 h. Sectioning was performed on a Leica EM UC7 ultramicrotome using diamond knives (Diatome). Semithin (0.5-µm) sections were stained with 1% toluidine blue in 1% sodium borate. Thin (silver) sections were collected on copper 135 mesh hexagonal grids, poststained with 4% uranyl acetate in 50% (aqueous solution) methanol and Reynold’s lead citrate, and then viewed and photographed using a JEOL 1200 transmission electron microscope. Sections were photographed at 1 mm from the optic nerve head.
For quantitative analysis of EM features, 35 images at a magnification of 25,000× were evaluated from seven or eight different eyes per group. The following parameters were measured for each image and then summarized per 100 μm of linear Bruch’s membrane: Bruch’s membrane thickness (average of the thickest and thinnest parts of the membrane), vacuolar area, basal laminar deposit area, number of phagosomes, number of autophagosomes, number of lipofuscin granules, and number of lipid droplets. All scoring was done by investigators blinded to the diet group.
For light microscopy, semithin toluidine blue-stained sections were photographed on an Olympus photomicroscope equipped with a digital camera. For morphometric analysis of RPE, images at 60× magnification were taken from independent sections of seven or eight different eyes per group. Images were taken ∼1 mm from the optic nerve head, on the same side where transmission EM images were photographed. Quantification was performed using ImageJ software (NIH), setting thresholds for pigmentation based on the red channel. Each section had a contiguous RPE stretch of 291 µm. For quantification of ONL, inner nuclear layer, and inner retina layer thickness, measurements were taken every 250 µm from the optic nerve head on superior and inferior hemispheres. These measurements were averaged from two independent sections of each eye (n = 7 or 8 different eyes per group). All scoring was done by investigators blinded to the diet group.
Immunofluorescence and Immunohistochemistry.
Enucleated eyes were immediately fixed in 4% paraformaldehyde for 2 h at 4 °C and then were transferred to PBS. The cornea and lens were removed, and the remaining eye cup was transferred to 30% sucrose for cryopreservation and embedded in OCT compound (Sakura). Cryosections were obtained at a thickness of 10 μm, dried overnight, and stored at −80 °C.
For immunofluorescence, tissue sections were rehydrated in PBS containing 0.1% (vol/vol) Triton X-100 (PBT). For immunofluorescent detection of the RPE, slides were bleached using 10% hydrogen peroxide for 2 h at 65 °C. Next slides were blocked using normal donkey serum (Jackson ImmunoResearch), incubated with primary antibodies for 2 h, washed with PBT, and incubated with appropriate secondary antibodies conjugated to either Cy3 or Alexa Fluor 488 (Jackson ImmunoResearch). A list of primary antibodies and dilutions is available in Table S7. Slides were mounted in Prolong Gold Antifade with DAPI (Molecular Probes) and photographed on a Zeiss Axiovert fluorescent microscope and digital camera. For immunohistochemistry, tissue sections were stained with primary antibodies and detected with DAB (3,3′-diaminobenzidine) using the Vectastain ABC kit according to the manufacturer’s instructions (Vector Laboratories). Sections were photographed on an Olympus BX51 upright microscope equipped with a digital camera; for detection of immunohistochemical products in the RPE, slides were postbleached using 10% hydrogen peroxide for 2 h at 65 °C. Immunohistochemical results were replicated at least three times from independent samples.
Table S7.
Primary antibodies and dilutions
| Species | ID | Dilution | Source |
| Mouse | Anti-PKC α antibody (H-7) | 1:250 | Santa Cruz Biotechnology |
| Rabbit | Anti-calbindin antibody (D-28K) | 1:500 | Swant, Inc. |
| Mouse | Anti–Nε-(carboxyethyl) lysine (CEL) | 1:200 | Cosmo Bioscience |
| Mouse | Anti–Nε-(carboxyethyl) lysine (CEL) | 1:500 | Ryoji Nagai (87) |
| Mouse | Anti–Nε-(carboxymethyl) lysine (CML) | 1:500 | Ryoji Nagai (88) |
| Mouse | Anti–methylglyoxal-derived hydroimidazolone (MG-H1/H3) | 1:400 | Michael Brownlee (89) |
| Goat | Anti–4-Hydroxynonenal (4-HNE) (ab46544) | 1:750 | Abcam |
| Mouse | Anti–ω-(2-carboxyethyl)pyrrole (CEP) | 1:1,000 | Joe Hollyfield (38) |
Statistical Analyses.
For univariate analyses, data were evaluated using either SPSS (IBM) or Microsoft Excel. First, data were evaluated as to whether they fit in a normal distribution, based on kurtosis and skewness. Pairwise data that fit in a normal distribution were analyzed by a two-tailed Student’s t test followed by an F test to determine if the samples had equal variance. For group comparisons, one-way ANOVA was performed followed by Tukey’s HSD test. If the data did not fit a normal distribution, they were evaluated for pairwise comparisons using a Wilcoxon Mann–Whitney U test or for group comparisons using a Kruskal–Wallis test followed by Mann–Whitney U post hoc testing.
Kaplan–Meier survival analysis was evaluated using the log-rank test with censored data.
Correlation analysis was performed in SPSS using either Pearson correlation for normally distributed data or Spearman correlations.
ROC analysis was performed in SPSS, where the P value indicates asymptotic significance. The significance of the number of metabolites achieving high separation was calculated directly using a permutation test.
Before the multivariate statistical analyses of metabolomics and microbiome data, missing data were imputed using singular value decomposition methods (76), and mean centering and unit variance scaling were performed. As a discriminatory analysis, OPLS (66) was performed using the pls R-package (67) and custom R script following the method described in ref. 68. Complexity and performance of the model were estimated using Monte Carlo cross-validation. The optimal models were selected based on the tradeoff between the number of latent variables and rms error of prediction (RMSEP). The OPLS analysis performed for each dataset consisted of two steps. First the OPLS model M1 separating LG from HG samples was generated; then a secondary model M2 on the variance orthogonal to predictive variance of M1 was obtained to separate the HGxoLG mice from both LG and HG mice. ANOVA analysis was performed using R base package. Two models have been considered: (i) with diet and metabolite/microbiota being additive factors, and (ii) with diet and metabolite/microbiota being interacting factors influencing the retinal phenotype. The Benjamini–Hochberg method was used to estimate FDR values (69), setting a cutoff of q <0.1.
Determination of Protein Glycation, Oxidation, and Nitration Adducts.
Protein glycation, oxidation, and nitration adducts were determined by stable isotopic dilution analysis via LC-MS/MS following the previously described protocol (70). Analytes determined were Nε-fructosyl-lysine (FL), Nε-carboxymethyl-lysine (CML), Nε-(1-carboxyethyl)lysine (CEL), methylglyoxal and 3-deoxyglucosone-derived hydroimidazolones (MG-H1 and 3DG-H, respectively), methylglyoxal-derived lysine dimer (MOLD), glucosepane, Nω-carboxymethyl arginine (CMA), methionine sulfoxide (MetSO), N-formylkynurenine (NFK), dityrosine, glutamic semialdehyde (GSA), 3-nitrotyrosine (3-NT), and related amino acids. Fasting plasma (10 μL) was diluted to 500 μL with water and was washed by diafiltration with four cycles of concentration to 50 μL and dilution to 500 μL with further aliquots of water. Resultant protein (50 μL) was delipidated by extraction three times with one volume of water-saturated ether; residual ether was removed by centrifugal evaporation for 5 min under vacuum (20 mmHg), and the protein concentration was determined by the Bradford method. An aliquot (100 μg protein) then was digested enzymatically by consecutive incubation with pepsin, pronase E, and finally aminopeptidase with prolidase under argon over 4 d. Blanks and control digests of human serum albumin were performed concurrently to provide for protease autohydrolysis correction. The addition of thymol antioxidant and antibiotics after the neutralization step prevents artifactual oxidation and bacterial contamination. The process was performed aseptically and automatically by a custom program in a CTC-PAL sample autoprocessor (CTC Analytics). Analytes were detected by stable isotopic dilution analysis electrospray positive ionization multiple reaction monitoring LC-MS/MS and were quantified by stable isotopic dilution analysis using an Acquity ultra-high-performance chromatography (UHPLC) system with a Xevo-TQS tandem mass spectrometer. Chromatography was with two graphitic Hypercarb columns (5 μm particle size; column 1, 2 × 50 mm and column 2, 2 × 250 mm) with eluent 0.1% trifluoroacetic acid in water with a custom program for multistep gradient of acetonitrile and column switching.
LC-MS–Based Metabolomics.
A combination of three LS-MS/MS methods was used to acquire plasma metabolomics data. Polar and nonpolar plasma lipids were profiled using an LC-MS system comprised of a Shimadzu Nexera X2 UHPLC system(Shimadzu Corp.) coupled to an Exactive Plus orbitrap mass spectrometer (Thermo Fisher Scientific). Plasma samples (10 µL) were extracted for lipid analyses using 190 µL of isopropanol containing 1,2-didodecanoyl-sn-glycero-3-phosphocholine (Avanti Polar Lipids). After centrifugation, supernatants were injected directly onto a 1.7 µm, 100 × 2.1 mm ACQUITY BEH C8 column (Waters). The column was eluted isocratically with 80% mobile phase A [95:5:0.1 (vol/vol/vol) 10 mM ammonium acetate/methanol/formic acid] for 1 min followed by a linear gradient to 80% mobile phase B [99.9:0.1 (vol/vol) methanol/formic acid] over 2 min, a linear gradient to 100% mobile phase B over 7 min, then 3 min at 100% mobile phase B. MS analyses were carried out using electrospray ionization in the positive ion mode using full-scan analysis over 200–1,000 m/z at 70,000 resolution and a 3-Hz data-acquisition rate. Other MS settings were sheath gas 50, in source CID 5 eV, sweep gas 5, spray voltage 3 kV, capillary temperature 300 °C, S-lens RF 60, heater temperature 300 °C, microscans 1, automatic gain control target 1e6, and maximum ion time 100 ms. Lipid identities were determined by comparison with reference plasma extracts and were denoted by the total number of carbons in the lipid acyl chain(s) and the total number of double bonds in the lipid acyl chain(s).
Hydrophilic interaction liquid chromatography (HILIC) analyses of water-soluble metabolites in the positive ionization mode were conducted using an LC-MS system comprised of a Shimadzu Nexera X2 UHPLC system (Shimadzu Corp.) coupled to a Q Exactive hybrid quadrupole orbitrap mass spectrometer (Thermo Fisher Scientific). Plasma samples (10 µL) were prepared via protein precipitation with the addition of nine volumes of 74.9:24.9:0.2 (vol/vol/vol) acetonitrile/methanol/formic acid containing stable isotope-labeled internal standards [valine-d8 (Sigma-Aldrich) and phenylalanine-d8 (Cambridge Isotope Laboratories)]. The samples were centrifuged (10 min, 9,000 × g, 4 °C), and the supernatants were injected directly onto a 150 × 2 mm, 3 µm Atlantis HILIC column (Waters). The column was eluted isocratically at a flow rate of 250 µL/min with 5% mobile phase A (10 mM ammonium formate and 0.1% formic acid in water) for 0.5 min followed by a linear gradient to 40% mobile phase B (acetonitrile with 0.1% formic acid) over 10 min. MS analyses were carried out using electrospray ionization in the positive ion mode using full-scan analysis over 70–800 m/z at 70,000 resolution and 3 Hz data-acquisition rate. Other MS settings were sheath gas 40, sweep gas 2, spray voltage 3.5 kV, capillary temperature 350 °C, S-lens RF 40, heater temperature 300 °C, microscans 1, automatic gain control target 1e6, and maximum ion time 250 ms. Targeted analyses of polar metabolites in the negative ionization mode were conducted using an ACQUITY UHPLC system (Waters) and a 5500 QTRAP mass spectrometer (SCIEX). Plasma samples (30 µL) were prepared via protein precipitation with the addition of four volumes of 80% methanol containing inosine-15N4, thymine-d4, and glycocholate-d4 internal standards (Cambridge Isotope Laboratories). The samples were centrifuged (10 min, 9,000 × g, 4 °C), and the supernatants were injected directly onto a 150 × 2.0 mm Luna NH2 column (Phenomenex). The column was eluted at a flow rate of 400 µL/min with initial conditions of 10% mobile phase A (20 mM ammonium acetate and 20 mM ammonium hydroxide in water) and 90% mobile phase B [10 mM ammonium hydroxide in 75:25 (vol/vol) acetonitrile/methanol] followed by a 10-min linear gradient to 100% mobile phase A. MS analyses were carried out using electrospray ionization and multiple reaction monitoring (MRM) scans in the negative ion mode. To create the method, declustering potentials and collision energies were optimized for each metabolite by the infusion of reference standards. The ion spray voltage was −4.5 kV, and the source temperature was 500 °C. Metabolite identities were confirmed using authentic reference standards. High-resolution MS data were processed using TraceFinder software (Thermo Fisher Scientific) and Progenesis CoMet (Nonlinear Dynamics), and raw MRM data were processed using MultiQuant (SCIEX).
1H NMR-Based Metabolomics.
Free-catch urine was obtained from mice at age 21 mo. D2O buffers were added to 170–200 mL of mouse urine to a final volume of 540 mL. Final concentrations of DSS (4,4-dimethyl-4-silapentane-1-sulfonic acid) and imidazole were 0.09 mM and 18.5 mM, respectively. An 1H-NMR spectrum of each sample was collected at 25 °C on a Bruker Avance 600 spectrometer using 64 scans and a NOE 1D pulse sequence. In addition, a 2D 13C-1H heteronuclear single-quantum coherence (HSQC) spectrum was used to aid in metabolite identification. NMR data were compared with known databases (77) and previous publications (78, 79). The data were processed and analyzed using Chenomx NMR Suite 7.1 for quantification (72).
Metabolite Pathway-Level Analysis.
Metabolites were classified to metabolic pathways using the small molecule pathway database (SMPDB) ontology (80). For each pathway a Wilcoxon rank sum test was performed, checking if the ANOVA coefficients of metabolites classified to a specific pathway were significantly shifted with respect to the whole pool of measured metabolites. Metabolites whose levels were modified by gut microbiota (microbial cometablites) were identified from literature searching as of 2015 October 20. All metabolites presented had levels that were significantly increased or decreased in germ-free mice or antibiotic-treated mice compared with mice with an intact microbiome and/or were able to be produced directly by gut microbiota. Annotated metabolites and references are provided in Table S8.
Table S8.
Microbial cometabolites
| Microbial cometabolite | HMDB no. | Reference |
| p-Hydroxyphenyl acetic acid | HMDB00020 | (90) |
| Phenylacetic acid | HMDB00209 | (90) |
| Indole-3-acetic acid | HMDB00197 | (90) |
| p-Cresol | HMDB01858 | (90) |
| Trimethylamine-n-oxide | HMDB00925 | (91, 92) |
| Trimethyamine | HMDB00906 | (93) |
| l-tryptophan | HMDB00929 | (39, 94) |
| Serotonin | HMDB00259 | (39, 94) |
| 5-Hydroxytryptophol | HMDB01855 | (94) |
| N-acetyl tryptophan | HMDB13713 | (39) |
| Indoxyl sulfate | HMDB00682 | (39) |
| 3-Indolepropionic acid | HMDB02302 | (39) |
| l-Tyrosine | HMDB00158 | (39) |
| Hippuric acid | HMDB00714 | (39, 95) |
| Phenylacetylglycine | HMDB00821 | (39, 95) |
| Phenyl sulfate | HMDB60015 | (39) |
| p-Cresol sulfate | HMDB11635 | (39) |
| Phenylpropionylglycine | HMDB00860 | (39) |
| Cinnamoylglycine | HMDB11621 | (39) |
| Equol | HMDB02209 | (39, 96) |
| Uric acid | HMDB00289 | (39) |
| 2,8-Dihydroxyquinoline-β-d-glucuronide | HMDB11658 | (39) |
| 12-HEPE | HMDB10202 | (39) |
| Butyric acid | HMDB00039 | (95) |
| Propionic acid | HMDB00237 | (95) |
| Acetic acid | HMDB00042 | (95) |
| Deoxycholic acid | HMDB00626 | (97) |
| ω-Muricholic acid | HMDB00364 | (97) |
| Cholic acid | HMDB00619 | (97) |
HMDB, Human Metabolome Database.
Taxonomic Microbiota Analysis.
Feces (at least 10 per animal) were obtained from mice at age 17, 21, and 23 mo. Samples were processed as previously described (73) using the PowerSoil DNA isolation kit (MO BIO Laboratories, Inc.) according to the manufacturer’s instructions. Approximately 365-bp amplicons spanning the V2 region of the 16S rRNA genes were amplified with PCR using the following barcoded primers: Fwd 5′-AGAGTTTGATCCTGGCTCAG-3′, Rev 5′-TGCTGCCTCCCGTAGGAGT-3′. The reactions then were pooled in an equimolar ratio, purified, and used for Illumina MiSeq sequencing to a depth of 63,794 ± 3,777 (mean ± SEM). Reads were quality filtered using Trimmomatic (81), and paired ends were assembled with PEAR (82). Sequences were clustered to OTUs using USearch7 (83), with the following commands: derep_fulllength, sortbysize [–minsize 2], cluster_otus. uchime_ref, usearch_global [-id 0.97], followed by the script assign_taxonomy.py from QIIME (84). Prediction of functional capacities was performed using PICRUSt (85) on closed-reference-picked OTUs using QIIME against the 13_8 release of Greengenes (86).
Enrichment Analysis of Higher-Order Microbiome Taxa and Function.
Enrichment analysis of higher-order microbiome taxa and function was done as previously described (74) to check for enrichment of entities that encompass multiple individual features, such as multiple genes per KEGG pathway or module and multiple OTUs per higher taxonomical level. Briefly, this analysis was performed by Mann–Whitney U test between log(P value)*sign(R) of the correlations to phenotypes, diets, or time points (Pearson or Mann–Whitney U test) of entities (genes or OTUs) contained in each higher-order group and log(P value)*sign(R) of the correlations of the rest of the entities not contained in that group. FDR correction (69) was used at the rate of q <0.1 per tested variable (e.g., retinal damage score) per microbiome analysis method (compositional or PICRUSt based).
Network Generation.
Metabolites and microbiota significantly related to the retinal phenotype were selected using an FDR threshold of 0.05. Selected entities have been represented as nodes of the network and are connected by edges if the R2 between levels in the subset of overlapping animals was greater than or equal to 0.5. Because connections between different data classes were of primary interest, only these were plotted. Network visualization was performed using Cytoscape software (75).
Microbial Cometabolite Pathway Annotation.
Metabolites whose levels were modified by gut microbiota were identified from literature searching as of 2015 October 20. All metabolites presented had levels that were significantly increased or decreased in germ-free mice or antibiotic-treated mice compared with mice with an intact microbiome and/or were able to be produced directly by gut microbiota.
Acknowledgments
We thank Jennifer Cho and Jonathan Morrison for assistance with animal feeding, Barbara Nagel for histological and electron microscopy, Steven Fliesler for assistance with interpretation of electron micrographs, Joe Hollyfield for the CEP antibody, Christine Pelkman of Ingredion Incorporated. for dietary starches, and Angelo Azzi for comments on the manuscript. This work was supported by NIH Grants RO1EY021212, RO1EY13250, and RO1EY026979 (to A.T.) and the Morris Belkin Professorship at Weizmann Institute of Science (A.T.). This material is based on work supported by the US Department of Agriculture–Agricultural Research Service under Agreements 58-1950-0-014 and 58-1950-4-003 (to A.T.).
Footnotes
The authors declare no conflict of interest.
This article is a PNAS Direct Submission. C.B.R. is a guest editor invited by the Editorial Board.
This article contains supporting information online at www.pnas.org/lookup/suppl/doi:10.1073/pnas.1702302114/-/DCSupplemental.
References
- 1.Wong WL, et al. Global prevalence of age-related macular degeneration and disease burden projection for 2020 and 2040: A systematic review and meta-analysis. Lancet Glob Health. 2014;2:e106–e116. doi: 10.1016/S2214-109X(13)70145-1. [DOI] [PubMed] [Google Scholar]
- 2.AMD Alliance International 2010 The Global Economic Cost of Visual Impairment, March 2010. Available at http://www.icoph.org/resources/146/The-Global-Economic-Cost-of-Visual-Impairment.html. Accessed April 28, 2017.
- 3.Lambert NG, et al. Risk factors and biomarkers of age-related macular degeneration. Prog Retin Eye Res. 2016;54:64–102. doi: 10.1016/j.preteyeres.2016.04.003. [DOI] [PMC free article] [PubMed] [Google Scholar]
- 4.Weikel KA, Chiu CJ, Taylor A. Nutritional modulation of age-related macular degeneration. Mol Aspects Med. 2012;33:318–375. doi: 10.1016/j.mam.2012.03.005. [DOI] [PMC free article] [PubMed] [Google Scholar]
- 5.Age-Related Eye Disease Study 2 Research Group Lutein + zeaxanthin and omega-3 fatty acids for age-related macular degeneration: The Age-Related Eye Disease Study 2 (AREDS2) randomized clinical trial. JAMA. 2013;309:2005–2015. doi: 10.1001/jama.2013.4997. [DOI] [PubMed] [Google Scholar]
- 6.Seddon JM. Genetic and environmental underpinnings to age-related ocular diseases. Invest Ophthalmol Vis Sci. 2013;54:ORSF28-30. doi: 10.1167/iovs.13-13234. [DOI] [PMC free article] [PubMed] [Google Scholar]
- 7.Chiu CJ, Taylor A. Dietary hyperglycemia, glycemic index and metabolic retinal diseases. Prog Retin Eye Res. 2011;30:18–53. doi: 10.1016/j.preteyeres.2010.09.001. [DOI] [PMC free article] [PubMed] [Google Scholar]
- 8.Kaushik S, et al. Dietary glycemic index and the risk of age-related macular degeneration. Am J Clin Nutr. 2008;88:1104–1110. doi: 10.1093/ajcn/88.4.1104. [DOI] [PubMed] [Google Scholar]
- 9.Chiu CJ, Milton RC, Gensler G, Taylor A. Association between dietary glycemic index and age-related macular degeneration in nondiabetic participants in the Age-Related Eye Disease Study. Am J Clin Nutr. 2007;86:180–188. doi: 10.1093/ajcn/86.1.180. [DOI] [PubMed] [Google Scholar]
- 10.Weikel KA, et al. Natural history of age-related retinal lesions that precede AMD in mice fed high or low glycemic index diets. Invest Ophthalmol Vis Sci. 2012;53:622–632. doi: 10.1167/iovs.11-8545. [DOI] [PMC free article] [PubMed] [Google Scholar]
- 11.Uchiki T, et al. Glycation-altered proteolysis as a pathobiologic mechanism that links dietary glycemic index, aging, and age-related disease (in nondiabetics) Aging Cell. 2012;11:1–13. doi: 10.1111/j.1474-9726.2011.00752.x. [DOI] [PMC free article] [PubMed] [Google Scholar]
- 12.Loske C, et al. Cytotoxicity of advanced glycation endproducts is mediated by oxidative stress. J Neural Transm (Vienna) 1998;105:1005–1015. doi: 10.1007/s007020050108. [DOI] [PubMed] [Google Scholar]
- 13.Vlassara H, Striker GE. Advanced glycation endproducts in diabetes and diabetic complications. Endocrinol Metab Clin North Am. 2013;42:697–719. doi: 10.1016/j.ecl.2013.07.005. [DOI] [PubMed] [Google Scholar]
- 14.Pennesi ME, Neuringer M, Courtney RJ. Animal models of age related macular degeneration. Mol Aspects Med. 2012;33:487–509. doi: 10.1016/j.mam.2012.06.003. [DOI] [PMC free article] [PubMed] [Google Scholar]
- 15.Toomey CB, Kelly U, Saban DR, Bowes Rickman C. Regulation of age-related macular degeneration-like pathology by complement factor H. Proc Natl Acad Sci USA. 2015;112:E3040–E3049. doi: 10.1073/pnas.1424391112. [DOI] [PMC free article] [PubMed] [Google Scholar]
- 16.Woodell A, et al. A targeted inhibitor of the alternative complement pathway accelerates recovery from smoke-induced ocular injury. Invest Ophthalmol Vis Sci. 2016;57:1728–1737. doi: 10.1167/iovs.15-18471. [DOI] [PMC free article] [PubMed] [Google Scholar]
- 17.Espinosa-Heidmann DG, et al. Cigarette smoke-related oxidants and the development of sub-RPE deposits in an experimental animal model of dry AMD. Invest Ophthalmol Vis Sci. 2006;47:729–737. doi: 10.1167/iovs.05-0719. [DOI] [PubMed] [Google Scholar]
- 18.Handa JT. How does the macula protect itself from oxidative stress? Mol Aspects Med. 2012;33:418–435. doi: 10.1016/j.mam.2012.03.006. [DOI] [PMC free article] [PubMed] [Google Scholar]
- 19.Scribner KB, Pawlak DB, Aubin CM, Majzoub JA, Ludwig DS. Long-term effects of dietary glycemic index on adiposity, energy metabolism, and physical activity in mice. Am J Physiol Endocrinol Metab. 2008;295:E1126–E1131. doi: 10.1152/ajpendo.90487.2008. [DOI] [PMC free article] [PubMed] [Google Scholar]
- 20.Nankervis SA, Mitchell JM, Charchar FJ, McGlynn MA, Lewandowski PA. Consumption of a low glycaemic index diet in late life extends lifespan of Balb/c mice with differential effects on DNA damage. Longev Healthspan. 2013;2:4. doi: 10.1186/2046-2395-2-4. [DOI] [PMC free article] [PubMed] [Google Scholar]
- 21.Leiter EH. Selecting the “right” mouse model for metabolic syndrome and type 2 diabetes research. Methods Mol Biol. 2009;560:1–17. doi: 10.1007/978-1-59745-448-3_1. [DOI] [PubMed] [Google Scholar]
- 22.King AJ. The use of animal models in diabetes research. Br J Pharmacol. 2012;166:877–894. doi: 10.1111/j.1476-5381.2012.01911.x. [DOI] [PMC free article] [PubMed] [Google Scholar]
- 23.LaVail MM, Gorrin GM, Repaci MA, Yasumura D. Light-induced retinal degeneration in albino mice and rats: Strain and species differences. Prog Clin Biol Res. 1987;247:439–454. [PubMed] [Google Scholar]
- 24.Rowan S, et al. Cfh genotype interacts with dietary glycemic index to modulate age-related macular degeneration-like features in mice. Invest Ophthalmol Vis Sci. 2014;55:492–501. doi: 10.1167/iovs.13-12413. [DOI] [PMC free article] [PubMed] [Google Scholar]
- 25.Samuel MA, et al. LKB1 and AMPK regulate synaptic remodeling in old age. Nat Neurosci. 2014;17:1190–1197. doi: 10.1038/nn.3772. [DOI] [PMC free article] [PubMed] [Google Scholar]
- 26.Zanzottera EC, et al. The Project MACULA retinal pigment epithelium grading system for histology and optical coherence tomography in age-related macular degeneration. Invest Ophthalmol Vis Sci. 2015;56:3253–3268. doi: 10.1167/iovs.15-16431. [DOI] [PMC free article] [PubMed] [Google Scholar]
- 27.Sarks S, Cherepanoff S, Killingsworth M, Sarks J. Relationship of basal laminar deposit and membranous debris to the clinical presentation of early age-related macular degeneration. Invest Ophthalmol Vis Sci. 2007;48:968–977. doi: 10.1167/iovs.06-0443. [DOI] [PubMed] [Google Scholar]
- 28.Marmorstein LY, et al. Aberrant accumulation of EFEMP1 underlies drusen formation in Malattia Leventinese and age-related macular degeneration. Proc Natl Acad Sci USA. 2002;99:13067–13072. doi: 10.1073/pnas.202491599. [DOI] [PMC free article] [PubMed] [Google Scholar]
- 29.Ferrington DA, Sinha D, Kaarniranta K. Defects in retinal pigment epithelial cell proteolysis and the pathology associated with age-related macular degeneration. Prog Retin Eye Res. 2016;51:69–89. doi: 10.1016/j.preteyeres.2015.09.002. [DOI] [PMC free article] [PubMed] [Google Scholar]
- 30.Rabbani N, Thornalley PJ. Dicarbonyl stress in cell and tissue dysfunction contributing to ageing and disease. Biochem Biophys Res Commun. 2015;458:221–226. doi: 10.1016/j.bbrc.2015.01.140. [DOI] [PubMed] [Google Scholar]
- 31.Glenn JV, Stitt AW. The role of advanced glycation end products in retinal ageing and disease. Biochim Biophys Acta. 2009;1790:1109–1116. doi: 10.1016/j.bbagen.2009.04.016. [DOI] [PubMed] [Google Scholar]
- 32.Ni J, et al. Clinical Genomic and Proteomic AMD Study Group Plasma protein pentosidine and carboxymethyllysine, biomarkers for age-related macular degeneration. Mol Cell Proteomics. 2009;8:1921–1933. doi: 10.1074/mcp.M900127-MCP200. [DOI] [PMC free article] [PubMed] [Google Scholar]
- 33.Berner AK, et al. Protection against methylglyoxal-derived AGEs by regulation of glyoxalase 1 prevents retinal neuroglial and vasodegenerative pathology. Diabetologia. 2012;55:845–854. doi: 10.1007/s00125-011-2393-0. [DOI] [PubMed] [Google Scholar]
- 34.Wang H, et al. Clinical Genomic and Proteomic AMD Study Group Detection and biological activities of carboxyethylpyrrole ethanolamine phospholipids (CEP-EPs) Chem Res Toxicol. 2014;27:2015–2022. doi: 10.1021/tx500216a. [DOI] [PMC free article] [PubMed] [Google Scholar]
- 35.De La Paz M, Anderson RE. Region and age-dependent variation in susceptibility of the human retina to lipid peroxidation. Invest Ophthalmol Vis Sci. 1992;33:3497–3499. [PubMed] [Google Scholar]
- 36.Fliesler SJ, Anderson RE. Chemistry and metabolism of lipids in the vertebrate retina. Prog Lipid Res. 1983;22:79–131. doi: 10.1016/0163-7827(83)90004-8. [DOI] [PubMed] [Google Scholar]
- 37.Hollyfield JG, et al. Oxidative damage-induced inflammation initiates age-related macular degeneration. Nat Med. 2008;14:194–198. doi: 10.1038/nm1709. [DOI] [PMC free article] [PubMed] [Google Scholar]
- 38.Gu X, et al. Carboxyethylpyrrole protein adducts and autoantibodies, biomarkers for age-related macular degeneration. J Biol Chem. 2003;278:42027–42035. doi: 10.1074/jbc.M305460200. [DOI] [PubMed] [Google Scholar]
- 39.Wikoff WR, et al. Metabolomics analysis reveals large effects of gut microflora on mammalian blood metabolites. Proc Natl Acad Sci USA. 2009;106:3698–3703. doi: 10.1073/pnas.0812874106. [DOI] [PMC free article] [PubMed] [Google Scholar]
- 40.Zhang LS, Davies SS. Microbial metabolism of dietary components to bioactive metabolites: Opportunities for new therapeutic interventions. Genome Med. 2016;8:46. doi: 10.1186/s13073-016-0296-x. [DOI] [PMC free article] [PubMed] [Google Scholar]
- 41.Collier RJ, et al. Agonists at the serotonin receptor (5-HT(1A)) protect the retina from severe photo-oxidative stress. Invest Ophthalmol Vis Sci. 2011;52:2118–2126. doi: 10.1167/iovs.10-6304. [DOI] [PubMed] [Google Scholar]
- 42.Tullis BE, et al. Sarpogrelate, a 5-HT2A Receptor Antagonist, Protects the Retina From Light-Induced Retinopathy. Invest Ophthalmol Vis Sci. 2015;56:4560–4569. doi: 10.1167/iovs.15-16378. [DOI] [PMC free article] [PubMed] [Google Scholar]
- 43.Biswal MR, et al. Systemic treatment with a 5HT1a agonist induces anti-oxidant protection and preserves the retina from mitochondrial oxidative stress. Exp Eye Res. 2015;140:94–105. doi: 10.1016/j.exer.2015.07.022. [DOI] [PMC free article] [PubMed] [Google Scholar]
- 44.Renganathan K, et al. CEP biomarkers as potential tools for monitoring therapeutics. PLoS One. 2013;8:e76325. doi: 10.1371/journal.pone.0076325. [DOI] [PMC free article] [PubMed] [Google Scholar]
- 45.Yatsunenko T, et al. Human gut microbiome viewed across age and geography. Nature. 2012;486:222–227. doi: 10.1038/nature11053. [DOI] [PMC free article] [PubMed] [Google Scholar]
- 46.Langille MG, et al. Microbial shifts in the aging mouse gut. Microbiome. 2014;2:50. doi: 10.1186/s40168-014-0050-9. [DOI] [PMC free article] [PubMed] [Google Scholar]
- 47.Clemente JC, Ursell LK, Parfrey LW, Knight R. The impact of the gut microbiota on human health: An integrative view. Cell. 2012;148:1258–1270. doi: 10.1016/j.cell.2012.01.035. [DOI] [PMC free article] [PubMed] [Google Scholar]
- 48.Yano JM, et al. Indigenous bacteria from the gut microbiota regulate host serotonin biosynthesis. Cell. 2015;161:264–276. doi: 10.1016/j.cell.2015.02.047. [DOI] [PMC free article] [PubMed] [Google Scholar]
- 49.Sarkar S, et al. Neuroprotective effect of the chemical chaperone, trehalose in a chronic MPTP-induced Parkinson’s disease mouse model. Neurotoxicology. 2014;44:250–262. doi: 10.1016/j.neuro.2014.07.006. [DOI] [PubMed] [Google Scholar]
- 50.Emanuele E. Can trehalose prevent neurodegeneration? Insights from experimental studies. Curr Drug Targets. 2014;15:551–557. doi: 10.2174/1389450115666140225104705. [DOI] [PubMed] [Google Scholar]
- 51.Kurihara T, et al. Hypoxia-induced metabolic stress in retinal pigment epithelial cells is sufficient to induce photoreceptor degeneration. eLife. 2016;5:5. doi: 10.7554/eLife.14319. [DOI] [PMC free article] [PubMed] [Google Scholar]
- 52.Pikuleva IA, Curcio CA. Cholesterol in the retina: The best is yet to come. Prog Retin Eye Res. 2014;41:64–89. doi: 10.1016/j.preteyeres.2014.03.002. [DOI] [PMC free article] [PubMed] [Google Scholar]
- 53.Barber AJ, et al. Neural apoptosis in the retina during experimental and human diabetes. Early onset and effect of insulin. J Clin Invest. 1998;102:783–791. doi: 10.1172/JCI2425. [DOI] [PMC free article] [PubMed] [Google Scholar]
- 54.Aizu Y, Oyanagi K, Hu J, Nakagawa H. Degeneration of retinal neuronal processes and pigment epithelium in the early stage of the streptozotocin-diabetic rats. Neuropathology. 2002;22:161–170. doi: 10.1046/j.1440-1789.2002.00439.x. [DOI] [PubMed] [Google Scholar]
- 55.Martin PM, Roon P, Van Ells TK, Ganapathy V, Smith SB. Death of retinal neurons in streptozotocin-induced diabetic mice. Invest Ophthalmol Vis Sci. 2004;45:3330–3336. doi: 10.1167/iovs.04-0247. [DOI] [PubMed] [Google Scholar]
- 56.Boynton GE, et al. Multimodal characterization of proliferative diabetic retinopathy reveals alterations in outer retinal function and structure. Ophthalmology. 2015;122:957–967. doi: 10.1016/j.ophtha.2014.12.001. [DOI] [PMC free article] [PubMed] [Google Scholar]
- 57.Badr GA, Tang J, Ismail-Beigi F, Kern TS. Diabetes downregulates GLUT1 expression in the retina and its microvessels but not in the cerebral cortex or its microvessels. Diabetes. 2000;49:1016–1021. doi: 10.2337/diabetes.49.6.1016. [DOI] [PubMed] [Google Scholar]
- 58.Sohn EJ, Kim YS, Kim CS, Lee YM, Kim JS. KIOM-79 prevents apoptotic cell death and AGEs accumulation in retinas of diabetic db/db mice. J Ethnopharmacol. 2009;121:171–174. doi: 10.1016/j.jep.2008.09.036. [DOI] [PubMed] [Google Scholar]
- 59.Genuth S, et al. DCCT/EDIC Research Group Skin advanced glycation end products glucosepane and methylglyoxal hydroimidazolone are independently associated with long-term microvascular complication progression of type 1 diabetes. Diabetes. 2015;64:266–278. doi: 10.2337/db14-0215. [DOI] [PMC free article] [PubMed] [Google Scholar]
- 60.Shang F, Taylor A. Roles for the ubiquitin-proteasome pathway in protein quality control and signaling in the retina: Implications in the pathogenesis of age-related macular degeneration. Mol Aspects Med. 2012;33:446–466. doi: 10.1016/j.mam.2012.04.001. [DOI] [PMC free article] [PubMed] [Google Scholar]
- 61.Diaz Heijtz R, et al. Normal gut microbiota modulates brain development and behavior. Proc Natl Acad Sci USA. 2011;108:3047–3052. doi: 10.1073/pnas.1010529108. [DOI] [PMC free article] [PubMed] [Google Scholar]
- 62.Besharse JC, Spratt G, Reif-Lehrer L. Effects of kynurenate and other excitatory amino acid antagonists as blockers of light- and kainate-induced retinal rod photoreceptor disc shedding. J Comp Neurol. 1988;274:295–303. doi: 10.1002/cne.902740212. [DOI] [PubMed] [Google Scholar]
- 63.Mackenzie AE, Milligan G. The emerging pharmacology and function of GPR35 in the nervous system. Neuropharmacol. 2015;113:661–671. doi: 10.1016/j.neuropharm.2015.07.035. [DOI] [PubMed] [Google Scholar]
- 64.Andriessen EM, et al. Gut microbiota influences pathological angiogenesis in obesity-driven choroidal neovascularization. EMBO Mol Med. 2016;8:1366–1379. doi: 10.15252/emmm.201606531. [DOI] [PMC free article] [PubMed] [Google Scholar]
- 65.Zinkernagel MS, et al. Association of the intestinal microbiome with the development of neovascular age-related macular degeneration. Sci Rep. 2017;7:40826. doi: 10.1038/srep40826. [DOI] [PMC free article] [PubMed] [Google Scholar]
- 66.Bylesjö M, Eriksson D, Kusano M, Moritz T, Trygg J. Data integration in plant biology: The O2PLS method for combined modeling of transcript and metabolite data. Plant J. 2007;52:1181–1191. doi: 10.1111/j.1365-313X.2007.03293.x. [DOI] [PubMed] [Google Scholar]
- 67.Mevik B, Wehrens R. The pls package: Principal component and partial least squares regression in R. J Stat Softw. 2007;18:1–24. [Google Scholar]
- 68.Bylesjo M, et al. OPLS discriminant analysis: Combining the strengths of PLS-DA and SIMCA classification. J Chemometr. 2006;20:341–351. [Google Scholar]
- 69.Benjamini Y, Hochberg Y. Controlling the false discovery rate: A practical and powerful approach to multiple testing. J R Stat Soc B. 1995;95:289–300. [Google Scholar]
- 70.Rabbani N, Shaheen F, Anwar A, Masania J, Thornalley PJ. Assay of methylglyoxal-derived protein and nucleotide AGEs. Biochem Soc Trans. 2014;42:511–517. doi: 10.1042/BST20140019. [DOI] [PubMed] [Google Scholar]
- 71.Townsend MK, et al. Reproducibility of metabolomic profiles among men and women in 2 large cohort studies. Clin Chem. 2013;59:1657–1667. doi: 10.1373/clinchem.2012.199133. [DOI] [PMC free article] [PubMed] [Google Scholar]
- 72.Weljie AM, Newton J, Mercier P, Carlson E, Slupsky CM. Targeted profiling: Quantitative analysis of 1H NMR metabolomics data. Anal Chem. 2006;78:4430–4442. doi: 10.1021/ac060209g. [DOI] [PubMed] [Google Scholar]
- 73.Suez J, et al. Artificial sweeteners induce glucose intolerance by altering the gut microbiota. Nature. 2014;514:181–186. doi: 10.1038/nature13793. [DOI] [PubMed] [Google Scholar]
- 74.Zeevi D, et al. Personalized nutrition by prediction of glycemic responses. Cell. 2015;163:1079–1094. doi: 10.1016/j.cell.2015.11.001. [DOI] [PubMed] [Google Scholar]
- 75.Shannon P, et al. Cytoscape: A software environment for integrated models of biomolecular interaction networks. Genome Res. 2003;13:2498–2504. doi: 10.1101/gr.1239303. [DOI] [PMC free article] [PubMed] [Google Scholar]
- 76.Troyanskaya O, et al. Missing value estimation methods for DNA microarrays. Bioinformatics. 2001;17:520–525. doi: 10.1093/bioinformatics/17.6.520. [DOI] [PubMed] [Google Scholar]
- 77.Wishart DS, et al. HMDB: A knowledgebase for the human metabolome. Nucleic Acids Res. 2009;37:D603–D610. doi: 10.1093/nar/gkn810. [DOI] [PMC free article] [PubMed] [Google Scholar]
- 78.Bouatra S, et al. The human urine metabolome. PLoS One. 2013;8:e73076. doi: 10.1371/journal.pone.0073076. [DOI] [PMC free article] [PubMed] [Google Scholar]
- 79.Jung JY, et al. 1H NMR-based metabolite profiling of diet-induced obesity in a mouse mode. BMB Rep. 2012;45:419–424. doi: 10.5483/bmbrep.2012.45.7.248. [DOI] [PubMed] [Google Scholar]
- 80.Frolkis A, et al. SMPDB: The small molecule pathway database. Nucleic Acids Res. 2010;38:D480–D487. doi: 10.1093/nar/gkp1002. [DOI] [PMC free article] [PubMed] [Google Scholar]
- 81.Bolger AM, Lohse M, Usadel B. Trimmomatic: A flexible trimmer for Illumina sequence data. Bioinformatics. 2014;30:2114–2120. doi: 10.1093/bioinformatics/btu170. [DOI] [PMC free article] [PubMed] [Google Scholar]
- 82.Zhang J, Kobert K, Flouri T, Stamatakis A. PEAR: A fast and accurate Illumina Paired-End reAd mergeR. Bioinformatics. 2014;30:614–620. doi: 10.1093/bioinformatics/btt593. [DOI] [PMC free article] [PubMed] [Google Scholar]
- 83.Edgar RC. UPARSE: Highly accurate OTU sequences from microbial amplicon reads. Nat Methods. 2013;10:996–998. doi: 10.1038/nmeth.2604. [DOI] [PubMed] [Google Scholar]
- 84.Caporaso JG, et al. QIIME allows analysis of high-throughput community sequencing data. Nat Methods. 2010;7:335–336. doi: 10.1038/nmeth.f.303. [DOI] [PMC free article] [PubMed] [Google Scholar]
- 85.Langille MG, et al. Predictive functional profiling of microbial communities using 16S rRNA marker gene sequences. Nat Biotechnol. 2013;31:814–821. doi: 10.1038/nbt.2676. [DOI] [PMC free article] [PubMed] [Google Scholar]
- 86.DeSantis TZ, et al. Greengenes, a chimera-checked 16S rRNA gene database and workbench compatible with ARB. Appl Environ Microbiol. 2006;72:5069–5072. doi: 10.1128/AEM.03006-05. [DOI] [PMC free article] [PubMed] [Google Scholar]
- 87.Nagai R, et al. Immunochemical detection of Nepsilon-(carboxyethyl)lysine using a specific antibody. J Immunol Methods. 2008;332:112–120. doi: 10.1016/j.jim.2007.12.020. [DOI] [PubMed] [Google Scholar]
- 88.Matsumoto K, Fujiwara Y, Nagai R, Yoshida M. Immunohistochemical detection of advanced glycation end products in human bladder with specific monoclonal antibody. Int J Urol. 2009;16:402–405, discussion 405–406. doi: 10.1111/j.1442-2042.2009.02259.x. [DOI] [PubMed] [Google Scholar]
- 89.Nishikawa T, et al. Normalizing mitochondrial superoxide production blocks three pathways of hyperglycaemic damage. Nature. 2000;404:787–790. doi: 10.1038/35008121. [DOI] [PubMed] [Google Scholar]
- 90.Russell WR, et al. Major phenylpropanoid-derived metabolites in the human gut can arise from microbial fermentation of protein. Mol Nutr Food Res. 2013;57:523–535. doi: 10.1002/mnfr.201200594. [DOI] [PubMed] [Google Scholar]
- 91.Tang WH, et al. Intestinal microbial metabolism of phosphatidylcholine and cardiovascular risk. N Engl J Med. 2013;368:1575–1584. doi: 10.1056/NEJMoa1109400. [DOI] [PMC free article] [PubMed] [Google Scholar]
- 92.Koeth RA, et al. Intestinal microbiota metabolism of L-carnitine, a nutrient in red meat, promotes atherosclerosis. Nat Med. 2013;19:576–585. doi: 10.1038/nm.3145. [DOI] [PMC free article] [PubMed] [Google Scholar]
- 93.al-Waiz M, Mikov M, Mitchell SC, Smith RL. The exogenous origin of trimethylamine in the mouse. Metabolism. 1992;41:135–136. doi: 10.1016/0026-0495(92)90140-6. [DOI] [PubMed] [Google Scholar]
- 94.Clarke G, et al. The microbiome-gut-brain axis during early life regulates the hippocampal serotonergic system in a sex-dependent manner. Mol Psychiatry. 2013;18:666–673. doi: 10.1038/mp.2012.77. [DOI] [PubMed] [Google Scholar]
- 95.Yap IK, et al. Metabonomic and microbiological analysis of the dynamic effect of vancomycin-induced gut microbiota modification in the mouse. J Proteome Res. 2008;7:3718–3728. doi: 10.1021/pr700864x. [DOI] [PubMed] [Google Scholar]
- 96.Yuan JP, Wang JH, Liu X. Metabolism of dietary soy isoflavones to equol by human intestinal microflora–implications for health. Mol Nutr Food Res. 2007;51:765–781. doi: 10.1002/mnfr.200600262. [DOI] [PubMed] [Google Scholar]
- 97.Sayin SI, et al. Gut microbiota regulates bile acid metabolism by reducing the levels of tauro-beta-muricholic acid, a naturally occurring FXR antagonist. Cell Metab. 2013;17:225–235. doi: 10.1016/j.cmet.2013.01.003. [DOI] [PubMed] [Google Scholar]


