

Summary
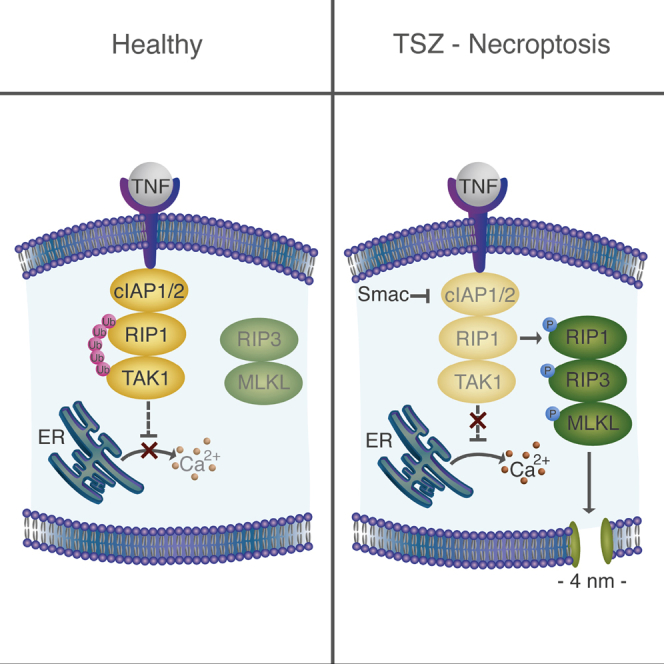
Necroptosis is a form of regulated necrosis that results in cell death and content release after plasma membrane permeabilization. However, little is known about the molecular events responsible for the disruption of the plasma membrane. Here, we find that early increase in cytosolic calcium in TNF-induced necroptosis is mediated by treatment with a Smac mimetic via the TNF/RIP1/TAK1 survival pathway. This does not require the activation of the necrosome and is dispensable for necroptosis. Necroptosis induced by the activation of TLR3/4 pathways does not trigger early calcium flux. We also demonstrate that necroptotic plasma membrane rupture is mediated by osmotic forces and membrane pores around 4 nm in diameter. This late permeabilization step represents a hallmark in necroptosis execution that is cell and treatment independent and requires the RIP1/RIP3/MLKL core. In support of this, treatment with osmoprotectants reduces cell damage in an in vivo necroptosis model of ischemia-reperfusion injury.
Keywords: necroptosis, calcium signaling, Smac mimetics, membrane pores, TNF
Graphical Abstract
Highlights
-
•
Early calcium signaling in TSZ necroptosis correlates with cellular levels of cIAP1/2
-
•
Calcium flux is induced by a Smac mimetic and is dispensable for necroptosis execution
-
•
Pores ∼4 nm in diameter mediate final plasma membrane disruption in necroptosis
Ros et al. find that calcium flux induced by a Smac mimetic is dispensable for necroptosis execution. The authors identify the formation of calcium-independent nanopores at the plasma membrane and find that this is important for necroptosis execution.
Introduction
Necroptosis has captured the attention of scientists during the last decade as an alternative, non-apoptotic form of regulated cell death (de Almagro and Vucic, 2015, Oberst, 2016, Wallach et al., 2016). It holds particular appeal due to its implication in multiple pathophysiological conditions such as acute pancreatitis (He et al., 2009, Zhang et al., 2009), ischemic injury (Linkermann et al., 2012), and retinal detachment (Gao et al., 2014). Moreover, necroptosis is gaining relevance as a form of cell death induced by bacterial (Blériot and Lecuit, 2016) and viral (Kaiser et al., 2013) infections.
Necroptosis involves cellular swelling and plasma membrane rupture leading to cell lysis and the immunogenic release of the cellular components. In contrast to accidental necrosis, it does not take place accidentally, but it is tightly regulated by a genetically encoded signaling pathway that is triggered under conditions of caspase inactivation (de Almagro and Vucic, 2015, Oberst, 2016). In general, necroptosis signaling requires the receptor interacting protein kinases 1 and 3 (RIP1 and RIP3), which together with the pseudokinase mixed lineage kinase domain-like (MLKL) form the necrosome. MLKL is therefore a downstream effector of necroptosis that becomes normally activated upon phosphorylation by RIP3. This then drives MLKL oligomerization and translocation to the plasma membrane, which is a necessary event for final plasma membrane permeabilization and cell death (Cai et al., 2014, Zhang et al., 2016).
The best-characterized pathway leading to necroptosis involves tumor necrosis factor α (TNF-α) engagement to the TNF-α receptor. Experimentally, it is induced by a combination of TNF-α treatment with molecules that sensitize its activity such as second mitochondria-derived activator of caspases (Smac) mimetics, inhibitors of RNA, or protein synthesis and caspase inhibitors (Tait et al., 2014, Wallach et al., 2016). This pathway shares initial steps with apoptosis and with the nuclear factor κB (NF-κB) survival signaling pathways. In addition, necroptosis can also be activated by treatment with Toll-like receptors (TLR) agonists (Dillon and Green, 2016, Kaiser et al., 2013, Vanden Berghe et al., 2014).
The key step in necroptosis execution is the final disruption of the plasma membrane integrity. However, the molecular mechanism causing the loss of plasma membrane impermeability remains controversial. It has been proposed that MLKL, as the most final effector identified so far in the pathway, functions by directly or indirectly permeabilizing the plasma membrane (Sun et al., 2012, Zhao et al., 2012, Zhang et al., 2016). On the other hand, the role of calcium in necroptosis remains unsettled. It was suggested that calcium influx mediated by the channel TRPM7 is required for necroptosis downstream of MLKL (Cai et al., 2014). However, this theory was recently challenged by observations that attribute calcium oscillations in necroptosis to the efflux from intracellular reservoirs (Ousingsawat et al., 2017). The problem is that the molecular events leading to final plasma membrane permeabilization in necroptosis remain barely explored.
Here, we characterized the mechanism of plasma membrane permeabilization that happens during necroptosis triggered by two different pathways: (1) the classical necroptotic treatment promoted by the TNF-α combined with a Smac mimetic and a pan caspase inhibitor, and (2) the activation of TLR3/4 also combined with a pan caspase inhibitor. Using live-cell imaging of different mouse fibroblasts and human adenocarcinoma cell lines, we tracked calcium flux, changes in cell shape, and final plasma membrane rupture (monitored by propidium iodide [PI] intake). We show that two independent events occur during necroptosis: early calcium flux, likely mediated by ion channels, and late plasma membrane breakdown via membrane pores. Strikingly, early calcium flux is cell type independent, not essential for necroptosis and seems to be a molecular event consequence of Smac treatment. In contrast, the formation of plasma membrane nanopores at a later stage in the signaling pathway triggers both calcium signaling and PI intake in a cell- and treatment-independent manner. As a consequence, the formation of small pores in the plasma membrane of cells can be considered as a general feature in necroptosis that drives final membrane disruption. In support of this hypothesis, treatment with osmoprotectants reduces cell death during ischemia-reperfusion injury (IRI) in mice.
Results
Membrane Breakdown in Necroptosis Is Preceded by Cell Shrinkage, Detachment, and Rounding
We first compared the ability of different cells lines to undergo necroptosis. To this end, we used different mouse fibroblasts (L929, NIH 3T3, and mouse embryonic fibroblast [MEF]), human adenocarcinoma cells (HT-29), or human embryonic kidney (HEK) cells (He et al., 2009, Sun et al., 2012, Zhang et al., 2011). First, we evaluated the kinetics of PI intake upon the most currently used necroptosis treatment, which includes a combination of tumor necrosis factor (T), a Smac mimetic (S) (here LCL-161), and the pan caspase inhibitor zVAD (Z), from now on TSZ. L929, NIH 3T3, MEF, and HT-29 cells all responded to treatment with TSZ, albeit with different kinetics and extension (Figure S1A). As a control, HEK cells did not undergo necroptotic cell death due to their deficiency in RIP3 (He et al., 2009). To confirm that PI intake was caused by necroptosis, we tested the effect of necrostatin-1 (Nec-1). Nec-1 targets RIP1 kinase activity and blocks the RIP1-RIP3 complex and necrosome formation (Vandenabeele et al., 2013). As for HT-29, we also evaluated the effect of necrosulfonamide (NSA) that specifically inhibits human MLKL (Sun et al., 2012). Cell death was inhibited in all cell lines, thereby suggesting its necroptotic nature (Figure S1B).
To further characterize necroptosis in these cell lines, we followed in parallel the changes in cell shape and PI intake by live-cell imaging at 37°C. L929 and NIH 3T3 cells (Figures S1C and S1D) first shrank, detached, and became round after necroptosis stimuli. Membrane breakdown, monitored by PI intake, was a latter event that took place concomitant with cell collapse. Although shrinkage was a phenotypic event common with apoptosis (Figure S1E), apoptotic blebs were not observed upon TSZ treatment (Figures S1C and S1D). Moreover, such a sequence of necroptotic phenotypic events was clearly different from toxin-induced (Figure S1F) or mechanical-induced necrosis (data not shown). Necrotic cell death was characterized by initial membrane injury initiated with PI intake and followed by the development of swelling blebs without cell detachment. Indeed, cell swelling was not always easily detected upon TSZ-induced necroptosis (Figures S1C and S1D).
Early Calcium Flux Is Not Inhibited by Necrostatin-1
To characterize calcium flux associated with necroptosis, we treated the cells with the non-fluorescent marker fluo-4 acetoxymethyl (Fluo-4 AM), which is cleaved inside cells to yield the impermeant, fluorescent form of the calcium indicator (Stosiek et al., 2003). A clear increase in calcium concentration was detected in the cytosol of L929, NIH 3T3, and HT-29 upon TSZ treatment (Figure 1A). This event preceded PI intake and therefore irreversible plasma membrane breakdown in all the cell lines. To quantitatively characterize calcium flux, we selected individual cells (n = 50–200) at different time points and measured the most probable fluorescence intensity in the population (Figures 1B–1D). Calcium flux was a fast, early event, observed a few minutes after treatment in all L929, NIH 3T3, and MEF cells. However, in the case of HT-29 cells, calcium signal was delayed and took place in the same time range of PI intake (Figures 1A and 1E). For this last cell line, we classified the cells as Fluo-4/Ca positive since there was a significant population that remained impermeable to calcium at all times measured (Figure 1E). Indeed, even after 4 hr of treatment more than half of the HT-29 cell population remained negative to Fluo-4/Ca signal (Figures 1A and 1E).
Figure 1.

Early Calcium Flux and PI Intake Are Independent Events in Necroptosis
(A) Time series of calcium and PI intake during TSZ-induced necroptosis. Scale bar, 50 μm. Pictures are representative of at least three independent experiments.
(B–D) Kinetics of calcium flux, change in cell shape, and PI intake in mouse fibroblasts.
(E) Kinetics of calcium flux and PI intake in HT-29 cells.
(F) Effect of RIP3 or MLKL deletion in NIH 3T3 knockout cells. Cyan, y axis: Fluo-4/Ca fluorescence intensity per cell; gray, y axis: circularity absolute value; orange, y axis: PI-positive cells. The x axis is common for all parameters plotted in the y axis. The values represent the mean and the SD of at least three independent experiments. Error bars represent the SD from the measurements. Lines correspond to the best fitting of the data.
See also Figure S1.
To relate calcium flux to other phenotypic alterations during necroptosis, we estimated, for the same cell population, the circularity as a parameter for cell shape and classified each cell as PI positive or negative. This allows the simultaneous comparison of kinetics of calcium signal, change in cell shape, and PI intake (Figures 1B–1D). We could not detect any cell-shape change in HT-29 cells because they are intrinsically round. From the kinetic curves, we calculated the parameter t50, which represents the time required to achieve 50% increase of each phenotypical event. This allowed us to set the time frame in which every process happened after necroptosis induction and to compare the response of different cell lines.
Early calcium flux (in the first 1 hr after treatment) was observed in L929 and NIH 3T3 cells, as well as in MEF cells, although with different kinetics. In L929 cells, 50% of the increase of the Fluo-4/Ca signal was observed as early as 30 min after treatment, while in NIH 3T3 and MEF cells it took around 1 hr and 1 hr 30 min, respectively (Figures 1B–1D). In all these cell lines, calcium flux was followed by cell-shape changes (t50 in L929 ∼45 min, in NIH 3T3 ∼1 hr 30 min, in MEF ∼2 hr 30 min) and final PI intake (t50 in L929 ∼1 hr, in NIH 3T3 ∼2 hr 30 min, in MEF >4 hr). In contrast, HT-29 cells were characterized by a unique, late calcium flux event, which took slightly less time (∼30 min) than PI intake (t50 5–6 hr) (Figure 1E).
These results suggest the activation of two distinct events after TSZ stimuli: an early event, characterized by calcium flux, and a late event, which activates both calcium signaling and PI intake. To further determine the molecular nature of these events, we assessed the effect of Nec-1 on calcium and PI flux, as well as on cell shape. Strikingly, early calcium flux was not inhibited by Nec-1 in L929, NIH 3T3, and MEF cells, although, as expected, both cell-shape rounding and membrane breakdown were delayed in the presence of the necroptosis inhibitor (Figures 1B–1D and S1G). Moreover, early calcium flux was not affected in TSZ-treated NIH 3T3 cell knockout for RIP3 or MLKL, even though necroptosis was completely abolished (cellular shape remained unaltered and there was no membrane breakdown) (Figure 1F). In contrast, both calcium flux and PI intake were inhibited in HT-29 cells with either Nec-1 or NSA (Figures 1E and S1G).
Calcium Is Dispensable for Plasma Membrane Breakdown but Could Have a Modulatory Effect
These observations questioned the role of calcium influx in necroptosis signaling. To shed light on this matter, we examined the potential mechanism behind calcium influx and its influence on final plasma membrane disruption during necroptosis. Interestingly, L929 was the only cell line in which necroptosis was enhanced by the presence of external calcium (Figure S2A). In contrast, NIH 3T3 (Figure S2B), MEF (Figure S2C), and HT-29 (Figure S2D) behaved similarly whether the media was devoid of calcium or not, indicating that extracellular calcium is not necessary for necroptosis signaling, although it may have a cell-type-dependent modulatory effect.
To get further insight into the source of calcium flux upon TSZ necroptosis, we evaluated the effect of two different calcium chelating agents (EGTA and BAPTA-AM) on the increase of cytosolic calcium. EGTA is a well-known chelating agent with high affinity for calcium that is widely used to trap extracellular calcium. BAPTA-AM is a cell-permeable version of BAPTA, which is widely used to control its intracellular levels. The rise in calcium after 1 hr of treatment observed in L929 cells was inhibited in the presence of EGTA and BAPTA-AM (Figure 2A), which indicates that this cell line is able to capture calcium both from the extracellular medium and to release it from the intracellular storages. L929 cells finally overcame the effect of BAPTA-AM, since cytosolic calcium levels were restored after 2 hr. On the other hand, there was a drop on the levels of the cytosolic calcium in NIH 3T3 cells when they were pre-incubated with BAPTA-AM (Figure 2B). Surprisingly, trapping the extracellular calcium by EGTA did not inhibit but increased the rise of the cytosolic calcium in this cell line, probably by promoting further release from the intracellular storages. This effect was also overcome around 3 hr after treatment.
Figure 2.

Intracellular and Extracellular Calcium Have Different Effects in TSZ-Induced Necroptosis
(A and B) Effect of EGTA and BAPTA-AM in the kinetics of increase of the intracellular calcium.
(C and D) Kinetics of membrane breakdown in the presence of EGTA or BAPTA-AM. The values represent the mean and the SD of at least three independent experiments. Error bars represent the SD from the measurements. Lines correspond to the best fitting of the data.
See also Figure S2.
Although the effect of completely removing the calcium was more drastic than trapping it with EGTA, we observed a slight inhibition (∼30 min) on the kinetic of cell death in L929 cells in the presence of this agent (Figure 2C). In agreement with the results obtained in the presence of calcium-free media, chelation of the extracellular calcium had no effect on necroptosis in most of the cell lines (Figures 2D, S2E, and S2F). Trapping intracellular calcium inhibited membrane breakdown and cell death in L929 and NIH 3T3 cells (Figures 2C and 2D). However, we did not find a similar effect on MEF or HT-29 cells (Figures S2E and S2F). In general, calcium signaling seems to be dispensable for plasma membrane breakdown and cell death, although it could have a modulatory effect in different cell lines.
Early Calcium Flux Is a Consequence of Treatment with a Smac Mimetic
In an effort to understand the connection between early calcium flux and the activation of the TNF-α pathway, we assessed the effect of the individual components of the TSZ mixture, as well as their binary combinations. Figure 3 shows typical images obtained with L929 (Figure 3A) or NIH 3T3 (Figure 3B) cells after 1 hr treatment with each individual component (T, S, or Z) or binary mixtures (TS, SZ, or TZ). Images (Figures 3A and 3B) and kinetics of calcium flux (Figures 3C and 3D) revealed that only Smac mimetic promoted an increase in the fluorescence signal in both cell lines. In fact, cells responded similarly when treated with Smac mimetic alone (S), with binary combinations containing it (TS and SZ) or with the ternary mixture (TSZ). Early calcium flux activated by a Smac mimetic was totally independent of cell death since none of the single components nor the binary combinations containing it promoted PI intake in the time frame of the confocal experiments (2–4 hr) (Figures 3E and 3F).
Figure 3.

Early Calcium Flux in L929 and NIH 3T3 Cells Is a Consequence of Smac Mimetic Treatment
(A and B) Calcium signal upon different treatments (T, TNF-α; S, Smac mimetic; Z, zVAD; TS, TNF-α + Smac; SZ, Smac + zVAD; TZ, TNF-α + zVAD; TSZ, TNF-α + Smac + zVAD). Images were taken after 1 hr of treatment. Scale bar, 50 μm.
(C and D) Kinetics of calcium flux.
(E and F) Kinetics of PI intake.
(G) Time-series images of the increase in the cytosolic calcium after mitochondria permeabilization upon STS treatment. Scale bar, 10 μm.
(H) Corrected total cell fluorescence (CTCF) of Fluo-4/Ca in individual cells versus the SD (SD) of the fluorescence intensity of Smac1-60-mCherry (n = 4). Time 0 corresponds to the normalized time when both events cross in each cell. Darker lines represent the average of the individual cells.
In (C)–(F), values represent the mean value and SD of at least three independent experiments. Error bars represent the SD from the measurements. Lines correspond to the best fitting of the data. Images are representative of three independent experiments. See also Figure S3.
To further evaluate whether early calcium signal was linked to apoptosis, cell death (Figures S3A–S3C) was measured in parallel to caspase 3/7 activity (after 24 hr) (Figures S3D–S3F). Staurosporine (STS) treatment was included as a positive control of apoptosis (Figures S3A–S3F). L929 was the only cell line that underwent cell death upon every treatment, including single T or S (Figure S3A). We found that apoptosis was activated in the presence of S or TS but not upon T treatment in these cells (Figure S3D). This feature highlights the fact that L929 is a particular cell line with the ability to die through necroptosis upon single TNF-α activation (without additional stimulation), in agreement with previous studies (Fiers et al., 1999, Zhang et al., 2011). This would explain why this cell line is more sensitive to variations in the levels of calcium (Figures 2A, 2C, and S2A). In contrast, cell death was not triggered in NIH 3T3 cells upon S treatment (Figure S3B), but they did undergo apoptosis when treated with T or TS (Figure S3E). As expected, caspase 3/7 activity was inhibited in both cell lines when the pan caspase inhibitor zVAD (Z) was present, which further supported the necroptotic nature of the cell death (Figures S3D and S3E). HT-29 cells were also included in this study as a reference of a cell line that does not experience early increase of the cytosolic calcium (Figures S3C and S3F). Interestingly, these cells were more resistant to cell death and only died upon TS (apoptosis) or TSZ (necroptosis) treatments. Altogether these results suggest that early calcium release takes place independently of the type and extension of cell death.
We then estimated the Fluo-4/Ca-positive cell population upon STS treatment in the three different cell lines (L929, NIH 3T3, and HT-29), to test the possibility that there was a link between early calcium signaling and intrinsic apoptosis. Increase in cytosolic calcium was found as a late, modest event in NIH 3T3 cells (Figure S3G). However, calcium levels remained basal in L929 and HT-29 cells 6 hr after adding of STS.
Therefore, we selected NIH 3T3 cells to relate calcium flux with mitochondria outer membrane permeabilization by means of live-cell imaging (Figure 3G). Smac-1-60-mCherry (a truncated version of Smac targeting the intermembrane space, from now on Smac-mCherry) (Tait et al., 2010) was used as a marker of mitochondria outer membrane permeabilization and apoptosis execution. The Fluo-4/Ca fluorescence was tracked in parallel to the release of Smac-mCherry from mitochondria to the cytosol (Figures 3G and 3H). We plotted the kinetics of these events for individual cells (n = 4). The increase in the corrected total cell fluorescence (CTCF) corresponded to the levels of the cytosolic calcium, while the SD of Smac-mCherry fluorescence was related with its localization (Figure 3H). As expected, Smac-mCherry was initially homogenously distributed at the mitochondria (Figure 3G). Increase in the Fluo-4/Ca fluorescence intensity correlated with Smac-mCherry release to the cytosol and the consequent drop of the SD of the fluorescence signal (Figure 3H). These results support the notion that increase in cytosolic calcium during intrinsic apoptosis takes places as a late event following mitochondria outer membrane permeabilization only when Smac/Diablo is released (Pinton et al., 2008).
Calcium flux in necroptosis was observed at a later stage upon treatment with the binary mixture TZ excluding a Smac mimetic. Under these conditions, L929 and NIH 3T3 cell lines underwent necroptosis but with slower kinetics (Figures 3E and 3F). We could distinguish two cell populations after TZ treatment: one that remained adherent, elongated, and both Fluo-4/Ca and PI negative and a second one in which cells were detached and became round and was PI and/or Fluo-4/Ca positive (inset in Figures S3H and S3I). Nec-1 completely abolished calcium flux in both L929 and NIH 3T3 cells upon TZ-induced necroptosis (Figures S3H and S3I). This behavior resembled that observed with HT-29 cells, characterized by a single, late permeabilization event, inhibited by Nec-1 (Figure 2E).
Early Cytosolic Calcium Increase Is Activated in Parallel to Necroptosis through the Survival Pathway Initiated by TNF-α
Our results suggested that early calcium signaling in TSZ-induced necroptosis is a consequence of Smac activity, likely related to the loss of function of the endogenous inhibitors of programmed cell death (IAPs). The best characterized members of the IAP family are x-linked IAP (xIAP) and cellular IAP1/2 (cIAP1/2) (Kocab and Duckett, 2016, Vasilikos et al., 2016). Smac mimetics are small compounds that are based on the IAP binding motif of Smac/Diablo (Figure 4A) and theoretically are also able to induce IAP degradation (Fulda, 2015, Fulda, 2016).
Figure 4.

Early Calcium Signal Is Activated upon Inhibition of IAP Function and Involves the TNF-α Survival Pathway
(A) General representation of the role of Smac as inhibitor of IAPs and its link with the TNF-α-mediated NF-κB survival pathway. cIAP1/2 ubiquitinate RIP1, and its ubiquitinated chain acts as scaffolds to recruit others molecules such as TAK1 that activates the IKK1/2 complex by phosphorylation of IKK2. 5Z-7-oxozeaenol (5z) is an inhibitor of TAK1. BMS-345541 (BMS) is an inhibitor of the catalytic subunits of IKK1/2. Cycloheximide (CHX) is an inhibitor of protein synthesis.
(B) Expression of different IAPs in L929, NIH 3T3, MEF, and HT-29 cells. The RIAP antibody recognizes cIAP1/2. Controls consist of the cIAP1 knock out MEF, HEK cells treated with compound A (911) that strongly reduces cIAP1 levels but not cIAP2. Asterisks indicate non-specific bands.
(C) Representative images of calcium flux in MEF upon different treatments (S, Smac mimetic; TZ, TNF-α + zVAD; TSZ, TNF-α + Smac + zVAD). Scale bar, 50 μm.
(D) Percentage of Fluo-4/Ca fluorescence signal in MEF after 2 hr of treatment with the compounds referred to.
(E) Effect of IAPs deletion on Fluo-4/Ca fluorescence signal after 2 hr treatment with Smac.
(F) Effect of RIP1 deletion on Fluo-4/Ca fluorescence after 2 hr treatment with TSZ.
(G) Fluo-4/Ca signal in MEF after 2 hr of treatment with other TNF-α sensitizers (5z, 5Z-7-oxozeaenol; T(5z)Z, TNF-α + 5Z-7-oxozeaenol + zVAD; BMS, BMS-345541; TBS, TNF-α + BMS + zVAD; CHX, cycloheximide; TCZ, TNF-α + cycloheximide + zVAD).
Error bars represent the SD from the measurements. See also Figure S4.
cIAP1/2 are connected with both the survival and cell death pathways induced upon stimulation with TNF-α (Kocab and Duckett, 2016, Silke and Meier, 2013). cIAP1/2 behave as E3 ubiquitin ligases of multiple components of the NF-κB pathway such as RIP1. Upon polyubiquitination, RIP1 forms a scaffold for the recruitment of additional factors including the transforming grow factor β-activating kinase (TAK1) that further activates the IκB kinase (IKK1/2) complex and the downstream signaling that involves protein synthesis leading to cell survival (Gyrd-Hansen and Meier, 2010, Sharma et al., 2016). Independently of this pathway, xIAP has been proposed to inactivate the final apoptosis effectors caspases 3, 7, and 9 (Kocab and Duckett, 2016, Vasilikos et al., 2016) (Figure 4A).
We examined the basal protein levels of the most characterized IAPs (Figures 4B and S4A) RIP1 and 3 (Figures S4B and S4C) and MLKL (Figure S4D) to determine whether expression levels correlated with calcium release and necroptosis. L929 had higher levels of cIAP1, RIP3, and MLKL compared to the other cell lines. This cell line seems to be primed to die by necroptosis when treated with TSZ, as previously demonstrated (Figure S3). The expression level of RIP3 was particularly low in HT-29 cells, suggesting that these cells may have to upregulate RIP3 in response to TSZ to undergo necroptosis. Such differences would explain why these cell lines behave differently in terms of calcium signaling and response to necroptosis (Figures 1, 2, S2, and S3). Moreover, we checked the levels of necroptosis markers (i.e., RIP1, RIP3, and phospho-MLKL) upon TSZ treatment. Co-treatment of TSZ resulted in detection of phospho-MLKL 1–2 hr after stimulation (Figure S4E) but no cleavage of the apoptotic marker PARP (Poly [ADP-ribose] polymerase) (Figure S4F). These results confirmed that caspase activity was inhibited and that these cells died by necroptosis.
Interestingly, levels of cIAP1 and cIAP2 were quite compensated in mouse fibroblasts (Figures 4B and S4A). While L929 had an excess of cIAP1, NIH 3T3 and MEF cells had higher levels of cIAP2. It has been shown that if cIAP1 is downregulated, cIAP2 increases, suggesting that the main function of cIAP2 is just to compensate for cIAP1 loss (Conze et al., 2005, Gardam et al., 2011). In contrast, HT-29 cells showed low levels of cIAP1 (Figures 4B and S4A) and cIAP2 was not detected, which would explain why this cell line does not respond to a Smac mimetic in terms of calcium signal (Figure 1E). There were no obvious differences in the levels of xIAP among these four cell lines (Figure 4B). As expected, co-treatment with Smac mimetic LCL-161, TNF-α, and zVAD triggered cIAP1/2 but not xIAP degradation (Figure S4G). cIAP1/2 degradation in mouse fibroblasts took place quickly after TSZ treatment (15–30 min), in the same time frame of early calcium signaling and before the appearance of phospho-MLKL (Figures S4E and S4G). These results suggest that specifically cIAP1/2, but not xIAP, mediates early calcium flux and confirm that this process is independent of necroptosis.
To further validate these observations, we measured calcium levels in MEF cells double knockout for cIAP1/cIAP2, cIAP1/xIAP, or cIAP2/xIAP in the presence or absence of Smac. We checked that, similar to L929 and NIH 3T3 cells (Figure 3), calcium increased in MEF cells upon Smac treatment but not with TZ co-treatment (Figures 4C and 4D). Notably, cIAP1/cIAP2 double knockout cells did not respond to Smac mimetic treatment, while cIAP1/xIAP or cIAP2/xIAP double knockout cells did (Figure 4E). Basal levels of calcium in cIAP1/cIAP2 double knockout MEFs were similar to those observed in the wild-type cells upon Smac treatment (for reference, see Figure 4D). The lack of increase in calcium levels of cIAP1/cIAP2 knock out cells resembled the behavior of HT-29, which had overall lower basal levels of cIAP1/2 (Figure 4B). Moreover, cytosolic basal calcium levels were increased in RIP1 knockout cells (Figure 4F) and were similar to those obtained in wild-type cells upon Smac mimetic treatment (for reference, see Figure 4D). However, they did not significantly increase upon TSZ treatment in RIP1 knockout MEFs (Figure 4F), suggesting that removal of RIP1 from the complex associated with the TNF-α receptor has direct implications in triggering the calcium signal. Because calcium signaling was not inhibited by Nec-1, it is likely that a RIP1 function different from its kinase activity (e.g., scaffold function) is related to this effect. One possibility could be that the calcium signal would be triggered by the disassembly of complexes associated with RIP1 scaffolds (Lee et al., 2004).
To validate this hypothesis, we tested whether the combination of TNF-α with other sensitizers lead to early calcium signaling. We evaluated different compounds that inhibit key elements of the survival cascade activated by TNF-α (e.g., 5Z-7-oxozeaenol [5z] that is a potent irreversible inhibitor of TAK1; BMS-345541 (BMS) that inhibits IKK1/2; and cycloheximide (CHX), an inhibitor of protein synthesis) (Figure 4G). Interestingly, calcium signal increased in the presence of the TAK1 inhibitor (5z), which was potentiated with co-treatment with TZ. We did not detect such an effect when BMS or CHX were tested. Together, these results suggest that IAPs control the levels of cytosolic calcium by the activation of downstream components of the TNF-α survival cascade (e.g., RIP1 and TAK1).
Necroptosis Induction via TLR3 and TLR4 Is Characterized by a Single Permeabilization Event Inhibited by Necrostatin-1
To understand the generality of early calcium signal and late plasma membrane permeabilization in necroptosis, we examined other pathophysiologically relevant pathways, such as those involving TLR. Necroptosis via TLR3/4 is less understood but can also be activated in the presence of caspase inhibitors (He et al., 2011, Kaiser et al., 2013). We first evaluated the effect on cell death of two TLR agonists, poly I:C and lipopolysaccharide (LPS), which trigger the activation of TLR3 and 4, respectively (Kaiser et al., 2013, Najjar et al., 2016). Poly I:C is a synthetic analog of double-stranded RNA (dsRNA) present in some viruses, while LPS is a common constituent of the outer wall of Gram-negative bacteria. Different cells lines (L929, NIH 3T3, MEF, HT-29, and HEK) were treated with poly I:C (P) (interferon γ [IFNγ]-primed to stimulate the expression of TLR3 [Kaiser et al., 2013, Kalai et al., 2002]) or LPS (L) (without IFNγ priming) in the presence of zVAD (Z), from here on PZ or LZ, respectively. However, only L929 cells underwent necroptosis when treated with PZ or LZ (Figures S5A and S5B). L929 were directly stimulated with LZ since IFN-priming inhibited cell death (Figure S5A), probably due to the activation of negative regulators of IFN-γ and LPS signaling (Schroder et al., 2006). Cell death in L929 cells was inhibited by Nec-1, which suggests a role of the RIP1-RIP3 complex in TLR3/4-induced necroptosis (Figure S5A). However, upon PZ treatment, Nec-1 had a moderated inhibitory effect after 24 hr, suggesting that RIP1 can be partially dispensable for cell death after activation of the TLR3 pathway in L929 cells.
TLR activation exhibited a necroptotic response that was treatment dependent in L929 cells. Death started a few hours after activation of TLR3 (∼4 hr), while it took a longer lag time (∼8 hr) after activation of TLR4 (Figure 5). Similar cellular morphological changes typical of necroptosis were found upon PZ and LZ treatment. Cells detached and became round prior to complete membrane disruption. In contrast to TSZ-induced necroptosis in L929 cells (Figure 1A), calcium flux was detected only shortly before complete plasma membrane permeabilization, both processes being inhibited by Nec-1 (Figures 5B and 5C). These findings are in agreement with our above observations that early calcium increase results as a consequence of Smac mimetic treatment and is dispensable for necroptosis (Figures 3 and 4).
Figure 5.

Early Calcium Flux Is Not Activated in TLR-3/4-Induced Necroptosis in L929 Cells
(A) Kinetics of PI intake after treatment with poly (I:C) (P) or LPS (L) in the presence of zVAD (Z). Cells were primed with IFN-γ 24 hr before PZ treatment.
(B and C) Kinetics of late calcium flux and PI intake after activation of (B) TLR3 (PZ treatment) or (C) TLR4 (LZ treatment). Top: time series of change in shape, calcium flux, and PI intake during TLR3 (B) or TLR4 (C)-induced necroptosis. Scale bar, 50 μm. Purple, y axis: Fluo-4/Ca fluorescence intensity; yellow, y axis: PI-positive cells. The x axis is common for all parameters plotted. The values represent the mean and the SD of at least three independent experiments. Error bars represent the SD from the measurements. Lines correspond to the best fitting of the data.
See also Figure S5.
Osmotically Active Agents Block PI Intake but Not Early Calcium Flux
To investigate whether the plasma membrane permeabilization events observed in necroptotic cells were related with the formation of pores in the plasma membrane, we visualized necroptotic cell death in the presence of polyethyleneglycols (PEGs) of different sizes. Besides being valuable tools for studying size and osmotic properties of membrane pores (Tejuca et al., 2001), PEGs do not affect ion channels and can therefore be used to distinguish the nature of alterations in membrane permeability. The rationale of this classic experiment lies on the colloid-osmotic hypothesis, which relates the size of membrane pores with their different permeability to macromolecules of different sizes. Due to the osmotic gradient resulting from the high concentration of impermeant intracellular molecules (such as big, cytosolic proteins), the opening of membrane pores leads to net influx of water molecules and consequent cell volume increase until the cell collapses (Figure 6A). Such an effect can be prevented by addition of the external medium of an osmotic protectant of appropriate size, which is too large to enter the cell through the pores and therefore counterbalances the intracellular osmotic pressure (Figure 6B) (Sukhorukov et al., 2009, Tejuca et al., 2001).
Figure 6.

PI Intake but Not Early Calcium Signal Is Mediated by Membrane Pores
(A) Impermeant intracellular molecules impose an osmotic gradient after pore opening that leads to net influx of water molecules and cell lysis.
(B) PEGs can prevent this effect if their size is large enough to not cross the membrane through the pores.
(C) Calcium flux and PI intake in NIH 3T3 cells treated with TSZ in the presence or absence of PEG 8000. Scale bar, 50 μm.
(D) Kinetics of calcium flux,
(E and F) Change in cell shape (E) and PI intake (F) in NIH 3T3 cells in the presence of PEGs of different sizes.
(G) PI and Fluo-4/Ca-positive NIH 3T3 cells after TZ induction in the presence or not of PEG 8000.
(H) Kinetics of PI intake in individual NIH 3T3 cells. 20 individual cells were selected, and the fluorescence intensity of the PI was recorded every 5 s. Values were normalized taking as 100% the maximum of the fluorescence obtained per cell.
(I) Time lapse of PI intake, calcium flux, and membrane breakdown. Scale bar, 10 μm.
(J) FD10 influx in NIH 3T3 cells after treatment with TSZ. First-line scale bar, 20 μm, second-, third-, and fourth-line scale bars, 10 μm.
(K–M) Kinetics of PI influx in L929 cells treated with (K) TZ, (L) PZ (IFN primed), or (M) LZ in the presence or not of PEGs.
Results show the mean and the SD from at least three independent experiments. Error bars represent SD from the measurements. Lines correspond to the best fitting of the data.
We used the following PEGs (in parenthesis is their hydrated radii as reported in Tejuca et al., 2001): 2000 (1.3 nm), 4000 (1.6 nm), and 8000 (2 nm). PEG addition did not prevent early calcium signal (Figures 6C and 6D) but inhibited changes in cell shape and PI intake (Figures 6C, 6E, and 6F). This indicates that early calcium signal is not driven by osmotic forces and strongly suggests that it is mediated by selective ion channels. In contrast, the ability of PEGs to block the late permeabilization event characterized by PI intake demonstrates that it involves the formation of pores at the plasma membrane. Both calcium signal and PI influx were inhibited in the presence of PEG 8000 when cells were treated with TZ (Figure 6G) in agreement with our previous observations that late ion flux is also directly linked to late plasma membrane permeabilization mediated by pores. Kinetically, complete staining of the nucleus after PI intake was a slow process (∼3 min) (Figure 6H) compared with membrane breakdown (∼5 s) (Figure 6I).
The inhibition of cell rounding and PI intake by PEGs was size dependent, which allowed roughly estimating the size of the membrane damaging structures to around 2-nm radius (Figures 6E and 6F). Because large-molecular-weight PEGs possess peculiar properties that affect their hydrodynamic radius (Kuga, 1981, Tejuca et al., 2001), we performed an alternative assay to confirm the size of the necroptotic membrane pores. We added 10-kDa dextrans fluorescently labeled with Alexa 488 (FD10) at a final concentration of 5 μM to TSZ-treated cells. This concentration did not impose osmotic protection but was high enough to allow visualization of dye uptake into the individual cells. We found that FD10 was only able to cross the membrane of PI-positive cells (Figure 6J). We also estimated the size of FD10 (radius ∼2.3 ± 0.1 nm) based on its diffusion properties measured by fluorescence correlation spectroscopy.
The cross-section of PI-permeable pores has been estimated to be around 1.5 nm (Bowman et al., 2010, Nesin et al., 2011). However, based on these results we could not discard that necroptotic pores were uncoupled from PI intake, which would then happen only after total plasma membrane collapse due to cell swelling after water influx. To exclude this possibility, we added FD 10 kDa dextran together with PEG 8000 to cells treated with TSZ in order to slow down the kinetics of plasma membrane collapse. Under these experimental conditions, PI was able to cross the membrane, while FD10 dextran remained in the extracellular medium (Figure 6J). This observation clearly demonstrates that necroptotic pores are actually bigger in size than PI but smaller than FD10 dextran and therefore in the range 1.5–4.6 nm diameter.
To confirm that the formation of membrane pores of similar nature was involved in necroptosis execution induced by different pathways, we performed similar experiments with different PEGs upon TZ, PZ, or LZ stimuli. As previously shown with TSZ-induced necroptosis (Figures 6E and 6F), PEGs imposed osmoprotection to cell death in a size-dependent manner (Figures 6K–6M). The highest effect was observed with PEG 8000. For all conditions, the population of dead cells decreased when PEG 8000 was added to the media.
In an effort to validate our observations about the protective role of osmoprotectant agents in necroptosis, we examined the effect of PEG 8000 in an in vivo model. Necroptosis has been described as a crucial component of IRI (Linkermann et al., 2013b). Here, we focused on a renal model of IRI that is lethal to mice after 72 hr to investigate the protective effect of PEG 8000. Elevated serum concentrations of creatinine (Figure 7A) and urea (Figure 7B), commonly used as markers for the loss of kidney function (Linkermann et al., 2013a), were reduced 48 hr after reperfusion when PEG 8000 was applied. Images from histology analysis and tubular damage score values reflected the protective effect of PEG 8000 (Figures 7C and 7D). Additionally, we controlled that the osmoprotectant did not have a toxic effect in mice kidneys as reflected by the levels of lactate dehydrogenase (LDH), glutamate-pyruvate transaminase/alanine transaminase (GPT/ALAT), and glutamic oxaloacetic transaminase/aspartate transaminase (GOT/ASAT) activity after IRI (Figures S6A–S6C). Together with the data from cultured cells, these in vivo studies support a general model of cell disruption in necroptosis through the formation of small pores of a few nanometers radius in the plasma membrane.
Figure 7.

PEG 8000 Provides Osmotic Protection against the Necroptosis In Vivo Model IRI
(A and B) Corresponding serum concentrations of creatinine (A) and urea (B) 48 hr after reperfusion or sham operation (n = 8 per group, mean values, p ≤ 0.14. p values were determined by a Student’s t test). 100 μL vehicle (Tris-HCl [pH 8.0]) or 100 μL 100 mM PEG 8000 (in Tris-HCl [pH 8.0]) was applied intraperitoneally 15 min before the onset of ischemia and additionally 1, 3, and 5 hr post-ischemia in a final volume of 250 μL, respectively.
(C) Representative renal sections stained with periodic acid-Schiff are shown at magnifications of 200- and 400-fold as indicated 48 hr following reperfusion or sham operation. PEG-8000-treated animals show abundant tubular epithelial vacuolization without other damage signs. Scale bars, 0.3 (for 200-fold) and 0.2 (for 400-fold) mm, respectively.
(D) Quantification by renal damage score of (C).
Error bars represent the SD from the measurements. See also Figure S6.
Discussion
Despite the rapid progress made in recent years on the understanding of necroptosis signaling, how the final and key step of plasma membrane rupture is executed remains unclear. Here, we examined alterations in membrane permeability and shape triggered during TNF-α and TLR3/4-induced necroptosis in different cell lines using single live-cell microscopy. We show that TSZ treatment induces two distinct events: early calcium flux, which is not required for necroptosis and late formation of membrane pores about 4 nm in diameter that are concomitant with cell death. In contrast to early calcium flux, we identify late membrane pore formation as a core event in necroptosis execution that happens independently of the necroptotic stimuli.
So far, it was widely accepted that necroptosis and necrosis cannot be morphologically distinguished since they both represent modes of cell death that result in cytoplasmic swelling and rupture of the plasma membrane (Vanden Berghe et al., 2010, Wallach et al., 2016). Unexpectedly, the phenotype of TNF-α- and TLR-induced necroptosis was different from those described for toxin-induced or non-regulated necrosis. We found that early calcium flux preceded cell-body detachment from the glass surface and cellular rounding. Final rupture of the plasma membrane and spilling of the intracellular content took place after such morphological changes. Moreover, cell swelling and membrane blebbing were not easily detected in necroptosis, in agreement with recent observations (Kunzelmann, 2016). This is in contrast with toxin-mediated membrane injury and pyroptotic cell death (Chen et al., 2016), which cause the apparition of swelling blebs without cell detachment.
We found that early calcium signal was a consequence of co-treatment with a Smac mimetic, a synthetic compound that mimics the apoptotic factor Smac/Diablo and antagonizes IAPs (Petersen et al., 2007, Wu et al., 2007). Increase in cytosolic calcium was evident either as an early event upon treatment with a Smac mimetic in necroptosis or as a late event after mitochondria outer membrane permeabilization during intrinsic apoptosis, when Smac/Diablo was released. Neither the presence of Nec-1, an inhibitor that hinders the formation of the necrosome (Degterev et al., 2014), nor the absence of RIP3 or MLKL blocked early calcium flux. This also indicates that this molecular event is triggered artificially by Smac treatment and occurs upstream of necrosome formation. Our results strongly suggest that the Smac mimetic activates components of the TNF-α survival cascade though the removal of the cIAP1/2. Upon TSZ-induced necroptosis, RIP1 deubiquitination takes place as a consequence of cIAP1/2 degradation induced by a Smac mimetic, which leads to necrosome formation (Silke and Meier, 2013, Vanden Berghe et al., 2014). In parallel, calcium signaling is likely triggered by the disassembly of complexes associated with RIP1 scaffold function involving TAK1. Consequently, calcium flux is a cell-type-dependent event (L929, NIH 3T3, and MEF) strongly governed by cIAP1/2 levels. Since calcium signaling resulting from Smac mimetic treatment appeared independent of IKK1/2 complex activation, it might be mediated by the MAPK survival pathway (Zhou and Yuan, 2014). Further work will be necessary to identify the final molecular effector that mediates Smac mimetic-induced calcium flux.
We also show that early calcium signaling was not driven by osmotic pressure, so that the most likely alternative is that it is mediated by selective ion channels. Recently, it has been described that intracellular (from the ryanodine channels of the endoplasmic reticulum) but not extracellular calcium modulates necroptosis in mouse fibroblasts. In contrast, necroptosis in HT-29 cells was not affected by variations in extracellular or intracellular calcium levels (Ousingsawat et al., 2017). Altogether, our and others’ data suggest that the intake of extracellular calcium and/or the release from intracellular pools are processes highly dependent on the cell line and consequently do not seem to be a universal hallmark of necroptosis. However, we cannot discard a modulatory effect in some cell lines. Increase in cytosolic calcium could modulate necroptosis probably due to its toxic effect (Kunzelmann, 2016, Pinton et al., 2008).
Another important finding is the identification of the core mechanism responsible for necroptosis execution, which involves the opening of pores at the plasma membrane. It constitutes a general membrane permeabilization process found upon activation of both TNF-α and TLR signaling pathways. We found that late permeabilization of the plasma membrane in living cells is mediated by osmotic forces and the formation of small pores around 4 nm in diameter. The extracellular addition of osmotic protectors (e.g., PEG) with hydrodynamic radii between 1 and 2 nm delayed cell death, an effect that was proportional to the size of the osmoprotectant. In addition, fluorescently labeled 10-kDa dextrans, with a radius around 2.3 nm, were unable to pass through the plasma membrane before its complete disruption. In agreement with this, administration of PEG 8000 reduced cell damage in an in vivo model of necroptosis based on IRI. Final pore formation at the plasma membrane requires necrosome formation and MLKL activation. In this context, late calcium flux can be explained as a consequence and not as a cause of plasma membrane permeabilization, as suggested by recent publications (Dondelinger et al., 2014, Quarato et al., 2016, Wang et al., 2014).
From our findings, membrane pore formation appears as a common defining theme in the execution of at least some forms of regulated cell death, including not only necroptosis, but also apoptosis (Salvador-Gallego et al., 2016) and pyroptosis (Liu et al., 2016). In this scenario, membrane permeabilization via pore formation has been proposed as the underlying mechanism driven by MLKL oligomerization at the plasma membrane (Dondelinger et al., 2014, Wang et al., 2014). However, so far all experimental evidences regarding the ability of MLKL to form membrane pores have been obtained using artificial lipid vesicles (Dondelinger et al., 2014, Wang et al., 2014) and require protein concentrations that are physiologically too high (5 μM) (Wang et al., 2014). Although MLKL may be a key player in the formation of the plasma membrane pores reported here, one cannot discard that MLKL assembly at the plasma membrane alone could not be sufficient for necroptotic pore formation and that additional components are required.
In summary, here we described two distinct events upon TSZ-induced necroptosis. The first, early calcium flux, is related to the degradation of IAPs mediated by Smac mimetic treatment, does not require the activation of the necrosome, and is dispensable for necroptosis. In contrast, the second event, which leads to final plasma membrane breakdown, depends on the RIP1-RIP3-MLKL core and is common to TLR-induced necroptosis. Furthermore, this late permeabilization event is governed by osmotic pressure and involves the formation of pores around 4 nm in diameter. Taken together, our results show that the final step of necroptosis execution is generally mediated by formation of small pores at the plasma membrane. The identification of necroptotic membrane nanopores reported here opens new research possibilities to uncover the molecular components involved and their spatiotemporal dynamics and regulation and also has implications for the exploitation of necroptosis in clinical settings.
Experimental Procedures
All in vivo experiments were performed according to the Protection of Animals Act, after approval of the German local authorities.
Plasma Membrane Integrity
The plasma membrane integrity was tested by flow cytometry measuring the ability of cells to exclude PI. Flow-cytometric analyses were conducted using CytoFlex, and data were analyzed using the FACSDiva software (Beckman Coulter). After treatment, both attached and non-attached cell populations were collected. Cells were washed twice with cold PBS, centrifuged (500 × g, 5 min, 4°C), and resuspended in PBS (150 μL) containing PI (2 μg/mL). After 15 min of incubation at room temperature, a total of 10,000 cells were counted by flow cytometry, and membrane breakage was determined as a PI-positive population.
Bright-Field and Confocal Microscopy
Cells were seeded in DMEM in Ibidi 8-well chambers (Ibidi) 24 hr before experiment. The day after, cells were washed with PBS to replace the media by phenol red free DMEM (Sigma-Aldrich) supplemented with fetal bovine serum (FBS) and antibiotics. Cells were loaded with 2 μM Fluo-4 AM for 30 min at 37°C and 2 μg/mL PI. All images were acquired with a Zeiss LSM 710 ConfoCor3 microscope (Carl Zeiss) equipped with incubator at 37°C and 5% CO2. Time-lapse imaging with z stack acquisition was carried out before and after necroptosis induction. Transmitted light and fluorescence images were acquired through a Zeiss C-Apochromat 40×, numerical aperture (NA) = 1.2 water immersion objective onto the sample. Excitation light came from argon ion (488 nm) or HeNe (561 nm) lasers.
Live-Imaging Analysis
Images were processed with Fiji. At each time point, individual fluorescent cells were automatically detected based on the fluorescence of the cytosolic Fluo-4 AM bound to Ca (Fluo-4 AM/Ca). Then, the main fluorescence value per cell was calculated. From these values, the most probable value of the fluorescence in the cell population was estimated with a probability density function. Values were normalized dividing by the maximal fluorescence obtained upon treatment at the longest time point, as follows:
where Ft is the fluorescence at each time point, Fmax is the fluorescence obtained at the longest time point, upon treatment, and Fo is the fluorescence without treatment.
Statistical Methods
All measurements were performed at least three times, and results are presented as mean ± SD.
Author Contributions
U.R. performed flow cytometry and confocal experiments and analyzed data. A.P.-B. carried out apoptosis experiments and analyzed the data. K.H. performed blot experiments. W.W.-L.W. supplied materials, supervised blot experiments, and designed experiments related with IAPs and RIP1’s role in calcium signaling. S.K. supplied material and performed in vivo experiments. U.K. analyzed in vivo experiments. U.R. and A.J.G.-S. designed experiments. U.R and A.J.G.-S. wrote the manuscript with input from all other authors. A.J.G.-S. conceived the project and supervised research.
Acknowledgments
U.R.’s research was supported by the Alexander von Humboldt Foundation. This work was supported by the Max Planck Society, the European Research Council (ERC-2012-StG-309966), and by the Deutsche Forschungsgemeinschaft (DFG FOR2036). K.H. and W.W.-L.W.’s research was supported by SNSF Project Grant 310030 159613. S.K. acknowledges support from Dr. Werner Jackstädt-Stiftung and Fresenius Medical Care. We thank Dr. Stephen Tait, University of Glasgow, for providing the Smac-mCherry plasmid and Prof. Dr. Klaus Schulze-Osthoff and Dr. Frank Essmann, IFIB, University of Tübingen, for providing L929, HT-29, and HEK cells. We thank Dr. Katia Cosentino and Dr. Yuri Quintana for discussions about analysis, Joseph Unsay for helping with calculations of dextran size, Jessica Schmitz and Jan Hinrich Bräsen for the images and evaluations of the renal biopsies, Sabine Schäfer and Janina Kahl for technical assistance, and Isaac Martínez for designing the graphical abstract.
Published: April 4, 2017
Footnotes
Supplemental Information includes Supplemental Experimental Procedures and six figures and can be found with this article online at http://dx.doi.org/10.1016/j.celrep.2017.03.024.
Contributor Information
Uris Ros, Email: uris.ros@ifib.uni-tuebingen.de.
Ana J. García-Sáez, Email: ana.garcia@uni-tuebingen.de.
Supplemental Information
References
- Blériot C., Lecuit M. The interplay between regulated necrosis and bacterial infection. Cell. Mol. Life Sci. 2016;73:2369–2378. doi: 10.1007/s00018-016-2206-1. [DOI] [PMC free article] [PubMed] [Google Scholar]
- Bowman A.M., Nesin O.M., Pakhomova O.N., Pakhomov A.G. Analysis of plasma membrane integrity by fluorescent detection of Tl(+) uptake. J. Membr. Biol. 2010;236:15–26. doi: 10.1007/s00232-010-9269-y. [DOI] [PMC free article] [PubMed] [Google Scholar]
- Cai Z., Jitkaew S., Zhao J., Chiang H.C., Choksi S., Liu J., Ward Y., Wu L.G., Liu Z.G. Plasma membrane translocation of trimerized MLKL protein is required for TNF-induced necroptosis. Nat. Cell Biol. 2014;16:55–65. doi: 10.1038/ncb2883. [DOI] [PMC free article] [PubMed] [Google Scholar]
- Chen X., He W.T., Hu L., Li J., Fang Y., Wang X., Xu X., Wang Z., Huang K., Han J. Pyroptosis is driven by non-selective gasdermin-D pore and its morphology is different from MLKL channel-mediated necroptosis. Cell Res. 2016;26:1007–1020. doi: 10.1038/cr.2016.100. [DOI] [PMC free article] [PubMed] [Google Scholar]
- Conze D.B., Albert L., Ferrick D.A., Goeddel D.V., Yeh W.C., Mak T., Ashwell J.D. Posttranscriptional downregulation of c-IAP2 by the ubiquitin protein ligase c-IAP1 in vivo. Mol. Cell. Biol. 2005;25:3348–3356. doi: 10.1128/MCB.25.8.3348-3356.2005. [DOI] [PMC free article] [PubMed] [Google Scholar]
- de Almagro M.C., Vucic D. Necroptosis: Pathway diversity and characteristics. Semin. Cell Dev. Biol. 2015;39:56–62. doi: 10.1016/j.semcdb.2015.02.002. [DOI] [PubMed] [Google Scholar]
- Degterev A., Zhou W., Maki J.L., Yuan J. Assays for necroptosis and activity of RIP kinases. Methods Enzymol. 2014;545:1–33. doi: 10.1016/B978-0-12-801430-1.00001-9. [DOI] [PubMed] [Google Scholar]
- Dillon C.P., Green D.R. Molecular cell biology of apoptosis and necroptosis in cancer. Adv. Exp. Med. Biol. 2016;930:1–23. doi: 10.1007/978-3-319-39406-0_1. [DOI] [PubMed] [Google Scholar]
- Dondelinger Y., Declercq W., Montessuit S., Roelandt R., Goncalves A., Bruggeman I., Hulpiau P., Weber K., Sehon C.A., Marquis R.W. MLKL compromises plasma membrane integrity by binding to phosphatidylinositol phosphates. Cell Rep. 2014;7:971–981. doi: 10.1016/j.celrep.2014.04.026. [DOI] [PubMed] [Google Scholar]
- Fiers W., Beyaert R., Declercq W., Vandenabeele P. More than one way to die: Apoptosis, necrosis and reactive oxygen damage. Oncogene. 1999;18:7719–7730. doi: 10.1038/sj.onc.1203249. [DOI] [PubMed] [Google Scholar]
- Fulda S. Smac mimetics as IAP antagonists. Semin. Cell Dev. Biol. 2015;39:132–138. doi: 10.1016/j.semcdb.2014.12.005. [DOI] [PubMed] [Google Scholar]
- Fulda S. Regulation of necroptosis signaling and cell death by reactive oxygen species. Biol. Chem. 2016;397:657–660. doi: 10.1515/hsz-2016-0102. [DOI] [PubMed] [Google Scholar]
- Gao S., Andreeva K., Cooper N.G. Ischemia-reperfusion injury of the retina is linked to necroptosis via the ERK1/2-RIP3 pathway. Mol. Vis. 2014;20:1374–1387. [PMC free article] [PubMed] [Google Scholar]
- Gardam S., Turner V.M., Anderton H., Limaye S., Basten A., Koentgen F., Vaux D.L., Silke J., Brink R. Deletion of cIAP1 and cIAP2 in murine B lymphocytes constitutively activates cell survival pathways and inactivates the germinal center response. Blood. 2011;117:4041–4051. doi: 10.1182/blood-2010-10-312793. [DOI] [PubMed] [Google Scholar]
- Gyrd-Hansen M., Meier P. IAPs: From caspase inhibitors to modulators of NF-kappaB, inflammation and cancer. Nat. Rev. Cancer. 2010;10:561–574. doi: 10.1038/nrc2889. [DOI] [PubMed] [Google Scholar]
- He S., Wang L., Miao L., Wang T., Du F., Zhao L., Wang X. Receptor interacting protein kinase-3 determines cellular necrotic response to TNF-alpha. Cell. 2009;137:1100–1111. doi: 10.1016/j.cell.2009.05.021. [DOI] [PubMed] [Google Scholar]
- He S., Liang Y., Shao F., Wang X. Toll-like receptors activate programmed necrosis in macrophages through a receptor-interacting kinase-3-mediated pathway. Proc. Natl. Acad. Sci. USA. 2011;108:20054–20059. doi: 10.1073/pnas.1116302108. [DOI] [PMC free article] [PubMed] [Google Scholar]
- Kaiser W.J., Sridharan H., Huang C., Mandal P., Upton J.W., Gough P.J., Sehon C.A., Marquis R.W., Bertin J., Mocarski E.S. Toll-like receptor 3-mediated necrosis via TRIF, RIP3, and MLKL. J. Biol. Chem. 2013;288:31268–31279. doi: 10.1074/jbc.M113.462341. [DOI] [PMC free article] [PubMed] [Google Scholar]
- Kalai M., Van Loo G., Vanden Berghe T., Meeus A., Burm W., Saelens X., Vandenabeele P. Tipping the balance between necrosis and apoptosis in human and murine cells treated with interferon and dsRNA. Cell Death Differ. 2002;9:981–994. doi: 10.1038/sj.cdd.4401051. [DOI] [PubMed] [Google Scholar]
- Kocab A.J., Duckett C.S. Inhibitor of apoptosis proteins as intracellular signaling intermediates. FEBS J. 2016;283:221–231. doi: 10.1111/febs.13554. [DOI] [PMC free article] [PubMed] [Google Scholar]
- Kuga S. Pore-size distribution analysis of gel substances by size exclusion chromatography. J. Chromatogr. A. 1981;206:449–461. [Google Scholar]
- Kunzelmann K. Ion channels in regulated cell death. Cell. Mol. Life Sci. 2016;73:2387–2403. doi: 10.1007/s00018-016-2208-z. [DOI] [PMC free article] [PubMed] [Google Scholar]
- Lee T.H., Shank J., Cusson N., Kelliher M.A. The kinase activity of Rip1 is not required for tumor necrosis factor-alpha-induced IkappaB kinase or p38 MAP kinase activation or for the ubiquitination of Rip1 by Traf2. J. Biol. Chem. 2004;279:33185–33191. doi: 10.1074/jbc.M404206200. [DOI] [PubMed] [Google Scholar]
- Linkermann A., Bräsen J.H., Himmerkus N., Liu S., Huber T.B., Kunzendorf U., Krautwald S. Rip1 (receptor-interacting protein kinase 1) mediates necroptosis and contributes to renal ischemia/reperfusion injury. Kidney Int. 2012;81:751–761. doi: 10.1038/ki.2011.450. [DOI] [PubMed] [Google Scholar]
- Linkermann A., Bräsen J.H., Darding M., Jin M.K., Sanz A.B., Heller J.O., De Zen F., Weinlich R., Ortiz A., Walczak H. Two independent pathways of regulated necrosis mediate ischemia-reperfusion injury. Proc. Natl. Acad. Sci. USA. 2013;110:12024–12029. doi: 10.1073/pnas.1305538110. [DOI] [PMC free article] [PubMed] [Google Scholar]
- Linkermann A., Hackl M.J., Kunzendorf U., Walczak H., Krautwald S., Jevnikar A.M. Necroptosis in immunity and ischemia-reperfusion injury. Am. J. Transplant. 2013;13:2797–2804. doi: 10.1111/ajt.12448. [DOI] [PubMed] [Google Scholar]
- Liu X., Zhang Z., Ruan J., Pan Y., Magupalli V.G., Wu H., Lieberman J. Inflammasome-activated gasdermin D causes pyroptosis by forming membrane pores. Nature. 2016;535:153–158. doi: 10.1038/nature18629. [DOI] [PMC free article] [PubMed] [Google Scholar]
- Najjar M., Saleh D., Zelic M., Nogusa S., Shah S., Tai A., Finger J.N., Polykratis A., Gough P.J., Bertin J. RIPK1 and RIPK3 kinases promote cell-death-independent inflammation by Toll-like receptor 4. Immunity. 2016;45:46–59. doi: 10.1016/j.immuni.2016.06.007. [DOI] [PMC free article] [PubMed] [Google Scholar]
- Nesin O.M., Pakhomova O.N., Xiao S., Pakhomov A.G. Manipulation of cell volume and membrane pore comparison following single cell permeabilization with 60- and 600-ns electric pulses. Biochim. Biophys. Acta. 2011;1808:792–801. doi: 10.1016/j.bbamem.2010.12.012. [DOI] [PMC free article] [PubMed] [Google Scholar]
- Oberst A. Death in the fast lane: What’s next for necroptosis? FEBS J. 2016;283:2616–2625. doi: 10.1111/febs.13520. [DOI] [PMC free article] [PubMed] [Google Scholar]
- Ousingsawat J., Cabrita I., Wanitchakool P., Sirianant L., Krautwald S., Linkermann A., Schreiber R., Kunzelmann K. Ca2+ signals, cell membrane disintegration, and activation of TMEM16F during necroptosis. Cellular and molecular life sciences. Cell. Mol. Life Sci. 2017;74:173–181. doi: 10.1007/s00018-016-2338-3. [DOI] [PMC free article] [PubMed] [Google Scholar]
- Petersen S.L., Wang L., Yalcin-Chin A., Li L., Peyton M., Minna J., Harran P., Wang X. Autocrine TNFalpha signaling renders human cancer cells susceptible to Smac-mimetic-induced apoptosis. Cancer Cell. 2007;12:445–456. doi: 10.1016/j.ccr.2007.08.029. [DOI] [PMC free article] [PubMed] [Google Scholar]
- Pinton P., Giorgi C., Siviero R., Zecchini E., Rizzuto R. Calcium and apoptosis: ER-mitochondria Ca2+ transfer in the control of apoptosis. Oncogene. 2008;27:6407–6418. doi: 10.1038/onc.2008.308. [DOI] [PMC free article] [PubMed] [Google Scholar]
- Quarato G., Guy C.S., Grace C.R., Llambi F., Nourse A., Rodriguez D.A., Wakefield R., Frase S., Moldoveanu T., Green D.R. Sequential engagement of distinct MLKL phosphatidylinositol-binding sites executes necroptosis. Mol. Cell. 2016;61:589–601. doi: 10.1016/j.molcel.2016.01.011. [DOI] [PMC free article] [PubMed] [Google Scholar]
- Salvador-Gallego R., Mund M., Cosentino K., Schneider J., Unsay J., Schraermeyer U., Engelhardt J., Ries J., García-Sáez A.J. Bax assembly into rings and arcs in apoptotic mitochondria is linked to membrane pores. EMBO J. 2016;35:389–401. doi: 10.15252/embj.201593384. [DOI] [PMC free article] [PubMed] [Google Scholar]
- Schroder K., Sweet M.J., Hume D.A. Signal integration between IFNgamma and TLR signalling pathways in macrophages. Immunobiology. 2006;211:511–524. doi: 10.1016/j.imbio.2006.05.007. [DOI] [PubMed] [Google Scholar]
- Sharma S., Kaufmann T., Biswas S. Impact of inhibitor of apoptosis proteins on immune modulation and inflammation. Immunol. Cell Biol. 2016 doi: 10.1038/icb.2016.101. Published online November 8, 2016. [DOI] [PubMed] [Google Scholar]
- Silke J., Meier P. Inhibitor of apoptosis (IAP) proteins-modulators of cell death and inflammation. Cold Spring Harb. Perspect. Biol. 2013;5 doi: 10.1101/cshperspect.a008730. Published online February 1, 2013. [DOI] [PMC free article] [PubMed] [Google Scholar]
- Stosiek C., Garaschuk O., Holthoff K., Konnerth A. In vivo two-photon calcium imaging of neuronal networks. Proc. Natl. Acad. Sci. USA. 2003;100:7319–7324. doi: 10.1073/pnas.1232232100. [DOI] [PMC free article] [PubMed] [Google Scholar]
- Sukhorukov V.L., Imes D., Woellhaf M.W., Andronic J., Kiesel M., Shirakashi R., Zimmermann U., Zimmermann H. Pore size of swelling-activated channels for organic osmolytes in Jurkat lymphocytes, probed by differential polymer exclusion. Biochim. Biophys. Acta. 2009;1788:1841–1850. doi: 10.1016/j.bbamem.2009.06.016. [DOI] [PubMed] [Google Scholar]
- Sun L., Wang H., Wang Z., He S., Chen S., Liao D., Wang L., Yan J., Liu W., Lei X., Wang X. Mixed lineage kinase domain-like protein mediates necrosis signaling downstream of RIP3 kinase. Cell. 2012;148:213–227. doi: 10.1016/j.cell.2011.11.031. [DOI] [PubMed] [Google Scholar]
- Tait S.W.G., Parsons M.J., Llambi F., Bouchier-Hayes L., Connell S., Muñoz-Pinedo C., Green D.R. Resistance to caspase-independent cell death requires persistence of intact mitochondria. Dev. Cell. 2010;18:802–813. doi: 10.1016/j.devcel.2010.03.014. [DOI] [PMC free article] [PubMed] [Google Scholar]
- Tait S.W., Ichim G., Green D.R. Die another way—non-apoptotic mechanisms of cell death. J. Cell Sci. 2014;127:2135–2144. doi: 10.1242/jcs.093575. [DOI] [PMC free article] [PubMed] [Google Scholar]
- Tejuca M., Dalla Serra M., Potrich C., Alvarez C., Menestrina G. Sizing the radius of the pore formed in erythrocytes and lipid vesicles by the toxin sticholysin I from the sea anemone Stichodactyla helianthus. J. Membr. Biol. 2001;183:125–135. doi: 10.1007/s00232-001-0060-y. [DOI] [PubMed] [Google Scholar]
- Vanden Berghe T., Vanlangenakker N., Parthoens E., Deckers W., Devos M., Festjens N., Guerin C.J., Brunk U.T., Declercq W., Vandenabeele P. Necroptosis, necrosis and secondary necrosis converge on similar cellular disintegration features. Cell Death Differ. 2010;17:922–930. doi: 10.1038/cdd.2009.184. [DOI] [PubMed] [Google Scholar]
- Vanden Berghe T., Linkermann A., Jouan-Lanhouet S., Walczak H., Vandenabeele P. Regulated necrosis: The expanding network of non-apoptotic cell death pathways. Nat. Rev. Mol. Cell Biol. 2014;15:135–147. doi: 10.1038/nrm3737. [DOI] [PubMed] [Google Scholar]
- Vandenabeele P., Grootjans S., Callewaert N., Takahashi N. Necrostatin-1 blocks both RIPK1 and IDO: Consequences for the study of cell death in experimental disease models. Cell Death Differ. 2013;20:185–187. doi: 10.1038/cdd.2012.151. [DOI] [PMC free article] [PubMed] [Google Scholar]
- Vasilikos L., Spilgies L.M., Knop J., Wong W.W. Regulating the balance between necroptosis, apoptosis and inflammation by inhibitors of apoptosis proteins. Immunol. Cell Biol. 2016;95:160–165. doi: 10.1038/icb.2016.118. [DOI] [PubMed] [Google Scholar]
- Wallach D., Kang T.B., Dillon C.P., Green D.R. Programmed necrosis in inflammation: Toward identification of the effector molecules. Science. 2016;352:aaf2154. doi: 10.1126/science.aaf2154. [DOI] [PubMed] [Google Scholar]
- Wang H., Sun L., Su L., Rizo J., Liu L., Wang L.F., Wang F.S., Wang X. Mixed lineage kinase domain-like protein MLKL causes necrotic membrane disruption upon phosphorylation by RIP3. Mol. Cell. 2014;54:133–146. doi: 10.1016/j.molcel.2014.03.003. [DOI] [PubMed] [Google Scholar]
- Wu H., Tschopp J., Lin S.C. Smac mimetics and TNFalpha: A dangerous liaison? Cell. 2007;131:655–658. doi: 10.1016/j.cell.2007.10.042. [DOI] [PMC free article] [PubMed] [Google Scholar]
- Zhang R., Zhang X., Zhang J., Wu J., Ye Q., Xu R., Ye J., Fang X., Jin L., He J., Yuan W. Efficacy and mechanism of Salvia miltiorrhizae injection in the treatment of rats with severe acute pancreatitis. Inflammation. 2009;32:109–119. doi: 10.1007/s10753-009-9109-3. [DOI] [PubMed] [Google Scholar]
- Zhang D.W., Zheng M., Zhao J., Li Y.Y., Huang Z., Li Z., Han J. Multiple death pathways in TNF-treated fibroblasts: RIP3- and RIP1-dependent and independent routes. Cell Res. 2011;21:368–371. doi: 10.1038/cr.2011.3. [DOI] [PMC free article] [PubMed] [Google Scholar]
- Zhang J., Yang Y., He W., Sun L. Necrosome core machinery: MLKL. Cell. Mol. Life Sci. 2016;73:2153–2163. doi: 10.1007/s00018-016-2190-5. [DOI] [PMC free article] [PubMed] [Google Scholar]
- Zhao J., Jitkaew S., Cai Z., Choksi S., Li Q., Luo J., Liu Z.G. Mixed lineage kinase domain-like is a key receptor interacting protein 3 downstream component of TNF-induced necrosis. Proc. Natl. Acad. Sci. USA. 2012;109:5322–5327. doi: 10.1073/pnas.1200012109. [DOI] [PMC free article] [PubMed] [Google Scholar]
- Zhou W., Yuan J. Necroptosis in health and diseases. Semin. Cell Dev. Biol. 2014;35:14–23. doi: 10.1016/j.semcdb.2014.07.013. [DOI] [PubMed] [Google Scholar]
Associated Data
This section collects any data citations, data availability statements, or supplementary materials included in this article.