Abstract
Purpose
To estimate cancer population-based reference values in the United States for eight PROMIS (Patient-Reported Outcomes Measurement Information System) domains by age and stage of disease.
Patients and Methods
For the Measuring Your Health (MY-Health) study, persons newly diagnosed with cancer (prostate, colorectal, non–small-cell lung, non-Hodgkin lymphoma, breast, uterine, or cervical) from 2010 to 2012 (N = 5,284) were recruited through the National Cancer Institute’s SEER Program. Participants were mailed surveys 6 to 13 months after diagnosis. Raking by race/ethnicity, age, and stage generated weighted average PROMIS scores for pain interference, fatigue, anxiety, depression, sleep disturbance, physical function, ability to participate in social roles, and cognitive function. PROMIS measures are standardized to a T-score metric, with a score of 50 representing the general US population mean. Clinically meaningful differences were defined as a 3-point difference in scores.
Results
Several reference values (means) for patients with cancer were worse than the general United States population norms of 50. These include pain interference (52.4), fatigue (52.2), and physical function (44.1). Reference values were highest (ie, showed greatest symptom burden) in lung cancer (pain interference, 55.5; fatigue, 57.3; depression, 51.4) and cervical cancer (anxiety, 53.2; sleep disturbance, 53.4). Reference values for patients age 65 to 84 years reported lower sleep disturbance, anxiety, and depression, and better cognitive function than younger patients. Cancer reference values were poorer among those with advanced disease compared with patients with limited or no evidence of disease, specifically physical function (41.1 v 46.6, respectively), fatigue (55.8 v 50.2, respectively), and pain interference (55.2 v 50.9, respectively).
Conclusion
In a large, population-based sample of patients with recently diagnosed cancer, we observed symptom severity and functional deficits by age, stage, and cancer type consistent with the expected impact of cancer diagnosis and treatment. These United States cancer reference values can help facilitate interpretation of the PROMIS domain scores in research studies or in clinical applications that measure and evaluate the symptom and functional burden patients with cancer experience after initial treatment.
INTRODUCTION
Patient-reported outcomes (PROs; such as symptom or functional status) have gained increasing recognition over the past two decades as legitimate trial end points and clinical outcomes. Medical interventions are increasingly judged by their impact on PROs across health and disease states.1-3 There has been increasing clinical research community interest in the broader interpretations of PRO scores for purposes of comparison across studies and populations and to allow for contextual interpretation of disease impact. This is particularly relevant for cancer research because there is wide range of symptom severity and functional deficit by cancer type, stage, and treatment. For persons with a chronic condition such as cancer, where deficits relative to the general population are expected, additional context regarding scores may be necessary to identify meaningful differences within and across cancer populations. Disease-specific reference values for PROs may be used for these purposes and to evaluate the relative burden of one disease compared with other diseases. Reference values are available for several commonly used cancer-specific measures, including the Functional Assessment of Cancer Therapy–General and European Organisation for Research and Treatment of Cancer Quality of Life Questionnaire C30.4,5 However, these reference values are specific to each measure and are not comparable to one another. Here, we provide cancer reference values for the United States for eight National Institutes of Health–supported PROMIS (Patient-Reported Outcomes Measurement Information System) measures, including physical function, pain interference, fatigue, anxiety, depression, sleep disturbance, ability to participate in social roles and activities, and cognitive function.
PROMIS, a state-of-the-science PRO measurement system, was developed using mixed qualitative and quantitative methods and uses item response theory–calibrated item banks for numerous patient-reported symptoms and functional domains. These PRO measures can be used across chronic diseases and in the general population.6 A feature of PROMIS measures is that an individual’s or group’s score is represented as a T score, normalized and calibrated against the US population (United States population average score, 50; 10 points = 1 standard deviation [SD]).7 This scoring metric provides a general frame of reference for a patient’s health status relative to the United States general population. The goal of this study is to estimate and evaluate US cancer-specific reference values for eight PROMIS domains by cancer type, stage at diagnosis, and age.
PATIENTS AND METHODS
Study Cohort
The Measuring Your Health (MY-Health) study was a population-based study to validate PROMIS measures in a diverse cohort of patients with cancer. The study enrolled patients recently diagnosed with cancer (stage I to IV; N = 5,284) identified by four SEER Program cancer registries. Eligible study participants were initially diagnosed from 2010 to 2012, between ages 21 and 84 years, and diagnosed with one of the following seven cancers: prostate, colorectal, non–small-cell lung, female breast, uterine, cervical, or non-Hodgkin lymphoma (NHL). We stratified our sample by race/ethnicity (non-Hispanic white, non-Hispanic black, Hispanic, or Asian) and age group (21 to 49, 50 to 64, or 65 to 84 years). All subjects were contacted using a mixed-mode survey (mail with phone call follow-up of nonresponders) within 6 to 13 months (median, 9 months) of diagnosis. Participants were provided Spanish or Mandarin Chinese (simple or traditional) versions of the questionnaire as necessary. More details on the study population (including a study flowchart), eligibility criteria, and survey procedures are provided elsewhere.8,9 This study was approved by the institutional review boards for each participating SEER site and Georgetown University (Washington, DC).
PROMIS Measures
We administered the following PROMIS short forms: Anxiety (11 items, α = .97); Depression (10 items, α = .97); Fatigue (14 items, α = .96); Pain Interference (10 items, α = .98); Physical Function (15 items, α = .96); Sleep Disturbance (10 items, α = .95); Ability to Participate in Social Roles and Activities (version 2; 10 items, α = .98; abbreviated as social function hereafter); and Cognitive Function (version 2; eight items, α = .98). PROMIS measures are standardized to a T-score metric (mean, 50; SD, 10); higher scores reflect more of what is being assessed, either worse symptoms or higher levels of function. We created these custom PROMIS measures by selecting items based on their inclusion in commonly used PROMIS short forms or their frequent selection in the PROMIS computer adaptive testing format at score levels 0.5 and 1.0 SD worse than the US population mean and because they are more likely to be administered to people with moderate symptoms or functional issues. This ensures that these reference values will cover the full range of symptom and functional issues experienced and will be appropriate for use with any PROMIS administration. Scores are not disease specific and will allow comparisons to any other patient population that is administered these PROMIS domains. PROMIS measures were scored using the Assessment Center Scoring Service.10 The scoring service uses standard expected a posteriori item response theory scoring for individual response patterns.11 On the basis of prior PROMIS validation studies in cancer, we considered a group score difference of 3 points likely to be clinically meaningful.12,13 Published symptom cutoff scores for pain interference, fatigue, anxiety, and depression were used to describe symptom severity (none, mild, moderate, or severe).14
SEER Data and Population
The SEER Program has collected data on every patient with cancer from 20 selected geographical areas of the United States since 1973; its cancer registries have been the primary source of US cancer incidence and survival statistics. The SEER Program is the only comprehensive source of population-based cancer information that includes stage of disease at diagnosis, and this information will ensure these reference values are generated using verified cancer information. We used the SEER annual incident cancer population from all 18 participating registries diagnosed in 2010 to 2012 to approximate the total US population with cancer to estimate PROMIS cancer-specific reference values. The SEER areas cover approximately 30% of the US population and include populations that reflect the diverse demographics of the US population. Even though the registry areas are not considered statistically representative of the US population,15,16 studies have shown no significant differences in demographics (age, race, or sex).17-19 We used SEER*Stat software version 8.1.5 to obtain SEER incidence counts for each of the seven cancer types by age at diagnosis, sex, race (white, black, American Indian/Alaska Native, Asian, or Pacific Islander) and ethnicity (Hispanic), and American Joint Committee on Cancer–derived cancer stage (seventh edition).20 Our cohort included individuals diagnosed with invasive cancer, who were age 21 to 84 years at diagnosis, and who were not identified as a new cancer case from an autopsy or death certificate.
Estimation Procedures
Before initiating data collection, we consulted with five hematologist–medical oncologists with expertise in the seven different cancer types included in our study. These consultants recommended optimal age and stage categories to use for estimating reference values that would be most useful for clinical research and practice. We then collapsed some age and stage categories as a result of sample size considerations after consulting with our clinical experts.
We started with equal weights for the cohort cases and then created new weights to estimate PROMIS reference values for the cancer-specific age and stage groups for each of the eight domains. Separate sets of weights were created for each cancer type to reweight the cohort to mirror the SEER-derived US cancer population. Following the same procedure used by others to generate PROMIS US national reference values (setting the overall US population mean at 50),7 we used the iterative proportional fitting (raking) technique, which involves raking over a set of variables iteratively to reweight the cohort population to match the distribution of the reference population (the 18 SEER cancer registries). We alternated one variable at a time. The iteration continued until the distribution of all the raking variables matched between the cohort and reference populations. The summed weights of each cohort are equal to the total number of cohort cases of the same cancer type.
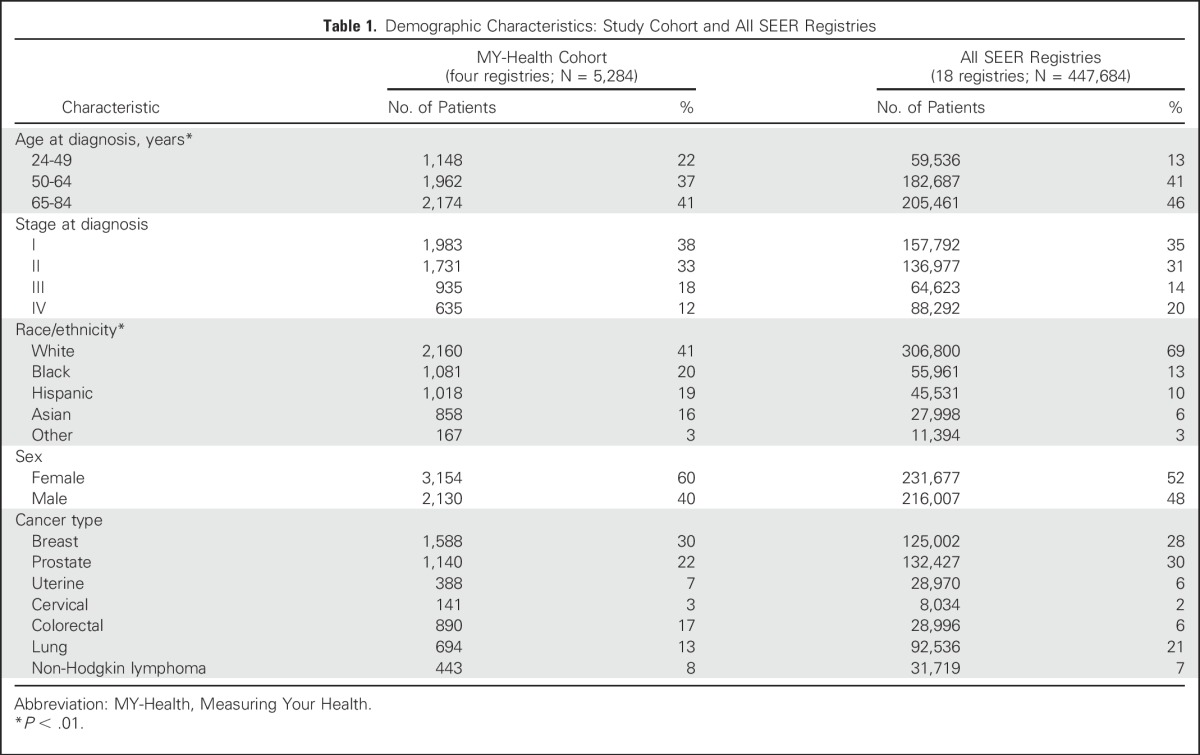
We chose to rake on age, sex, and race/ethnicity to account for oversampling in the MY-Health study cohort. We also raked on stage at diagnosis because of a slightly lower response rate in our study among persons with more advanced stage of disease. Each of these variables was selected to ensure the distributions matched the SEER cohort (Table 1). These weights were then applied using survey sampling methods to obtain reference values for each of the PROMIS symptom and function domains across all cancers and within each cancer type according to stage, age, and age/stage combinations (subgroup domains in statistical sampling). We used SAS version 9.3 (SAS Institute, Cary, NC) for all analyses, and an SAS macro to perform the raking.21
Table 1.
Demographic Characteristics: Study Cohort and All SEER Registries
RESULTS
We compared the MY-Health study cohort (stages I to IV; N = 5,284) selected from four SEER cancer registries with the total SEER cancer population (18 registries; Table 1). The total SEER population was older and more likely to be non-Hispanic white than the MY-Health cohort, consistent with our oversampling of nonwhite and younger populations in four registries. The total SEER populations, compared with the MY-Health cohort, also had higher frequencies of newly diagnosed stage IV breast cancer (6% v 2%, respectively), stage III or IV lung cancer (76% v 56%, respectively), and stage III or IV NHL (54% v 49%, respectively; data not shown).
Overall, as shown in Table 2, there is a deficit in physical function and elevated pain interference and fatigue in persons with cancer relative to the US population. Persons with cancer reported a physical function score of 44.8, a large deficit relative to the norm of 50 for the United States population; patients with lung cancer reported the lowest physical function scores (mean, 38.4). Pain interference and fatigue scores were above normal (52.4 and 52.2, respectively), each reflecting mild PROMIS pain interference and fatigue symptom thresholds (≥ 50.0).14 Notably, men with prostate cancer reported the lowest symptoms and highest function across all categories. Persons with lung cancer reported the highest symptoms and poorest functioning, with fatigue (mean score, 57.3) exceeding the established PROMIS threshold (≥ 55.0) for moderate fatigue severity. Women with cervical cancer reported higher anxiety (mean score, 53.2) than patients with the other six cancers (Table 2).
Table 2.
US PROMIS Cancer Reference Values by Age, Stage, and Cancer Type
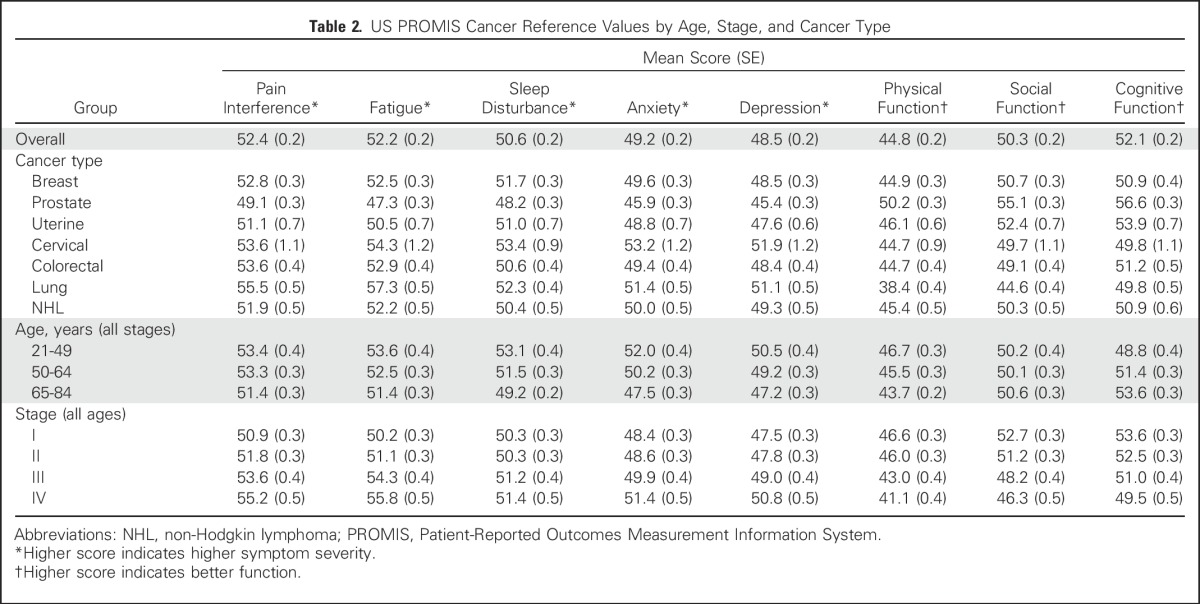
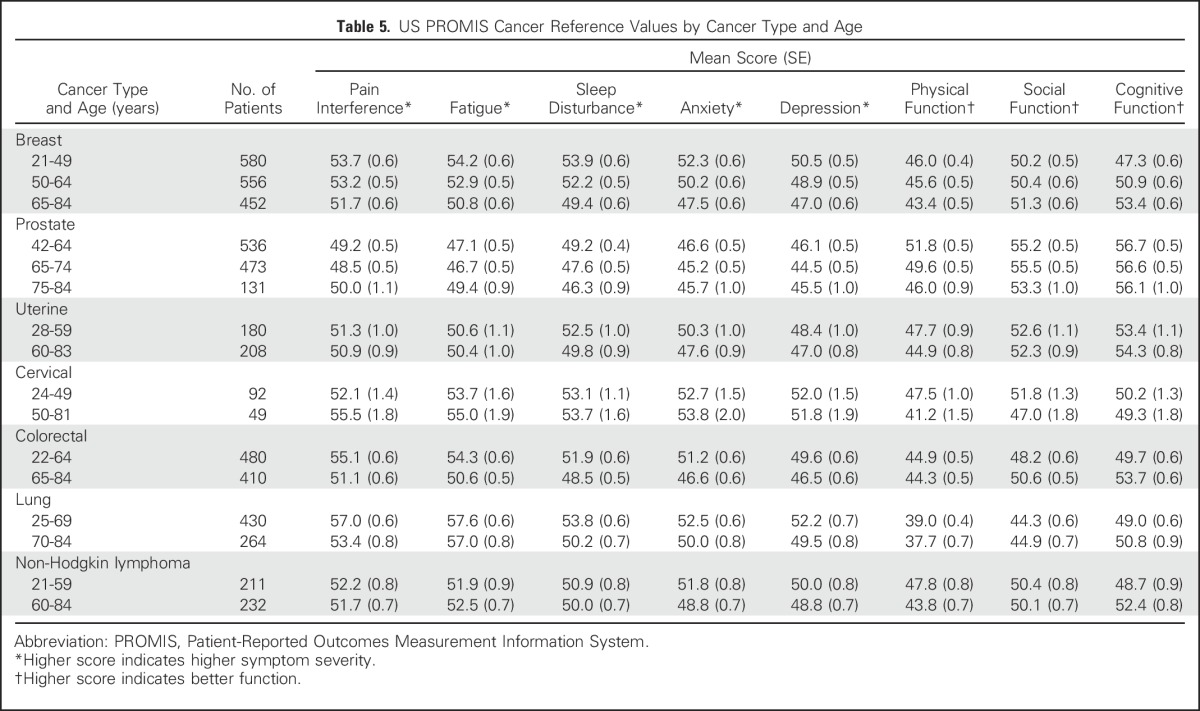
Cancer reference values by age demonstrate that older patients with cancer report lower symptom severity, better cognitive function, and worse physical function than younger patients (Table 2). The largest differences between patients age 21 to 49 years and patients age 65 to 84 years were observed in the domains of anxiety, sleep disturbance, and depression (score differences, 4.5, 3.9, and 3.3, respectively). There were also large differences in symptom severity and function by stage at diagnosis. For example, patients with stage IV disease had higher symptom scores for pain interference and fatigue compared with patients with stage I disease (score differences, 4.3 and 5.5, respectively).
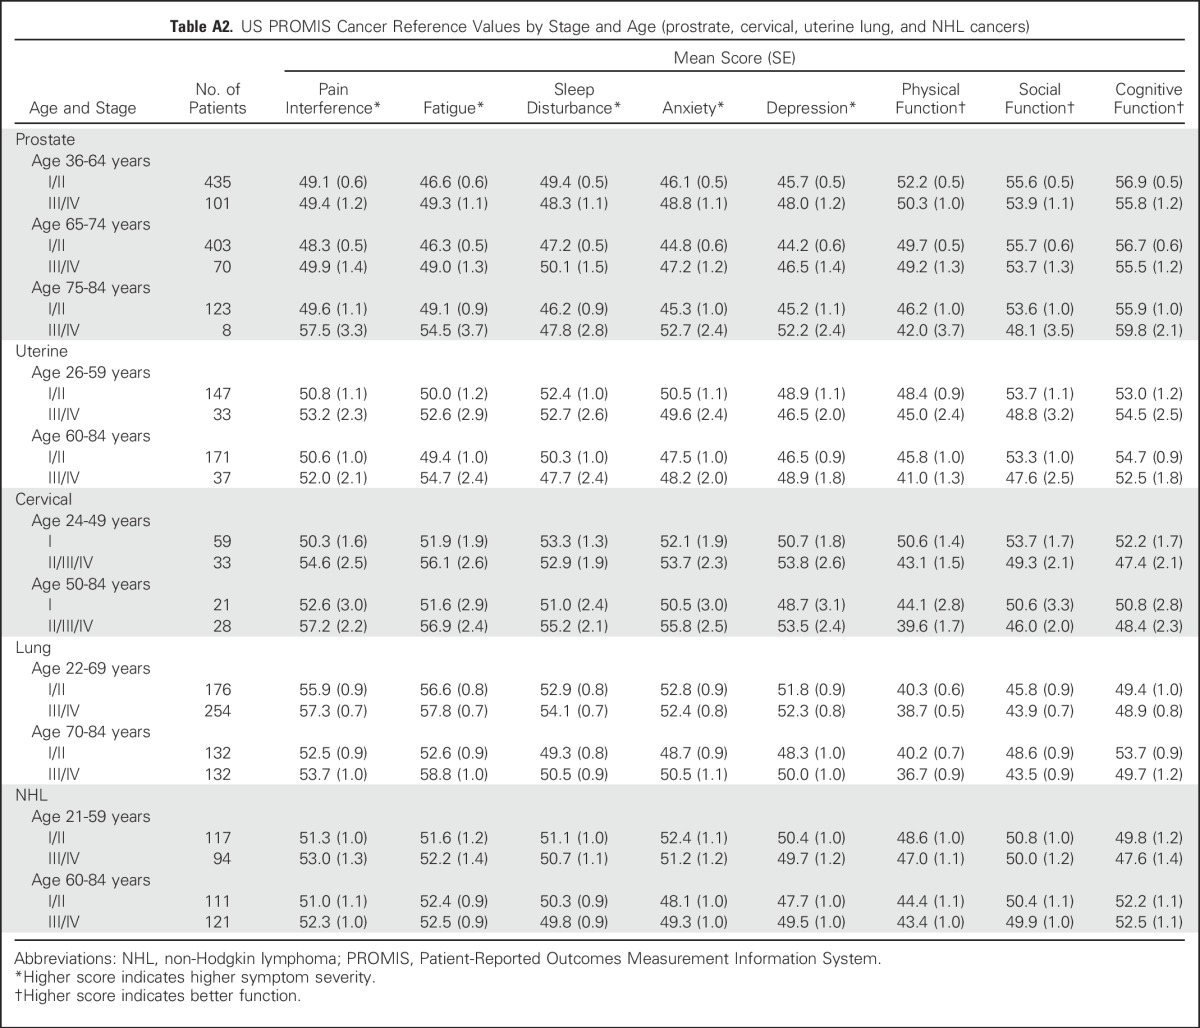
Reference values by stage of diagnosis within age groups (combining all seven cancer types) indicate the pattern of greater symptom severity for younger people with cancer, but also indicate a wide range of symptom severity by stage within each age group (Table 3). However, overall trends were not consistently observed within each individual cancer type (Tables 4 and 5). Persons with NHL reported minimal differences in both pain interference and fatigue scores by stage. Additional reference values for each of the seven cancers by both age and stage are listed in Appendix Tables A1 and A2), online only.
Table 3.
US PROMIS Cancer Reference Values by Stage and Age (all cancers)
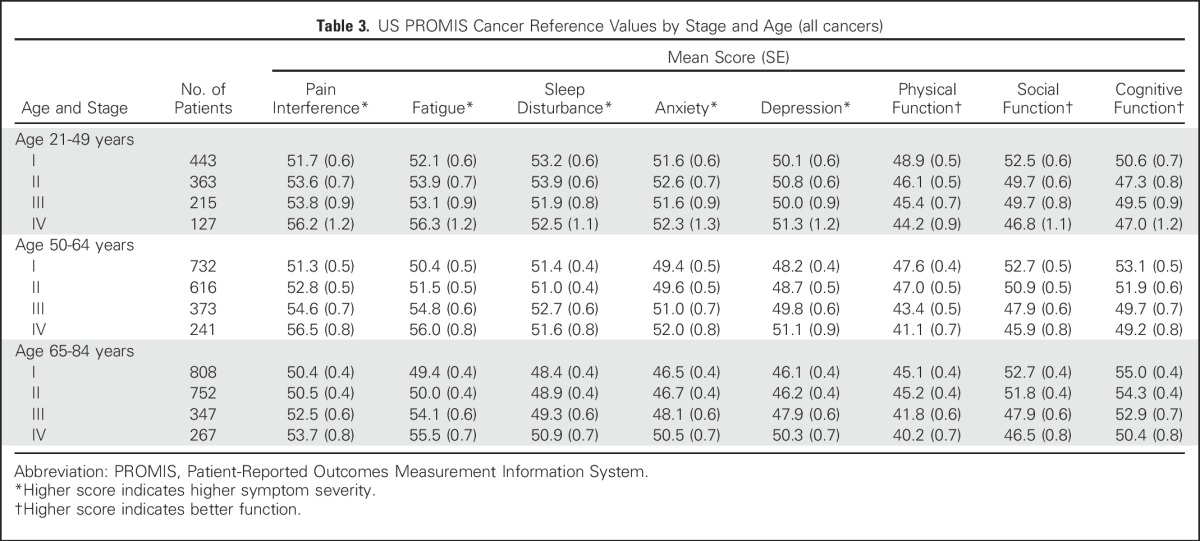
Table 4.
US PROMIS Cancer Reference Values by Cancer Type and Stage
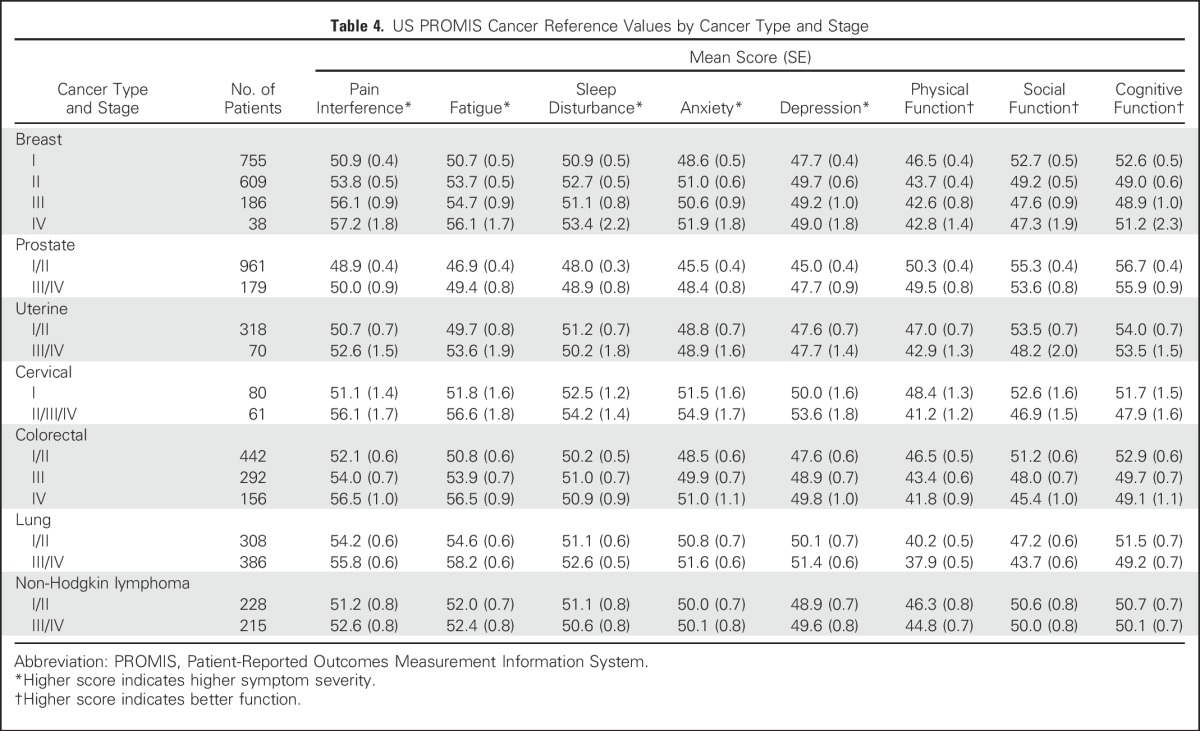
Table 5.
US PROMIS Cancer Reference Values by Cancer Type and Age
DISCUSSION
Using a large, population-based cohort of persons recently diagnosed with one of seven different cancers, we estimated US-specific PROMIS cancer reference values for the health domains of pain interference, fatigue, sleep disturbance, anxiety, depression, physical function, social function, and cognitive function. We found that relative to the general United States population, persons diagnosed with cancer report elevated pain interference and fatigue and a meaningful deficit in physical function at a time point when most have completed active cancer treatment. Our findings confirm previous national survey-based studies evaluating respondents within 2 years of a cancer diagnosis.22-24
These values suggest that meaningful, distinct symptom trends exist for patients with cancer by cancer stage, age at diagnosis, and cancer type. This supports the necessity of US reference values tailored to specific clinical information to ensure relevant interpretation across research and clinical settings. For example, the US pain interference and fatigue reference values for stage IV cancer are substantially higher (worse) than other values, reflecting the fact that these are two of the most prevalent symptoms reported by people diagnosed with advanced cancer.25 US values for anxiety and depression were lower for older people with cancer irrespective of cancer type and stage, reflecting both conceptual theory and research on the decreasing mental health impact of a cancer diagnosis with increasing age.26,27
Our findings reflect the heterogeneity of symptoms and function by cancer type after treatment, reported in multicenter studies and national surveys. Examples include elevated anxiety reported by women with cervical cancer,24 severe fatigue reported by people with lung cancer,28 and men with prostate cancer reporting minimal symptoms and higher function equivalent to or better than scores reported by the general US population.29 Furthermore, these reference values are consistent with recent PROMIS cancer validation studies. In a longitudinal validation study of six PROMIS measures in patients with localized prostate cancer (n = 774) living in North Carolina, measures at 12 months after diagnosis were within 1 point of the US prostate cancer reference values generated in this study.30
The availability of new US cancer-specific reference values provides an important tool for researchers and clinicians to better evaluate and interpret patient-reported symptoms and functional status using PROMIS. Our estimates of reference values by age and stage at diagnosis within each cancer type also allow for more tailored interpretation and understanding of symptoms within these subgroups. There has been increasing interest in incorporating valid PRO measurement in the evaluation and dissemination of new cancer therapies,31 from inclusion in clinical trials as part of the US Food and Drug Administration’s approval process to informing observational comparative effectiveness research efforts.32 The PROMIS cancer reference values provide cancer clinical researchers the ability to compare their study-specific PROMIS results in the context of a more representative United States cancer population. For example, the reference values can evaluate the extent to which patients on such trials return to an average physical function level relative to other patients with cancer of the same age, stage, and type treated in the United States population. Furthermore, as cancer trials consider smaller, adaptive trial designs, tailored reference values can permit interpretation of symptom burden within and across small, unique cancer subpopulations by age and cancer stage.
In clinical practice, reference values can be used to inform interventions. Electronic PRO screening has been shown to engage patients as active participants in their care, improving patient-provider communication and providing immediate feedback to physicians about their patients’ health status.33-36 However, although PROs have been used more frequently in clinical care settings and are increasingly available within electronic health record systems, there is limited evidence about how PRO scores can best be made clinically actionable. A recent review of electronic PRO systems indicates that the inclusion of reference values in clinician reports occurs in approximately 50% of all reports produced.37 Incorporating cancer-specific reference values in PRO reports tailored to age and stage could provide more clinically meaningful symptom information to better help providers identify and monitor patient symptoms. For example, the Robert H. Lurie Comprehensive Cancer Center gynecologic oncology outpatient clinic (Northwestern University, Chicago, IL) has implemented PROMIS computer adaptive tests as part of a previsit electronic assessment using an electronic health record–linked patient portal. In a 3-year pilot study, physical function was identified as the most common concern, generating the most physician notifications.38 The inclusion of United States reference values for physical function would provide context for tailoring physical function screening and monitoring by age, stage, and cancer type. We would expect patients with early-stage uterine cancer younger than age 60 years to report physical function scores near the US average (reference score, 48.4). These patients may benefit more from a higher score notification threshold than for similar patients older than age 60 years with lower function (reference score, 45.8). These reference values would provide tailored alerts in clinical care settings, better highlighting relevant concerns for review.
There are important limitations of our study. First, although SEER covers approximately 30% of United States incident patients with cancer,15 it is not designed to be representative of all United States patients with cancer. Second, the MY-Health cohort was surveyed 6 to 13 months after diagnosis (median, 9 months), and SEER information cannot identify who is on current treatment or who is experiencing cancer progression or recurrence. Although this limits specific score interpretations, these values provide important contextual information at a point after diagnosis when many, but not all, patients have completed primary cancer therapy. Therefore, these values reflect a time point at which patients without rapid disease progression have returned to a more stable status that approximates their likely long-term status after therapy.39 These reference values provide benchmarks relative to time since diagnosis by age, type, and stage. Research characterizing acute symptoms and functional declines as a result of specific treatments will provide additional comparisons informing research and practice.
Another limitation is that the MY-Health study assessed seven cancers and eight PROMIS domains, and thus, we are unable to estimate reference values for other cancers and domains. Despite this limitation, this study provides a sufficiently large cohort to include robust US reference values for less commonly surveyed cancers (lung, NHL, and uterine). In addition, although we reported all mean values and SE estimates, we strongly recommend not reporting values generated in groups with less than 50 people or where the SE is 2 points or greater. Finally, there may have been some changes in therapies for some of the included cancers because the patients from the MY-Health cohort were first diagnosed and treated from 2010 to 2012; therefore, a current cohort of patients with cancer may have worse or better symptoms and function. However, despite these limitations, this study is one of the first large cohorts of persons age 18 to 84 years to use verified clinical information regarding cancer type and age to generate these values at a specific time interval after diagnosis.
In conclusion, there is currently no available common PRO metric for assessing morbidity in cancer. As a result, it is challenging to estimate the burden of cancer in terms of health-related quality of life (symptoms and function) in patients with cancer or survivors relative to the United States general population. Because general United States population PROMIS reference values are already available, cancer-specific United States reference values enhance the understanding of the burden of cancer, which includes all morbidity, from chronic conditions to acute care situations. This, in turn, provides population-level information to inform broad health care policy issues such as incentivizing PRO collection and use in clinical care. These United States reference values can facilitate clinically meaningful interpretations and comparisons of PROMIS measures in research and practice.
ACKNOWLEDGMENT
We thank the MY-Health Clinical Advisory Committee (Patricia Ganz, MD; Julie Gralow, MD; Maurie Markman, MD; Jimmy Hwang, MD; Anthony Back, MD; and Bonnie Teschendorf, MD), SEER study site collaborators (Laura Allen, Rosemary Cress, DrPH, Natalia Herman, MPH, Theresa Keegan, PhD, MS, Lauren S. Maniscalco, MPH, Lisa Moy, MPH, Lisa A. Paddock, PhD, MPH, Wendy Ringer, Antoinette M. Stroup, PhD, and Xiao-Cheng Wu, MD, MPH), and the Georgetown MY-Health Research team (Caroline Moore, Charlene Kuo, Marin Rieger, Deena Loeffler, and Aaron Roberts).
Appendix
Table A1.
US PROMIS Cancer Reference Values by Stage and Age (breast and colorectal cancers)
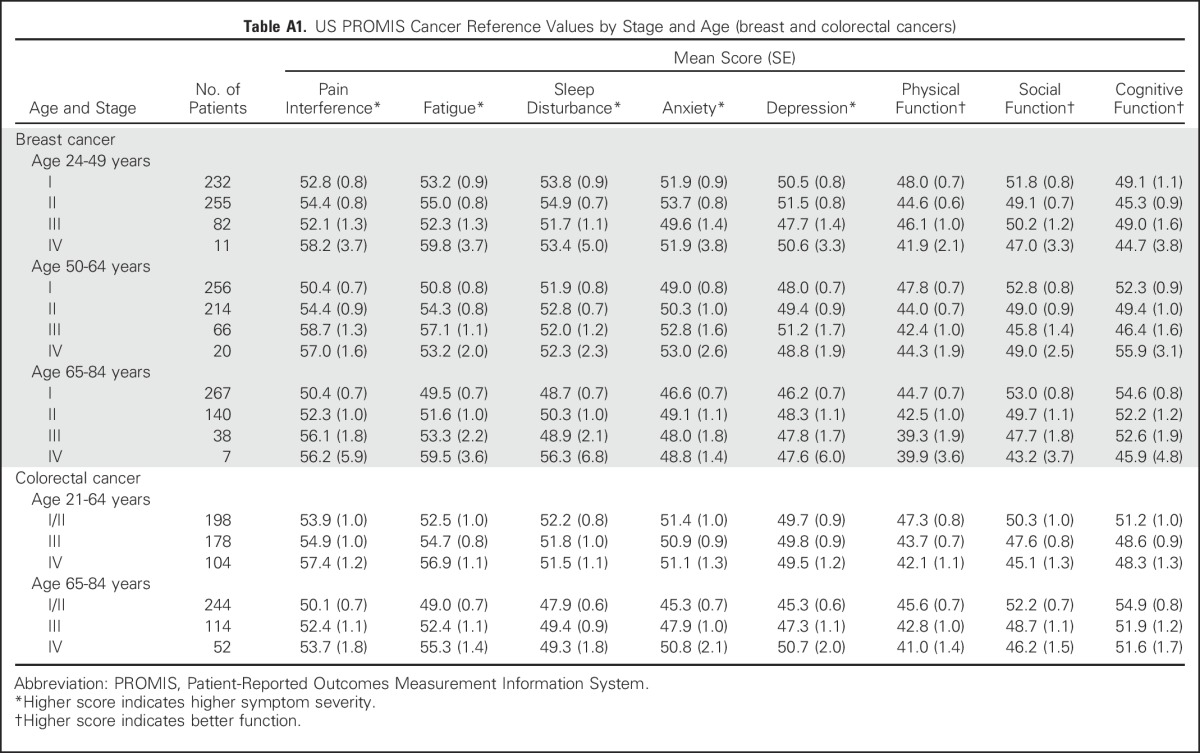
Table A2.
US PROMIS Cancer Reference Values by Stage and Age (prostrate, cervical, uterine lung, and NHL cancers)
Footnotes
Supported by National Institutes of Health (NIH) Grants No. U01AR057971 and P30CA051008. R.E.J. is a KL2 Scholar (Grant No. KL2TR000102) from the National Center for Research Resources and the National Center for Advancing Translational Sciences, NIH, through the Clinical and Translational Science Awards Program.
The Patient-Reported Outcomes Measurement Information System (PROMIS) is an NIH Roadmap initiative to develop valid and reliable patient-reported outcome measures to be applicable across a wide range of chronic diseases and demographic characteristics. The content is solely the responsibility of the authors and does not necessarily represent the official views of the National Cancer Institute or the NIH.
AUTHOR CONTRIBUTIONS
Conception and design: Roxanne E. Jensen, Arnold L. Potosky, Carol M. Moinpour, Ashley Wilder Smith, Bryce B. Reeve
Financial support: Ashley Wilder Smith
Collection and assembly of data: Roxanne E. Jensen, Arnold L. Potosky, Tania Lobo
Data analysis and interpretation: Roxanne E. Jensen, Arnold L. Potosky, Tania Lobo, David Cella, Elizabeth A. Hahn, David Thissen, Ashley Wilder Smith, Jaeil Ahn, George Luta, Bryce B. Reeve
Manuscript writing: All authors
Final approval of manuscript: All authors
Accountable for all aspects of the work: All authors
AUTHORS' DISCLOSURES OF POTENTIAL CONFLICTS OF INTEREST
United States Population-Based Estimates of Patient-Reported Outcomes Measurement Information System Symptom and Functional Status Reference Values for Individuals With Cancer
The following represents disclosure information provided by authors of this manuscript. All relationships are considered compensated. Relationships are self-held unless noted. I = Immediate Family Member, Inst = My Institution. Relationships may not relate to the subject matter of this manuscript. For more information about ASCO's conflict of interest policy, please refer to www.asco.org/rwc or ascopubs.org/jco/site/ifc.
Roxanne E. Jensen
No relationship to disclose
Arnold L. Potosky
No relationship to disclose
Carol M. Moinpour
Stock or Other Ownership: Amgen (I), Pfizer (I), Merck (I)
Tania Lobo
No relationship to disclose
David Cella
Stock or Other Ownership: FACIT.org
Consulting or Advisory Role: Abbvie, Bristol-Myers Squibb, Novartis, Pfizer
Research Funding: Novartis (I), Genentech (I), Ipsen (I), Bayer (I), Pfizer (I)
Travel, Accommodations, Expenses: Bayer
Elizabeth A. Hahn
Research Funding: Pfizer (I)
David Thissen
No relationship to disclose
Ashley Wilder Smith
No relationship to disclose
Jaeil Ahn
No relationship to disclose
George Luta
No relationship to disclose
Bryce B. Reeve
No relationship to disclose
REFERENCES
- 1.Clauser SB, Ganz PA, Lipscomb J, et al. Patient-reported outcomes assessment in cancer trials: Evaluating and enhancing the payoff to decision making. J Clin Oncol. 2007;25:5049–5050. doi: 10.1200/JCO.2007.14.5888. [DOI] [PubMed] [Google Scholar]
- 2.Ganz PA, Gotay CC. Use of patient-reported outcomes in phase III cancer treatment trials: Lessons learned and future directions. J Clin Oncol. 2007;25:5063–5069. doi: 10.1200/JCO.2007.11.0197. [DOI] [PubMed] [Google Scholar]
- 3.Gondek K, Sagnier PP, Gilchrist K, et al. Current status of patient-reported outcomes in industry-sponsored oncology clinical trials and product labels. J Clin Oncol. 2007;25:5087–5093. doi: 10.1200/JCO.2007.11.3845. [DOI] [PubMed] [Google Scholar]
- 4.Brucker PS, Yost K, Cashy J, et al. General population and cancer patient norms for the Functional Assessment of Cancer Therapy-General (FACT-G) Eval Health Prof. 2005;28:192–211. doi: 10.1177/0163278705275341. [DOI] [PubMed] [Google Scholar]
- 5. Scott NW, Fayers PM, Aaronson NK, et al: EORTC QLQ-C30 reference values. http://groups.eortc.be/qol/sites/default/files/img/newsletter/reference_values_manual2008.pdf. [Google Scholar]
- 6.Cella D, Riley W, Stone A, et al. The Patient-Reported Outcomes Measurement Information System (PROMIS) developed and tested its first wave of adult self-reported health outcome item banks: 2005-2008. J Clin Epidemiol. 2010;63:1179–1194. doi: 10.1016/j.jclinepi.2010.04.011. [DOI] [PMC free article] [PubMed] [Google Scholar]
- 7.Liu H, Cella D, Gershon R, et al. Representativeness of the Patient-Reported Outcomes Measurement Information System Internet panel. J Clin Epidemiol. 2010;63:1169–1178. doi: 10.1016/j.jclinepi.2009.11.021. [DOI] [PMC free article] [PubMed] [Google Scholar]
- 8.Jensen RE, Potosky AL, Reeve BB, et al. Validation of the PROMIS physical function measures in a diverse US population-based cohort of cancer patients. Qual Life Res. 2015;24:2333–2344. doi: 10.1007/s11136-015-0992-9. [DOI] [PMC free article] [PubMed] [Google Scholar]
- 9. Jensen R, Moinpour C, Keegan T, et al: The Measuring Your Health study: Leveraging community-based cancer registry recruitment to establish a large, diverse cohort of cancer survivors for analyses of measurement equivalence and validity of the Patient Reported Outcomes Measurement Information System® (PROMIS®) short form items. Psychol Test Assess Model 58:99-117, 2016.
- 10. Assessment Center Scoring Service: HealthMeasures Scoring Service. https://www.assessmentcenter.net/ac_scoringservice.
- 11.Bock RD, Mislevy RJ. Adaptive EAP estimation of ability in a microcomputer environment. Appl Psychol Meas. 1982;6:431–444. [Google Scholar]
- 12.Swanholm E, McDonald W, Makris U, et al. Estimates of minimally important differences (MIDs) for two Patient-Reported Outcomes Measurement Information System (PROMIS) computer-adaptive tests in chronic pain patients. J Appl Biobehav Res. 2014;19:217–232. [Google Scholar]
- 13.Yost KJ, Eton DT, Garcia SF, et al. Minimally important differences were estimated for six Patient-Reported Outcomes Measurement Information System-Cancer scales in advanced-stage cancer patients. J Clin Epidemiol. 2011;64:507–516. doi: 10.1016/j.jclinepi.2010.11.018. [DOI] [PMC free article] [PubMed] [Google Scholar]
- 14.Cella D, Choi S, Garcia S, et al. Setting standards for severity of common symptoms in oncology using the PROMIS item banks and expert judgment. Qual Life Res. 2014;23:2651–2661. doi: 10.1007/s11136-014-0732-6. [DOI] [PMC free article] [PubMed] [Google Scholar]
- 15. National Cancer Institute: SEER Program: Research data (1973-2013). https://seer.cancer.gov/data/
- 16.Frey CM, McMillen MM, Cowan CD, et al. Representativeness of the Surveillance, Epidemiology, and End Results program data: Recent trends in cancer mortality rates. J Natl Cancer Inst. 1992;84:872–877. doi: 10.1093/jnci/84.11.872. [DOI] [PubMed] [Google Scholar]
- 17.Nattinger AB, McAuliffe TL, Schapira MM. Generalizability of the Surveillance, Epidemiology, and End Results registry population: Factors relevant to epidemiologic and health care research. J Clin Epidemiol. 1997;50:939–945. doi: 10.1016/s0895-4356(97)00099-1. [DOI] [PubMed] [Google Scholar]
- 18.Kuo TM, Mobley LR. How generalizable are the SEER registries to the cancer populations of the USA? Cancer Causes Control. 2016;27:1117–1126. doi: 10.1007/s10552-016-0790-x. [DOI] [PMC free article] [PubMed] [Google Scholar]
- 19.Warren JL, Klabunde CN, Schrag D, et al. Overview of the SEER-Medicare data: Content, research applications, and generalizability to the United States elderly population. Med Care. 2002;40(suppl)(8):IV-3–IV-18. doi: 10.1097/01.MLR.0000020942.47004.03. [DOI] [PubMed] [Google Scholar]
- 20. National Cancer Institute: SEER Program: SEER*Stat Database: Incidence - SEER 9 Regs Research Data (1973-2012) (ed Nov 2014). Bethesda, MD, National Cancer Institute, Division of Cancer Control and Population Sciences (DCCPS), Surveillance Research Program, Surveillance Systems Branch, 2015. [Google Scholar]
- 21. Izrael D, David C, Michael B: A SAS macro for balancing a weighted sample. Proceedings of the 25th Annual SAS Users Group International Conference, Indianapolis, IN, April 9-12, 2000 (abstr 258) [Google Scholar]
- 22.Yabroff KR, Lawrence WF, Clauser S, et al. Burden of illness in cancer survivors: Findings from a population-based national sample. J Natl Cancer Inst. 2004;96:1322–1330. doi: 10.1093/jnci/djh255. [DOI] [PubMed] [Google Scholar]
- 23.Hewitt M, Rowland JH, Yancik R. Cancer survivors in the United States: Age, health, and disability. J Gerontol A Biol Sci Med Sci. 2003;58:82–91. doi: 10.1093/gerona/58.1.m82. [DOI] [PubMed] [Google Scholar]
- 24.Weaver KE, Forsythe LP, Reeve BB, et al. Mental and physical health-related quality of life among U.S. cancer survivors: Population estimates from the 2010 National Health Interview Survey. Cancer Epidemiol Biomarkers Prev. 2012;21:2108–2117. doi: 10.1158/1055-9965.EPI-12-0740. [DOI] [PMC free article] [PubMed] [Google Scholar]
- 25.Teunissen SC, Wesker W, Kruitwagen C, et al. Symptom prevalence in patients with incurable cancer: A systematic review. J Pain Symptom Manage. 2007;34:94–104. doi: 10.1016/j.jpainsymman.2006.10.015. [DOI] [PubMed] [Google Scholar]
- 26. doi: 10.1002/cncr.23444. Blank TO, Bellizzi KM: A gerontologic perspective on cancer and aging. Cancer 112:2569-2576, 2008. [DOI] [PubMed] [Google Scholar]
- 27.Linden W, Vodermaier A, Mackenzie R, et al. Anxiety and depression after cancer diagnosis: Prevalence rates by cancer type, gender, and age. J Affect Disord. 2012;141:343–351. doi: 10.1016/j.jad.2012.03.025. [DOI] [PubMed] [Google Scholar]
- 28.Wang XS, Zhao F, Fisch MJ, et al. Prevalence and characteristics of moderate to severe fatigue: A multicenter study in cancer patients and survivors. Cancer. 2014;120:425–432. doi: 10.1002/cncr.28434. [DOI] [PMC free article] [PubMed] [Google Scholar]
- 29.LeMasters T, Madhavan S, Sambamoorthi U, et al. A population-based study comparing HRQoL among breast, prostate, and colorectal cancer survivors to propensity score matched controls, by cancer type, and gender. Psychooncology. 2013;22:2270–2282. doi: 10.1002/pon.3288. [DOI] [PMC free article] [PubMed] [Google Scholar]
- 30.Quach CW, Langer MM, Chen RC, et al. Reliability and validity of PROMIS measures administered by telephone interview in a longitudinal localized prostate cancer study. Qual Life Res. 2016;25:2811–2823. doi: 10.1007/s11136-016-1325-3. [DOI] [PMC free article] [PubMed] [Google Scholar]
- 31.Lipscomb J, Reeve BB, Clauser SB, et al. Patient-reported outcomes assessment in cancer trials: Taking stock, moving forward. J Clin Oncol. 2007;25:5133–5140. doi: 10.1200/JCO.2007.12.4644. [DOI] [PubMed] [Google Scholar]
- 32.Basch E, Abernethy AP, Mullins CD, et al. Recommendations for incorporating patient-reported outcomes into clinical comparative effectiveness research in adult oncology. J Clin Oncol. 2012;30:4249–4255. doi: 10.1200/JCO.2012.42.5967. [DOI] [PubMed] [Google Scholar]
- 33.Detmar SB, Muller MJ, Schornagel JH, et al. Health-related quality-of-life assessments and patient-physician communication: A randomized controlled trial. JAMA. 2002;288:3027–3034. doi: 10.1001/jama.288.23.3027. [DOI] [PubMed] [Google Scholar]
- 34.Velikova G, Brown JM, Smith AB, et al. Computer-based quality of life questionnaires may contribute to doctor-patient interactions in oncology. Br J Cancer. 2002;86:51–59. doi: 10.1038/sj.bjc.6600001. [DOI] [PMC free article] [PubMed] [Google Scholar]
- 35.Detmar SB, Aaronson NK, Wever LD, et al. How are you feeling? Who wants to know? Patients’ and oncologists’ preferences for discussing health-related quality-of-life issues. J Clin Oncol. 2000;18:3295–3301. doi: 10.1200/JCO.2000.18.18.3295. [DOI] [PubMed] [Google Scholar]
- 36.Taenzer P, Bultz BD, Carlson LE, et al. Impact of computerized quality of life screening on physician behaviour and patient satisfaction in lung cancer outpatients. Psychooncology. 2000;9:203–213. doi: 10.1002/1099-1611(200005/06)9:3<203::aid-pon453>3.0.co;2-y. [DOI] [PubMed] [Google Scholar]
- 37.Jensen RE, Snyder CF, Abernethy AP, et al. Review of electronic patient-reported outcomes systems used in cancer clinical care. J Oncol Pract. 2014;10:e215–e222. doi: 10.1200/JOP.2013.001067. [DOI] [PMC free article] [PubMed] [Google Scholar]
- 38.Wagner LI, Schink J, Bass M, et al. Bringing PROMIS to practice: Brief and precise symptom screening in ambulatory cancer care. Cancer. 2015;121:927–934. doi: 10.1002/cncr.29104. [DOI] [PMC free article] [PubMed] [Google Scholar]
- 39. doi: 10.1002/cncr.30354. Jensen RE, Moinpour CM, Potosky AL, et al: Responsiveness of 8 Patient-Reported Outcomes Measurement Information System (PROMIS) measures in a large, community-based cancer study cohort. Cancer 123:327-335, 2017. [DOI] [PMC free article] [PubMed] [Google Scholar]


