

Abstract
Checkpoint inhibitors are relatively inefficacious in head and neck cancers, despite an abundance of genetic alterations and a T cell-inflamed phenotype. One significant barrier to efficacy may be the recruitment of myeloid-derived suppressor cells (MDSC) into the tumor microenvironment. Here we demonstrate functional inhibition of MDSC with IPI-145, an inhibitor of PI3Kδ and PI3Kγ isoforms which enhances responses to PD-L1 blockade. Combination therapy induced CD8+ T lymphocyte-dependent primary tumor growth delay and prolonged survival only in T cell-inflamed tumor models of head and neck cancers. However, higher doses of IPI-145 reversed the observed enhancement of anti-PD-L1 efficacy due to off-target suppression of the activity f tumor-infiltrating T lymphocytes. Together, our results offer a preclinical proof of concept for the low dose use of isoform-specific PI3Kδ/γ inhibitors to suppress MDSC to enhance responses to immune checkpoint blockade.
Keywords: MDSC, PI3K, IPI-145, immunosuppression, head and neck cancer
Introduction
Most head and neck squamous cell carcinomas (HNSCCs) arise secondary to carcinogen exposure that contributes to genomic instability and production of neoantigens capable of being targeted by adaptive immunity (1–3). Accordingly, significant subsets of HNSCCs are T-cell inflamed (4,5). Immune checkpoints, such a programmed cell death protein 1 (PD-1) and it’s ligand (PD-L1), play a critical role in adaptive immune resistance within the microenvironment of these tumors (6). PD-based checkpoint inhibition, recently FDA-approved for recurrent/metastatic HNSCC, results in clinically significant and durable responses in a subset of HNSCC patients (7). However, not all HNSCC patients with T-cell inflamed tumors benefit from checkpoint inhibitor therapy, due at least to immunosuppression within the HNSCC tumor microenvironment. Myeloid derived suppressor cells (MDSCs) suppress effector immune cells and are a major driver of local immune suppression within HNSCCs (8–16).
Following recruitment into the tumor microenvironment through tumor cell-dependent chemokine expression (17), MDSCs mediate T-lymphocyte immunosuppression through STAT3-dependent mechanisms that include expression of arginase and inducible nitric oxide synthetase (iNOS) (9). Cumulatively, MDSCs deplete the tumor microenvironment of nutrients critical for T-lymphocyte function and directly suppress immunity through the production of reactive oxygen species (ROS) and immunosuppressive cytokines (8,15).
Phosphoinositide 3-kinase (PI3K) signaling links environmental cues to alterations in cellular metabolism, growth and survival. Closely related class I PI3K isoforms include p110α and p110β, which are ubiquitously present in most cell types and frequently overexpressed or constitutively active in HNSCC (3), and p110δ and p110γ, which are expressed primarily in hematopoietic cells (18). Recent reports have demonstrated that functional inhibition or polarization of tumor infiltrating myeloid cells with a p110γ specific inhibitor (IPI-549) sensitized HPV+ and HPV− models of HNSCC and B16F10 tumors engineered to recruit myeloid cells through constitutive GM-CSF production to PD-based checkpoint inhibition(19,20). However, both the p110δ and p110γ isoforms of PI3K have been implicated in immunosuppression mediated by myeloid cells in solid tumors(21). IPI-145 is a selective p110δ/γ inhibitor that has been evaluated clinically for the treatment of hematopoietic malignancies (22,23). We hypothesized that dual p110δ/γ inhibition with IPI-145 would reverse MDSC-mediated local immunosuppression and sensitize carcinogen-induced, HPV− HNSCC tumors with robust myeloid cell recruitment to PD-based checkpoint inhibition. We demonstrated that selective p110δ/γ inhibition with low dose IPI-145 partially abrogated local immunosuppression mediated by granulocytic MDSCs (gMDSC) and enhanced CD8-dependent responses to PD-L1 mAb therapy. IPI-145 suppressed gMDSC production of arginase and iNOS in a dose-dependent fashion both ex vivo and in vivo, leading to enhanced antigen-specific T-lymphocyte responses. However, IPI-145 also appeared to suppress tumor infiltrating lymphocyte (TIL) function in a dose-dependent fashion, as high dose IPI-145 treatment in vivo reversed tumor growth control observed with low dose IPI-145 and PD-L1 mAb combination therapy through TIL suppression. These findings further validate the approach of targeting immunosuppressive myeloid cells with selective PI3K inhibition, but suggest that a therapeutic window may exist with dual p110δ/γ inhibition where greater suppression of MDSCs than TIL leads to enhanced responses to checkpoint inhibition.
Materials and Methods
In vivo treatments
Murine oral cancer (MOC) cells were provided by Dr. R. Uppaluri (Washington University School of Medicine) to our laboratory in 2014 and have been cultured as described (24). MOC cells were validated to be of epithelial origin (25), and routinely tested for mycoplasma. All experiments were approved by the NIDCD Animal Care and Use Committee. To establish MOC tumors, 5×10⁶ MOC1 or 1×10⁵ MOC2 cells were injected subcutaneously into the flank of wild-type (WT) C57BL/6 (B6) mice (Charles River). IPI-145 (Active Biochem) was administered via oral gavage daily for fourteen days. Control mice received oral gavage of vehicle (0.5% carboxymethylcellulose, 0.05% Tween 80 in ultra-pure water) alone. PD-L1 mAb (clone 10F.9G2, BioXCell), CD8 mAb (clone YTS 169.4), Ly6G mAb (clone 1A8) or isotype control antibody (clone LFT-2) treatments were performed via intraperitoneal (IP) injection (200 μg/injection).
Tissue processing and flow cytometry
All tissues were used fresh. Spleen and lymph nodes were processed by mechanical dissociation between frosted slides followed by RBC lysis. Dissected normal oral mucosa from WT B6 mice or tumor tissues were processed into single-cell suspensions by mincing, chemical (murine tumor dissociation kit, Miltenyi Biotec) and mechanical (gentleMACS, Miltenyi) dissociation per the manufacturer’s protocol. Suspensions were filtered through a 100 μM filter and washed with 1% BSA in PBS prior to blocking non-specific staining with anti-CD16/32 (Biolegend) antibody. Cell surface staining was performed using fluorophore conjugated anti-mouse CD45.2 clone 104, CD3 clone 145-2C11, CD4 clone GK1.5, CD8 clone 53-6.7, CD31 clone 390, PDGFR clone APA5, PD-L1 clone 10F.9G2, H2-Kb clone AF6-88.5, CD107a clone 1D4B, CD69 clone H1.2F3, PD-1 clone RMP1-30, CD11b clone M1/70, Ly6G clone 1A8, Ly6C clone HK1.4, and CD44 clone IM7 antibodies from Biolegend, and 41BB clone 17B5 and OX40 clone OX-86 were from eBioscience. FoxP3+ regulatory T-cell staining performed with the mouse regulatory T-cell staining kit #1 (eBioscience) per manufacturer protocol. For intracellular phosphoprotein staining, cells were fixed and permeabilized using the Fixation and Permeabilization Buffer Set (eBioscience) per manufacturer protocol and stained with pAKT (S473) and pS6 (S240/244) antibodies (Cell Signaling) or isotype (rabbit IgG) followed by goat anti-rabbit secondary antibody conjugated to APC (Biolegend). Dead cells were excluded via 7AAD (Biolegend) negativity for cell surface staining or Live/Dead cell viability dye (Thermo) negativity for intracellular staining. Isotype control antibodies and a “fluorescence minus one” method of antibody combination were used for specific staining validation. Data was acquired on a FACSCanto using FACSDiva software (BD Biosciences) and analyzed on FlowJo software vX10.0.7r2.
Cell sorting
For ex vivo expression or functional T-lymphocyte analysis, splenic or lymph node suspensions were sorted on an autoMACS Pro Separator (Miltenyi Biotec) using the pan T-cell kit (Miltenyi, negative selection) to select T-lymphocytes or the anti-Ly6G microbead kit (Miltenyi, positive selection) to select gMDSCs per manufacturer protocol. To enrich draining lymph node T-lymphocytes, tissues were processed into single cell suspensions and subjected to negative T-cell magnetic selection alone. To enrich TIL, digested tumor single cell suspensions were first enriched for lymphocytes using a 40/80% isotonic Percoll (Sigma) gradient (centrifuged at 325xg for 23 minutes at room temperature), followed by positive selection of T-lymphocytes using the CD3ε microbead kit (Miltenyi). To enrich tumor infiltrating gMDSC, a similar Percoll gradient was followed by gMDSC selection using the anti-Ly6G microbead kit. Purity of cells enriched from spleen and lymph node populations was consistently >90% and purity of cells enriched from tumor was consistently >95% as assessed by flow cytometry.
Western blot analysis
Whole-cell lysates were obtained using NP40 lysis buffer, mixed with NuPAGE LDS sample buffer and NuPAGE sample reducing agent (Life Technologies), heated at 95°C for 5 min and subjected to electrophoresis using 4 – 12% Bis-Tris precast gels (Life Technologies) at 150 V for 100 min. The Invitrogen iBlot Dry Blotting System was used to transfer proteins onto a PVDF membrane. Primary antibodies were diluted in 5% BSA prepared from Tween 20-TBS: rabbit monoclonal anti-pAKT (Ser473) antibody, 1:2,000 (Cell Signaling Technology); rabbit monoclonal anti-pS6 (Ser240/244) antibody, 1:1,000 (Cell Signaling Technology); mouse monoclonal anti-Beta-actin, 1:5000 (Calbiochem). Each blot was incubated with Chemiluminescent HRP Antibody Detection Reagent (Denville Scientific Inc.) and imaged using Image Studio software (LI-COR Biosciences).
In vitro cell viability
In vitro cell viability was quantified via XTT assay (Trevigen) per manufacturer instructions or via dual acridine orange and propidium iodine staining per manufacturer instructions, quantified on a Cellometer Auto 2000 (Nexcelcom).
T-lymphocyte proliferation assay
T-cells isolated from naïve B6 spleens were stained with 5 μM carboxyfluorescein succinimidyl ester (CFSE; Sigma) and stimulated using plate-bound CD3 (clone 145-2C11, eBioscience) and CD28 (clone 37.51, eBioscience) antibodies(26). For antigen-specific experiments, sorted OT-1 splenic T-lymphocytes were exposed to irradiated (20 Gy) naïve splenocytes pulsed with OVA257-264 (SIINFEKL; 1 μg/ml; InVivoGen). Where indicated, T-cells were co-cultured with MDSCs, IPI-145, nor-NOHA, and/or L-NMMA (Cayman Chemicals, 300 μM each) for 4 hours prior to stimulation, and flow cytometry was used to quantify 72-hour CFSE dilution. Proliferation was quantified as the average number of divisions for all cells in the culture (division index) using FlowJo software(27). Media for all functional immune assays consisted of RPMI 1640 supplemented with 10% FCS, 2 μM β-ME, HEPES, nonessential amino acids, glutamine, and antibiotics.
T-lymphocyte killing assay
Splenocytes from OT-1 mice were cultured in the presence of SIINFEKL (2 μg/ml) with daily 2:1 splitting. After 72 hours in culture, >80% of remaining cells are CD8+Vα2+ cells (data not shown). OT-1 CTLs were exposed to SIINFEKL pulsed EL4 cells labeled with indium111 with or without MDSCs and indicated inhibitors. Four-hour supernatants were analyzed for gamma radiation counts on a WIZARD2 Automatic Gamma Counter (PerkinElmer).
IFNγ production assays
T-lymphocytes sorted from naïve spleen were stimulated using plate-bound CD3 and CD28 antibodies with or without MDSCs and indicated inhibitors. In other experiments, sorted splenic, lymph node or tumor T-cells from tumor-bearing mice were co-cultured with IFNγ-pretreated (20 ng/mL, 24 hours) and irradiated (50 Gy) MOC1 cells at a 10:1 T-lymphocyte:MOC1 cell ratio for 48 hours in flat-bottom 96-well plates. Supernatant IFNγ levels were quantified by ELISA (eBioscience) per manufacturer protocol.
qRT-PCR
RNA was extracted from MOC cells using the RNEasy Mini Kit (Qiagen) or from sorted immune cell subsets using the PicoPure RNA Isolation Kit (Thermo Scientific). cDNA was synthesized using high capacity reverse transcription. Gene expression was determined relative to GAPDH using the indicated primers (Life Technologies) on a 7900HT Sequence Detection System (Applied Biosystems).
Statistical Analysis
Tests of significance between pairs of data are reported as p-values, derived using a student’s t-test with a two-tailed distribution and calculated at 95% confidence. Comparison of multiple sets of data was achieved with analysis of variance with Tukey’s multiple comparisons. Survival analysis was determined by Log-Rank (Mantel-Cox) analysis. All error bars indicate standard deviation. Statistical significant was set to p<0.05. All analysis was performed using GraphPad Prism v7.
Results
MOC tumors display accumulation of myeloid derived suppressor cells in the periphery and tumor microenvironment that suppress T-lymphocyte function
When injected into wild-type B6 mice, MOC1 cells generate T-cell inflamed tumors capable of inducing immunologic memory and MOC2 cells generate non-T-cell inflamed tumors that do not generate immunology memory (24,28). Compared to naïve spleen and normal oral mucosa, spleens and tumors in MOC1 tumor-bearing mice demonstrated robust accumulation of myeloid cells (Figure 1A, left panels). The majority of these CD11b+ cells displayed surface markers indicating a granulocytic (Ly6Ghi, Ly6Cint) as opposed to a monocytic (Ly6Glow, high Ly6Chi) phenotype. Analysis of immune cell distributions revealed expansion of these myeloid cell populations within spleen and tumors of MOC1 tumor-bearing mice (day 30) but not FoxP3+ regulatory T-lymphocytes (Tregs) (Figure 1A, right charts). Using magnetic separation strategies, these granulocytic myeloid cells could be enriched for functional analysis (Figure S1). When evaluated in a T-lymphocyte proliferation assay, these cells inhibited CD4 and CD8 T-lymphocyte proliferation in a dose-dependent fashion (Figure 1B). Splenic and tumor myeloid cells were evaluated for expression of immunosuppressive enzymes compared to non-tumor-bearing spleen, and were found to have increased expression of arginase and iNOS (Figure 1C) but not indoleamine 2,3-dioxygenase or NADPH oxidase 2 (Figure S2). Inhibition of CD4 and CD8 T-lymphocyte proliferation by these cells was partially reversed in the presence of norNOHA (arginase inhibitor) and L-NMMA (iNOS inhibitor) alone or in combination (Figure 1D). Splenic and tumor myeloid cells were also evaluated for their ability to suppress OT-1 antigen-specific CTL lysis of SIINFEKL-pulsed target cells. Near complete suppression of 4-hour CTL lysis in the presence of splenic or tumor myeloid cells was significantly reversed in the presence of arginase and iNOS inhibition (Figure 1E). Similar inhibition of T-lymphocyte proliferation and CTL function were observed with gMDSC sorted from MOC2 tumors. Thus, granulocytic myeloid cells accumulate in the periphery and tumor microenvironment of MOC tumor-bearing mice and possess the ability to significantly suppress T-lymphocyte function in a process partially dependent upon arginase and iNOS, functionally validating them as gMDSC.
Figure 1. – MOC tumor bearing mice accumulate primarily granulocytic MDSCs that potently suppress T-lymphocyte proliferation and cytolytic activity through at least arginine and iNOS.
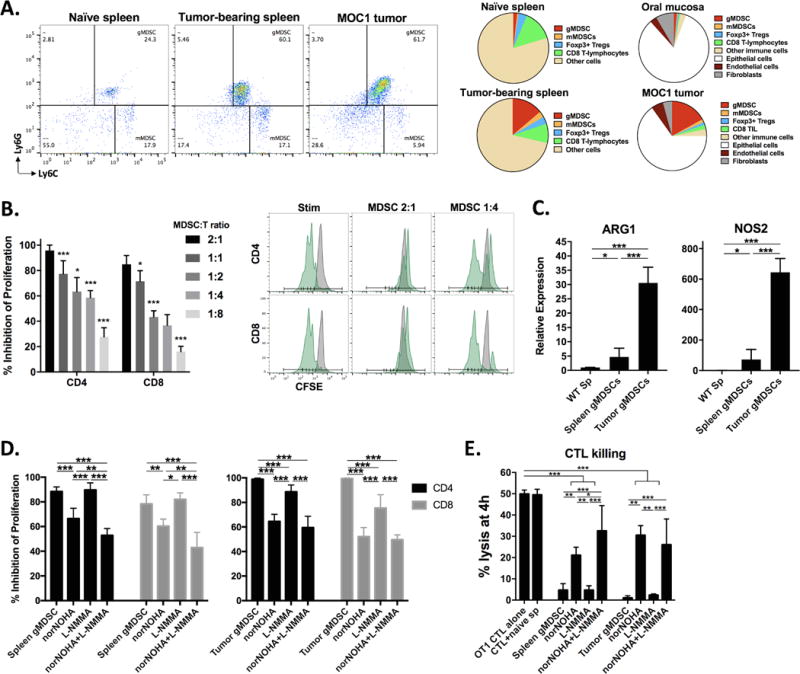
A, dotplots of live, CD45+CD11b+ cells in naïve or MOC1 tumor-bearing mice (left panels, 30 days after tumor implantation). Right charts, cellular distribution of gMDSC (CD45.2+CD11b+Ly6GhiLy6Cint), mMDSC (CD45.2+CD11b+Ly6GlowLy6Chi), Tregs (FoxP3+CD25+CD4+), CD8 T-lymphocytes (CD45.2+CD3+CD8+), other CD45.2+ immune cells, epithelial or tumor cells (CD45.2−CD31−PDGFR−), endothelial cells (CD45.2−CD31+PDGFR−) and fibroblasts (CD45.2−CD31−PDGFR+) within naïve and MOC1 tumor bearing tissues as indicated (n = 10 mice, day 30 after tumor implantation). B, dose-dependent suppression of CD4 and CD8 T-lymphocyte proliferation by sorted splenic gMDSCs. Representative CFSE histograms are shown (stimulated CFSE-labeled T-lymphocytes with or without gMDSCs in green and unstimulated CFSE-labeled T-lymphocytes in grey). C, qRT-PCR analysis of Arg1 and Nos2 transcript levels in non-tumor bearing splenocytes and splenic and tumor gMDSCs (relative to naïve splenocytes). D, splenic and tumor infiltrating gMDSCs were exposed to the arginase inhibitor norNOHA and the iNOS inhibitor L-NMMA (300 μM each) alone or in combination for 4 hours before being combined with CFSE-labeled T-lymphocytes and assayed for suppressive capacity. E, splenic and tumor gMDSCs were exposed to norNOHA and L-NMMA alone or in combination for 4 hours before being combined with activated OT-1 CTLs at a 1:1 ratio in a 4-hour indium111 release assay (10:1 E:T ratio). Pooled data from three independent experiments is shown. *, p<0.05; **, p<0.01; ***, p<0.001.
PI3K δ/γ inhibition with ex vivo IPI-145 reverses T-lymphocyte suppression by gMDSC
To determine differential expression of PI3K class I isoforms in different cell types, we measured transcript levels in MOC1 and MOC2 cells as well as sorted TIL and gMDSCs from MOC1 tumors. Using the α isoform from MOC1 as a reference, PI3K δ and γ isoforms were expressed at higher levels in sorted TIL and gMDSC compared to MOC cells (Figure 2A). MDSCs express significantly more Pik3cg levels that T-lymphocytes. Treatment with increasing doses of the selective PI3K δ and γ isoform inhibitor IPI-145 had little effect on MOC cell viability as measured by XTT viability assay (IC50>10 μM) and exclusion of propidium iodide (Figure 2B). IPI-145 reduced phosphorylation of AKT and S6 downstream of PI3K in gMDSCs but not MOC1 cells (Figure 2C), consistent with immune cell dependence upon PI3K δ and γ isoforms for downstream signaling. Similar results were observed for MOC2 treated with IPI-145. To assess functional alteration, sorted splenic and tumor gMDSC were exposed to IPI-145 (10 nM) ex vivo for 4 hours. While treatment at this concentration did not induce gMDSC loss of viability, expression of Arg1 and Nos2 transcript levels were significantly reduced in tumor MDSCs, while only Arg1 levels were reduced in splenic MDSC (Figure 2D). This correlated with significant reversal of the ability of gMDSC to suppress the proliferation of T-lymphocytes, to a greater degree for tumor than splenic gMDSC. Cumulatively, these data suggested that ex vivo PI3K δ and γ inhibition with IPI-145 treatment has little direct effect on MOC cell viability but can partially reverse the immunosuppressive phenotype of peripheral and tumor infiltrating gMDSC through alteration of Arg1 and Nos2 expression.
Figure 2. – The selective PI3Kδ/γ isoform inhibitor IPI-145 variably reverses splenic and tumor MDSC suppressive capacity ex vivo.
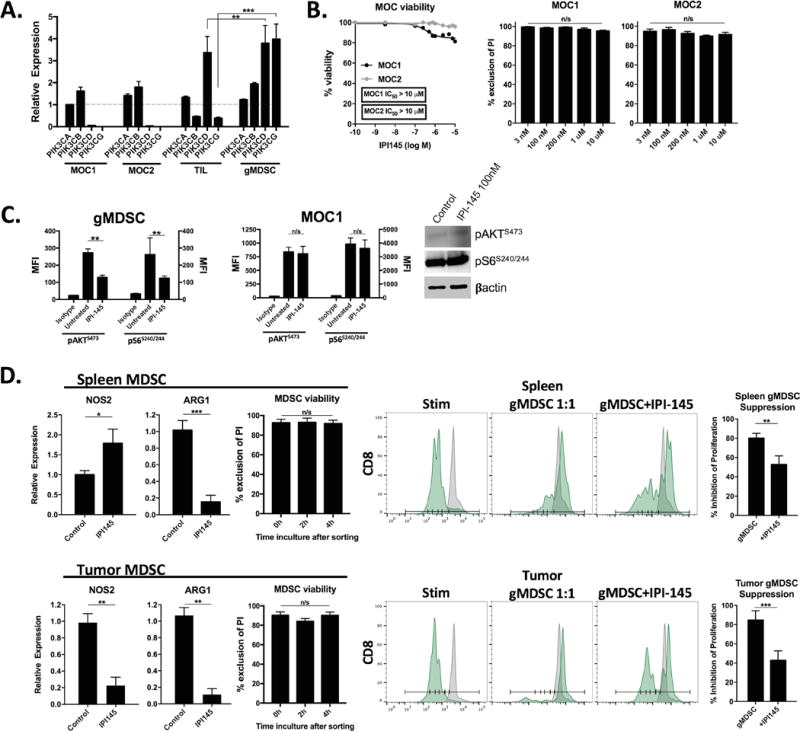
A, qRT-PCR of PI3K subunit transcript levels in MOC tumor cells, sorted MOC1 TIL and sorted tumor gMDSCs (relative to MOC1 PI3Kα, broken grey line). B, viability of MOC cells following exposure to increasing concentrations of IPI-145 measured by XTT assay (left panel) or exclusion of propidium iodide (right bar graphs). C, sorted tumor gMDSC or MOC1 cells were treated with IPI-145 (100 nM) for 4 hours and analyzed for AKTS473 and S6S240/244 phosphorylation via intracellular flow cytometry, MFI reported in bar graphs. Western blot of MOC1 cells treated with IPI-145 is shown. D, left bar graphs, qRT-PCR analysis of Arg1 and Nos2 transcript levels in sorted splenic and tumor gMDSCs treated ex vivo with IPI-145 (100 nM) or control (HBSS) for 4 hours and resulting viability of gMDSCs as measured by exclusion of propidium iodide. Right panels and bar graphs, sorted splenic and tumor MDSCs were similarly treated ex vivo and assessed for suppressive capacity in a T-lymphocyte proliferation assay (1:1 MDSC:T-lymphocyte ratio). Pooled data from at least two independent experiments is shown. *, p<0.05; **, p<0.01; ***, p<0.001. n/s, non-significant.
IPI-145 partially inhibits priming and effector function of T-lymphocytes
One potential drawback of PI3K δ/γ inhibition is direct suppression of T-lymphocyte function. Exposure of T-lymphocytes sorted from naïve B6 mice stimulated with plate-bound CD3 and CD28 antibodies to IPI-145 resulted in dose-dependent suppression of proliferation (Figure 3A). To validate these findings in an antigen-specific system, CD8 T-lymphocytes were sorted from OT-1 spleens and exposed to SIINFEKL-pulsed target cells. Treatment with IPI-145 suppressed OT-1 CD8 T-lymphocyte IFNγ production and activation marker expression in a dose-dependent fashion (Figure 3B) as well as proliferation (Figure 3C). Similarly, the presence of IPI-145 inhibited the ability of antigen-specific CTLs to lyse target cells (Figure 3D). Taken together, these data suggested that although PI3K δ/γ inhibition with IPI-145 appears to partially reverse the suppressive capacity of gMDSC, it also appears to inhibit priming and effector function in antigen-specific T-lymphocytes in a dose-dependent fashion.
Figure 3. – IPI-145 inhibits CD3/28 stimulated and antigen-specific T-lymphocyte activity in a dose dependent fashion.
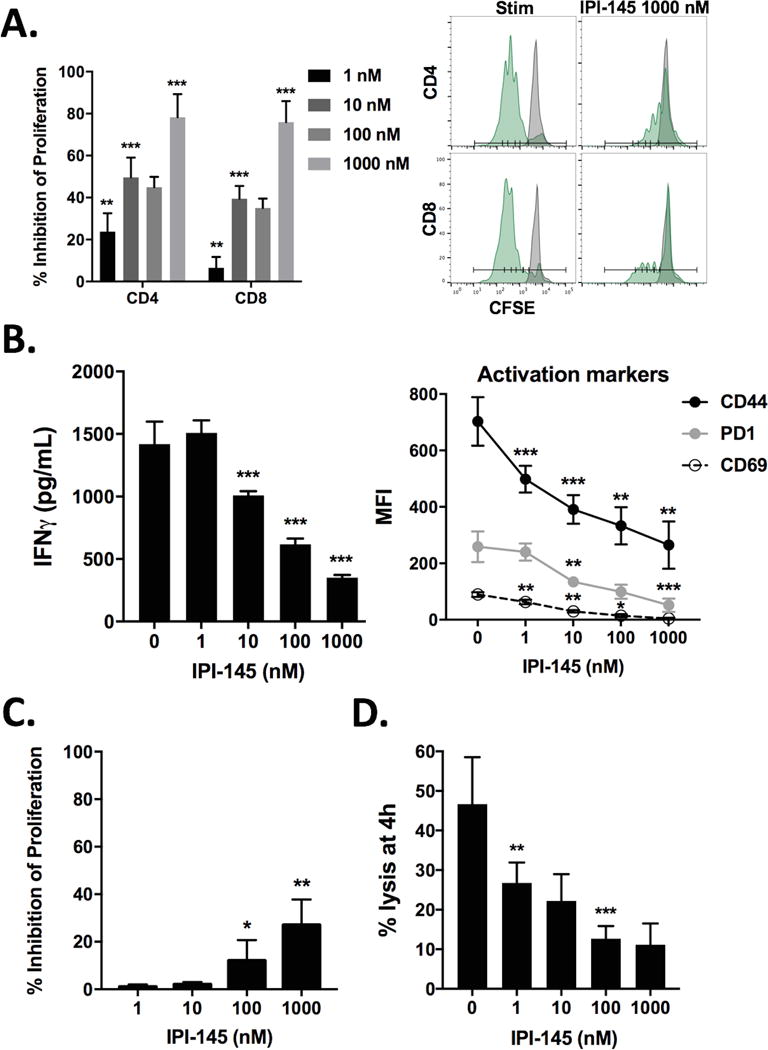
A, T-lymphocytes were stimulated with CD3/28 antibodies in the presence of IPI-145 and proliferation was measured at 72 hours (quantified on left, representative histograms on right). B, OT-1 T-lymphocytes were exposed to SIINFEKL-pulsed splenocytes, 24-hour supernatant IFNγ levels were measured via ELISA, and CD44, PD1 and CD69 expression was measured on CD8+ OT-1 cells at 24 hours via flow cytometry. C, following similar stimulation, OT-1 T-lymphocyte proliferation was measured via flow cytometry at 72 hours. D, activated OT-1 CTLs were combined with SIINFEKL-pulsed EL4 cells (10:1 E:T ratio) in the presence of increasing concentrations of IPI-145 in a 4-hour indium111 release assay. Pooled data from three independent experiments performed in multiple technical replicates are shown. *, p<0.05; **, p<0.01; ***, p<0.001; asterisks indicate significant difference from the immediately smaller dose or control.
IPI-145 alone alters the MOC1 immunosuppressive tumor microenvironment and promotes antigen-specific T-lymphocyte responses
We assessed the effect of IPI-145 monotherapy on MOC primary tumor growth and immune correlates. Given data that an in vivo dose of 10 mg/kg daily significantly altered neutrophil chemotaxis in rats (22), an initial dose of 15 mg/kg was administered. Daily IPI-145 treatment at 15 mg/kg did not alter MOC1 primary tumor growth to a statistically significant degree (Figure 4A). However, analysis of tumor single cell suspensions revealed enhanced infiltration of CD8 TIL and expression of the activation marker CD107a and exhaustion marker PD1 (Figure 4B). CD4 TIL infiltration and OX40 expression were not significantly affected (Figure 4C). Tumor cell specific MHC class I (H2-Kb) and PD-L1 expression on both tumor and endothelial cells was enhanced (Figure 4D). To assess the effect of IPI-145 monotherapy on MDSC function, gMDSCs were sorted from treated MOC1 tumors and evaluated in a T-lymphocyte suppression assay. While accumulation of MDSCs into MOC1 tumors was not altered and PD-L1 expression on gMDSCs appeared to be modestly enhanced by IPI-145 treatment (Figure 4E), the ability of gMDSCs to directly suppress T-lymphocytes proliferation was reduced (Figure 4F). Tumor microenvironment PD-L1 levels were likely increased due to overall immune activation indicative of adaptive immune resistance(6), and these findings suggest that the immune activating effects of IPI-145 are independent of PD-L1 expression on tumor or infiltrating immune cells. T-lymphocytes from tumor draining lymph nodes were sorted and stimulated with IFNγ pretreated and irradiated MOC1 cells. Suppression of gMDSC function with IPI-145 correlated with a significant increase in T-lymphocyte IFNγ production when exposed to MOC1 antigen (Figure 4G), suggesting that while IPI-145 monotherapy at 15 mg/kg does not significantly affect MOC1 primary tumor growth, it does alter the immunosuppressive tumor microenvironment and enhance T-lymphocyte activation potential. Evaluation of spleens from the same animals revealed similar trends with modestly but significantly increased CD8 concentrations (Figure S3A), no change in MDSC concentrations, and reduced gMDSC suppression potential (Figure S3B), albeit to a lesser degree than that observed in tumor. Treatment of non-T-cell inflamed MOC2 tumor-bearing mice with IPI-145 15 mg/kg resulted in no measurable tumor growth inhibition, change in TIL infiltration or enhancement of MHC class I or PD-L1 expression indicative of modulation of the tumor microenvironment (Figure S4A–D).
Figure 4. – Low-dose IPI-145 monotherapy in vivo partially reverses MDSC suppressive capacity and enhances CD8 TIL infiltration and activation in MOC1 tumor-bearing mice.
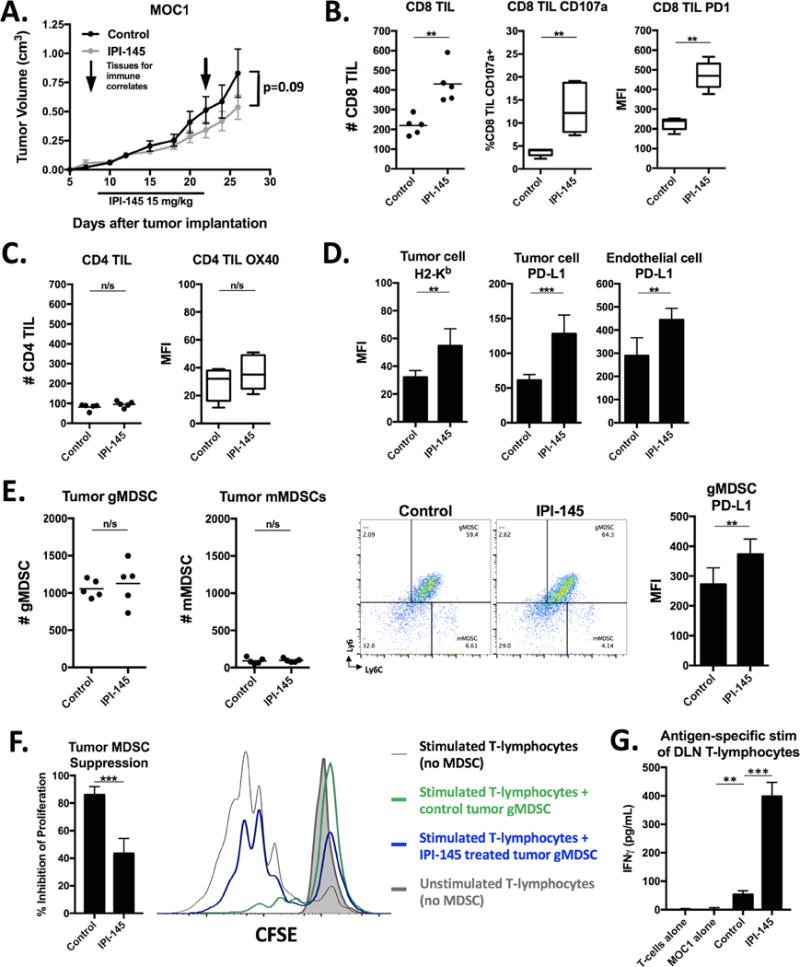
A, mice bearing palpable MOC1 tumors were treated with 15 mg/kg IPI-145 for 14 days (n=8–10 mice/group). Tissues were analyzed for immune correlates on the last day of treatment (n=5 mice/group). All immune infiltrate data represented as absolute number of infiltrating cells per 1×10⁴ live cells collected. Tumor single cell suspensions were analyzed for CD8 TIL (B) and CD4 TIL (C) infiltration and activation markers via flow cytometry. Cells shown are 7AAD−CD45.2+CD3+. D, expression of H2-Kb and PD-L1 was measured on tumor cells (CD45.2−CD31−) or endothelial cells (CD45.2−CD31+) via flow cytometry. E, quantification (left panels) and representative dot plots (right panels) of tumor infiltrating MDSCs measured from tumor single cell suspensions via flow cytometry. MFI of gMDSC PD-L1 expression quantified. F, tumor gMDSCs were sorted and assessed for their ability to suppress T-lymphocyte proliferation at 72 hours (quantified on the left, overlaid CFSE histograms on right). G, T-lymphocytes were isolated from tumor draining lymph nodes, pooled, and stimulated with IFNγ (20 ng/mL) pretreated and irradiated (50 Gy) MOC1 cells for 48 hours. IFNγ levels quantified by ELISA. **, p<0.01; ***, p<0.001. n/s, non-significant.
Combination IPI-145 and PD-L1 mAb treatment enhances primary tumor growth control and survival of MOC1 tumor–bearing mice
Given the enhanced T-lymphocyte responses and expression of PD1 and PD-L1 within the tumor microenvironment following treatment of MOC1 tumor-bearing mice, we hypothesized that IPI-145 could prime MOC1 tumors to immune-activation with PD-L1 mAb. Combination IPI-145 at 15 mg/kg and PD-L1 mAb resulted in significantly enhanced primary tumor growth control (Figure 5A) and survival of MOC1 tumor-bearing mice (Figure 5B) over either treatment alone. Individual tumor growth curves are shown in Figure 5C. Analysis of treated tumor single cell suspensions revealed enhanced infiltration of CD8 TIL (Figure 6A) and expression of CD8-T-lymphocyte activation and exhaustion markers (Figure 6B). Tumor cell specific MHC class I expression was also significantly enhanced (Figure 6C). Similar to IPI-145 alone, combination treatment did not significantly alter MDSC accumulation within the tumor microenvironment (Figure S5). Tumor draining lymph node T-lymphocytes were isolated and activated using non-specific (CD3/28 antibodies) or antigen-specific (exposed to IFNγ pretreated and irradiated MOC1 cells) stimuli and found to have significantly enhanced activation potential with combination treatment over any treatment alone (Figure 6D). To validate a CD8 T-lymphocyte dependent mechanism of response to IPI-145 and PD-L1 mAb treatment, MOC1 tumor-bearing mice were treated with or without CD8 depleting antibody. Depletion of CD8 T-lymphocytes resulted in near-complete abrogation of all treatment responses (Figure 6E). The addition of IPI-145 treatment to mice treated with a gMDSC depleting antibody alone or in combination with PD-L1 mAb resulted in similar levels of tumor control (Figure 6F), suggesting that IPI-145 primarily exerts is effects through gMDSC suppression and not suppression of other cell types. Treatment of non-T-cell inflamed MOC2 tumor-bearing mice with IPI-145 15 mg/kg plus PD-L1 mAb resulted in no measurable tumor growth inhibition (Figure S6). Thus, IPI-145 and PD-L1 mAb treatment can enhance anti-tumor responses over either treatment alone in T-cell inflamed MOC1 tumors, in a CD8 T-lymphocyte dependent fashion at least in part through IPI-145 induced partial reversal of gMDSC suppressive capacity.
Figure 5. – Combining low dose IPI-145 with PD-L1 blockade results in enhanced control of MOC1 tumors.
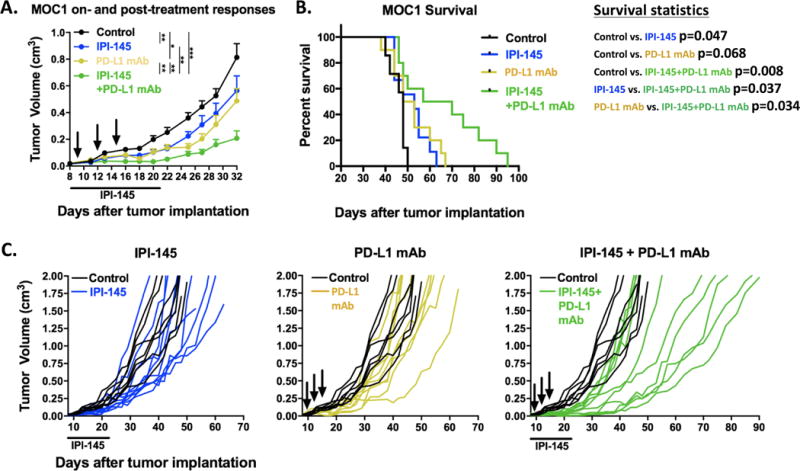
Mice bearing palpable MOC1 tumors were treated with 15 mg/kg IPI-145 (daily × 14 days) and PD-L1 mAb (200 μg/injection × 3) alone or in combination and mice were followed for tumor growth and survival (n=8–10 mice/group). A, primary tumor growth summary curves during treatment and in the immediate post-treatment period (Tukey’s multiple comparisons analysis). B, survival analysis. C, individual growth curves (in color) compared to control (black) demonstrating long-term growth kinetics for each experimental condition. IPI-145 treatment indicated below x-axis, black arrows indicate PD-L1 mAb treatments. *, p<0.05; **, p<0.01; ***, p<0.001.
Figure 6. – Combination low dose IPI-145 and PD-L1 mAb enhances CD8 T-lymphocyte dependent anti-tumor immunity.
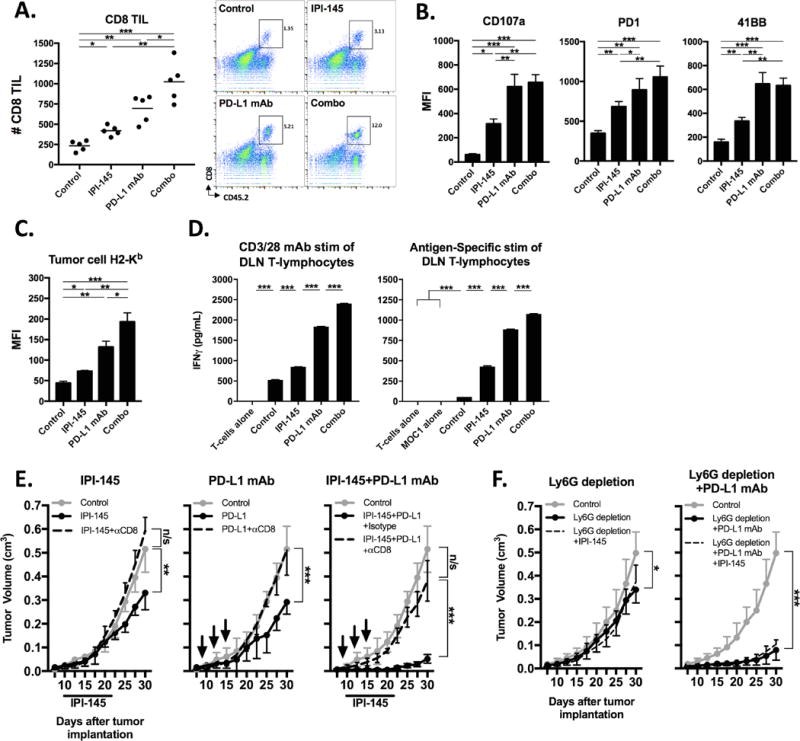
Mice bearing palpable MOC1 tumors were treated with 15 mg/kg IPI-145 and PD-L1 mAb alone or in combination, and tumor single cell suspensions (n=5 mice/group) were analyzed on the final day of treatment for (A) CD8 TIL infiltration (number per 1×10⁴ live cells collected, representative dot plots on right) and activation (B). C, tumor cell H2-Kb expression. D, from the same mice, T-lymphocytes were isolated from tumor draining lymph nodes, pooled, and stimulated with either CD3/28 microbeads (1:1 bead:T-lymphocyte ratio) for 24 hours or IFNγ pretreated and irradiated MOC1 cells for 48 hours. IFNγ levels were quantified by ELISA. E, mice bearing palpable MOC1 tumors were treated with 15 mg/kg IPI-145 and PD-L1 mAb, alone or in combination, along with either anti-CD8 mAb (clone YTS 169.4) or isotype control (n=5–7 mice/group). IPI-145 treatment indicated below x-axis, black arrows indicate PD-L1 mAb treatments. F, mice bearing palpable MOC1 tumors were treated with Ly6G mAb (clone 1A8), PD-L1 mAb and 15 mg/kg IPI-145 alone or in combination as indicated (n=6–8 mice/group). *, p<0.05; **, p<0.01; ***, p<0.001. n/s, non-significant.
Combination treatment with an increased dose of IPI-145 abrogates tumor growth control due to suppression of T-lymphocyte responses
Given subtotal reversal of gMDSC suppressive capacity with IPI-145 administered at 15 mg/kg, we hypothesized that an increased dose could further suppress gMDSC immunosuppressive activity in MOC1 tumor-bearing mice. Here, treatment with low dose (15 mg/kg) but not high dose (50 mg/kg) IPI-145 alone resulted in a modest but statistically significant enhancement of survival (Figure 7A, left panels). When combined with PD-L1 mAb, treatment with low dose IPI-145 significantly enhanced primary tumor control and prolonged survival consistent with prior experiments; however, combining high dose IPI-145 with PD-L1 mAb failed to demonstrate such responses (Figure 7A, right panels). When evaluated functionally, splenic and tumor gMDSC isolated from treated mice demonstrated significant reversal of immunosuppressive capacity in a dose-dependent fashion with greater reversal of suppression observed in tumors treated with high dose IPI-145 (Figure 7B). To evaluate the cumulative effect of increasing in vivo IPI-145 doses on adaptive immunity, T-lymphocytes were isolated from the spleens, tumor draining lymph nodes and tumors of treated mice and stimulated in an antigen-specific fashion with IFNγ pretreated and irradiated MOC1 cells (Figure 7C). While peripheral T-lymphocyte responses were suppressed with both low- and high-dose IPI-145 in a dose-dependent fashion, enhanced responses observed with low-dose IPI-145 in both draining lymph node T-lymphocytes and TIL were significantly attenuated with high-dose IPI-145. Thus, abrogated tumor control and survival observed with high dose IPI-145 and PD-L1 mAb appears to be due to attenuation of T-lymphocyte responses within the tumor microenvironment despite enhanced reversal of gMDSC suppressive capacity.
Figure 7. – High dose IPI-145 reverses primary tumor growth delay achieved with combination treatment due to suppression of antigen-specific T-lymphocyte function.
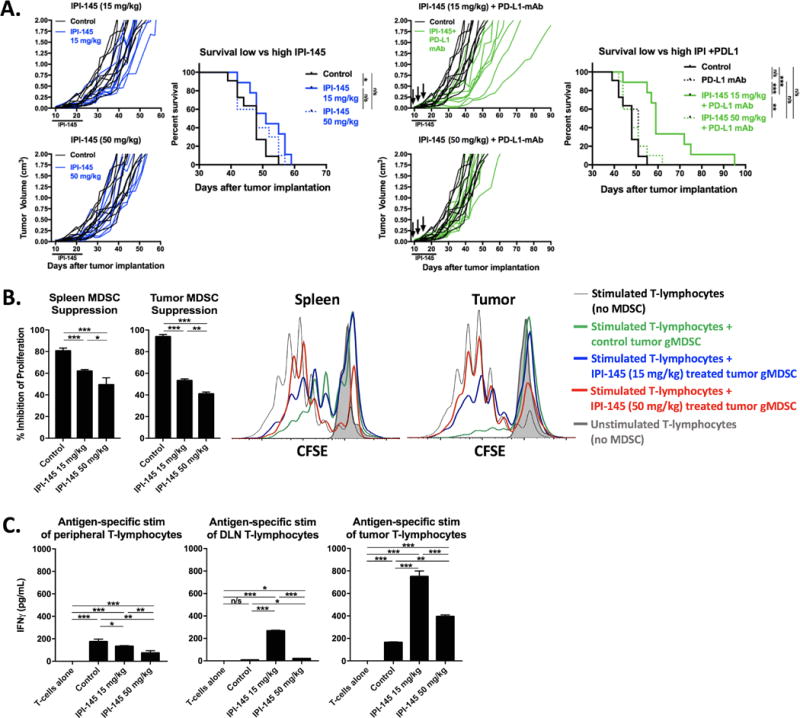
Mice bearing palpable MOC1 tumors (n=8–9 mice/group) were treated with either low dose (15 mg/kg) or high dose (50 mg/kg) IPI-145 alone (A, left panels) or in combination with PD-L1 mAb (A, right panels). Individual growth curves and survival curves are shown. IPI-145 treatment indicated below x-axis, black arrows indicate PD-L1 mAb treatments. B, splenic and tumor gMDSCs were sorted from mice treated with 15mg/kg or 50 mg/kg IPI-145 (n=5 mice/group), pooled, and assessed for suppressive capacity in a T-lymphocyte suppression assay. Results are quantified on the left, and overlay CFSE histograms of representative results are shown on the right. C, from the same mice, T-lymphocytes from the spleen, tumor draining lymph node or tumor were pooled (n=5 mice/group) and stimulated with IFNγ pretreated and irradiated MOC1 cells for 48 hours. IFNγ levels were quantified by ELISA. *, p<0.05; **, p<0.01; ***, p<0.001. n/s, non-significant.
Discussion
Demonstration of durable responses following checkpoint inhibition in patients with solid tumors has led to FDA approval for multiple cancer types including recurrent/metastatic HNSCC (7). However, only about 20% of patients demonstrate clinical responses (7). Similar to human HNSCC, MOC1-derived tumors lack significant responses to PD-based checkpoint inhibition alone, despite the presence of known tumor rejection antigen and being T-cell inflamed (24), and provide a model to study resistance to PD-1/PD-L1 blockade. MOC2-derived tumors model non-T-cell inflamed tumors with few genetic alterations that are less likely to respond to immunotherapy. Here we demonstrated that functional inhibition of gMDSCs through pharmacologic p110δ/γ inhibition partially reversed suppression of T-lymphocyte proliferation and cytolytic capacity ex vivo and enhanced responses to PD-L1 mAb in T-cell inflamed MOC1 but not non-T-cell inflamed MOC2 tumors in vivo. These data suggest that, similar to responses to checkpoint inhibitors alone (29,30), patients with identifiable antigens and T-cell inflamed tumors are more likely to demonstrate responses to alteration of the tumor microenvironment through MDSC inhibition. The lack of responses observed in non-T-cell inflamed MOC2 tumors could have many explanations, including lack of a tumor rejection antigen or other cell-intrinsic mechanisms of immune escape.
Mechanistically, the effect of IPI-145 was MOC tumor cell independent, and p110δ/γ inhibition suppressed tumor gMDSC arginase and iNOS expression and suppressive capacity but not MDSC viability or tumor infiltration. Further, IPI-145 treatment did not block PD-L1 expression within the tumor microenvironment, but rather enhanced it in an effect consistent with adaptive immune resistance. An IPI-145 dose-dependent therapeutic window exists as high dose IPI-145 reversed the sensitization of MOC1 tumors to PD-L1 blockade. Though high dose IPI-145 reversed MDSC suppressive capacity more than low dose in vivo, it also appeared to directly inhibit antigen-specific T-lymphocyte activity. Many of these alterations were significantly different between the peripheral and tumor microenvironment immune compartments, highlighting the pitfall of relying on peripheral immune alterations as a surrogate measure of changes within a complex tumor microenvironment.
The role of PI3K signaling in the regulation of arginase and iNOS expression in myeloid cells is established (31,32), with contributory regulation by signal transducer and activator of transcription 6 (STAT6) and suppressor of cytokine signaling 1 (SOCS1) (33,34). Effectively modeling how best to alter PI3K signaling within myeloid cells to abrogate suppressive capacity while limiting undesirable effects on effector immune cells has important clinical implications as trials combining PI3K inhibitors and immunotherapies are underway. Recent reports have demonstrated the therapeutic role of a PI3Kγ selective inhibitor, IPI-549, in abrogating tumor infiltrating myeloid cell suppression in multiple pre-clinical models (19,20). However, both p110γ (35) and p110δ (21) have been shown to contribute to MDSC-mediated immunosuppression in genetic deletion models. Whereas myeloid cells express both the δ and γ isoforms, T-lymphocytes express δ but very little γ, suggesting that a dual p110δ/γ could lead to undesirable T-lymphocyte suppression(36). Here we demonstrate undesirable suppression of antigen-specific T-lymphocyte function with high- but not low-dose IPI-145. Ali et al. also demonstrated a degree of CTL inhibition with pharmacologic inhibition of p110δ, but concluded that more robust inhibition of tumor infiltrating Tregs and myeloid cells shifted the overall balance toward anti-tumor immunity(21). Consistent trends among these studies and ours indicate that functional inhibition of immunosuppressive cell subsets within the tumor microenvironment with selective PI3K isoform inhibition represents a rational approach to enhancing baseline or checkpoint inhibitor induced anti-tumor immunity. However, therapeutic windows likely exist due to undesirable suppression of effector T-lymphocyte function with inhibition of p110δ. Clearly the use of selective PI3Kδ/γ inhibitors to treat solid tumors would require careful study of different scheduling regimens and doses in the clinical setting.
HNSCCs demonstrate robust accumulation of MDSCs with immune suppressive capacity (9,15,37), but Tregs also contribute to immunosuppression within the HNSCC tumor microenvironment (10,38). Treg function appears to rely upon p110δ signaling(21). Time course analysis demonstrates robust accumulation of potently immunosuppressive gMDSCs but not Tregs in MOC tumors, suggesting that gMDSCs are the predominant driver of local immunosuppression with tumor progression in these models. Our inability to assess the effect of dual PI3Kδ/γ inhibition on Tregs due to their paucity within these models is a limitation of our study. Early infiltration of Tregs into solid tumors may play a critical role in establishing local immunosuppression (39,40), and IPI-145 could modulate their function. The lack of additional growth suppression with IPI-145 treatment in the setting of gMDSC depletion strongly suggests that the mechanism of IPI-145 was gMDSC-dependent in our experiments, but evaluation of the role of IPI-145 in pre-clinical models with Treg-mediated immunosuppression would add clarity to this issue. While survival of MOC1 tumor-bearing mice was significantly enhanced with combination low dose IPI-145 and PD-L1 mAb, no established tumors were rejected. Our study does not clearly define whether this is due to subtotal reversal of MDSC suppressive capacity or some other immunosuppressive or tumor cell intrinsic mechanism.
In conclusion, dual PI3Kδ/γ inhibition with low-dose IPI-145 sensitizes T-cell inflamed MOC1 oral cavity cancers to PD-L1 checkpoint inhibition through at least modulation of gMDSC arginine and iNOS expression and T-lymphocyte suppressive capacity. High-dose IPI-145 reversed this enhanced response to PD-L1 checkpoint inhibition due to direct inhibition of T-lymphocyte responses. Such demonstration of a therapeutic window where gMDSC function is modulated to a greater degree than T-lymphocyte function critically informs the design of clinical trials utilizing selective PI3K inhibitors and immunotherapy.
Supplementary Material
Acknowledgments
We thank Ravindra Uppaluri for mentorship, Sophie Carlson for technical assistance and Jeffrey Schlom and James Hodge for collaborative resource sharing.
Financial support: C. Allen was supported by the Intramural Research Program of the NIH, NIDCD, project number ZIA-DC000087 and the American Academy of Otolaryngology/American Head and Neck Society Duane Sewell Young Investigators Combined Award.R. J. Davis was supported by through the National Institutes of Health (NIH) Medical Research Scholars Program, a public-private partnership supported jointly by the NIH and generous contributions to the Foundation for the NIH from Pfizer Inc., The Doris Duke Charitable Foundation, The Newport Foundation, The American Association for Dental Research, The Howard Hughes Medical Institute, and the Colgate-Palmolive Company, as well as other private donors.
Footnotes
Disclosure: The authors have no conflict of interest to disclose.
References
- 1.Champiat S, Ferte C, Lebel-Binay S, Eggermont A, Soria JC. Exomics and immunogenics: Bridging mutational load and immune checkpoints efficacy. Oncoimmunology. 2014;3:e27817. doi: 10.4161/onci.27817. [DOI] [PMC free article] [PubMed] [Google Scholar]
- 2.Lawrence MS, Stojanov P, Polak P, Kryukov GV, Cibulskis K, Sivachenko A, et al. Mutational heterogeneity in cancer and the search for new cancer-associated genes. Nature. 2013;499:214–8. doi: 10.1038/nature12213. [DOI] [PMC free article] [PubMed] [Google Scholar]
- 3.Cancer Genome Atlas N. Comprehensive genomic characterization of head and neck squamous cell carcinomas. Nature. 2015;517:576–82. doi: 10.1038/nature14129. [DOI] [PMC free article] [PubMed] [Google Scholar]
- 4.Keck MK, Zuo Z, Khattri A, Stricker TP, Brown CD, Imanguli M, et al. Integrative analysis of head and neck cancer identifies two biologically distinct HPV and three non-HPV subtypes. Clin Cancer Res. 2015;21:870–81. doi: 10.1158/1078-0432.CCR-14-2481. [DOI] [PubMed] [Google Scholar]
- 5.Gajewski TF, Schreiber H, Fu YX. Innate and adaptive immune cells in the tumor microenvironment. Nat Immunol. 2013;14:1014–22. doi: 10.1038/ni.2703. [DOI] [PMC free article] [PubMed] [Google Scholar]
- 6.Taube JM, Anders RA, Young GD, Xu H, Sharma R, McMiller TL, et al. Colocalization of inflammatory response with B7-h1 expression in human melanocytic lesions supports an adaptive resistance mechanism of immune escape. Science translational medicine. 2012;4:127r. doi: 10.1126/scitranslmed.3003689. a37. [DOI] [PMC free article] [PubMed] [Google Scholar]
- 7.Seiwert TY, Burtness B, Mehra R, Weiss J, Berger R, Eder JP, et al. Safety and clinical activity of pembrolizumab for treatment of recurrent or metastatic squamous cell carcinoma of the head and neck (KEYNOTE-012): an open-label, multicentre, phase 1b trial. The Lancet Oncology. 2016;17:956–65. doi: 10.1016/S1470-2045(16)30066-3. [DOI] [PubMed] [Google Scholar]
- 8.Gabrilovich DI, Nagaraj S. Myeloid-derived suppressor cells as regulators of the immune system. Nat Rev Immunol. 2009;9:162–74. doi: 10.1038/nri2506. [DOI] [PMC free article] [PubMed] [Google Scholar]
- 9.Vasquez-Dunddel D, Pan F, Zeng Q, Gorbounov M, Albesiano E, Fu J, et al. STAT3 regulates arginase-I in myeloid-derived suppressor cells from cancer patients. J Clin Invest. 2013;123:1580–9. doi: 10.1172/JCI60083. [DOI] [PMC free article] [PubMed] [Google Scholar]
- 10.Davis RJ, Van Waes C, Allen CT. Overcoming barriers to effective immunotherapy: MDSCs, TAMs, and Tregs as mediators of the immunosuppressive microenvironment in head and neck cancer. Oral Oncol. 2016;58:59–70. doi: 10.1016/j.oraloncology.2016.05.002. [DOI] [PMC free article] [PubMed] [Google Scholar]
- 11.Young MR, Petruzzelli GJ, Kolesiak K, Achille N, Lathers DM, Gabrilovich DI. Human squamous cell carcinomas of the head and neck chemoattract immune suppressive CD34(+) progenitor cells. Human immunology. 2001;62:332–41. doi: 10.1016/s0198-8859(01)00222-1. [DOI] [PubMed] [Google Scholar]
- 12.Gabrilovich DI, Bronte V, Chen SH, Colombo MP, Ochoa A, Ostrand-Rosenberg S, et al. The terminology issue for myeloid-derived suppressor cells. Cancer Res. 2007;67:425. doi: 10.1158/0008-5472.CAN-06-3037. author reply 26. [DOI] [PMC free article] [PubMed] [Google Scholar]
- 13.Arina A, Schreiber K, Binder DC, Karrison TG, Liu RB, Schreiber H. Adoptively transferred immune T cells eradicate established tumors despite cancer-induced immune suppression. J Immunol. 2014;192:1286–93. doi: 10.4049/jimmunol.1202498. [DOI] [PMC free article] [PubMed] [Google Scholar]
- 14.Pak AS, Wright MA, Matthews JP, Collins SL, Petruzzelli GJ, Young MR. Mechanisms of immune suppression in patients with head and neck cancer: presence of CD34(+) cells which suppress immune functions within cancers that secrete granulocyte-macrophage colony-stimulating factor. Clin Cancer Res. 1995;1:95–103. [PubMed] [Google Scholar]
- 15.Weed DT, Vella JL, Reis IM, De la Fuente AC, Gomez C, Sargi Z, et al. Tadalafil reduces myeloid-derived suppressor cells and regulatory T cells and promotes tumor immunity in patients with head and neck squamous cell carcinoma. Clinical cancer research : an official journal of the American Association for Cancer Research. 2015;21:39–48. doi: 10.1158/1078-0432.CCR-14-1711. [DOI] [PMC free article] [PubMed] [Google Scholar]
- 16.Gabitass RF, Annels NE, Stocken DD, Pandha HA, Middleton GW. Elevated myeloid-derived suppressor cells in pancreatic, esophageal and gastric cancer are an independent prognostic factor and are associated with significant elevation of the Th2 cytokine interleukin-13. Cancer Immunol Immunother. 2011;60:1419–30. doi: 10.1007/s00262-011-1028-0. [DOI] [PMC free article] [PubMed] [Google Scholar]
- 17.Loukinova E, Dong G, Enamorado-Ayalya I, Thomas GR, Chen Z, Schreiber H, et al. Growth regulated oncogene-alpha expression by murine squamous cell carcinoma promotes tumor growth, metastasis, leukocyte infiltration and angiogenesis by a host CXC receptor-2 dependent mechanism. Oncogene. 2000;19:3477–86. doi: 10.1038/sj.onc.1203687. [DOI] [PubMed] [Google Scholar]
- 18.Vanhaesebroeck B, Guillermet-Guibert J, Graupera M, Bilanges B. The emerging mechanisms of isoform-specific PI3K signalling. Nature reviews Molecular cell biology. 2010;11:329–41. doi: 10.1038/nrm2882. [DOI] [PubMed] [Google Scholar]
- 19.Kaneda MM, Messer KS, Ralainirina N, Li H, Leem CJ, Gorjestani S, et al. PI3Kgamma is a molecular switch that controls immune suppression. Nature. 2016;539:437–42. doi: 10.1038/nature19834. [DOI] [PMC free article] [PubMed] [Google Scholar]
- 20.De Henau O, Rausch M, Winkler D, Campesato LF, Liu C, Cymerman DH, et al. Overcoming resistance to checkpoint blockade therapy by targeting PI3Kgamma in myeloid cells. Nature. 2016;539:443–47. doi: 10.1038/nature20554. [DOI] [PMC free article] [PubMed] [Google Scholar]
- 21.Ali K, Soond DR, Pineiro R, Hagemann T, Pearce W, Lim EL, et al. Inactivation of PI(3)K p110delta breaks regulatory T-cell-mediated immune tolerance to cancer. Nature. 2014;510:407–11. doi: 10.1038/nature13444. [DOI] [PMC free article] [PubMed] [Google Scholar]
- 22.Winkler DG, Faia KL, DiNitto JP, Ali JA, White KF, Brophy EE, et al. PI3K-delta and PI3K-gamma inhibition by IPI-145 abrogates immune responses and suppresses activity in autoimmune and inflammatory disease models. Chem Biol. 2013;20:1364–74. doi: 10.1016/j.chembiol.2013.09.017. [DOI] [PubMed] [Google Scholar]
- 23.Ian Flinn YO, Patel Manish, Horwitz Steven M, Foss Francine M, Sweeney Jennifer, Allen Kerstin, Douglas Mark, Steelman Lori, Dunbar Joi, Stern Howard M, Kelly Patrick, Kahl Brad. a Phase 1 Evaluation of Duvelisib (IPI-145), a PI3K-δ,γ Inhibitor, in Patients with Relapsed/Refractory iNHL. Blood. 2014;124:802. [Google Scholar]
- 24.Moore EC, Cash HA, Caruso AM, Uppaluri R, Hodge JW, Van Waes C, et al. Enhanced Tumor Control with Combination mTOR and PD-L1 Inhibition in Syngeneic Oral Cavity Cancers. Cancer immunology research. 2016;4:611–20. doi: 10.1158/2326-6066.CIR-15-0252. [DOI] [PMC free article] [PubMed] [Google Scholar]
- 25.Judd NP, Winkler AE, Murillo-Sauca O, Brotman JJ, Law JH, Lewis JS, Jr, et al. ERK1/2 regulation of CD44 modulates oral cancer aggressiveness. Cancer Res. 2012;72:365–74. doi: 10.1158/0008-5472.CAN-11-1831. [DOI] [PMC free article] [PubMed] [Google Scholar]
- 26.Davis RJ, Silvin C, Allen CT. Avoiding phagocytosis-related artifact in myeloid derived suppressor cell T-lymphocyte suppression assays. J Immunol Methods. 2016:S0022–1759. doi: 10.1016/j.jim.2016.11.006. [DOI] [PMC free article] [PubMed] [Google Scholar]
- 27.Roederer M. Interpretation of cellular proliferation data: avoid the panglossian. Cytometry A. 2011;79:95–101. doi: 10.1002/cyto.a.21010. [DOI] [PubMed] [Google Scholar]
- 28.Moore E, Clavijo PE, Davis R, Cash H, Van Waes C, Kim Y, et al. Established T Cell-Inflamed Tumors Rejected after Adaptive Resistance Was Reversed by Combination STING Activation and PD-1 Pathway Blockade. Cancer Immunol Res. 2016;4:1061–1071. doi: 10.1158/2326-6066.CIR-16-0104. [DOI] [PMC free article] [PubMed] [Google Scholar]
- 29.Ji RR, Chasalow SD, Wang L, Hamid O, Schmidt H, Cogswell J, et al. An immune-active tumor microenvironment favors clinical response to ipilimumab. Cancer Immunol Immunother. 2012;61:1019–31. doi: 10.1007/s00262-011-1172-6. [DOI] [PMC free article] [PubMed] [Google Scholar]
- 30.Snyder A, Makarov V, Merghoub T, Yuan J, Zaretsky JM, Desrichard A, et al. Genetic basis for clinical response to CTLA-4 blockade in melanoma. N Engl J Med. 2014;371:2189–99. doi: 10.1056/NEJMoa1406498. [DOI] [PMC free article] [PubMed] [Google Scholar]
- 31.Sahin E, Haubenwallner S, Kuttke M, Kollmann I, Halfmann A, Dohnal AM, et al. Macrophage PTEN regulates expression and secretion of arginase I modulating innate and adaptive immune responses. J Immunol. 2014;193:1717–27. doi: 10.4049/jimmunol.1302167. [DOI] [PMC free article] [PubMed] [Google Scholar]
- 32.Choi WS, Seo YB, Shin PG, Kim WY, Lee SY, Choi YJ, et al. Veratric acid inhibits iNOS expression through the regulation of PI3K activation and histone acetylation in LPS-stimulated RAW264. 7 cells. Int J Mol Med. 2015;35:202–10. doi: 10.3892/ijmm.2014.1982. [DOI] [PubMed] [Google Scholar]
- 33.Pauleau AL, Rutschman R, Lang R, Pernis A, Watowich SS, Murray PJ. Enhancer-mediated control of macrophage-specific arginase I expression. J Immunol. 2004;172:7565–73. doi: 10.4049/jimmunol.172.12.7565. [DOI] [PubMed] [Google Scholar]
- 34.Dickensheets H, Vazquez N, Sheikh F, Gingras S, Murray PJ, Ryan JJ, et al. Suppressor of cytokine signaling-1 is an IL-4-inducible gene in macrophages and feedback inhibits IL-4 signaling. Genes Immun. 2007;8:21–7. doi: 10.1038/sj.gene.6364352. [DOI] [PubMed] [Google Scholar]
- 35.Kaneda MM, Cappello P, Nguyen AV, Ralainirina N, Hardamon CR, Foubert P, et al. Macrophage PI3Kgamma Drives Pancreatic Ductal Adenocarcinoma Progression. Cancer Discov. 2016;6:870–85. doi: 10.1158/2159-8290.CD-15-1346. [DOI] [PMC free article] [PubMed] [Google Scholar]
- 36.Soond DR, Bjorgo E, Moltu K, Dale VQ, Patton DT, Torgersen KM, et al. PI3K p110delta regulates T-cell cytokine production during primary and secondary immune responses in mice and humans. Blood. 2010;115:2203–13. doi: 10.1182/blood-2009-07-232330. [DOI] [PMC free article] [PubMed] [Google Scholar]
- 37.Younis RH, Han KL, Webb TJ. Human Head and Neck Squamous Cell Carcinoma-Associated Semaphorin 4D Induces Expansion of Myeloid-Derived Suppressor Cells. J Immunol. 2016;196:1419–29. doi: 10.4049/jimmunol.1501293. [DOI] [PMC free article] [PubMed] [Google Scholar]
- 38.Strauss L, Bergmann C, Szczepanski M, Gooding W, Johnson JT, Whiteside TL. A unique subset of CD4+CD25highFoxp3+ T cells secreting interleukin-10 and transforming growth factor-beta1 mediates suppression in the tumor microenvironment. Clin Cancer Res. 2007;13:4345–54. doi: 10.1158/1078-0432.CCR-07-0472. [DOI] [PubMed] [Google Scholar]
- 39.Whiteside TL. Induced regulatory T cells in inhibitory microenvironments created by cancer. Expert Opin Biol Ther. 2014;14:1411–25. doi: 10.1517/14712598.2014.927432. [DOI] [PMC free article] [PubMed] [Google Scholar]
- 40.Liu C, Workman CJ, Vignali DA. Targeting regulatory T cells in tumors. FEBS J. 2016;283:2731–48. doi: 10.1111/febs.13656. [DOI] [PubMed] [Google Scholar]
Associated Data
This section collects any data citations, data availability statements, or supplementary materials included in this article.