

Abstract
Background: There is a need to determine the feasibility of conducting studies of chronic diseases among large cohorts of African patients. One aim of the South African feasibility study was to determine the prevalence of chronic kidney disease (CKD) and its association with cardiovascular disease (CVD) risk factors among school teachers.
Methods: In a cross-sectional survey of 489 teachers we captured data on demographics, CVD risk factors, anthropometry and blood pressure. Serum glucose, creatinine, cholesterol and urine protein/creatinine ratio was measured. Glomerular filtration rate was estimated using the Chronic Kidney Disease Epidemiology Collaboration (CKD-EPI) and the Modification of Diet in Renal Disease study equations.
Results: The mean (± standard deviation) age of the participants was 46.3 ± 8.5 years, with 70.3% being female and 74.6% of mixed ethnicity. The crude prevalence of CKD using the CKD-EPI equation was 6.1% while the age-adjusted prevalence was 6.4% (95% confidence interval 3.2–9.7%). CKD was associated with the presence of diabetes and higher diastolic blood pressures.
Conclusions: In our study population of relatively young, working individuals CKD was common, clinically silent and associated with cardiovascular risk factors. The long-term complications of CKD are serious and expensive to manage and this, therefore, constitutes an important public health problem for South Africa.
Keywords: CKD-EPI equation, diabetes mellitus, epidemiology, hypertension, obesity
Introduction
Chronic non-communicable diseases (CNCDs) account for around 60% of deaths globally with 80% of these deaths occurring in low- and middle-income countries (LMIC) [1]. Chronic kidney disease (CKD) is one of these CNCDs and affects approximately 1 in 10 adults, or over 500 million people worldwide [2–4]. The most important consequences of CKD are end-stage renal disease (ESRD), and a greatly increased risk of cardiovascular disease (CVD) and stroke [5]. Developing countries have insufficient resources to deal with the CKD epidemic and its serious long-term complications.
Given the high costs of treating ESRD, it is not surprising that the provision of dialysis and transplantation services is limited in LMICs and virtually non-existent in many parts of sub-Saharan Africa [6]. However, patients with CKD are more likely to die of CVD than to progress to ESRD as CKD is a strong independent cardiovascular risk factor [7, 8]. Obtaining good data on the burden of CKD is an important first step in tackling this serious public health problem.
In Africa, research funding is heavily skewed in favour of infectious diseases and limited data on CKD and ESRD can be found. This contributes to low awareness among the public, healthcare workers, government and other funders, and may lead to the false perception that CKD and ESRD are not important problems in Africa.
A recent systematic review of CKD in sub-Saharan Africa [9] reported a prevalence of 13.9%, but commented on the dearth of studies of good quality. The Africa/Harvard School of Public Health Partnership for Cohort Research and Training (Africa/HSPH PaCT) is a collaboration between Harvard University and scientists from South Africa, Uganda, Tanzania and Nigeria to address this knowledge gap [10]. Africa/HSPH PaCT aims to investigate chronic diseases among large cohorts and provide training opportunities for African researchers.
As part of a process to assess the feasibility of a large-scale study of CNCDs in South Africa, and to contribute much-needed data on the burden of CKD in African populations, our group conducted a cross-sectional study among teachers in the Western Cape province of South Africa to determine the prevalence of CKD and its association with other CVD risk factors.
Teachers were selected as the study population as we envisaged the larger cohort study including participants from all provinces, all ethnic groups, and from urban as well as rural areas. Teachers met these criteria and, with their relatively stable employment and high degree of literacy, were good candidates for successful long-term follow-up. The California Teachers Study [11] is an example of a successful cohort study involving teachers, which has produced multiple research publications.
The diagnosis of CKD rests on the demonstration of kidney damage (e.g. proteinuria) or low glomerular filtration rate (GFR) for more than 3 months. International guidelines [12] now recommend that the GFR be estimated from serum creatinine concentrations using the Chronic Kidney Disease Epidemiology Collaboration (CKD-EPI) prediction equation [13]. This equation is more accurate than the previously recommended Modification of Diet in Renal Disease (MDRD) study equation.
Materials and methods
Study design and population
We conducted a cross-sectional survey of teachers recruited from primary, secondary and intermediate public schools in the Metro South Education District in Cape Town, South Africa. We included schools employing at least 20 teachers, and excluded teachers who were pregnant or who were likely to retire or relocate within the following 6 months.
Study procedures
After the permission and support of the provincial education authorities was obtained, invitation letters explaining the purpose and procedures of the study were sent to the principals of 111 schools by e-mail, letter or fax during January–March 2011. We followed up on the invitations by e-mail and telephone. If the principal provided permission for a school to participate, packages of consent forms and questionnaires were delivered to the school. Principals were requested to distribute these packages to all their teachers. Teachers enrolled in the study by completing the consent forms and a baseline questionnaire, and returning these in pre-paid envelopes to the study coordination centre. Participation was entirely voluntary; those not willing to participate were requested to provide a reason for this.
Once a number of teachers at a particular school had returned their questionnaires, a team of two to three trained study nurses visited the school to take physical measurements and biologic specimens (blood and urine) according to written standard operating procedures. Teachers who had not previously responded but were willing to enrol during the nurse visits were included after they completed the consent form and questionnaire. Questionnaire and physical measurement data from participants who gave consent for this but who were unwilling to provide biological samples were also included in the analyses.
Physical measurements
Weight was determined using a Seca 813 digital floor scale that was calibrated using a weight of known mass. Measurements were recorded to the nearest 0.1 kg with participants wearing minimum clothing and no shoes. Height was recorded in centimetres to the nearest 0.1 cm using a Seca 213 stadiometer, which was placed on a hard, flat, uncarpeted surface. Readings were taken after removing any hair ornamentation and shoes, after inhalation and with the reader’s eye at the level of the head piece. Waist circumference was measured with a non-stretchable Seca 201 tape measure placed against the skin at a horizontal plane at the midpoint between the lowest rib and the iliac crest at the end of a normal expiration and recorded to the nearest 0.1 cm. The body mass index (BMI) was calculated as weight (in kilograms) per square metre; obesity was defined as BMI ≥30 kg/m2. Measurements were performed in duplicate and the average used for analyses.
Blood pressure (BP) was measured after resting for 5 min. Readings were taken at 1 min intervals with the back supported and the feet on the ground using an Omron 705CP-II automatic blood pressure monitor with appropriate cuff sizes. The average of two readings was taken to reflect the participant’s blood pressure. A third reading was taken if there was a difference of >5 mmHg between the readings and the average of the second and third readings was then taken to reflect the blood pressure. Hypertension was defined as being on treatment for hypertension, or by a systolic BP ≥140 mmHg or diastolic BP ≥ 90 mmHg, according to the JNC 7 classification [14].
Biological specimens
Non-fasting blood samples were taken to determine serum creatinine, glucose and total cholesterol concentrations. Spot urine samples were collected in 50-mL screw-top plastic jars for determination of urine protein/creatinine ratio (UPCR). Samples were collected in daily batches and transported on ice to be processed by a single, internationally accredited laboratory. Serum and urine creatinine concentrations were determined using a kinetic colorimetric assay based on the Jaffe reaction and proteinuria was quantified using an immunoturbidimetric method. The creatinine assay was calibrated to the isotope-dilution mass spectrometry (IDMS) reference method. Total cholesterol was measured using an enzymatic colorimetric method and blood glucose using an enzymatic hexokinase method. These tests were performed on a Roche/Hitachi Cobas® c 501 system.
Estimated GFR (eGFR) was calculated using the CKD-EPI [15] and the re-expressed four-variable MDRD equations without any adjustment for black ethnicity. Both equations use standardized creatinine [13]. Patients are then classified according to the National Kidney Foundation Kidney Disease Outcomes Quality Initiatives (NKF KDOQI) CKD classification [16]. The MDRD equation is still the most widely used, but it systematically underestimates GFR at higher values. The CKD-EPI equation was developed as a response to this limitation [13] and is now recommended as the preferred GFR prediction equation [15]. We report GFR based on both of these commonly used equations as neither has yet been validated in our local population. We defined CKD as proteinuria ≥0.30 mg/mg or a GFR <60 mL/min/1.73 m2, or self-reported structural abnormalities of the kidneys. Diabetes was defined as a random blood glucose ≥11.1 mmol/L or a history of diabetes or the use of anti-diabetic medications. Dyslipidaemia was defined as a total cholesterol >5.2 mmol/L or high density lipoprotein (HDL) cholesterol <1.0 mmol/L in males and <1.3 mmol/L in females. Metabolic syndrome was defined as three or more of the following according to the Revised National Cholesterol Education Programme-Adult Treatment Panel III (R-ATPIII) definition: waist circumference >102 cm in males or >88 cm in females, systolic BP ≥130 mmHg or diastolic BP ≥85 mmHg, or being on treatment for previously diagnosed hypertension, presence of diabetes and presence of dyslipidaemia.
Participants received feedback on their blood pressure and laboratory results by personalized SMS or e-mail, according to their stated preference, and were advised to see their usual physicians for readings outside the normal range.
Statistical analysis
Data were analysed with the assistance of the Centre for Statistical Consultation at Stellenbosch University. Continuous variables are reported as means ± standard deviations, or medians and interquartile ranges (IQR), whereas categorical data are reported as numbers and percentages. The crude CKD prevalence was age-adjusted using the distribution of the adult age categories (20 years and older, in 10-year intervals) of the WHO World Standard Population [17]. Exploratory analysis to examine the association between potential risk factors and the presence of CKD was performed using the t-test and the Wilcoxon rank sum test, where data were not normally distributed. Logistic regression was used to calculate odds ratios (ORs). For categorical variables, the chi-squared test was used and Fisher’s exact test when the numbers were small. Baptista–Pike mid-p confidence intervals (CIs) were calculated for the ORs of the categorical variables. The significant variables as well as those expected to be associated with CKD were then entered into a logistic regression model. Statistical analyses were done using Stata 13 (StataCorp 2013) with the significance level set at 0.05.
Ethics
Ethics approval was obtained from the Health Research Ethics Committee of Stellenbosch University (project number: N10/05/172) and the Harvard School of Public Health IRB (protocol number: P19431-104).
Results
Response rates
Following three rounds of invitation, permission was obtained from 59 principals of the 111 schools approached (53.2%). A total of 1779 document packs were distributed and 489 teachers were enrolled into the study (Figure 1). An additional 43 teachers responded that they were unwilling to participate, indicating that they were either too busy, not interested or that the information being requested was of too personal a nature. There were 17 included participants who completed a questionnaire but did not provide blood or urine samples.
Fig. 1.
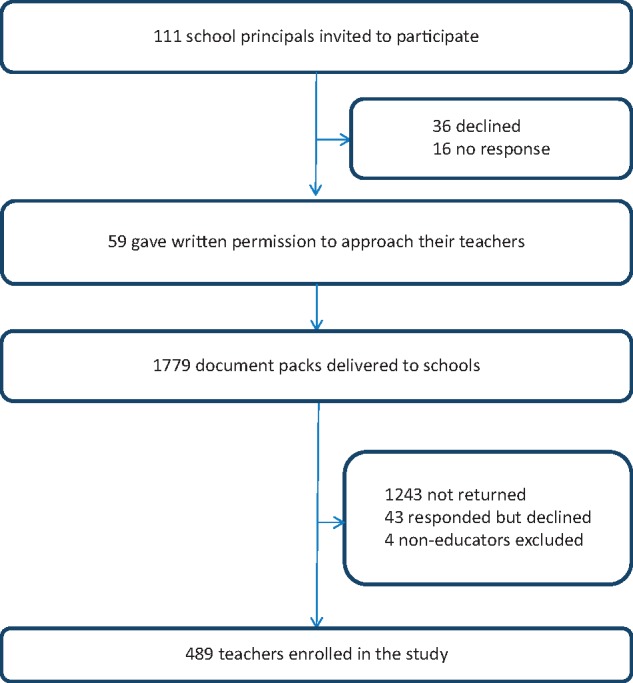
Study flow diagram.
Demographic characteristics of participants
As shown in Table 1, 70.3% of the participants were female and 74.6% were of mixed ethnicity. The mean age was 46.3 ± 8.5 years.
Table 1.
Baseline characteristics of study participants
| Characteristic | n | Value |
|---|---|---|
| Demographics | ||
| Age (years) | 486 | 46.3 ± 8.5 |
| Gender | 489 | |
| Female | 344 (70.3) | |
| Male | 145 (29.7) | |
| Ethnicity | 461 | |
| Mixed ethnicity | 344 (74.6) | |
| Black | 75 (16.3) | |
| White | 35 (7.6) | |
| Indian/Asian | 7 (1.5) | |
| Measures of renal function and CKD | ||
| Serum creatinine (µmol/L) | 455 | 74 ± 17 |
| eGFR-CKD-EPI (mL/min/1.73 m2) | 452 | 92 ± 16 |
| eGFR-MDRD (mL/min/1.73 m2) | 452 | 84 ± 17 |
| UPCR (mg/mg) | 470 | 0.07 (0.05–0.10) |
| Low eGFR-CKD-EPI | 452 | 8 (1.8) |
| Low eGFR-MDRD | 452 | 27 (6.0) |
| Proteinuria ≥0.30 mg/mg | 470 | 21 (4.5) |
| CKD (eGFR by CKD-EPI) | 472 | 29 (6.1) |
| CKD (eGFR by MDRD) | 472 | 47 (10.0) |
Data expressed as mean ± standard deviation, median (IQR) or as number (percentage). CKD is defined by the presence of a UPCR ≥0.30 mg/mg or a low eGFR of <60 mL/min/1.73 m2 or self-reported structural abnormalities of the kidneys.
Clinical and laboratory data
The mean BMI was in the obese range at 31.6 ± 7.0 kg/m2, with mean waist circumference 98.1 ± 12.9 cm and 95.0 ± 14.4 cm for males and females, respectively. Mean systolic BP was 134.2 ± 18.4 mmHg and diastolic BP 79.4 ± 10.8 mmHg. The mean blood glucose, total serum cholesterol and HDL cholesterol levels were 5.6 ± 2.0 mmol/L, 5.4 ± 1.1 mmol/L and 1.4 ± 0.4 mmol/L, respectively. All the participants who provided information on their HIV status (n = 340) indicated that they were HIV-negative.
Mean serum creatinine was 90 ± 14 μmol/L for males and 67 ± 12 μmol/L for females, with the mean eGFR by the CKD-EPI equation being 88 ± 15 mL/min/1.73 m2 and 94 ± 16 mL/min/1.73 m2, respectively (P < 0.001). Using the MDRD equation, the mean eGFR was 81 ± 15 mL/min/1.73 m2 and 85 ± 17 mL/min/1.73 m2, respectively (P = 0.017). White participants had lower mean eGFR values compared with participants from other ethnic groups (76 ± 17 mL/min/1.73 m2 and 84 ± 16 mL/min/1.73 m2, respectively, P = 0.003). Lower eGFR was also associated with increasing age (P < 0.001). The presence of hypertension was associated with lower GFR on univariate analysis (P = 0.038), but there was no significant association on multivariate analysis where the model included age, gender and ethnicity.
Median UPCR was 0.07 mg/mg (IQR 0.05–0.10 mg/mg). On multiple linear regression, protein excretion assessed by UPCR as a continuous variable was increased in female participants (P < 0.032), those with higher blood glucose concentrations (P < 0.001) and higher systolic BPs (P = 0.019), and those with a personal (P < 0.001) or family history (P = 0.025) of kidney disease.
Prevalence of CKD
Participants were considered to have CKD if they had a low eGFR by the CKD-EPI equation, or proteinuria. An additional participant, who reported having had a previous nephrectomy, was also classified as having CKD. The overall crude prevalence of CKD was 6.1% (29 of 472 participants). Only two of these participants reported a previous history of kidney disease. When the MDRD equation was used to estimate GFR, the crude prevalence was 10.0% (47 of 472 participants). The age-adjusted prevalence of CKD was 6.4% (95% CI 3.2–9.7%).
The prevalence of low eGFR <60 mL/min/1.73 m2 was 1.8% (8/452 participants) by the CKD-EPI equation and 6.0% (27/452) using the MDRD equation. Significant proteinuria (UPCR ≥0.30 mg/mg) was found in 4.5% (21/470) of participants; one participant with proteinuria had a low eGFR by the CKD-EPI equation and two had a low eGFR by the MDRD equation. No participant had an eGFR below 30 mL/min/1.73 m2.
Association of CKD with CVD risk factors
The association of CKD with potential risk factors is summarized in Table 2. On this univariate analysis, CKD was significantly associated with the presence of diabetes (P = 0.030), abdominal obesity (P = 0.046) and higher diastolic BPs (P = 0.032).
Table 2.
Comparison of potential risk factors between participants with and without CKD
| Characteristic | CKD | No CKD | P | OR | (95% CI) |
|---|---|---|---|---|---|
| Age (years) | 47.3 ± 9.1 | 46.4 ± 8.4 | 0.677 | 1.01 | (0.97–1.06) |
| Male | 7 (24.1) | 133 (30.0) | 0.501 | 1.35 | (0.58–3.42) |
| Ethnicity | |||||
| Black | 4 (14.3) | 68 (16.3) | 1.000 | 1.17 | (0.42–3.20) |
| Mixed ethnicity | 21 (75) | 311 (74.4) | 0.944 | 1.03 | (0.43–2.66) |
| Indian/Asian | 0 (0) | 7 (1.7) | 1.000 | 0.00 | (0.00–8.67) |
| White | 3 (10.7) | 32 (7.7) | 0.474 | 1.45 | (0.44–4.58) |
| Diabetic | 6 (20.7) | 38 (8.6) | 0.030 | 2.78 | (1.10–6.87) |
| Hypertensive | 16 (55.2) | 210 (47.6) | 0.430 | 1.35 | (0.64–2.77) |
| Current smoker | 2 (7.7) | 79 (19.2) | 0.194 | 0.35 | (0.08–1.33) |
| History of kidney disease | 2 (9.5) | 7 (2.4) | 0.113 | 4.36 | (0.86–22.53) |
| History of high cholesterol | 8 (36.4) | 87 (29.4) | 0.491 | 1.37 | (0.58–3.40) |
| History of CVD/stroke | 4 (15.4) | 29 (8.1) | 0.262 | 2.08 | (0.73–5.88) |
| Family history of kidney disease | 3 (10.3) | 34 (8.5) | 0.728 | 1.25 | (0.38–3.90) |
| Family history of diabetes | 13 (46.4) | 210 (52.8) | 0.516 | 0.78 | (0.37–1.71) |
| Family history of CVD/stroke | 15 (51.7) | 224 (54.8) | 0.728 | 0.89 | (0.41–1.95) |
| Family history of hypertension | 19 (67.9) | 261 (63.0) | 0.609 | 1.24 | (0.56–2.89) |
| Abdominal obesity | 23 (79.3) | 268 (60.8) | 0.046 | 2.48 | (1.01–5.87) |
| BMI | 34.0 ± 8.4 | 31.5 ± 6.9 | 0.213 | 1.04 | (1.00–1.09) |
| Diastolic BP | 83 ± 11 | 79 ± 11 | 0.032 | 1.03 | (1.00–1.07) |
| Systolic BP | 141 ± 24 | 134 ± 18 | 0.117 | 1.02 | (1.00–1.04) |
| Total cholesterol | 5.5 ± 1.1 | 5.4 ± 1.1 | 0.697 | 1.13 | (0.78–1.63) |
| HDL | 1.5 ± 0.4 | 1.4 ± 0.4 | 0.452 | 1.39 | (0.53–3.61) |
| Low HDL | 7 (27.0) | 130 (30.3) | 0.715 | 0.85 | (0.33–2.08) |
| Metabolic syndrome | 4 (15.4) | 80 (18.7) | 0.800 | 0.79 | (0.29–2.24) |
Unadjusted (univariate) analysis. Data expressed as mean ± standard deviation or as number (percentage). There were 29 participants with CKD and 443 without CKD. Those with CKD were more likely to have diabetes, abdominal obesity and higher diastolic BPs. CKD was defined by the presence of UPCR ≥0.30 mg/mg or low eGFR of <60 mL/min/1.73 m2. Abdominal obesity was defined by a waist circumference ≥102 cm for men and ≥88 cm for women. Low HDL was defined as <1.0 mmol/L in males and <1.3 mmol/L in females. Metabolic syndrome was defined according to the R-ATPIII definition.
On multiple logistic regression analysis, diabetes and higher diastolic BPs were significantly associated with the presence of CKD (Table 3).
Table 3.
Multiple logistic regression analysis of risk factors associated with CKD
| Characteristic | OR | (95% CI) | P |
|---|---|---|---|
| Age (years) | 0.97 | (0.93–1.03) | 0.447 |
| Male | 2.21 | (0.74–11.91) | 0.169 |
| White ethnicity | 2.96 | (0.74–11.91) | 0.127 |
| Diabetic | 10.09 | (1.61–63.20) | 0.014 |
| Current smoker | 0.46 | (0.10–2.12) | 0.321 |
| DBP (mmHg) | 1.05 | (1.01–1.10) | 0.011 |
| Metabolic syndrome | 0.17 | (0.03–1.17) | 0.073 |
Adjusted (multivariate) analysis. There was an independent association of CKD with diabetes and higher diastolic BPs. CKD was defined by the presence of UPCR ≥0.30 mg/mg or low eGFR of <60 mL/min/1.73 m2. Metabolic syndrome was defined according to the R-ATPIII definition.
Discussion
The crude prevalence of CKD in our study population was 6.1%, with an age-adjusted prevalence of 6.4%. Low eGFR and proteinuria were present in 1.8% and 4.5% of participants, respectively. This is a substantial burden of disease in a relatively young, working population. Our participants also had a very high prevalence of other CVD risk factors. CKD was associated with the presence of diabetes, abdominal obesity and higher diastolic BP. The association of CKD with CVD risk factors is in line with reports from other population-based studies [18, 19].
There have been few population-based CKD prevalence studies from Africa, with most published research focused on the screening of high risk populations or hospital-based patients. Sumaili et al. [18] reported an overall CKD prevalence of 12.4% in the city of Kinshasa, Democratic Republic of Congo, with the prevalence of proteinuria (5%) being similar to that in our study. A study by Eastwood et al. from the Ashanti region of Ghana [20] compared different methods of estimating renal function. The MDRD equation yielded a CKD prevalence (based on eGFR <60 mL/min/1.73 m2; proteinuria was not assessed) of 1.6%, and 7.4% if omitting the correction factor for black ethnicity. The CKD-EPI equation yielded a prevalence of 1.7%, and 4.7% without correction for black ethnicity. Benghanem Gharbi et al. [21] have just published their report on the MAREMAR study, a CKD screening and prevention programme in Morocco. The study is especially noteworthy for the large number of participants, the use of random sampling and the demonstration of the chronicity of proteinuria, haematuria and low GFR for the diagnosis of CKD. They reported an overall CKD prevalence of 5.1% and highlighted the problem of under-diagnosing CKD in young people with GFR above the threshold of 60 mL/min/1.73 m2 but below the third percentile for age and sex. The article also points out the over-diagnosis of CKD in older people who have GFR values just below the threshold but no other evidence of kidney damage.
The South African study by Matsha et al. [19] determined the prevalence of CKD in a mixed-ethnicity community in the city of Cape Town. They found a CKD prevalence of 23.9% by the MDRD equation and 17.3% by the CKD-EPI equation. These surprisingly high prevalence estimates are among the highest reported in unselected populations in Africa. Their cohort was community based, with a very high burden of hypertension, diabetes, obesity and smoking. In comparison, the participants in our study were younger, working individuals with a lower prevalence of diabetes (9.3 versus 26.4%) and smoking (18.7 versus 40.5%), and with a mean age which was lower by 6.6 years.
In the systematic review of Zhang et al. [4], the CKD prevalence increased with age, gender and ethnicity. It also varied strongly with the eGFR equation used. Most studies used the MDRD equation, and these reported lower prevalences than studies using the Cockcroft-Gault formula.
The diagnosis and effective treatment of the early stages of CKD is especially important in Africa and other low-resource environments because the options for treating the late complications such as ESRD are very limited or non-existent. This is in contrast to higher-income countries where dialysis or transplantation is available to most patients who require these expensive therapies. Screening programmes aimed at individuals at higher risk of developing CKD (those with diabetes, hypertension, HIV, people over 50 years of age, etc.) are, therefore, essential.
Clearly, the choice of method to assess GFR is critical and can have a major impact on the classification of an individual as having CKD or not, on the stage of CKD and on the reported population prevalence. The commonly used prediction equations need to be validated in local populations against gold standard methods. Two African studies, both from South Africa, have compared prediction equations with GFR measured by nuclear medicine methods. Van Deventer et al. [22] reported better performance of the MDRD equation in South Africans of African origin when the correction factor for black ethnicity was not used. Madala et al. [23] also concluded that the MDRD equation should be used without the correction factor, and suggested that a new correction factor, or a new equation, is needed for South Africans of Indian origin.
Recent international guidelines [15], and also those of the South African Renal Society [24], now recommend the use of the CKD-EPI equation for estimating GFR. The CKD-EPI equation is more accurate and less biased at higher (near-normal) GFR values [13]. It results in a lower prevalence estimate of CKD and more accurate risk prediction for adverse outcomes compared with the MDRD equation [25]. We support the use of the CKD-EPI equation for population studies where most participants would be expected to have normal or near-normal GFR. However, as neither the CKD-EPI nor the MDRD equation has been validated in our mixed-ethnicity population, we have reported the results for both equations.
While current guidelines use a universal GFR threshold of 60 mL/min/1.73 m2 for the diagnosis of CKD, this may not be appropriate in all cases. Pottel et al. [26] have suggested that a cut-off of 75 mL/min/1.73 m2 be used for children and young adults as they may have low GFR values, below the third percentile for age and sex, but still above 60 mL/min/1.73 m2. At the other end of the age spectrum, there have been calls for caution in labelling older patients as having CKD if they have mild, stable reductions in GFR (between 45 and 60 mL/min/1.73 m2) without any other evidence of kidney damage or systemic disease [27].
Our study has several limitations. The recruitment was challenging, and the sample size is relatively small. Schools from the Metro South Education District of Cape Town were invited to participate and the teachers from these schools may not be representative of all teachers in the province or in the country. After agreeing to their schools’ participation, principals distributed document packages with informed consent and questionnaires to their teachers. The exact number of teachers invited, and hence the true response rate, could therefore not be ascertained. We have no data on the characteristics of those teachers who declined to participate and cannot say whether they differed in important ways from our participants.
Another limitation concerns the diagnosis of CKD, which requires the presence of abnormal kidney structure or function for >3 months [15]. In common with many cross-sectional epidemiologic studies like the NHANES [28] and other studies, our study did not include repeat estimates of GFR or protein excretion. In the absence of an acute illness likely to cause acute kidney injury, people with abnormal kidney function or damage may be inferred to have CKD, although repeat ascertainment is recommended for accurate diagnosis [15] and will often result in lower estimates for CKD prevalence [21]. Creatinine was measured using an assay based on the Jaffe reaction, which is more susceptible to interferences than the enzymatic method. The assay was, however, calibrated to the IDMS reference method. While the CKD-EPI equation is recommended for estimating GFR, any prediction equation should ideally be validated against gold standard methods and that still needs to be done in our local population.
For logistic reasons, fasting blood samples could not be obtained, which may have led to misclassification of diabetes and dyslipidaemia. Our study cohort consisted mainly of female participants, reflecting the gender distribution in the teaching profession. In the Western Cape province, 70.5% of teachers are female while country-wide the proportion is 69.4% [29]. In terms of ethnicity, they were not representative of the national population (79.2% Black African and 8.9% individuals of mixed ethnicity), but more closely approximated the ethnic distribution of the population of the Western Cape province (48.8% mixed ethnicity, 32.8% Black, 15.7% White) [30]. The only other population study of CKD in South Africa [19] involved a cohort comprising only individuals of mixed ancestry. The role of the healthy worker effect in the cohort studied may be significant, and would lead to under-estimation of the true CKD prevalence.
Regarding the planning of future studies, there are two issues that should be highlighted. First, it would be important to establish which GFR prediction equation would be most appropriate for the diagnosis and staging of CKD in our setting. A study comparing GFR estimated by the MDRD and CKD-EPI equations with GFR measured from the plasma clearance of 99mTc-DTPA is currently under way at our institution. Most of the participants in this study will be of mixed ethnicity. It would also be very useful to have the data from the studies by Van Deventer et al. [22] and Madala et al. [23] re-analysed to include the CKD-EPI equation. A second issue is related to our recruitment methods. These need to be reconsidered if many participants have to be recruited rapidly for a large cohort study. We found that school principals acted as gatekeepers and that we recruited the most participants from schools where the principals themselves were enrolled. Further pilot studies would be necessary to find the most efficient recruitment strategy. We will need to explore ways of getting more support from school principals and also explore ways of approaching and enrolling teachers directly, perhaps with the help of the provincial education department and the teacher trade unions.
In conclusion, CKD is a common and often under-diagnosed condition. The prevalence found in this relatively young cohort—which likely underestimates the population prevalence—suggests that it represents a serious public health problem in South Africa in view of the serious long-term complications and their associated costs. Early detection and management of CKD with the aim of retarding progression and reducing the incidence of both ESRD and CVD mortality is required. The diagnosis of CKD requires reliable estimates of GFR; it is therefore essential to conduct studies in our local populations, which validate the commonly used prediction equations against gold standard methods.
Acknowledgements
We would like to acknowledge the primary collaborators of the Africa/Harvard School of Public Health Partnership for Cohort Research and Training (Africa/HSPH PaCT) for their efforts in initiating, carrying out and coordinating the larger study: Clement Adebamowo (Nigeria site), Marina Njelekela (Tanzania site), David Guwatudde (Makerere, Uganda site), Francis Bajunirwe (Mbarara, Uganda site) and Hans-Olov Adami, Shona Dalal, Michelle Holmes and Todd Reid (HSPH coordinating centre). For this study, we gratefully acknowledge the guidance of our colleagues on the PaCT Steering Committee of Stellenbosch University, namely, Rajiv Erasmus, Robert Mash, Layla Asmal, Moleen Zunza, Soraya Bardien-Kruger, Celeste Naude and Tonya Esterhuizen.
Funding for the project was provided by the Dean’s Office and the Department of Nutrition at the Harvard School of Public Health, the International Society of Nephrology’s Global Outreach (ISN GO), Clinical Research and Prevention Program and the Faculty of Medicine and Health Sciences at Stellenbosch University.
We thank Justin Harvey of Stellenbosch University’s Centre for Statistical Consultation for assistance with data analysis, and Michelle Holmes and Shona Dalal for their critical review of the manuscript.
Conflict of interest statement
None declared.
References
- 1. Preventing chronic diseases: a vital investment. WHO Global Report. Geneva: World Health Organisation, 2005 [Google Scholar]
- 2. Atlas of chronic kidney disease and end-stage renal disease in the United States. USRDS 2013 Annual Data Report. Bethesda, MD: National Institutes of Health, National Institute of Diabetes and Digestive and Kidney Diseases, 2013 [Google Scholar]
- 3. Meguid El Nahas A, Bello AK.. Chronic kidney disease: the global challenge. Lancet 2005; 365: 331–340 [DOI] [PubMed] [Google Scholar]
- 4. Zhang QL, Rothenbacher D.. Prevalence of chronic kidney disease in population-based studies: systematic review. BMC Public Health 2008; 8: 117. [DOI] [PMC free article] [PubMed] [Google Scholar]
- 5. Go AS, Chertow GM, Fan D. et al. Chronic kidney disease and the risks of death, cardiovascular events, and hospitalization. N Engl J Med 2004; 351: 1296–1305 [DOI] [PubMed] [Google Scholar]
- 6. Grassmann A, Gioberge S, Moeller S. et al. ESRD patients in 2004: global overview of patient numbers, treatment modalities and associated trends. Nephrol Dial Transplant 2005; 20: 2587–2593 [DOI] [PubMed] [Google Scholar]
- 7. Sarnak MJ, Levey AS, Schoolwerth AC. et al. Kidney disease as a risk factor for development of cardiovascular disease: a statement from the American Heart Association Councils on Kidney in Cardiovascular Disease, High Blood Pressure Research, Clinical Cardiology, and Epidemiology and Prevention. Circulation 2003; 108: 2154–2169 [DOI] [PubMed] [Google Scholar]
- 8. Tonelli M, Wiebe N, Culleton B. et al. Chronic kidney disease and mortality risk: a systematic review. J Am Soc Nephrol 2006; 17: 2034–2047 [DOI] [PubMed] [Google Scholar]
- 9. Stanifer JW, Jing B, Tolan S. et al. The epidemiology of chronic kidney disease in sub-Saharan Africa: a systematic review and meta-analysis. Lancet Glob Health 2014; 2: e174–e181 [DOI] [PubMed] [Google Scholar]
- 10. Holmes MD, Dalal S, Volmink J. et al. Non-communicable diseases in sub-Saharan Africa: the case for cohort studies. PLoS Med 2010; 7: e1000244. [DOI] [PMC free article] [PubMed] [Google Scholar]
- 11. Horn-Ross PL, Hoggatt K, West DW. et al. Recent diet and breast cancer risk: the California Teachers Study (USA). Cancer Causes Control 2002; 13: 407–415 [DOI] [PubMed] [Google Scholar]
- 12. Levin A, Stevens PE.. Summary of KDIGO 2012 CKD Guideline: behind the scenes, need for guidance, and a framework for moving forward. Kidney Int 2014; 85: 49–61 [DOI] [PubMed] [Google Scholar]
- 13. Levey AS, Stevens LA, Schmid CH. et al. A new equation to estimate glomerular filtration rate. Ann Intern Med 2009; 150: 604–612 [DOI] [PMC free article] [PubMed] [Google Scholar]
- 14. Chobanian AV, Bakris GL, Black HR. et al. The Seventh Report of the Joint National Committee on Prevention, Detection, Evaluation, and Treatment of High Blood Pressure: the JNC 7 report. JAMA 2003; 289: 2560–2572 [DOI] [PubMed] [Google Scholar]
- 15. Eknoyan G, Lameire N.. KDIGO 2012 clinical practice guideline for the evaluation and management of chronic kidney disease. Kidney Int Suppl 2013; 3: 1–150 [DOI] [PubMed] [Google Scholar]
- 16. Hallan SI, Orth SR.. The conundrum of chronic kidney disease classification and end-stage renal risk prediction in the elderly–what is the right approach? Nephron Clin Pract 2010; 116: c307–c316 [DOI] [PubMed] [Google Scholar]
- 17. Ahmad OB, Boschi-Pinto C, Lopez AD. et al. Age Standardization of Rates: A New Who Standard. GPE Discussion Paper Series. Geneva: World Health Organization, 2001 [Google Scholar]
- 18. Sumaili EK, Krzesinski JM, Zinga CV. et al. Prevalence of chronic kidney disease in Kinshasa: results of a pilot study from the Democratic Republic of Congo. Nephrol Dial Transplant 2009; 24: 117–122 [DOI] [PubMed] [Google Scholar]
- 19. Matsha TE, Yako YY, Rensburg MA. et al. Chronic kidney diseases in mixed ancestry South African populations: prevalence, determinants and concordance between kidney function estimators. BMC Nephrol 2013; 14: 75. [DOI] [PMC free article] [PubMed] [Google Scholar]
- 20. Eastwood JB, Kerry SM, Plange-Rhule J. et al. Assessment of GFR by four methods in adults in Ashanti, Ghana: the need for an eGFR equation for lean African populations. Nephrol Dial Transplant 2010; 25: 2178–2187 [DOI] [PMC free article] [PubMed] [Google Scholar]
- 21. Benghanem Gharbi M, Elseviers M, Zamd M. et al. Chronic kidney disease, hypertension, diabetes, and obesity in the adult population of Morocco: how to avoid ‘over’- and ‘under’-diagnosis of CKD. Kidney Int 2016; 89: 1363–1371 [DOI] [PubMed] [Google Scholar]
- 22. van Deventer HE, George JA, Paiker JE. et al. Estimating glomerular filtration rate in black South Africans by use of the Modification of Diet in Renal Disease and Cockcroft-Gault equations. Clin Chem 2008; 54: 1197–1202 [DOI] [PubMed] [Google Scholar]
- 23. Madala ND, Nkwanyana N, Dubula T. et al. Predictive performance of eGFR equations in South Africans of African and Indian ancestry compared with 99mTc-DTPA imaging. Int Urol Nephrol 2012; 44: 847–855 [DOI] [PubMed] [Google Scholar]
- 24. Paget G, Naicker S, Assounga A. et al. Guideline for the Optimal Care of Patients on Chronic Dialysis in South Africa. Cape Town: South African Renal Society, 2015. [Google Scholar]
- 25. Levey AS, Stevens LA.. Estimating GFR using the CKD Epidemiology Collaboration (CKD-EPI) creatinine equation: more accurate GFR estimates, lower CKD prevalence estimates, and better risk predictions. Am J Kidney Dis 2010; 55: 622–627 [DOI] [PMC free article] [PubMed] [Google Scholar]
- 26. Pottel H, Hoste L, Delanaye P.. Abnormal glomerular filtration rate in children, adolescents and young adults starts below 75 mL/min/1.73 m2. Pediatr Nephrol 2015; 30: 821–828 [DOI] [PubMed] [Google Scholar]
- 27. Glassock RJ. Con: Thresholds to define chronic kidney disease should not be age dependent. Nephrol Dial Transplant 2014; 29: 774–779 [DOI] [PubMed] [Google Scholar]
- 28. Murphy D, McCulloch CE, Lin F. et al. Trends in prevalence of chronic kidney disease in the United States. Ann Intern Med 2016; 165: 473–481 [DOI] [PMC free article] [PubMed] [Google Scholar]
- 29. Education Statistics in South Africa 2014. Pretoria: Department of Basic Education, 2016 [Google Scholar]
- 30. Census 2011 Provincial Profile: Western Cape. Pretoria: Statistics South Africa, 2014 [Google Scholar]