

SUMMARY
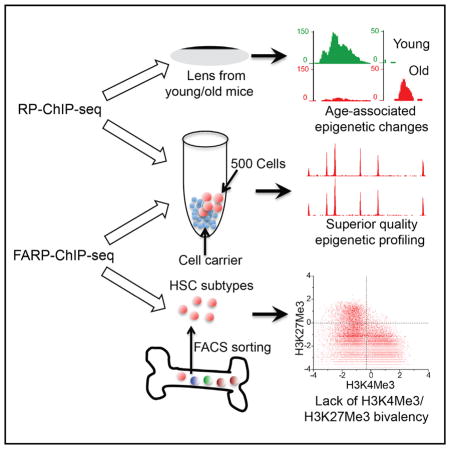
Understanding how chromatin modification regulates development and disease can be limited by available material. Despite recent progress, balancing high-quality and reliable mapping using chromatin-immunoprecipitation-based deep sequencing (ChIP-seq) remains a challenge. We report two techniques, recovery via protection (RP)-ChIP-seq and favored amplification RP-ChIP-seq (FARP-ChIP-seq), that provide reproducible mapping in as few as 500 cells. RP-ChIP-seq allows detection of age-associated epigenetic changes in a single mouse lens, whereas FARP-ChIP-seq accurately maps histone H3 lysine 4 trimethylation (H3K4me3) and H3K27me3 in long-term hematopoietic stem cells (LT-HSCs), short-term HSCs (ST-HSCs), and multi-potent progenitors (MPPs) from one mouse. These datasets not only highlight genes that may be involved in lens aging but also indicate a lack of H3K4me3/H3K27me3 bivalency on hematopoietic genes in HSCs.
In Brief
Zheng et al. develop two profiling methods, RP-ChIP-seq and FARP-ChIP-seq, that can be used for as few as 500 cells. Application of the technique reveals age-associated changes in the mouse lens and a lack of H3K4me3/H3K27me3 bivalency on hematopoietic genes in mouse HSCs.
INTRODUCTION
Mapping of epigenome modifications or chromatin regulator/ transcription factor binding in a pure cell population is critical for basic and translational research. The ability to map epigenome changes in a cell population during development can shed light on the steps by which different cell lineages establish their transcriptional programs. Mapping the epigenome in a few cells isolated from diseased or healthy tissues may allow the discovery of specific disease-associated changes. Unfortunately, because chromatin immunoprecipitation sequencing (ChIP-seq) requires multi-step manipulations, DNA loss due to irreversible absorption or degradation has made it difficult to reliably obtain high-quality mapping in only a few cells (Park, 2009).
ChIP-seq using standard methods requires nanograms of DNA, and ≤106 cells are needed for reliable and high-quality ChIP-seq (Park, 2009). Various strategies have been developed to reduce the cell number needed. One method is to amplify the cells derived from tissues in vitro. Although this is applicable for progenitor/stem cell populations, it is not useful for dissected post-mitotic cells. Culturing and proliferation in vitro may also change progenitor/stem cells, potentially making the genome-wide studies unrepresentative of cells in vivo. Several methods have been developed to facilitate ChIP-seq using thousands or tens of thousands of cells. One of them relies on increasing DNA amplification cycles (Adli et al., 2010; Ng et al., 2013; Shankaranarayanan et al., 2011, 2012), which may introduce mapping bias, as low-abundance ChIP DNA may be underrepresented or lost. Another method utilizes carrier proteins, chemicals, and/or mRNA during ChIP (Zwart et al., 2013), but the absence of carrier during post-ChIP processing still leads to significant DNA loss, thereby compromising ChIP-seq quality.
A third method, called indexing-first ChIP-seq (iChIP-seq) (Lara-Astiaso et al., 2014), uses barcoding and pooling of multiple samples to study the epigenome in multiple hematopoietic lineages. Although the method reduces DNA loss by sample pooling, relying on sorting of fixed cells and sequential ChIP may still lead to DNA loss. Additionally, the on-bead ligation of adapters to chromatin fragments may reduce efficiency. Indeed, 10,000–20,000 sorted hematopoietic cells were used in these iChIP-seq datasets (Lara-Astiaso et al., 2014). Finally, micrococcal nuclease (MNase)-based native ChIP (ultra-low-input micrococcal nuclease-based native ChIP [ULI-NChIP]) was also used for epigenetic mapping (Brind’Amour et al., 2015). While the quality of ULI-NChIP-seq for some epigenetic modifications is reasonable, other modifications were not mapped, indicating that the loss of ChIP DNA during manipulations may result in variable outcomes. Here, we report a new ChIP-seq method for high-fidelity genome-wide profiling using as few as 500 cells and report its applications.
RESULTS
Recovery via Protection ChIP-Seq for 500 Cells
An effective way to protect DNA from loss during ChIP-seq is to use agents that behave like DNA and co-purify with chromatin or the DNA of interest during ChIP and library building. This would prevent the loss of DNA due to nonspecific irreversible absorption and degradation by residual contaminating DNases. One straightforward means is to use chromatin as a protection agent. Although this would result in the presence of carrier DNA in the sequencing library, the carrier DNA sequences can be easily filtered out computationally after deep sequencing if they do not map to the genome of interest. We compared various genomes with one another, including mouse, human, Drosophila, yeast, and bacteria. We generated artificial reads by scanning the genome using a 50-bp sliding window. Using Bowtie (Langmead et al., 2009) and allowing three mismatches, we mapped the Drosophila sequences to other genomes.
Due to sequence conservation, many short reads derived from the Drosophila genome mapped broadly to mammalian genomes (Figures S1A and S1B), so chromatin from Drosophila and mammalian genomes cannot be used as protection agents for one another. However, very few reads from S. cerevisiae (yeast) and E. coli were mapped to human, mouse, or Drosophila genomes (Figures S1A and S1B). Importantly, over 90% of the few short mapped reads are in rDNA or simple repeat regions of target genomes. Since ~30% of yeast chromatin carries histone H3 lysine 4 trimethylation (H3K4me3) (Figures S1C and S1D), and since commercial antibodies can successfully ChIP H3K4me3 from yeasts to human, as proof of principle, we used yeast chromatin as a carrier in the ChIP-seq of H3K4me3 in a small number of mouse embryonic stem cells (mESCs). We refer to this ChIP-seq as recovery via protection (RP)-ChIP-seq.
We mixed formaldehyde cross-linked yeast (~5 × 10⁷) with either 500 or 2,000 cross-linked mESCs. Following sonication, antibody to H3K4me3 was used to ChIP both the yeast and mESC chromatin using standard ChIP and library-building procedures. The similar patterns of H3K4me3 distribution around the transcriptional start sites (TSS) between the ChIP-seq data-sets from 500 or 2,000 mESCs and the dataset from the standard ChIP-seq of 107 mESCs (Jia et al., 2012) (Figure 1A) show that RP-ChIP-seq successfully mapped H3K4me3 in 500 or 2,000 mESCs. Importantly, increasing read depth resulted in further improvements of RP-ChIP-seq quality as indicated by an increased correlation between RP-ChIP-seq and standard ChIP-seq of 107 cells (Figure 1B). With 2.4 and 1.2 million mapped mouse reads, the correlation coefficient (R) between the standard ChIP-seq of 107 mESCs and RP-ChIP-seq for 2,000 and 500 mESCs reached 0.976 and 0.952, respectively (Figure 1B). Analyses of specific chromatin regions also showed that RP-ChIP-seq uncovered H3K4me3 peaks reliably (Figures 1C and 1D).
Figure 1. RP-ChIP-Seq.

(A) Heatmaps of H3K4me3 5 kb upstream and downstream of TSS in 107, 2,000, or 500 mESCs, rank ordered based on H3K4me3 in 107 mESCs.
(B) Contour plots (Spearman correlation coefficient, R) of H3K4me3 on promoters by RP-ChIP-seq in 500 or 2,000 mESCs at the indicated mouse reads and the standard ChIP-seq in 107 mESCs at 163 million reads.
(C and D) Plots of H3K4me3 peaks on chromosome 17 (C) or the enlarged region boxed in red in C (D) using 500, 2,000, and 107 mESCs. See also Figure S1 and Tables S1 and S2.
Favored Amplification RP-ChIP-Seq Reduces Read Depth and Is Applicable to All Mapping Needs
The RP-ChIP-seq described above effectively preserved the chromatin of interest, but it requires a substantial increase of total reads to obtain sufficient reads of the DNA of interest. It is not universally applicable for ChIP-seq mapping of other epigenomes and transcription-factor binding, since yeast chromatin does not share all epigenetic modifications as animal genomes. We thus used a biotinylated synthetic DNA (biotin-DNA) to replace the yeast chromatin. We designed 210-bp biotin-DNA that does not map to Drosophila, mouse, or human genomes (Figure S1A). Since only a few endogenous biotinylated proteins have been found and none or few of them are associated with chromatin (Jia et al., 2012; Kim et al., 2009; Rybak et al., 2005), by mixing the biotin-DNA with chromatin, it was possible to recovery the biotin-DNA and the chromatin of interest using streptavidin beads and antibody-coupled protein G beads, respectively. To inhibit amplification of biotin-DNA during library building, a PCR amplification blocker oligo complementary to the biotin-DNA was designed to contain phosphorothioate modification of the first three nucleotides at the 5′ end to resist the exonuclease activity of the PCR enzyme while a modified nucleotide carrying 3-carbon spacer at the 3′ end was designed to inhibit extension of the oligonucleotide by PCR (Figure 2A). Indeed, when added at 0.25 μM during library amplification, the blocker oligo reduced the amplification of the biotin-DNA by over 99% (Figure S2A). We refer to this method as favored amplification RP-ChIP-seq (FARP-ChIP-seq).
Figure 2. Favored Amplification RP-ChIP-Seq.

(A) Top: the biotin-DNA carrier annealed to the blocker oligo carrying a 3′ modified 3-carbon spacer and 5′ 3 phosphorothioate modifications (asterisks). Bottom: cells of interest (red) were mixed with bacteria (blue), fixed, washed, and sonicated. Biotin-DNA bound to streptavidin beads and antibody-bound protein G beads were added for ChIP.
(B) FARP-ChIP-seq resulted in increased ratios of mapped mouse reads to total reads.
(C and D) Contour plots (as log2 of the average read density within 2 kb upstream and downstream of TSS. Spearman correlation coefficient, R) between two biological replicates of FARP-ChIP-seq in 500 mESCs (C) or between 500 mESC FARP-ChIP-seq and the 107 mESCs standard ChIP-seq. (E) Enrichment at the indicated genes on chromosome 6 was mapped by the indicated methods.
We mapped H3K4me3 in 500 mESCs using FARP-ChIP-seq. Since H3K4me3 exhibits sharp peaks near promoters, the total chromatin marked by H3K4me3 is lower compared to other histone modifications, which leads to difficulty in library building using low cell numbers. Indeed, the ULI-NChIP method obtained a H3K27me3 library from ~1,000 mESCs but was unsuccessful for H3K4me3 mapping using the same cell number (Brind’Amour et al., 2015). Successful H3K4me3 mapping indicates that our method is also applicable for other histone modifications. To efficiently recover the small number of mESCs and their chromatin, we added ~5 × 10⁸ bacteria as cell carrier to 500 mESCs followed by fixation, wash, and sonication (Figure 2A). After ChIP using biotin-DNA-bound Streptavidin beads and protein G beads coupled to H3K4me3 antibodies, blocker oligos were added during library building (Figure 2A). FARP-ChIP-seq resulted in a ~160-fold increase of mouse genomic DNA reads compared to RP-ChIP-seq at the same read depth for 500 mESCs (Figure 2B; Table S1). The biological replicates were highly consistent (Figure 2C; Table S1). The blocker oligo did not affect the quality of the FARP-ChIP-seq data, because the biological replicates were highly correlated (Spearman correlation coefficient, R) with one another and with the standard ChIP-seq of 107 mESCs (Figures 2C and 2D). The genome browser view also shows a high correlation (Figure 2E). The mapping of H3K27me3 in 1,000 mESCs by FARP-ChIP-seq also showed this method to be highly reliable (Figures S2B and S2C).
RP-ChIP-Seq and FARP-ChIP-Seq Offer Superior Quality Compared to All Reported Methods
Since several ChIP-seq methods for thousands or tens of thousands of cells have been reported, we compared our methods with these methods. For FARP-ChIP-seq, Nano-ChIP-seq, and ULI-NChIP-seq of mESC H3K4me3 in low cell numbers, we used the standard ChIP-seq dataset as a benchmark (Mikkelsen et al., 2007). For LinDA-ChIP-seq of H3K4me3 in H3396 cells or ERα ChIP-seq in MCF7 cells, we used the relevant million-cell dataset reported in the same publications as benchmarks (Shankaranarayanan et al., 2011; Zwart et al., 2013). By comparing the signal-to-noise ratio of different methods defined as the number of reads falling into peak regions called from benchmark data-sets, >40% reads of FARP-ChIP-seq mapped onto peaks similar to the benchmark dataset, whereas all other methods had much lower signal-to-noise ratios compared to their relevant benchmarks (Table S1). Whole-genome correlation analyses using non-overlapping 4-kb windows showed that the correlation coefficients between the two 500-cell H3K4me3 FARP-ChIP-seq data and the benchmark are 0.901 and 0.902, which were much higher than all other methods (Table S1). Thus, our method did not bias the ChIP-seq signals.
A criterion for acceptable replicates adopted by the ENCODE project is that at least 80% of the top 40% targets identified from one ChIP-seq replicate should overlap with the targets of another replicate and vice versa (Landt et al., 2012). We defined this as 80% precision and recall (see Supplemental Experimental Procedures). Our two H3K4me3 FARP-ChIP-seq datasets reached 99% precision and 99% recall for 500 cells when compared to the 106 mESC H3K4me3 dataset (Mikkelsen et al., 2007) (Figure 3A). The best-performing ULI-NChIP-seq reached 99% precision and 92% recall using 5,000 cells, whereas the Nano-ChIP-seq (Adli et al., 2010) for H3K4me3 using 10,000 mESCs achieved only 70% precision and 70% recall (Figure 3A). One of the LinDA-ChIP-seq datasets for 10,000 mESCs reached 80% precision and 80% recall, but its replicate reached only 60% precision and 60% recall (Figure 3A). The ChIP-seq of estrogen receptor α (ERα) in 10,000 MCF7 cells using mRNA and histone carriers (Zwart et al., 2013) achieved only >20% precision and >20% recall when compared to the published ERα ChIP-seq data using 20 million MCF7 cells (Zwart et al., 2011) (Figure 3A). The details of peak numbers and total length of peaks under different peak calling parameters are listed in Table S2.
Figure 3. Comparisons among ChIP-Seq Methods for Low Cell Numbers.

(A) Precision-recall curves for H3K4me3 or ERα peaks mapped by the indicated methods. Percentages of the top 40% peaks mapped by the indicated methods that overlapped with the respective peaks mapped by standard ChIP-seq in ≥106 cells (x axis, precision) or mapped by standard ChIP-seq that overlapped with the respective peaks mapped by the indicated methods (y axis, recall). Curves are drawn by changing the p value threshold used in calling peaks for indicated method.
(B) ROC curve for H3K4me3 comparisons. True-positive rate, the number of true-positive 2-kb regions divided by the number of “true” regions (25,000); false-positive rate, the number of false-positive regions divided by the number of “false” regions.
(C) ROC curve H3K27me3 comparisons. True-positive rate, the number of true-positive 5-kb regions divided by the number of “true” regions (25,000); false-positive rate: the number of false-positive regions divided by the number of “false” regions.
The legend for ROC curves in (B) and (C) are ordered from best to worse AUC (area under curve) values. See also Figure S3 and Tables S1 and S2.
We also used the receiver-operating characteristic (ROC) curve similar to those used in Nano-ChIP-seq (Adli et al., 2010) to compare the H3K4me3 maps obtained by different methods. We divided the genome into 2-kb non-overlapping windows and used the top 25,000 windows with the highest read number in the million-cell ChIP-seq datasets as “True.” By using different cutoffs to calculate the true-positive and false-positive rates, we plotted ROC curves for each method (Figure 3B), which showed that our FARP-ChIP-seq method gave the best performance.
Next, we compared our FARP-ChIP-seq H3K27me3 datasets with the dataset for 1,000 or 10,000 mESCs obtained using the genome-amplification-based method (ChIP-WGA-seq) (Ng et al., 2013). By calculating the correlation coefficient between the ChIP-WGA-seq or FARP-ChIP-seq dataset and the ChIP-seq dataset using 106 mESCs (Ng et al., 2013), we found coefficients of 0.729 (using 1,000 mESCs) and 0.782 (using 10,000 mESCs) for ChIP-WGA-seq (Figure S3), whereas the correlation coefficient for FARP-ChIP-seq was 0.949 using 1,000 mESCs (Figure S2B). Whole-genome correlation analysis using 10-kb non-overlapping windows also showed that FARP-ChIP-seq using 1,000 mESCs exhibits a whole-genome correlation coefficient of 0.890, which is much higher than the correlation coefficient of 0.547 or 0.585 obtained by ChIP-WGA-seq using 1,000 or 10,000 mESCs, respectively. ROC analysis for H3K27me3 datasets using 5-kb windows showed that our FARP-ChIP-seq datasets capture H3K27me3 signals better than ChIP-WGA-seq (Figure 3C).
RP-ChIP-Seq Using One Mouse Lens Reveals Age-Associated Epigenetic Changes
High-fidelity epigenome mapping in non-manipulated disease tissue may identify candidate aging and disease-associated epigenetic changes. Aging of the mammalian lens is associated with cataract development (Li et al., 1995). Although age-associated alterations of the lens epithelial cells contribute to cataracts, the mechanism is not fully understood. Since one adult mouse lens consists of a population of ~10,000 lens epithelial cells, the RP-ChIP-seq method may allow accurate mapping of H3K4me3 using a single dissected lens without having to perform very deep sequencing. Indeed, mapping of H3K4me3 in a single lens dissected from young (30-day-old) or old (>800-day-old) C57/BL6J mice using RP-ChIP-seq produced highly consistent patterns in biological replicates of young and old lenses (Figures 4A and 4B), indicating the robustness of the method.
Figure 4. RP-ChIP-Seq of H3K4me3 in One Dissected Mouse Lens.

(A and B) Contour plots (Spearman correlation coefficient, R) between H3K4me3 on promoters obtained by RP-ChIP-seq in biological replicates of young (A) and old single lens (B).
(C) Genome browser view of the representative top three broadest H3K4me3 peaks in young lens. (D) GO-term analysis of the top broadest H3K4me3 peaks in young lens.
(E) Browser view of Cryaa and Kcnab1 loci exhibiting aging-associated H3K4me3 increase in lens. The bar plot shows the relative H3K4me3 change at the two loci quantified by the normalized number of total reads falling on the promoter peaks.
(F) Browser view of representative aging-associated H3K4me3 changes in lens.
Since a recent report showed that broad H3K4me3 peaks often marks important genes for the identity and function of cells (Benayoun et al., 2014), we used MACS (Zhang et al., 2008) to call peaks from young-lens H3K4me3 maps. The top five broadest peaks of young lens include known transcription factors important for eye development such as Pax6, Six3, and Tfap2a (Figure 4C; Table S3). Gene Ontology (GO)-term analysis of the top 5% broadest peaks showed enrichment of corresponding genes in eye development and functions (Figure 4D; Table S3).
To uncover age-associated changes in lens epithelial cells, we performed a complete comparison of H3K4me3 peaks between young and old lenses and found 613 promoter peaks exhibiting either increase or decrease of H3K4me3 upon aging (fold change > 1.5, FDR < 0.05; see Supplemental Experimental Procedures for details). To test whether the age-associated changes might implicate genes in cataract formation, we searched published cataract-associated SNPs discovered by genome-wide association studies (GWAS). A recent report identified two cataract-associated SNPs in humans in the Cryaa and Kcnab1 loci (Liao et al., 2014). Interestingly, we found that the corresponding mouse gene loci showed a significant increase of H3K4me3 in both peak height and width upon aging (Figure 4E). Further studies of these two genes could shed light on whether their age-associated H3K4me3 changes contribute toward cataract development.
We further analyzed other genes exhibiting age-associated H3K4me3 changes and found many with known or implicated functions in lens development and homeostasis (Figure S4; Table S4). For example, p57Kip2 (encoded by Cdkn1c) is known to inhibit the cell cycle and promote lens epithelial differentiation (Zhang et al., 1997). This gene had higher H3K4me3 in the 30-day-old lens than in the aged lens (Figure 4F). This is consistent with the known requirement of p57Kip2 in supporting lens growth in the young mice (Jia et al., 2007). Since H3K4me3 is highly correlated with gene expression (Jiang et al., 2011), the reduction of H3K4me3 on this gene upon aging suggests that increased p57Kip2 expression may contribute to lens aging and cataract development. Similarly, the reduction of H3K4me3 on Hmga2 gene in aged lens (Figure 4F) suggests that Hmga2 is not efficiently expressed. Interestingly, previous studies show that Hmga2 negatively regulates aging by inhibiting expression of the cell-cycle inhibitor p16Ink4a in neural stem cells (Nishino et al., 2008). Consistently, we found an increase of H3K4me3 on the Ink4a promoter in aged lens (Figure 4F). This suggests that the loss of Hmga2 expression could lead to p16Ink4a upregulation, which could result in cell-cycle arrest and senescence in lens epithelial cells.
Studies in humans suggest that the expression changes of channel genes during aging could disrupt ion homeostasis, which would contribute toward cataract formation (Segev et al., 2005). Consistently, we found a significant enrichment of channel genes with dramatic H3K4me3 loss upon aging (Figure S4C) (p < 0.01, hypergeometric test). One of these genes, Scnn1a (encodes for the sodium channel, non-voltage-gated 1 alpha), has a significant decrease in expression in human cataracts (Hawse et al., 2003; Ruotolo et al., 2003). Additionally, we found significant age-associated H3K4me3 changes in genes involved in various signaling pathways or lens structure (Figure S4D; Table S4). Thus, the H3K4me3 datasets for old and young lens can be used as resources for the further study of eye development and aging.
FARP-ChIP-Seq Offers the Highest-Quality H3K4me3 Map to Date in Hematopoietic Stem Cell Subtypes Sorted from One Mouse
Next, we tested whether FARP-ChIP-seq could accurately map the epigenome of subtypes of hematopoietic stem cells (HSCs) sorted from one mouse. HSCs support lifelong production of all blood cells. Very little is known about genome-wide epigenetic regulation during early hematopoiesis because of the small numbers of cells that can be sorted from bone marrow (BM). For example, only ~0.1% of BM cells are HSCs, which are defined as lineage-negative (lin−: CD3−, CD4−, CD8−, B220−, CD11b−, Gr1−, Nk1.1−, and Ter119−), Sca1-positive (Sca1+), and c-Kit+ (LSK HSCs). The LSK HSCs (~30,000/mouse) consist of three functionally distinct subpopulations: long-term HSCs (LT-HSCs), short-term HSCs (ST-HSCs), and multi-potent progenitors (MPPs), which represent 0.007% (~2,000/mouse), 0.04% (~12,000/mouse), and 0.05% (~15,000/mouse) of total BM cells, respectively (Yang et al., 2005). Three studies have mapped the HSC epigenome. The Nano-ChIP-seq mapped H3K4me3, H3K27me3, and H3K36me3 in 20,000 mixed-population LSK HSCs (Adli et al., 2010). Of the two recent studies, one mapped H3K4me3, H3K27me3, and H3K36me3 in subpopulations of LSK HSCs pooled from many mice using standard ChIP-seq (Sun et al., 2014), while the other mapped H3K4me1, H3K4me2, H3K4me3, and H3K27ac in LT-HSCs, ST-HSCs, and MPPs pooled from six mice ranging from 8 to 12 weeks old using iChIP-seq (Lara-Astiaso et al., 2014).
Assuming that all the reported ChIP-seq qualities are high, the epigenome maps obtained by pooling subpopulations of HSCs from several mice at different ages or using mixed LSK HSCs may not accurately determine the epigenome of LT-HSCs, ST-HSCs, or MPPs. We thus applied FARP-ChIP-seq to map H3K4me3 and H3K27me3 in LT-HSCs, ST-HSCs, or MPPs sorted from individual 8-week-old C57BL/6J mice (see Supplemental Experimental Procedures). To avoid cross contamination of HSC subtypes, we gated stringently during sorting and based on the estimated cell numbers by flow cytometry, ~1,500 LT-HSCs, ~6,000 ST-HSCs, and ~10,000 MPPs could be sorted from one mouse (Figures 5A and 5SA). Since flow cytometry cannot accurately count the relatively rare LT-HSCs and ST-HSCs in one mouse, we developed a method that accurately determined the number of these cells in the input samples for FARP-ChIP-seq to be 800–1,200 LT-HSCs and 1,200–1,500 ST-HSCs (Figures 5B and S5B; also see Supplemental Experimental Procedures). For MPPs, we used one fourth of the total sorted cells for one FARP-ChIP-seq, which corresponded to 2,000–2,500 cells.
Figure 5. FARP-ChIP-Seq of HSC Subtypes.

(A) FACS plots with the markers and gating used for sorting LSK HSCs, LT-HSCs, ST-HSCs, and MPPs.
(B) The number of sorted LT-HSCs and ST-HSCs used in FARP-ChIP-seq determined by low-depth genome sequencing.
(C–E) Contour plots (Spearman coefficient, R) between H3K4me3 on promoters obtained (plotted as log2 of the average read density within 2 kb upstream and downstream of TSS) by FARP-ChIP-seq in two biological replicates of LT-HSCs (C), ST-HSCs (D), and MPPs (E).
(F and G) MDS plot of FARP-ChIP-seq (F) or iChIP-seq (G) H3K4me3 maps in LT-HSCs, ST-HSCs, and MPPs. Distances between biological replicates (−1 and −2) within and between HSC subtypes show the similarities and differences among the datasets. iChIP-seq of LT-HSCs and MPPs have no biological replicate, while the ST-HSCs biological replicates (−1 and −2) do not cluster together.
(H) A summary of FARP-ChIP-seq and iChIP-seq of H3K4me3 in LT-HSCs and ST-HSCs with the cell numbers, antibody sources, and library complexities. (I) Genome browser view of representative iChIP-only H3K4me3 peaks in LT-HSCs that overlap with the iChIP H3K4me3 peaks in B cells but are absent from the FARP-ChIP-seq of LT-HSCs.
We found highly consistent FARP-ChIP-seq maps for H3K4me3 between biological replicates in the three HSC subtypes (Figures 5C–5E). A multi-dimension scaling plot (MDS-plot) showed good clustering of replicates (Figure 5F), indicating that the H3K4me3 peaks are distinct in LT-HSC, ST-HSC, and MPPs. The only reported maps of H3K4me3 in LT-HSC, ST-HSC, and MPPs utilized iChIP-seq, in which the BM cells pooled from several 8- to 12-week-old mice were first labeled, fixed, and then sorted for the three HSC subtypes. iChIP-seq was performed using 10,000–20,000 sorted LT-HSC, ST-HSC, or MPPs. Since the iChIP-seq used the same markers to sort LT-HSC, ST-HSC, and MPPs, we compared our FARP-ChIP-seq maps to those of iChIP-seq.
We first determined whether the iChIP H3K4me3 dataset could distinguish LT-HSCs, ST-HSCs, and MPPs. Only one sample for LT-HSCs and MPPs was available in the iChIP study. Nonetheless, the MDS plot revealed that the two biological replicates for ST-HSC iChIP-seq failed to cluster, whereas the biological replicates of the FARP-ChIP-seq datasets clustered well (Figures 5F and 5G). Consistent with the MDS plot, no differential H3K4me3 peaks were identified among the iChIP-seq H3K4me3 datasets obtained for LT-HSCs, ST-HSCs, and MPPs, whereas hundreds of differential peaks were found in the FARP-ChIP-seq datasets (see next section).
We next used the “preseq” software package (Daley and Smith, 2013) to estimate the iChIP-seq H3K4me3 library complexity based on the deposited datasets (Lara-Astiaso et al., 2014). The iChIP library complexities for LT-HSCs, ST-HSCs, and MPPs are 2.5–6.5M (million reads) (Figure 5H). If the recovery rates of ChIP DNA were constant for different numbers of input cells, this would translate to 250,000–650,000 library complexity for 1,000 cells, which would suggest that iChIP-seq might not perform well using low cell numbers. We were unable to analyze the library complexity of the iChIP-seq mapping of H3K4me3 using 500 BMDCs because the original dataset was not available in the public database. By contrast, our FARP-ChIP-seq library complexities for the HSC subtypes ranged from 14M to 60M using 800–1,500 input cells (Figure 5H). Since we used an H3K4me3 antibody different from that used in the iChIP study, we repeated the FARP-ChIP-seq using the same antibody used for iChIP-seq. The library complexity obtained using 1,500 ST-HSCs was 7.3M, which was higher than the highest complexity of 6.4M obtained by iChIP-seq of 10,000–20,000 cells (Figure 5H). This indicates that FARP-ChIP-seq offers more accurate epigenome mapping in fewer cells.
To ensure high recovery of live-sorted rare HSC subtypes during fixation and washes, we used bacteria as cell carriers in FARP-ChIP-seq, whereas a large number of labeled BM cells were fixed, washed, and sorted for HSC subtypes in iChIP-seq. Although fixing and washing large numbers of BM cells prevents cell loss, fixation changes the fluorescence of cell surface labels and is also not compatible with propidium iodide (PI) or DAPI staining used for dead cell exclusion. Thus fixation could result in increased impurity of the sorted cells. We reasoned that lineage-signature based on H3K4me3 could allow us to assess cell purity used in iChIP-seq and FARP-ChIP-seq. By comparing the H3K4me3 datasets for LT-HSCs, we found 10,718 shared, 1,252 FARP-ChIP-only, and 4,963 iChIP-only peaks. GO-term analyses of the FARP-ChIP-only peaks showed no significant enrichment of genes belonging to any terms, whereas the iChIP-only peaks were enriched for genes involved in B cell activation and proliferation (Figure S5C) and include key B cell regulators such as Pax5, Ebf1, Ikzf3, and Cd74 and B cell marker genes such as Cd19 (Figure 5I), suggesting a potential B cell contamination of the LT-HSCs in the iChIP-seq. Next, we compared the iChIP-only H3K4me3 peaks in LT-HSCs to the total iChIP-seq H3K4me3 peaks determined for B cells in the same study (Lara-Astiaso et al., 2014). Among the top 20% highest LT-HSCs iChIP-only peaks, which are unlikely resulted from random noise, 95% overlapped with the B cell H3K4me3 peaks. Similar analysis suggests that one of the ST-HSC samples used in iChIP-seq also had B cell contamination. These analyses demonstrate that FARP-ChIP-seq allows high-quality epigenome mapping in a low number of sorted pure HSC subtypes because it does not rely on the sorting of fixed cells and ensures the recovery of very low amounts of ChIP DNA.
High-Quality H3K4me3 Mapping by FARP-ChIP-Seq Offers a Resource for Studying HSC Subtypes
Since the broadest H3K4me3 peaks often mark genes important for the function and identity of a given cell type (Benayoun et al., 2014), we further mined the H3K4me3 maps obtained by FARP-ChIP-seq for LT-HSCs, ST-HSCs, and MPPs (Table S5). GO-term analysis showed that all broad H3K4me3 peaks in LT-HSCs, ST-HSCs, and MPPs were enriched in hematopoietic functions (Figure S6). For example, genes important for HSC regulation such as Meis1, Hlf, and Erg all exhibited broad H3K4me3 peaks (Figure 6A) in all three HSC subtypes. Thus, by looking for genes with broadest H3K4me3 peaks in our data-sets, one may identify new candidate regulators of HSC for further functional studies.
Figure 6. Comparison of H3K4me3 between HSC Subtypes.

(A) Genome browser view of common broad H3K4me3 peaks on genes in the HSC subtypes.
(B–E) Genome browser view of H3K4me3 differences in genes in the HSC subtypes (B and D) and GO-term of genes with significant changes of promoter H3K4me3 between indicated HSC subtypes (C and E). Green, red, or blue bars represent ST-HSC, LT-HSC, or MPP enriched GO terms, respectively. No ST-HSC enriched GO terms were found.
By comparing ST-HSCs and LT-HSCs, we identified 725 up-and 788 downregulated H3K4me3 peaks (fold change > 1.5, FDR < 0.05). Among the genes exhibiting increased H3K4me3 peaks in ST-HSCs, we found those involved in cell-cycle regulation and DNA replication such as E2f8, Smc2, and Chek1 (Figure 6B). Consistently, previous RNA sequencing (RNA-seq) showed an increased expression of genes that belong to these functional groups (Cabezas-Wallscheid et al., 2014). Interestingly, we found that multiple regulators of chromatin organization such as Cbx5 and Suv39h1 exhibited increased H3K4me3 (Figure 6B), suggesting that ST-HSC may have more condensed chromatin structure than LT-HSCs. GO-term analysis of differential promoter H3K4me3 peaks between LT-HSCs and ST-HSCs also supports the functional differences in cell cycle and chromatin organization in these two HSC subtypes (Figure 6C).
When the H3K4me3 datasets between ST-HSCs and MPPs were compared, we identified 878 up- and 881 downregulated peaks (fold change > 1.5, FDR < 0.05) in MPPs. Among the genes with downregulated H3K4me3, we found known regulators of HSC generation, maintenance, or survival, such as Gata2 and Tal1 (Figure 6D) (Porcher et al., 1996; Tsai and Orkin, 1997), had the broadest peaks in LT-HSCs and ST-HSCs. This suggests that H3K4me3 changes in these genes are responsible for preparing MPPs for multi-lineage differentiation. However, genes such as Ikzf1 and Dntt that are known to be required for lymphoid lineage functions exhibited an increase in H3K4me3 in MPPs (McCaffrey et al., 1975; Reynaud et al., 2008). Interestingly, GO-term analysis of differential promoter H3K4me3 peaks further revealed enrichment of genes required for mRNA metabolism and cell cycle in MPPs (Figure 6E). Taken together, the high-quality H3K4me3 maps obtained by FARP-ChIP-seq provide useful resources for the study of LT-HSCs, ST-HSCs, and MPPs.
A General Lack of H3K4me3/H3K27me3 Bivalency in HSCs in Genes Required for Hematopoietic Differentiation
The marking of genes required for lineage specification and development by both H3K27me3 and H3K4me3 on their promoters was first discovered in mESCs (Bernstein et al., 2006). This so-called bivalent epigenetic mark is implicated in poising developmental regulators for rapid up- or downregulation and is thus considered to be important for lineage differentiation (Bernstein et al., 2006). Several studies have suggested the existence of bivalent genes in other stem/progenitor cells, but the coexistence of these marks on the same promoter within one cell has been firmly established only in mESCs (Voigt et al., 2012). Whether the reported bivalency for other stem/progenitor cells reflects true dual marking or cell heterogeneity remains unclear.
The studies that reported bivalent genes in HSCs used total LSK HSCs or purified subpopulations of LSK HSCs (Adli et al., 2010; Sun et al., 2014; Weishaupt et al., 2010). Overall, ~740–2,260 bivalent genes were found in HSCs or its subtypes. Since the biological replicates of FARP-ChIP-seq maps of H3K27me3 were highly consistent (Figures 7A–7C), we analyzed H3K27me3/H3K4me3 bivalency using our datasets. We found that LT-HSCs, ST-HSCs, and MPPs had only 302, 376, and 117 bivalent genes, respectively (Figures 7D–7F; Table S6). Among these, Rhpn2, Zfp580, Rassf5, and Gata3 were reported as bivalent genes previously (Sun et al., 2014; Weishaupt et al., 2010) (Figure 7G). When analyzing how many of the known mESC bivalent genes were resolved in the three HSC subtypes, we found that 605–662 and 1,677–1,757 of them became H3K4me3-only or H3K27me3-only genes, respectively. Whereas 58–184 of the mESC bivalent genes remained bivalent, 257–468 of them had neither modification in the three HSC subtypes (Figure 7H). Importantly, the bivalent genes uncovered by FARP-ChIP-seq are not implicated in regulating hematopoietic lineage development (Table S6) and GO-term analysis revealed no significant enrichment of pathway genes. Moreover, when all bivalent genes were combined in the three HSC subtypes, the 562 total bivalent genes identified by FARP-ChIP-seq were still smaller than the number previously reported for HSCs.
Figure 7. Genes for Hematopoietic Lineage Differentiation Are Not Generally Marked by H3K4me3/HK27me3 Bivalency in HSCs.

(A–C) Contour plots (Spearman correlation coefficient, R) between H3K27me3 (plotted as log2 of the average read density within 5 kb upstream and downstream of TSS) on promoters obtained by FARP-ChIP-seq in biological replicates of the HSC subtypes.
(D–F) Scatterplots of H3K4me3 and H3K27me3 enrichment (plotted as log2 of the average read density within 2 kb upstream and downstream of TSS) based on FARP-ChIP-seq in the HSC subtypes.
(G) Genome browser view of bivalent genes found by FARP-ChIP-seq in the HSC subtypes and by previous studies. Rectangles outline the bivalent promoters. (H) Bar plot showing how bivalent genes found in mESCs are resolved in HSC subtypes mapped by FARP-ChIP-seq.
To confirm whether H3K4me3/H3K27me3 bivalency is not used to mark the genes required for differentiation of HSCs, we analyzed the bivalent genes reported previously by focusing on the dataset obtained for a subpopulation of LSK HSCs defined as SP (side population) and CD150+ (SP-CD150+-LSK HSCs) (Sun et al., 2014). (Another dataset mapped by Nano-ChIP-seq was for more heterogeneous LSK HSCs; Adli and Bernstein, 2011.) Since no bivalent gene list was provided in the mapping of the SP-CD150+-LSK HSCs (Sun et al., 2014), we first used our criteria to identify bivalent genes in the published dataset. We found 1,940 promoters with both H3K4me3 and H3K27me3 enrichment in SP-CD150+-LSK HSCs, similar to the reported number of bivalent genes (Sun et al., 2014). Among these, 210 overlapped with the bivalent genes found in our dataset, whereas the remaining genes had only H3K27me3 enrichment (91.7%, 1,587 of 1,730) in our dataset. Strikingly, GO-term analyses revealed that the 1,940 bivalent genes were not enriched for hematopoietic differentiation or development (Table S7) but were instead enriched for the differentiation/development of nervous system followed by epithelia, skeletal system, kidney, mesenchymal cells, urogenital system, heart, and pancreas (Figure S7A). Among the 1,940 bivalent genes, we selected 300 with the strongest H3K4me3 and compared them to the available RNA-seq datasets of the hematopoietic lineages and found that only 72 were expressed in at least one lineage (Figure S7B) (Lara-Astiaso et al., 2014). This is consistent with the idea that genes required for non-hematopoietic lineage development are silenced in HSCs and the differentiated hematopoietic lineages. Based on our dataset, most of the 1,940 bivalent genes are marked only by the repressive H3K27me3, so these analyses further confirm that H3K4me3 and H3K27me3 are not used to mark the poised state of genes required for hematopoietic lineage differentiation in HSCs.
DISCUSSION
The ChIP-seq method reported here is based on the idea that if a rare cell population is not lost during the initial fixation and wash steps, and if chromatin loss is minimized during ChIP and library building, it should be possible to recover low-abundance DNA without increasing DNA amplification cycles. Although we report only epigenome mapping using FARP-ChIP-seq, the general principle of using synthetic DNA as carrier is applicable to all ChIP-seq, genomic DNA-seq, and RNA-seq needs when a single cell or a small number of cells are used. The presence of bacteria DNA and bio-DNA in the final sequencing library calls for ~5-fold increase in read depth for FARP-ChIP-seq of 500 cells, and read depth is decreased as cell number used increases. Considering that FARP-ChIP-seq offers the highest-fidelity mapping compared to all other methods for low cell numbers, this modest increase in sequencing depth justifies its application.
Various carrier approaches have been employed to ensure the recovery of small amounts of DNA or RNA in different applications. In the specific case of ChIP-seq, we show that DNA or chromatin carrier ensures co-purification of carriers with the DNA of interest in each step. Since the carrier has the same characteristics as the DNA of interest, it can effectively occupy nonspecific and irreversible DNA binding sites present on all surfaces and can also saturate contaminating DNases. Here, we show that RP-ChIP-seq and FARP-ChIP-seq allows accurate mapping of epigenome in as few as 500 cells. Although bacteria DNA was not pulled down in our ChIP design, substantial nonspecific bacteria DNA was carried over and amplified in the library building step, which contributed to the increased read depth needed. Additional improvements, such as treating bacteria with DNA crosslinkers, and the use of microfluidic techniques (Aguilar and Craighead, 2013) should further reduce read depth and cell number needed in a high-throughput format.
Our proof-of-concept RP-ChIP-seq of H3K4me3 analyses using one dissected mouse lens demonstrate the usefulness of obtaining epigenome maps of young and old tissues. The high-data quality have allowed us to identify age-associated H3K4me3 changes in mouse lens. Among the genes that exhibit age-associated changes in H3K4me3, we have identified both known and possible candidate genes whose deregulation upon aging could contribute to cataracts. For example, two genes, Cryaa and Kcnab1, which contain cataract-associated SNPs based on recent human GWAS, exhibited significant age-associated upregulation of H3K4me3 in mouse lens. It will be interesting to further study whether the expression of these two genes is increased in the lens of cataract patients, because it could reveal whether the identified SNPs directly contribute to cataract development.
The FARP-ChIP-seq allowed us to reveal the high-quality maps of H3K4me3 and H3K27me3 using low number of LT-HSCs, SH-HSCs, and MPPs compared to previously published datasets. By using pure cell populations, we found fewer H3K4me3/H3K27me3 bivalent genes in HSCs than previously reported. More importantly, the bivalent genes found in both our study and the reported studies are not involved in hematopoietic lineage specification. This shows that H3K4me3/ H3K27me3 bivalency is unlikely to be the mechanism used for poising lineage-specific gene expression in HSCs. However, it is possible that other mechanisms are used to poise genes for expression. For example, in multi-potential hematopoietic cells such as the established EML cell line, hematopoietic-specific genes may be poised by H3K4me2-positive and H3K4me3-negative marks (Orford et al., 2008). RNA polymerase II pausing on promoters may also poise genes for expression (Puri et al., 2015). The FARP-ChIP-seq strategy reported here should aid in the further study of how HSCs poise genes for lineage differentiation.
The methods reported here should allow large-scale epigenome association studies using pure cell populations from patients or animal models. Reduced cell heterogeneity should increase the success rate of discovering epigenetic changes that are relevant to either developmental or disease processes. The feasibility of mapping the epigenome of dissected tissues or sorted cells will allow improved understanding of epigenetic changes during each stage of organ and tissue building. Coupling such information with gene expression studies should greatly enhance our understanding of the developmental processes. The disease-associated epigenetic changes mapped with dissected tissues, in conjunction with GWAS, should greatly improve the accuracy and power of biomarker discovery and disease diagnosis.
EXPERIMENTAL PROCEDURES
Mouse ESCs and Culture
V6.5 mESCs were maintained in DMEM supplemented with 15% fetal calf serum, 0.1 mM β-mercaptoethanol, 2 mM L-glutamine, 0.1 mM nonessential amino acids, 1,000 U/ml recombinant leukemia inhibitory factor (LIF; Millipore), and 30 U/ml penicillin/streptomycin (the ESC medium) on plates coated with gelatin (Millipore).
Mouse Lens and HSC Subtype Isolation
All mouse procedures were in accordance with the guidelines of the Carnegie Institution Animal Care and Use Committee. For detailed methods, see Supplemental Experimental Procedures.
ChIP-Seq
Standard ChIP-seq follows the manufacturer’s instructions with modifications detailed in Supplemental Experimental Procedures. The RP-ChIP-seq and FARP-ChIP-seq protocols involve the addition of yeast or bacteria as cell carriers to allow the recovery of the low number of cells of interest. Bio-DNA was added as carrier during ChIP. Blocker oligo was added to prevent the amplification of the Bio-DNA during library building. For detailed ChIP protocols, see Supplemental Experimental Procedures.
Quality Filtering, Mapping, and Analyses of All ChIP-Seq Datasets in This Study
For RP-ChIP-seq and FARP-ChIP-seq libraries, reads were filtered using the quality of multiplexing indices before mapping to prevent contamination by erroneous de-multiplexing. Reads with an average index quality below 30 were discarded (Kircher et al., 2012). The reads were then mapped to mouse genome (mm9) by Bowtie, allowing two mismatches per read. Only uniquely mapped reads were retained. The mapped reads were further mapped to carrier genome or biotin-DNA sequences by Bowtie allowing three mismatches, and reads mapped to the carrier genome or biotin-DNA was discarded. For detailed data analyses, see Supplemental Experimental Procedures.
Comparison of ChIP-Seq Qualities among Different Methods
To compare different ChIP-seq methods, we used multiple criteria as detailed in Supplemental Experimental Procedures.
Supplementary Material
Highlights.
RP-ChIP-seq enables high-fidelity epigenetic profiling in 500 cells
FARP-ChIP-seq is generally applicable
Age-associated epigenome changes in mouse lens are revealed by RP-ChIP-seq
Lack of H3K4me3/H3K27me3 bivalency on hematopoietic differentiation genes in HSCs
Acknowledgments
We thank Kang Zhang (UCSD) for advice on cataract, Allison Pinder, Nick Ingolia, and Frederick Tan for deep sequencing and advice on data analyses, Ona Martin for proofreading, and members of the Zheng lab for critical comments. This work was supported by the Ellison Medical Foundation and by NIH grants GM056312 and GM106023.
Footnotes
ACCESSION NUMBERS
The accession number for the ChIP-seq data reported in this paper is GEO: GSE70832.
Supplemental Information includes Supplemental Experimental Procedures, seven figures, and seven tables and can be found with this article online at http://dx.doi.org/10.1016/j.celrep.2015.10.004.
CONFLICTS OF INTEREST
X.Z., J.J., and Y.Z. have a pending patent on the method described in this paper.
AUTHOR CONTRIBUTIONS
Conception, J.J., X.Z., S.Y., and Y.Z.; Methodology, J.J., X.Z., S.Y., and Y.Z.; Investigation, J.J., X.Z., and S.Y.; Writing – Original draft, J.J., X.Z., and Y.Z.; Writing – Review and Editing, J.J., X.Z., S.Y., and Y.Z.; Funding Acquisition, Y.Z.; Resources, Y.Z.; Supervision, Y.Z.
References
- Adli M, Bernstein BE. Whole-genome chromatin profiling from limited numbers of cells using nano-ChIP-seq. Nat Protoc. 2011;6:1656–1668. doi: 10.1038/nprot.2011.402. [DOI] [PMC free article] [PubMed] [Google Scholar]
- Adli M, Zhu J, Bernstein BE. Genome-wide chromatin maps derived from limited numbers of hematopoietic progenitors. Nat Methods. 2010;7:615–618. doi: 10.1038/nmeth.1478. [DOI] [PMC free article] [PubMed] [Google Scholar]
- Aguilar CA, Craighead HG. Micro- and nanoscale devices for the investigation of epigenetics and chromatin dynamics. Nat Nanotechnol. 2013;8:709–718. doi: 10.1038/nnano.2013.195. [DOI] [PMC free article] [PubMed] [Google Scholar]
- Benayoun BA, Pollina EA, Ucar D, Mahmoudi S, Karra K, Wong ED, Devarajan K, Daugherty AC, Kundaje AB, Mancini E, et al. H3K4me3 breadth is linked to cell identity and transcriptional consistency. Cell. 2014;158:673–688. doi: 10.1016/j.cell.2014.06.027. [DOI] [PMC free article] [PubMed] [Google Scholar]
- Bernstein BE, Mikkelsen TS, Xie X, Kamal M, Huebert DJ, Cuff J, Fry B, Meissner A, Wernig M, Plath K, et al. A bivalent chromatin structure marks key developmental genes in embryonic stem cells. Cell. 2006;125:315–326. doi: 10.1016/j.cell.2006.02.041. [DOI] [PubMed] [Google Scholar]
- Brind’Amour J, Liu S, Hudson M, Chen C, Karimi MM, Lorincz MC. An ultra-low-input native ChIP-seq protocol for genome-wide profiling of rare cell populations. Nat Commun. 2015;6:6033. doi: 10.1038/ncomms7033. [DOI] [PubMed] [Google Scholar]
- Cabezas-Wallscheid N, Klimmeck D, Hansson J, Lipka DB, Reyes A, Wang Q, Weichenhan D, Lier A, von Paleske L, Renders S, et al. Identification of regulatory networks in HSCs and their immediate progeny via integrated proteome, transcriptome, and DNA methylome analysis. Cell Stem Cell. 2014;15:507–522. doi: 10.1016/j.stem.2014.07.005. [DOI] [PubMed] [Google Scholar]
- Daley T, Smith AD. Predicting the molecular complexity of sequencing libraries. Nat Methods. 2013;10:325–327. doi: 10.1038/nmeth.2375. [DOI] [PMC free article] [PubMed] [Google Scholar]
- Hawse JR, Hejtmancik JF, Huang Q, Sheets NL, Hosack DA, Lem-picki RA, Horwitz J, Kantorow M. Identification and functional clustering of global gene expression differences between human age-related cataract and clear lenses. Mol Vis. 2003;9:515–537. [PMC free article] [PubMed] [Google Scholar]
- Jia J, Lin M, Zhang L, York JP, Zhang P. The Notch signaling pathway controls the size of the ocular lens by directly suppressing p57Kip2 expression. Mol Cell Biol. 2007;27:7236–7247. doi: 10.1128/MCB.00780-07. [DOI] [PMC free article] [PubMed] [Google Scholar]
- Jia J, Zheng X, Hu G, Cui K, Zhang J, Zhang A, Jiang H, Lu B, Yates J, 3rd, Liu C, et al. Regulation of pluripotency and self-renewal of ESCs through epigenetic-threshold modulation and mRNA pruning. Cell. 2012;151:576–589. doi: 10.1016/j.cell.2012.09.023. [DOI] [PMC free article] [PubMed] [Google Scholar]
- Jiang H, Shukla A, Wang X, Chen WY, Bernstein BE, Roeder RG. Role for Dpy-30 in ES cell-fate specification by regulation of H3K4 methylation within bivalent domains. Cell. 2011;144:513–525. doi: 10.1016/j.cell.2011.01.020. [DOI] [PMC free article] [PubMed] [Google Scholar]
- Kim J, Cantor AB, Orkin SH, Wang J. Use of in vivo biotinylation to study protein-protein and protein-DNA interactions in mouse embryonic stem cells. Nat Protoc. 2009;4:506–517. doi: 10.1038/nprot.2009.23. [DOI] [PubMed] [Google Scholar]
- Kircher M, Sawyer S, Meyer M. Double indexing overcomes inaccuracies in multiplex sequencing on the Illumina platform. Nucleic Acids Res. 2012;40:e3. doi: 10.1093/nar/gkr771. [DOI] [PMC free article] [PubMed] [Google Scholar]
- Landt SG, Marinov GK, Kundaje A, Kheradpour P, Pauli F, Batzoglou S, Bernstein BE, Bickel P, Brown JB, Cayting P, et al. ChIP-seq guidelines and practices of the ENCODE and modENCODE consortia. Genome Res. 2012;22:1813–1831. doi: 10.1101/gr.136184.111. [DOI] [PMC free article] [PubMed] [Google Scholar]
- Langmead B, Trapnell C, Pop M, Salzberg SL. Ultrafast and memory-efficient alignment of short DNA sequences to the human genome. Genome Biol. 2009;10:R25. doi: 10.1186/gb-2009-10-3-r25. [DOI] [PMC free article] [PubMed] [Google Scholar]
- Lara-Astiaso D, Weiner A, Lorenzo-Vivas E, Zaretsky I, Jaitin DA, David E, Keren-Shaul H, Mildner A, Winter D, Jung S, et al. Immunogenetics. Chromatin state dynamics during blood formation. Science. 2014;345:943–949. doi: 10.1126/science.1256271. [DOI] [PMC free article] [PubMed] [Google Scholar]
- Li WC, Kuszak JR, Dunn K, Wang RR, Ma W, Wang GM, Spector A, Leib M, Cotliar AM, Weiss M, et al. Lens epithelial cell apoptosis appears to be a common cellular basis for non-congenital cataract development in humans and animals. J Cell Biol. 1995;130:169–181. doi: 10.1083/jcb.130.1.169. [DOI] [PMC free article] [PubMed] [Google Scholar]
- Liao J, Su X, Chen P, Wang X, Xu L, Li X, Thean L, Tan C, Tan AG, Tay WT, et al. Meta-analysis of genome-wide association studies in multiethnic Asians identifies two loci for age-related nuclear cataract. Hum Mol Genet. 2014;23:6119–6128. doi: 10.1093/hmg/ddu315. [DOI] [PubMed] [Google Scholar]
- McCaffrey R, Harrison TA, Parkman R, Baltimore D. Terminal deoxynucleotidyl transferase activity in human leukemic cells and in normal human thymocytes. N Engl J Med. 1975;292:775–780. doi: 10.1056/NEJM197504102921504. [DOI] [PubMed] [Google Scholar]
- Mikkelsen TS, Ku M, Jaffe DB, Issac B, Lieberman E, Giannoukos G, Alvarez P, Brockman W, Kim TK, Koche RP, et al. Genome-wide maps of chromatin state in pluripotent and lineage-committed cells. Nature. 2007;448:553–560. doi: 10.1038/nature06008. [DOI] [PMC free article] [PubMed] [Google Scholar]
- Ng JH, Kumar V, Muratani M, Kraus P, Yeo JC, Yaw LP, Xue K, Lufkin T, Prabhakar S, Ng HH. In vivo epigenomic profiling of germ cells reveals germ cell molecular signatures. Dev Cell. 2013;24:324–333. doi: 10.1016/j.devcel.2012.12.011. [DOI] [PubMed] [Google Scholar]
- Nishino J, Kim I, Chada K, Morrison SJ. Hmga2 promotes neural stem cell self-renewal in young but not old mice by reducing p16Ink4a and p19Arf Expression. Cell. 2008;135:227–239. doi: 10.1016/j.cell.2008.09.01. [DOI] [PMC free article] [PubMed] [Google Scholar]
- Orford K, Kharchenko P, Lai W, Dao MC, Worhunsky DJ, Ferro A, Janzen V, Park PJ, Scadden DT. Differential H3K4 methylation identifies developmentally poised hematopoietic genes. Dev Cell. 2008;14:798–809. doi: 10.1016/j.devcel.2008.04.002. [DOI] [PMC free article] [PubMed] [Google Scholar]
- Park PJ. ChIP-seq: advantages and challenges of a maturing technology. Nat Rev Genet. 2009;10:669–680. doi: 10.1038/nrg2641. [DOI] [PMC free article] [PubMed] [Google Scholar]
- Porcher C, Swat W, Rockwell K, Fujiwara Y, Alt FW, Orkin SH. The T cell leukemia oncoprotein SCL/tal-1 is essential for development of all hematopoietic lineages. Cell. 1996;86:47–57. doi: 10.1016/s0092-8674(00)80076-8. [DOI] [PubMed] [Google Scholar]
- Puri D, Gala H, Mishra R, Dhawan J. High-wire act: the poised genome and cellular memory. FEBS J. 2015;282:1675–1691. doi: 10.1111/febs.13165. [DOI] [PubMed] [Google Scholar]
- Reynaud D, Demarco IA, Reddy KL, Schjerven H, Bertolino E, Chen Z, Smale ST, Winandy S, Singh H. Regulation of B cell fate commitment and immunoglobulin heavy-chain gene rearrangements by Ikaros. Nat Immunol. 2008;9:927–936. doi: 10.1038/ni.1626. [DOI] [PMC free article] [PubMed] [Google Scholar]
- Ruotolo R, Grassi F, Percudani R, Rivetti C, Martorana D, Maraini G, Ottonello S. Gene expression profiling in human age-related nuclear cataract. Mol Vis. 2003;9:538–548. [PubMed] [Google Scholar]
- Rybak JN, Ettorre A, Kaissling B, Giavazzi R, Neri D, Elia G. In vivo protein biotinylation for identification of organ-specific antigens accessible from the vasculature. Nat Methods. 2005;2:291–298. doi: 10.1038/nmeth745. [DOI] [PubMed] [Google Scholar]
- Segev F, Mor O, Segev A, Belkin M, Assia EI. Downregulation of gene expression in the ageing lens: a possible contributory factor in senile cataract. Eye (Lond) 2005;19:80–85. doi: 10.1038/sj.eye.6701423. [DOI] [PubMed] [Google Scholar]
- Shankaranarayanan P, Mendoza-Parra MA, Walia M, Wang L, Li N, Trindade LM, Gronemeyer H. Single-tube linear DNA amplification (LinDA) for robust ChIP-seq. Nat Methods. 2011;8:565–567. doi: 10.1038/nmeth.1626. [DOI] [PubMed] [Google Scholar]
- Shankaranarayanan P, Mendoza-Parra MA, van Gool W, Trindade LM, Gronemeyer H. Single-tube linear DNA amplification for genome-wide studies using a few thousand cells. Nat Protoc. 2012;7:328–338. doi: 10.1038/nprot.2011.447. [DOI] [PubMed] [Google Scholar]
- Sun D, Luo M, Jeong M, Rodriguez B, Xia Z, Hannah R, Wang H, Le T, Faull KF, Chen R, et al. Epigenomic profiling of young and aged HSCs reveals concerted changes during aging that reinforce self-renewal. Cell Stem Cell. 2014;14:673–688. doi: 10.1016/j.stem.2014.03.002. [DOI] [PMC free article] [PubMed] [Google Scholar]
- Tsai FY, Orkin SH. Transcription factor GATA-2 is required for proliferation/survival of early hematopoietic cells and mast cell formation, but not for erythroid and myeloid terminal differentiation. Blood. 1997;89:3636–3643. [PubMed] [Google Scholar]
- Voigt P, LeRoy G, Drury WJ, 3rd, Zee BM, Son J, Beck DB, Young NL, Garcia BA, Reinberg D. Asymmetrically modified nucleosomes. Cell. 2012;151:181–193. doi: 10.1016/j.cell.2012.09.002. [DOI] [PMC free article] [PubMed] [Google Scholar]
- Weishaupt H, Sigvardsson M, Attema JL. Epigenetic chromatin states uniquely define the developmental plasticity of murine hematopoietic stem cells. Blood. 2010;115:247–256. doi: 10.1182/blood-2009-07-235176. [DOI] [PubMed] [Google Scholar]
- Yang L, Bryder D, Adolfsson J, Nygren J, Månsson R, Sigvardsson M, Jacobsen SE. Identification of Lin(−)Sca1(+)kit(+)CD34(+)Flt3-short-term hematopoietic stem cells capable of rapidly reconstituting and rescuing myeloablated transplant recipients. Blood. 2005;105:2717–2723. doi: 10.1182/blood-2004-06-2159. [DOI] [PubMed] [Google Scholar]
- Zhang P, Liégeois NJ, Wong C, Finegold M, Hou H, Thompson JC, Silverman A, Harper JW, DePinho RA, Elledge SJ. Altered cell differentiation and proliferation in mice lacking p57KIP2 indicates a role in Beckwith-Wiedemann syndrome. Nature. 1997;387:151–158. doi: 10.1038/387151a0. [DOI] [PubMed] [Google Scholar]
- Zhang Y, Liu T, Meyer CA, Eeckhoute J, Johnson DS, Bernstein BE, Nusbaum C, Myers RM, Brown M, Li W, Liu XS. Model-based analysis of ChIP-Seq (MACS) Genome Biol. 2008;9:R137. doi: 10.1186/gb-2008-9-9-r137. [DOI] [PMC free article] [PubMed] [Google Scholar]
- Zwart W, Theodorou V, Kok M, Canisius S, Linn S, Carroll JS. Oestrogen receptor-co-factor-chromatin specificity in the transcriptional regulation of breast cancer. EMBO J. 2011;30:4764–4776. doi: 10.1038/emboj.2011.368. [DOI] [PMC free article] [PubMed] [Google Scholar]
- Zwart W, Koornstra R, Wesseling J, Rutgers E, Linn S, Carroll JS. A carrier-assisted ChIP-seq method for estrogen receptor-chromatin interactions from breast cancer core needle biopsy samples. BMC Genomics. 2013;14:232. doi: 10.1186/1471-2164-14-232. [DOI] [PMC free article] [PubMed] [Google Scholar]
Associated Data
This section collects any data citations, data availability statements, or supplementary materials included in this article.