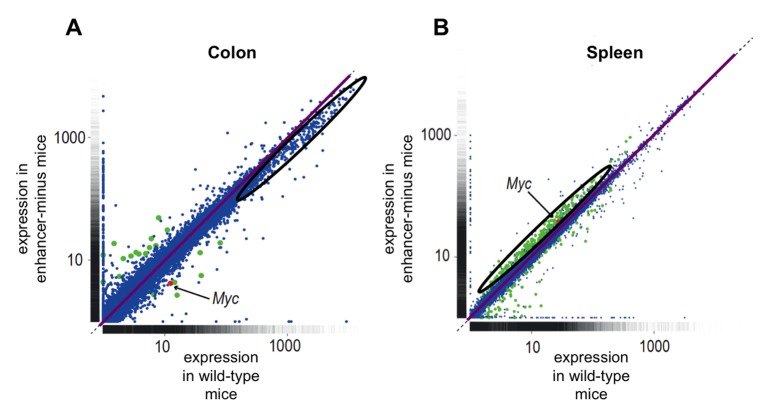
Figure 1. Comparing gene expression in mouse cells with and without the enhancer region upstream of Myc.
Each dot represents a gene: the Myc gene is marked in red; genes that show significantly different expression between the two types of mice are marked in green; all other genes are marked in blue. The diagonal purple lines indicate where the expression in enhancer-minus mice is equal to that in wild-type mice. Dots above the purple line are expressed more in the enhancer-minus mice, while dots below the line are expressed less in these mice. (A) Gene expression in colon cells remains largely unchanged between wild-type and enhancer-minus mice. However, the oval region delineates genes at the high end of the expression spectrum that depend upon Myc for full expression in wild-type mice; these genes are expressed less highly in the enhancer-minus mice because Myc levels are depressed in the colon (However, this difference is not significant at the level of individual genes). (B) Gene expression in spleen cells is different between the two types of mice. The oval region delineates genes with intermediate levels of expression that are increased due to the higher Myc levels in the spleens of the enhancer-minus mice. Figure adapted from Figure 5 of Dave et al. (2017).

