Abstract
Galactinol synthase is a pivotal enzyme involved in the synthesis of the raffinose family of oligosaccharides (RFOs) that function as transport carbohydrates in the phloem, as storage compounds in sink tissues and as soluble metabolites that combat both abiotic and biotic stress in several plant species. Hybrid poplar (Populus alba × grandidentata) overexpressing the Arabidopsis thaliana GolS3 (AtGolS3) gene showed clear effects on development; the extreme overexpressing lines were stunted and had cell wall traits characteristic of tension wood, whereas lines with only moderate up‐regulation grew normally and had moderately altered secondary cell wall composition and ultrastructure. Stem cross‐sections of the developing xylem revealed a significant increase in the number of vessels, as well as the clear presence of a G‐layer in the fibres. Furthermore, AtGolS3‐OE lines possessed higher cellulose and lower lignin contents, an increase in cellulose crystallinity, and significantly altered hemicellulose‐derived carbohydrates, notably manifested by their mannose and xylose contents. In addition, the transgenic plants displayed elevated xylem starch content. Transcriptome interrogation of the transgenic plants showed a significant up‐regulation of genes involved in the synthesis of myo‐inositol, along with genes involved in sucrose degradation. The results suggest that the overexpression of GolS and its product galactinol may serve as a molecular signal that initiates metabolic changes, culminating in a change in cell wall development and potentially the formation of tension wood.
Keywords: galactinol synthase, RFOs, tension wood, cellulose, lignin, sugar signalling
Introduction
Optimizing carbon assimilation within an array of dynamic environmental stimuli plays a vital role in shaping the development, fitness and survival of plants. Across species, it has been shown that there is an evolutionarily conserved relationship between leaf photosynthetic capacity and plant biomass investment in leaf area (Reich et al., 1997). Sucrose is central to plant metabolism, and it is the dominant metabolite involved in the growth and development of plant cells. It is the primary product of photosynthesis; in vascular plants, the metabolite is most commonly translocated to sink organs where it provides the carbon for a variety of biosynthetic reactions. When imported into sink tissues, the influx of sucrose is crucial for the maintenance of cellular metabolism, respiration and cell wall biosynthesis, and can be converted to starch for storage and use at a later time (Canam et al., 2008a,b; Coleman et al., 2008).
Given that source tissue (i.e. mature leaves) governs the availability of carbohydrates essential for plant development and growth, it is fair to postulate that the products of primary metabolism are therefore intricately involved in mediating plant development. However, the mechanism by which plants sense changes in the availability of carbohydrates, and consequently how this in turn modulates growth, is not fully known for all development processes, especially cell wall development. Sucrose, and likely other carbohydrate moieties, can serve as a signal molecule that regulates gene expression (Leplé et al., 2007; Reich et al., 1997; Sturm, 1999) and consequently influences associated metabolic pathways, ultimately affecting morphological development (Coleman et al., 2006; Kutschera and Heiderich, 2002). Substantial information exists regarding the flux of sucrose in leaves in relation to photosynthesis, including kinetics and feedback inhibition data on many of the genes and proteins involved in its synthesis (Maloney et al., 2015; Park et al., 2008). Transcriptionally, the genes encoding these enzymes often coincide with developmental state (Barratt et al., 2009; Canam et al., 2006, 2008a,b), especially in developing leaves transitioning from sink to source, as well as during the mobilization of carbohydrates during phenological events, and in fruit development. Sucrose synthesis is also strongly influenced by post‐transcriptional events such as phosphorylation, which is known to influence the rate of synthesis, as well as protein–protein interactions (Kutschera and Heiderich, 2002). However, very little is known about the regulatory control of sucrose anabolism and the proteins that manifest such control. Given that glycolytic enzymes have been shown to function as transcription factors (Tsai et al., 1997), the possibility exists that the sucrolytic enzymes themselves may inherently exhibit dual functionality similar to hexokinase, which has been shown to function both as a key enzyme in primary metabolism and as a sensor of hexose sugars that inform plant resource allocation (Miller et al., 2000; Wiese et al., 2004). Recent evidence suggests that the majority of starch degradation at night occurs through the hydrolytic pathway, resulting in the formation of maltose and glucose in the cytosol (Raines and Paul, 2006). This opens up the possibility that altered starch:sucrose ratios can be sensed by tracking flux through the cytosol (Sharkey et al., 2004). This mechanism is likely to form part of a complex regulatory network, involving several carbohydrate molecules, that maintains a balance between carbon storage and utilization. How such changes in carbon balance are then linked to changes in development is not known, but likely play a central role in the process of integrating the effects of light, hormones and nutrient status (Rolland and Sheen, 2005) and, ultimately, plant growth and cell wall deposition.
Myo‐inositol is a multipurpose compound that generates several derivatives including phosphatidylinositols (PtdIns), inositol polyphosphates, D‐pinitol, cell wall polysaccharides and compatible solutes such as the raffinose family of oligosaccharides (Valluru and Van den Ende, 2011). For example, the PtdIns act both as structural membrane lipid molecules and as signals, where one such derivative, InsP3, has been implicated in the early signalling of gravity sensing and the initiation of a gravitropic response in oat pulvinus and Arabidopsis (Perera et al., 2001, 2005). Similarly, the lipid‐dependent InsP6 has been hypothesized to act as a signalling molecule to release Ca2+ and activate signalling pathways (Munnik and Vermeer, 2010). Alternatively, the lipid‐independent derivative InsP6 is the main phosphorous storage compound in sink tissues that can be later dephosphorylated to InsPs and Ins that are involved in the synthesis of compatible solutes (RFOs, galactinol) when the plant is under stress (Munnik and Vermeer, 2010).
Members of the RFOs serve as transport carbohydrates in the phloem, storage compounds in sink tissues, and metabolic agents to combat both abiotic and biotic stress in several plant species (Cunningham et al., 2003; Kim et al., 2008; Panikulangara et al., 2004; Philippe et al., 2010; Taji et al., 2002). Although there is indirect evidence supporting a signalling role for galactinol and RFOs under biotic and abiotic stress, the exact mechanism and its direct targets remain unclear. In this study, we test the hypothesis that cell wall attributes and plant development can be altered by augmenting the available soluble sucrose pools by examining the effects of altering carbon allocation in hybrid poplar by overexpressing exogenous galactinol synthase (GolS). Several lines were only marginally affected and, in many cases, had improved cell wall characteristics; however, two transgenic lines possessing the highest transcript abundance in the phloem clearly displayed significant developmental effects. Additionally, these transgenic lines possessed wood chemistry and fibre traits characteristic of tension wood, such as lower total lignin content, higher cellulose content, xylem that often contains small vessels and fibres with a unique inner cell wall layer (G‐layer) primarily made of cellulose (Telewski 2006). Together, this implies that GolS, or its product (galactinol) may have a dual role, acting both as a metabolite or as a signal that impacts cell wall development and the transition from normal wood to a specialized secondary cell wall.
Results
Generation of transgenic poplar trees
The full‐length coding sequence of the A. thaliana GolS3 (At1g09350) gene (Taji et al., 2002) was cloned and inserted into the binary vector pSM‐3 driven by a universal 35S promoter. Agrobacterium‐mediated transformation of hybrid poplar yielded eleven AtGol3‐OE transformants that were verified by genomic screening. After 7 weeks of growth in tissue culture, RNA was isolated and used to generate cDNA using reverse transcriptase. Transcript abundance was then determined by real‐time PCR (RT‐PCR). Subsequently, ten lines possessing the highest transgene transcript abundances, based on RT‐PCR, were clonally propagated and eventually transferred to the UBC greenhouse.
After 5 months of growth, the height and diameter of the stems were recorded (Figure 1). Among the 10 transgenic lines, lines 6 and 11 showed distinct growth phenotypes (Figure 2); specifically, they were severely stunted in height (0.86 m and 0.86 m, respectively) and diameter (5.47 mm and 5.71 mm, respectively) compared with the wild‐type trees (2.16 m in height and 12.92 mm of stem diameter), and displayed a distinct vine‐line appearance. The remaining lines appeared similar in stature and architecture to wild‐type trees; therefore, two transgenic lines (3 and 8) were selected for in‐depth characterization along with the two lines that were visually distinct from the untransformed control trees.
Figure 1.
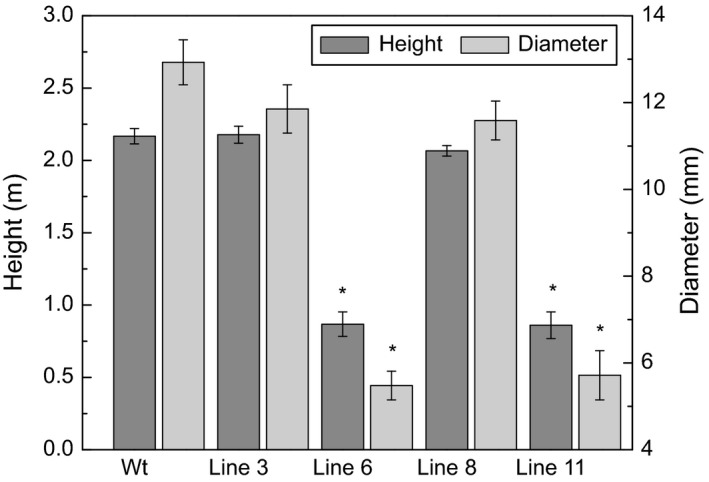
Height and diameter. Height from the base of the stem to the apex, and diameter 10 cm from the base of the stem of 5‐month‐old greenhouse‐grown AtGolS3‐OE and wild‐type hybrid poplar. Bars represent the standard error of the mean (n = 10). Asterisks represent statistical difference from wild type (wt) at 95% level.
Figure 2.
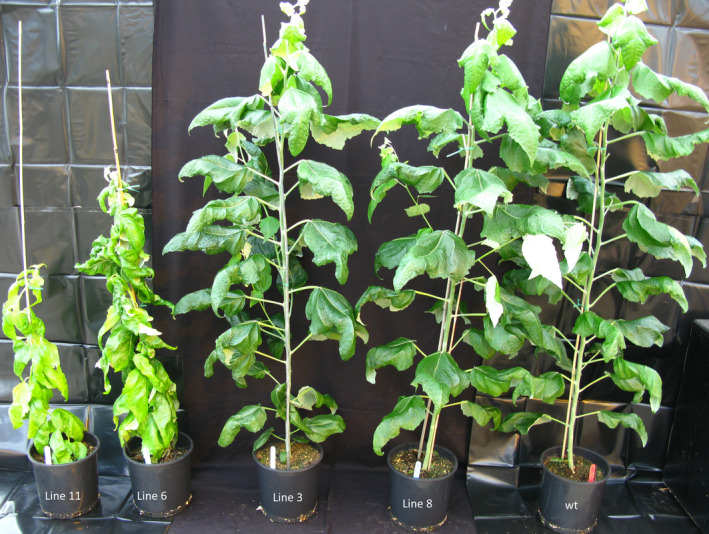
Transgenic hybrid poplar phenotype. Five‐month‐old greenhouse‐grown transgenic AtGolS3 hybrid poplar and wild‐type trees.
Relative transcript abundance was again examined on the greenhouse‐grown trees; transcripts were clearly detected in all four AtGolS3‐OE lines selected for in‐depth examination, but not in the wild type, as expected (Figure 3a). Lines 6 and 11 had greater transgene abundance in the phloem and developing xylem than the other two transgenic lines (3 and 8). The expression was different in source leaves where the non‐phenotypic lines (lines 3 and 8) displayed more transcript than lines 6 and 11. Transgene expression was also examined in the phloem of other transgenic lines (1, 2, 4, 5, 7, prior to selection for in‐depth growth and cell wall phenotyping; Figure 3b). Among all lines, lines 6 and 11 consistently showed the highest transgene expression.
Figure 3.
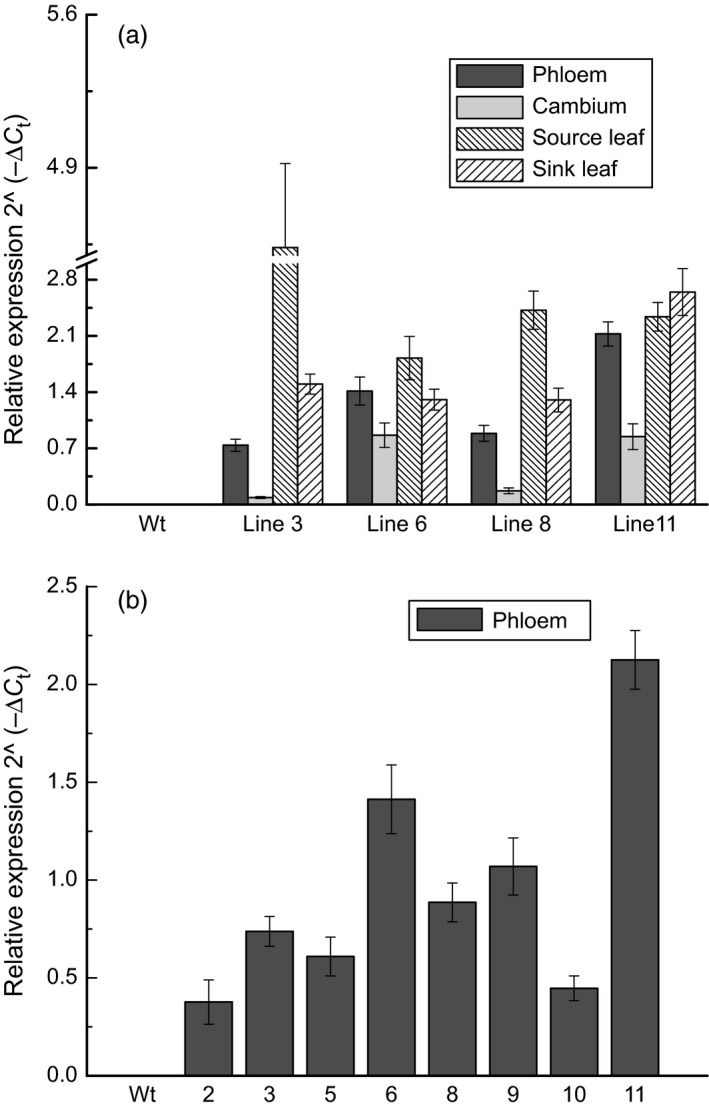
Transcript abundance. Arabidopsis thaliana galactinol synthase 3 gene (AtGolS3) (a) in 4 tissues of selected lines and (b) in phloem tissue of eight lines of 5‐month‐old greenhouse‐grown hybrid poplar. Expression is relative to the translation initiation factor 5A ( TIF5A = reference gene) using the formula 2−∆Ct. Bars represent the standard error of the mean (n = 3).
Soluble sugar and starch analyses
Soluble sugars (galactinol, myo‐inositol, sucrose and raffinose) were analyzed in phloem, developing xylem and source leaves of wild type and the four AtGolS3‐OE lines. Galactinol concentration increased in all AtGolS3‐OE lines compared with wild‐type trees in all tissues, with lines 6 and 11 displaying the highest concentration in the phloem and developing xylem tissues (Figure 4a). Myo‐inositol, which is one of the substrates involved in the reaction catalyzed by galactinol synthase, was higher in all transgenic lines in the phloem and developing xylem, and lower in lines 6 and 11 in leaf tissue compared with the wild‐type trees (Figure 4b). Only trace amounts of raffinose were present in the developing xylem of wild‐type trees, while it was apparent in all transgenic lines, in all tissues (Figure 4c). Sucrose content was lower in lines 6 and 11 in the phloem and developing xylem compared with the other transgenic lines and wild‐type trees (Figure 4d).
Figure 4.
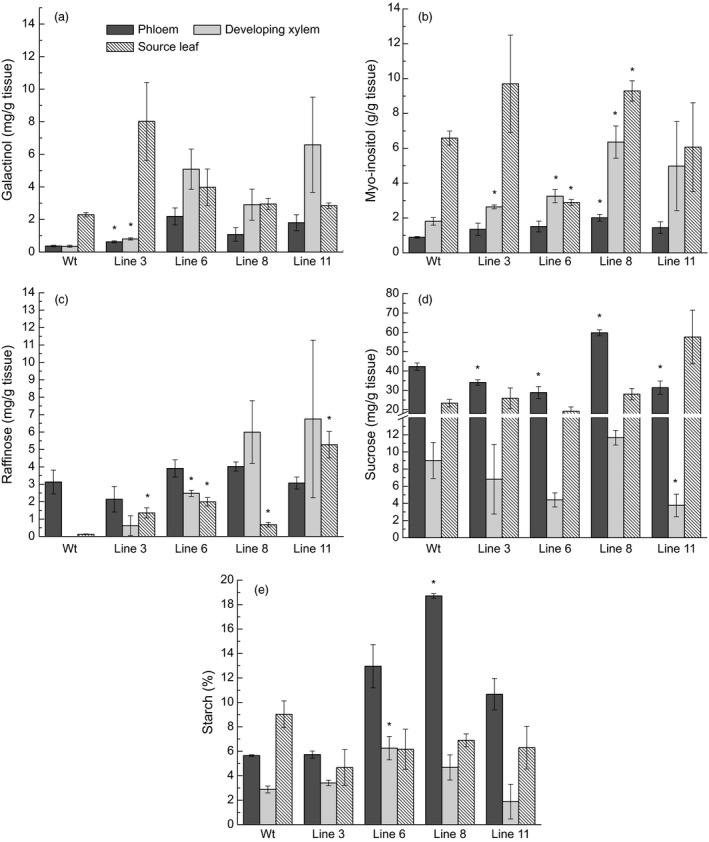
Non‐structural carbohydrates. Concentration (mg/g of dry tissue) of (a) galactinol, (b) myo‐inositol, (c) raffinose, (d) sucrose, and (e) starch (% of dry weight) in tissues of 5‐month‐old greenhouse‐grown wild‐type and AtGolS3‐OE hybrid poplar. Bars represent the standard error of the mean (n = 3). Asterisks represent lines statistically different from wild type (wt) at the 95% level.
Interestingly, the overall amount of sucrose in the phloem of the wild‐type hybrid poplar trees was 13 times higher than the amount of raffinose, confirming that sucrose is the major transporting sugar in poplar (Russin and Evert, 1985; Slewinski et al., 2013). Starch was also reduced in source leaf tissue in all transgenic lines (Figure 4e), whereas phloem starch was higher in all transgenic lines (significantly higher in line 8) compared with wild type, suggesting that carbon partitioning was substantially augmented by GolS overexpression in these transgenic trees. Cross‐sections of transgenic and wild‐type trees, stained with Lugol's solution, clearly showed that starch was accumulating as discernible starch granules in the rays of AtGolS3‐OE trees (Figure 5). The biochemical and histochemical findings were supported by whole‐cell NMR analysis which showed that the developing xylem was enriched in starch in the transgenic lines.
Figure 5.
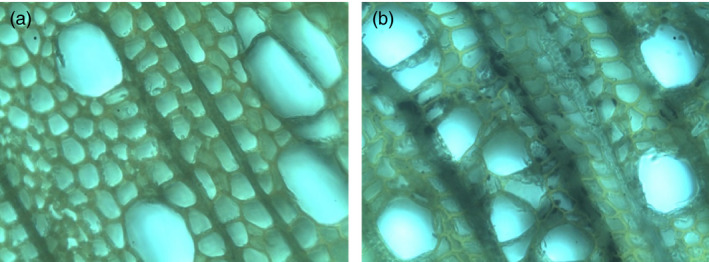
Starch in xylem tissue. Staining with iodine‐blue of (a) wild type and (b) AtGolS3‐OE line 6. Transgenic lines showed starch granules on the xylem rays.
Carbohydrate and lignin analysis
Structural carbohydrate analysis showed that AtGolS3‐OE lines 6 and 11 were significantly different from wild‐type trees (Table 1), exhibiting higher arabinose and galactose levels, whereas rhamnose, xylose and, more significantly, mannose concentrations were reduced. The most remarkable change was an increase in glucose content in all transgenic lines, suggesting higher cellulose content. In accordance with the chemical analysis, cellulose‐specific histochemical staining with calcofluor‐white of stem cross‐sections (Figure 6) showed increased fluorescence. The total lignin content of the transgenic lines was concurrently decreased (Table 1).
Table 1.
Structural cell wall carbohydrates and total lignin content of 5‐month‐old wild‐type and AtGolS3‐OE hybrid poplar trees. Values represent the mean and standard error of the mean in parentheses with bold values corresponding to a statistical difference from wild type (wt) at the 95% level (n = 3)
| Lines | Arabinose, μg/mg | Rhamnose, μg/mg | Galactose, μg/mg | Glucose, μg/mg | Xylose, μg/mg | Mannose, μg/mg | Lignin, % |
|---|---|---|---|---|---|---|---|
| Wt | 3.12 (0.48) | 6.63 (0.52) | 8.65 (0.67) | 466.16 (6.82) | 161.37 (4.58) | 24.64 (0.94) | 24.79 (0.21) |
| line 3 | 3.00 (0.40) | 6.37 (1.79) | 10.80 (1.16) | 509.43 (10.59) | 151.57 (5.62) | 29.02 (0.84) | 23.06 (1.27) |
| line 6 | 7.52 (0.71) | 4.63 (1.03) | 18.61 (2.79) | 540.62 (23.77) | 127.97 (4.87) | 8.73 (0.80) | 18.23 (0.40) |
| line 8 | 3.12 (0.66) | 5.28 (0.12) | 10.06 (1.04) | 481.09 (9.80) | 151.54 (5.66) | 22.54 (0.81) | 23.58 (0.38) |
| line 11 | 8.67 (1.30) | 7.15 (1.35) | 17.02 (0.97) | 509.45 (4.27) | 134.61 (5.25) | 11.39 (1.44) | 19.38 (0.47) |
Figure 6.
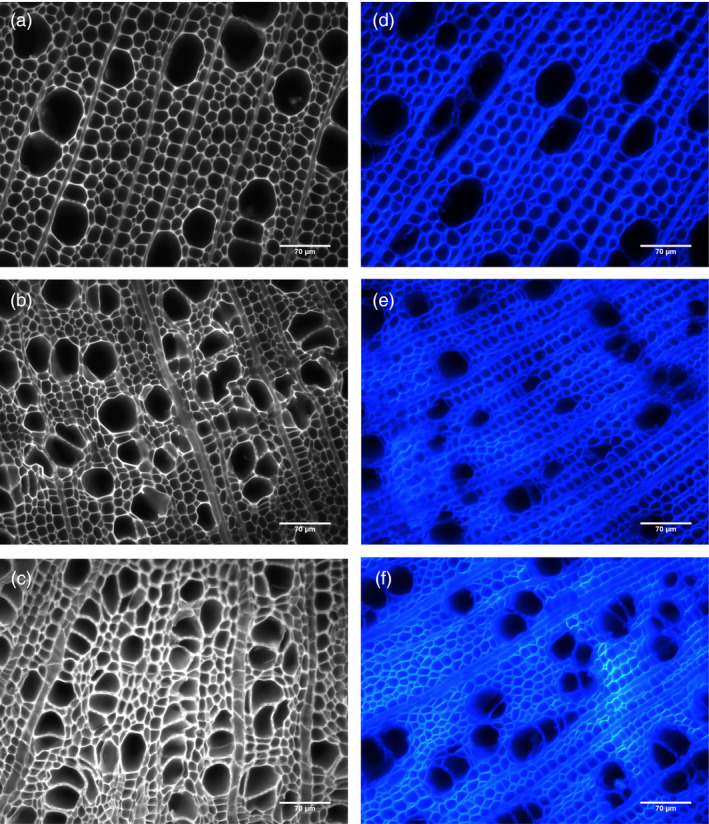
Autofluorescence and calcofluor staining. Autofluorescence (a–c) and calcofluor (d–f) staining of (a, d) wild type, (b, e) AtGolS3‐OE line 6, and (c, f) line 11 hybrid poplar. Transgenic lines show an irregular vessel phenotype and increased cellulose staining with calcofluor‐white (Scale bars: 70 μm).
Microscopic observations of stem cross‐sections of the AtGolS3‐OE lines 6 and 11 showed irregular and smaller vessels, increased number of vessels per unit area (Table 2) and increases in the amount of tissue that appeared to be tension wood (Figure 6, fibres visually more stained with calcofluor, with a gelatinous layer; G‐layer) when compared with wild‐type trees. To further analyze the change in structural carbohydrate content, immuno‐labelling of cross‐sections with antibodies LM10 (anti‐xylan), CCRC‐M7 (anti‐rhamnogalacturonan I) and anti‐(1‐4)‐β‐mannan was used to evaluate lines 6 and 11 relative to wild type. The anti‐xylan antibody LM10 bound evenly to xylem tissue (fibres, vessels and ray parenchyma; Figure 7a–c). Fluorescence was similar in both the transgenic lines and wild type, but binding of the antibody was higher in areas of ‘tension wood’ in all samples and with all antibodies, especially with CCRC‐M7 (RGI) (Figure 7d–f). The anti‐β‐(1‐4)‐D‐mannan binding was noticeably stronger in wild‐type tissue compared with lines 6 and 11 (Figure 7g–i), as is consistent with the substantial reduction in mannose shown by cell wall analyses. In addition, it appears that in wild‐type sections the anti‐mannan binding was enhanced in fibre cell walls when compared to vessels.
Table 2.
Vessel count and quantification of cross‐sections of 5‐month‐old greenhouse‐grown wild‐type and AtGolS3‐OE trees. Values represent the mean and standard error of the mean in parentheses with bold values corresponding to a statistical difference from wild type (wt) at the 95% level (n = 3)
| Lines | Area per vessel (μm2) | Number (per 100 000 μm2) | Length (μm) | Width (μm) |
|---|---|---|---|---|
| wt | 1536.02 (50.03) | 9.99 (0.40) | 48.73 (1.45) | 35.22 (1.84) |
| line 6 | 544.47 (16.31) | 21.44 (1.87) | 30.07 (0.82) | 24.91 (0.78) |
| line 8 | 1427.88 (54.416) | 8.17 (0.48) | 44.61 (1.27) | 33.96 (0.92) |
| line 11 | 338.83 (10.49) | 23.00 (2.14) | 20.15 (0.78) | 17.76 (0.68) |
Figure 7.
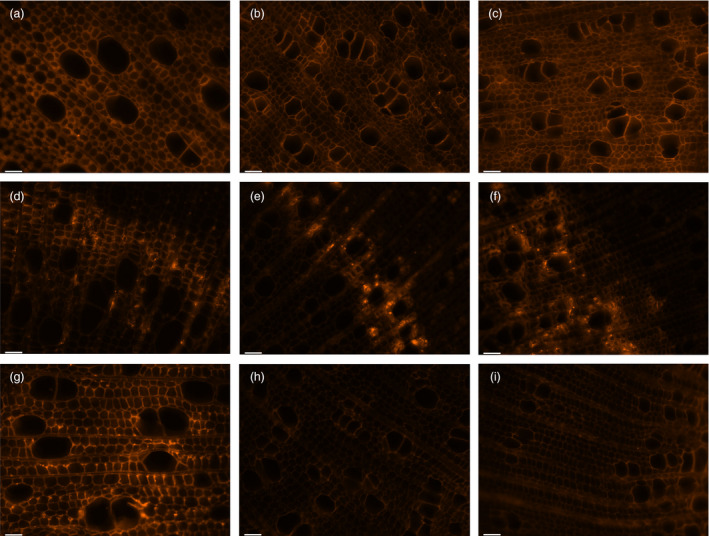
Immunofluorescence labelling of xylem tissue. (a, d and g) Wild type, (b, e and h) AtGolS3‐OE line 6, and (c, f and i) AtGolS3‐OE line 11 hybrid poplar. Tissue was labelled with the anti‐xylan LM10 antibody (a–c); the anti‐RGI CCRC‐M7 antibody (d–f) and the anti‐mannan antibody (G‐I). Bars: 40 μm.
AtGolS3‐OE lines 6 and 11 and wild‐type trees were also analyzed by 2D NMR to study the distribution of the anomerics and lignin without substantially degrading the cell wall polymeric structures. The lignin monomer distribution and abundance did not appear to be altered significantly between the transgenic lines and wild‐type trees; however, the syringyl content was slightly reduced. A striking difference in the lignin was observed, as the p‐hydroxybenzoate moieties, which commonly acylate the lignin polymer side‐chain γ‐OHs, were completely absent in the transgenic lines (Figure 8).
Figure 8.
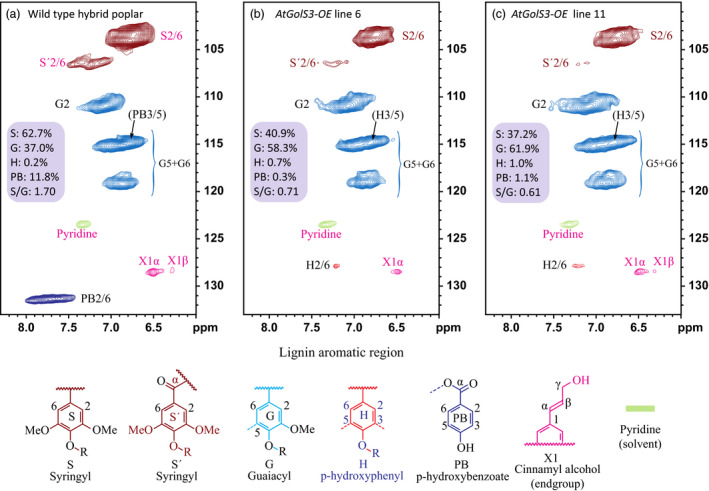
Lignin aromatic regions. 2D 1H–13C correlation (HSQC) NMR spectra from whole‐cell wall gels in DMSO‐d6/pyridine‐d5 (4:1, v/v). (a) Wild‐type Pa×g hybrid poplar, (b) AtGolS3‐OE line 6, (c) AtGolS3‐OE line 11. Correlations from the aromatic C/H pairs are well dispersed and can be categorized by the type of aromatic units (syringyl S, guaiacyl G, p‐hydroxyphenyl H, p‐hydroxybenzoate PB); colour coding is according to the structures shown.
Arabinose (α‐L‐Araf) was readily evident in small amounts in the NMR spectra of the transgenic lines, but not in wild‐type trees. Consistent with wet chemical analysis, mannose (β‐D‐Manp) was considerably reduced (Figure 9), and α‐linked glucose [(1‐4)‐α‐D‐Glcp], that is indicative of starch, appeared in the transgenic lines but was largely absent in the wild‐type spectra.
Figure 9.
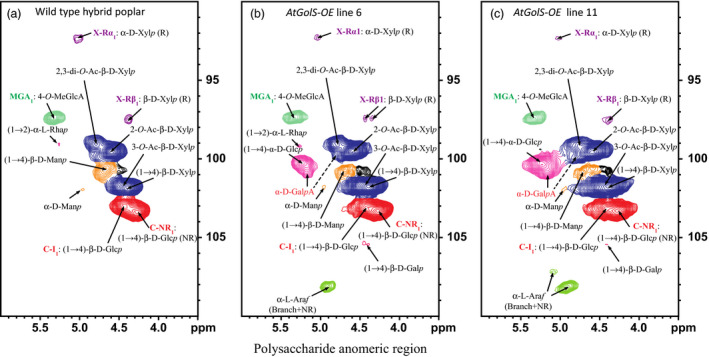
Polysaccharide anomeric regions. 2D 1H–13C correlation (HSQC) NMR spectra from whole‐cell wall gels in DMSO‐d6/pyridine‐d5 (4:1, v/v). (a) Wild‐type Pa×g hybrid poplar, (b) AtGolS3‐OE line 6, (c) AtGolS3‐OE line 11. β‐D‐Glcp, β‐D‐glucopyranoside; α‐D‐Manp, α‐D‐mannopyranoside; β‐D‐Manp, β‐D‐mannopyranoside; β‐D‐Xylp, β‐D‐xylopyranoside; α‐L‐Araf, α‐L‐arabinofuranoside; α‐L‐Rhap, α‐L‐rhamnopyranoside; 2‐O‐Ac‐β‐D‐Xylp, acetylated β‐D‐Xylp; 3‐O‐Ac‐β‐D‐Xylp, acetylated β‐D‐Xylp; 4‐O‐MeGlcA, 4‐O‐methyl‐α‐D‐glucuronic acid; α‐D‐GalpA, α‐D‐galacturonic acid. R, reducing end; NR, non‐reducing end.
Xylem characterization
The xylem properties of the AtGolS3‐OE lines and wild‐type trees were compared. Most of the transgenic lines had higher wood densities, with lines 6 and 11 being substantially higher (575.04 and 543.6 kg/m3, respectively) than the wild type (335.8 kg/m3). Lines 3 and 8 also had increased wood densities, showing average densities of 328.9 and 362.78 kg/m3 (Figure 10a). The wood microfibril angle (MFA) was reduced in lines 6 and 11 (7.69° and 7.44°) when compared with either wild‐type trees (10.20°) or the other transgenic lines examined (10.39° and 10.19° in lines 3 and 8, respectively) (Figure 10a). The per cent cell wall crystallinity also increased in the same lines (51.3% and 55%, respectively) compared with either wild‐type poplar (46.7%) or transgenic lines 3 and 8 (46.0% and 44.7%; Table 3). In addition, based on the fibre length measurement, fibres of lines 3 and 8 were longer than fibres of wild‐type plants as well as lines 6 and 11 (Figure 10b).
Figure 10.
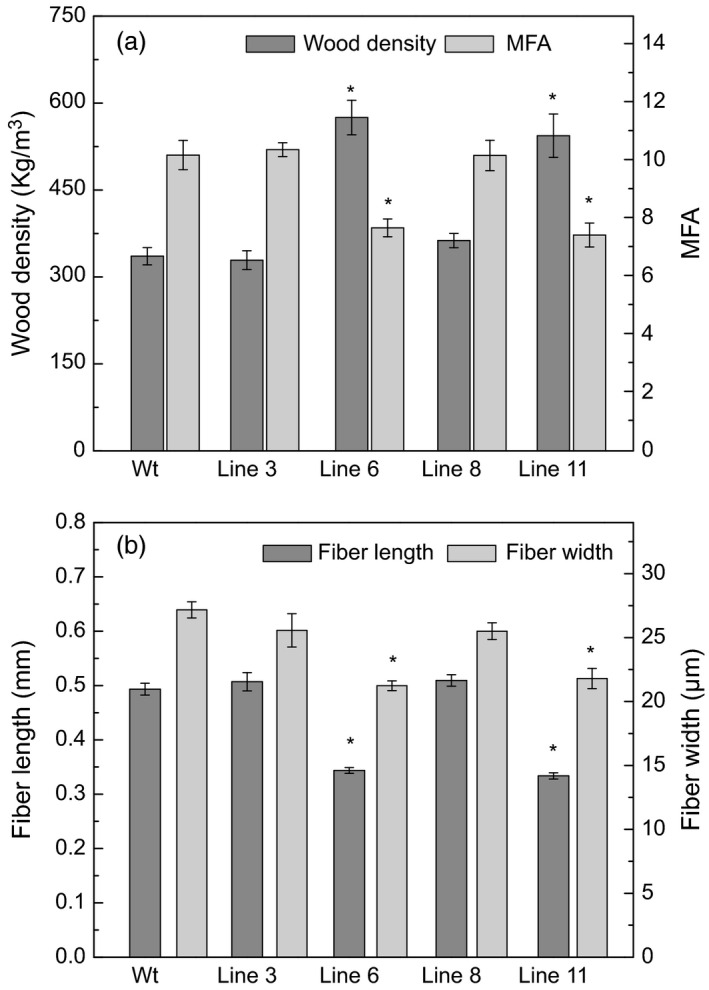
Wood physical properties. (a) Wood density and microfibril angle (MFA) and (b) fibre length and width of 5‐month‐old greenhouse‐grown wild‐type and AtGolS3‐OE hybrid poplar. Bars represent the standard error of the mean (n = 9). Asterisks represent samples statistically different from wild type (wt) at the 95% level.
Table 3.
Crystallinity of 5‐month‐old greenhouse‐grown wild‐type and AtGolS3‐OE hybrid poplar trees. Values represent the mean and standard error of the mean in parentheses with bold values corresponding to a statistical difference from wild type (wt) at the 95% level (n = 3)
| Lines | Crystallinity, % |
|---|---|
| wt | 46.7 (1.2) |
| line 3 | 46.0 (1.5) |
| line 6 | 51.3 (3.4) |
| line 8 | 44.7 (0.9) |
| line 11 | 55.0 (3.4) |
mRNA‐Seq
mRNA‐Seq data were generated and analyzed from source leaf and developing xylem tissue of 5‐month‐old greenhouse‐grown wild type and AtGolS3‐OE line 6. In the leaf, 1655 transcripts were differentially expressed that had at least a twofold change when compared with wild‐type trees of the same age and grown under similar conditions; 61% of the genes were up‐regulated. Additionally, in the developing xylem, 890 transcripts were differentially expressed with a minimum twofold change, and 83% of transcripts were up‐regulated. The overexpression of the AtGolS3 gene had the largest effect at the transcriptional level in leaf tissue compared to the developing xylem (Figure 11).
Figure 11.
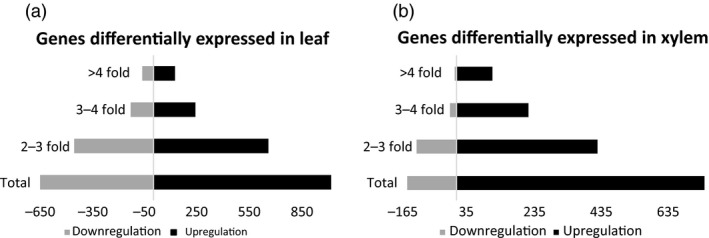
RNA‐Seq. Transcriptional response of the overexpression of the AtGolS3 in hybrid poplar. (a) Differentially expressed genes in leaf tissue and (b) differentially expressed genes in developing xylem.
Differentially expressed genes were uploaded to MapMan to visualize the altered expression in the various biological pathways (Figure S1). In leaf tissue, several transcripts involved in photosynthesis and photorespiration showed down‐regulation in the transgenic lines, whereas genes related to sucrose degradation and inositol metabolism were up‐regulated in leaf tissue. Clearly, altering available sucrose in the sink tissue has a feedback response that triggers a reduction in sucrose production and an increase in sucrose re‐synthesis. Table S1 shows an overview of metabolism by pathways: major CHO metabolism (synthesis and degradation of sucrose and starch), minor CHO metabolism (RFOs, myo‐inositol and callose), signalling (in sugar and nutrient physiology, phosphoinositides and receptor kinases) and hormone metabolism (auxin).
Discussion
The raffinose family of oligosaccharides has been implicated in several intricate plant biological processes, including desiccation tolerance in seeds (Downie et al., 2003; Liu et al., 1995), transport of carbohydrates in the phloem (Volk et al., 1996) and protection of plants against a variety of biotic stress scenarios (Philippe et al., 2010; Taji et al., 2002). In poplar trees specifically, it has been suggested that the galactinol synthase genes play a role in the storage and seasonal mobilization of carbohydrates, in addition to a role in protecting the trees against biotic and abiotic stress (Unda et al., 2012). To further understand the specific function of this gene in planta, we studied the changes in the development of sink tissues caused by the overexpression of galactinol synthase in hybrid poplar. Several cell wall characteristics were altered in the transgenic plants, including cell wall density, MFA, tension wood formation, hemicellulose content, cellulose content and crystallinity, and lignin content and composition.
Plant development relies on intricate signalling systems that deliver information on the existing internal and external conditions. This information includes the status of cellular metabolites such as sugars, which are essential to development, and also participate in complicated signalling systems that respond to metabolite concentrations (Hanson and Smeekens, 2009). These regulatory networks and signalling systems are vital not only to development and growth, but also for the interaction with pathogens and abiotic stress conditions. The altered wood phenotype of the transgenic trees suggests that the overexpression of galactinol synthase or its resulting product (galactinol) may play an important role as a signal molecule to initiate a complex array of metabolic changes aimed at combating global stress. Consequently, it may also be involved in the initiation of tension wood formation, a specialized cell wall alteration known to occur in response to environmental stimuli, such as the gravitropic response that results in its reorientation to the upright position (Gerttula et al., 2015).
Myo‐inositol (Ins) and its derivatives (e.g. Ins‐derived galactinol and RFOs) play important roles in plant stress tolerance, and function either as metabolomic mediators or signalling molecules in various stress response pathways (Valluru and Van den Ende, 2011). For example, Perera et al. (2001) showed an increased concentration of Ins3P (generated by MIPs) in the lower half of the pulvini at the establishment of tissue polarity (during the gravitropic response) in oat shoots, and suggested that this provided the positional information in the pulvini prior to the redistribution of the auxin. Furthermore, it was suggested that actin‐dependent relocalization of PIN3, in response to gravity, provides a mechanism for redirecting auxin flux to trigger asymmetric growth (Friml et al., 2002). In poplar, PIN3 localizes to the endodermal cells containing starch‐filled amyloplast that sediments in response to gravity, suggesting that these are the gravity‐perceiving cells in the stem (Gerttula et al., 2015). Here, we show that the AtGolS3 transgenic lines also accumulate starch bodies in the rays. Moreover, these same trees also show up‐regulation of PIN3 transcripts (mRNA‐Seq, Table S1), suggesting that the transgenic plants sense changes in the soluble Ins flux (several transcripts of the pathway were up‐regulated MIPs, MIOXs, Table S1), initiating a cascade of signalling responses resulting in the altered xylem phenotype. These findings concur with previous studies that implicated galactinol as a signal molecule in plants subjected to biotic stress (Cho et al., 2010; Kim et al., 2008). Additionally, Valluru and Van den Ende (2011) presented a model suggesting that galactinol and the RFOs maintain reactive oxygen species (ROS) homeostasis in plants, and proposed that these sugars may function as endogenous signals acting downstream of ROS signalling.
Wood properties of highly up‐regulated transgenic lines are characteristic of tension wood
Cross‐sections of the extreme AtGolS3 phenotypic lines showed smaller and irregular vessels compared with wild‐type trees. The number of vessels was significantly higher and a clear G‐layer was apparent in the fibres; the G‐layer serves as a characteristic of tension wood formation in angiosperm trees (Mizrachi et al., 2015). Consistent with the visual observations, the MFA was significantly reduced and the cell wall crystallinity increased. In poplar, as in most temperate tree species, tension wood fibres are characterized by the existence of a G‐layer that has microfibrils that are arranged almost parallel to the cell's long axis (Faruya et al., 1970). In the current study, the MFA of two of the AtGolS3‐OE lines (6 and 11) was reduced by approximately 25% compared with wild‐type trees.
In addition to the ultrastructural characteristics, the cell wall mannose content was extremely reduced in the AtGolS3‐OE lines compared with wild‐type trees. Similar results were obtained in the tension wood of G‐fibres in aspen which showed a two‐ to threefold reduction in both mannose and 1,4‐β‐mannan (Hedenstrom et al., 2009). These biochemical findings are consistent with molecular findings, where the inherent levels of mannan biosynthesis‐related transcripts were reduced in differentiating fibres of poplar developing a G‐layer during tension wood formation (Andersson‐Gunneras et al., 2006). We also observed a significant increase in galactan content. Tension wood of other species, such as Eucalyptus goniocalyx (Schwerin, 1958), Betula pubescens and B. verrucosa (Gustafsson et al., 1952), and Fagus sylvatica (Meier, 1962), have been shown to exhibit up to two‐ to fourfold more galactose than normal wood. Kuo and Timell (1969) showed that the G‐fibre galactan in American beech largely consisted of β‐(1→4)‐ and β‐(1→6)‐linked galactopyranoside residues, with a smaller component of galacturonic acid and rhamnose, as the disaccharide 2‐O‐α‐D‐GalAp‐L‐Rha, suggesting the presence of rhamnogalacturonan I (RGI) (Azuma et al., 1983; Kuo and Timell, 1969; Meier, 1962). Another important finding from the current 2D NMR analysis was the strong possibility of the presence of galacturonic acid, concurring with the previous findings. Pectin polysaccharides containing (1→4)‐α‐D‐galacturonic acid are one of the major components of the middle lamella and primary cell wall but are also present in small proportions in secondary cell wall, especially those enriched in gelatinous type cells (Gorshkova et al., 2010). Additionally, galacturonic acid together with rhamnose and galactose was shown to be present in the alkali‐insoluble residue of flax fibre (Mooney et al., 2001) suggesting that the pectic galactan can be tightly bound to cellulose in the secondary cell wall.
Immunofluorescence analysis of the AtGolS3‐OE lines showed that the CCRC‐M7 antibody, which recognizes RGI, bound more intensely to areas where tension wood was found. Similarly, immunochemical studies in sweetgum (Liquidambar styraciflua; Hamamelidaceae) and hackberry (Celtis occidentalis; Ulmaceae) showed that a number of antibodies that recognize arabinogalactan proteins and RGI‐type pectin components bind to the G‐layer (Bowling and Vaughn, 2008). The fact that the tissue is labelled with CCRC‐M7 antibody, which recognizes RGI as well as both soluble and membrane‐bound AGPs, supports the notion that tension wood is not entirely composed of crystalline cellulose. The increase in cellulose content and the alteration of the hemicellulose composition, together with the reduction of lignin content, make this transgenic approach an ideal strategy for poplar and other biomass improvement for industrial processing, especially bioenergy applications.
p‐Hydroxybenzoate groups associated with S lignin are absent from transgenic lines
The total lignin content of the AtGolS3‐OE plants was shown to be slightly, but significantly, reduced. More detailed analysis using 2D NMR showed that the most noticeable change in the lignin structure was the absence of the p‐hydroxybenzoate groups that typically acylate poplar lignins (Figure 8). The γ‐acylated G (guaiacyl) and S (syringyl) units have been identified in the lignins from several species. Although the lignins of grasses have γ‐p‐coumarate substituents on many lignin subunits, poplar, willow and palm have analogous γ‐p‐hydroxybenzoates acylating the primary γ‐OH (Landucci et al., 1992; Meyermans et al., 2000; Ralph, 2010; Smith, 1955). In our study, the 2D NMR showed a slight reduction in the S lignin in the galactinol synthase overexpressed lines and an extreme reduction of its associated p‐hydroxybenzoate, as it was no longer detectable by NMR spectroscopy. Lack of the pendant p‐hydroxybenzoate groups acylating the lignin sub‐units may result in lignin macromolecules that are less ‘bulky’, and therefore more amenable to packing within the highly aligned cellulose microfibrils that dominate the specialized xylem cells comprising the tension wood.
Conclusion
Soluble sugars, similarly to hormones, can act as signals for the expression of genes involved in plant growth and metabolism (Rolland et al., 2006). For example, excess photosynthate in source tissues down‐regulates photosynthesis to maintain homeostasis. Additionally, changes in the carbon balance activate several responses, many of which are still unknown but are expected to be part of the plant's general growth and development.
Galactinol has been studied for its role as the galactosyl donor for the synthesis of raffinose and higher oligosaccharides (i.e. stachyose). The most noticeable phenotype in transgenic plants up‐regulated in galactinol synthase was in the xylem composition resembling tension wood formation. The plants appear to sense the changes in the leaf‐soluble carbon flux due to the augmented production of galactinol, and consequently alter the carbohydrate balance which is also reflected in the increase in starch in xylem tissue (rays). Comparison of the transcript abundance of AtGolS3 transgenic lines and wild‐type plants demonstrated a clear up‐regulation of genes involved in sucrose degradation, as well as an up‐regulation of genes involved in the myo‐inositol pathway. Collectively, the results suggest that the overexpression of GolS, and concomitant elevation of its product galactinol, may serve as a molecular signal that initiates a cascade of metabolic changes for combating stress, culminating in the formation of tension wood in poplar trees. Because of the lower relative levels of lignin, and the higher levels of cellulose and C6‐sugars largely derived from hemicelluloses, in such transgenics, they appear to be better suited as plant substrates for biomass conversion than their wild‐type counterparts. Thus, controlling the level of expression in such transgenics, or using a xylem‐specific promoter, appears to be a suitable strategy to promote tension wood formation, with its commensurate increased cellulose deposition, without affecting agronomic traits for dedicated bioenergy crops such as poplar.
Materials and methods
Plasmid construction
The A. thaliana GolS3 (At1g09350), which was previously shown to be cold‐inducible (Taji et al., 2002), was cloned from Columbia ecotype (CO) cDNA using primers: AtGolS3.Fw 5′‐CGCGGATCCATGGCACCTGAGATGAACAACAAGTTG‐3′ and AtGolS3.Rv 5′‐CGCGAGCTCCTGGTGTTGACAAGAACCTCGCTC‐3′. The cloned GolS gene was ligated into the pSM3 vector (pCambia 1390 containing a double 35S promoter, Mansfield Lab, UBC) using the BamHI and SacI restriction enzymes. The vector was then subjected to genomic sequencing to confirm gene, frame and orientation, and then transformed into Agrobacterium tumefaciens C58 strain, which was used for plant transformation.
Hybrid poplar transformations
Populus alba × grandidentata (P39) leaf discs were harvested from 4‐week‐old tissue‐culture‐grown plants using a cork borer. In all, 20 plates containing 25 leaf discs (7 mm2) per genotype were co‐cultivated with 30 mL of bacterial culture for 30 min at 28 °C in a gyratory shaker (100 rpm). Following co‐cultivation, the explants were blotted dry and placed abaxially on woody plant media (WPM) supplemented with 0.1 NAA, 0.1 μm BA and 0.1 μm TDZ culture medium. The plates were cultured in the dark for two days at room temperature. On the third day, residual Agrobacterium was eliminated by transferring the leaf discs to WPM containing 250 mg/L cefotaxime and 500 mg/L carbenicillin. Plates were kept in the dark for an additional 2 days. Explants were then transferred to WPM selection media containing 250 mg/L cefotaxime, 500 mg/L carbenicillin and 25 mg/L hygromycin. After emergence, only one shoot per leaf disc was excised and placed on WPM selection media. After 6 weeks growth, explants were transferred to fresh medium of the same composition, and permitted to develop. Plants were confirmed as transgenic by genomic DNA screening, and those identified as positive were then sub‐cultured and multiplied on antibiotic‐free WPM.
Plant growth
Transgenic trees were multiplied in WPM until approximately eight plantlets of each transgenic event were of similar size, along with the appropriate control, non‐transformed trees. The trees were then moved to 2 gallon pots containing perennial soil (50% peat, 25% fine bark and 25% pumice; pH 6.0), and maintained on flood tables with supplemental lighting (16 h days) and watered daily with fertilized water in the greenhouse at UBC Vancouver, BC.
Tissue collection
Source leaves were collected using the leaf plastochron index (PI = 5), where PI = 0 was defined as the first leaf greater than 5 cm in length and where PI = 1 is the leaf immediately below PI = 0. Sink leaves were defined as small, not fully expanded leaves. Phloem tissue included the bark, phloem tissue and cambial cells. Developing xylem corresponded to a slight scrapping of the stem immediately adjacent to the cambial zone.
Genomic DNA extraction
The CTAB (Sigma‐Aldrich Co., San Louis, MO) extraction method was used to isolate hybrid poplar DNA. Briefly, the tissue was frozen with liquid N2 and ground to a powder with 1 mL extraction buffer (2% w/v CTAB, 1.4 m NaCl, 20 mm EDTA, 100 mm Tris–HCl, 1% PVP and 0.2% v/v β‐mercaptoethanol). The DNA concentration was measured using a spectrophotometer ND1000 (NanoDrop Technologies, Inc. DE). DNA was stored at −20 °C until further use.
RNA isolation
Hybrid poplar RNA was isolated as per Kolosova et al. (2004), using source and sink leaves, phloem, and developing xylem tissue. The RNA concentration was calculated using a GeneQuant pro or a ND1000 spectrophotometer. DNase I DIGEST kit (Ambion Inc. Burlington, ON) was used to eliminate contaminating DNA, RNA was then quantified and 1 μg was used to generate cDNA using the SuperScript II RT kit (Invitrogen Canada Inc.). cDNA was stored at −20 °C.
PCR analysis of putative transformants
Plants that survived antibiotic selection were evaluated for the presence of the transgene. Transgene detection was established by PCR screening of genomic DNA using gene‐specific primers: AtGolS3scFw 5′‐AGCCTCCCCACTTATTACAAC‐3′ and AtGolS3scRv 5′TGCACAGTAATGAACAACCTT‐3′.
Real‐time PCR (RT‐PCR)
RT‐PCR reactions consisted of 12.5 μL of SYBR® Green QRT‐PCR master mix (Invitrogen, Carlsbad, CA), 20 pmol of AtGolS3scFw and AtGolS3scRv primers (described above), 1 μL of cDNA and distilled deionized water to a total volume of 25 μL. RT‐PCR was performed on an Mx3000P® QPCR System (Stratagene, La Jolla, CA) using the following thermal cycler conditions to amplify a 201 bp fragment of the AtGolS3 transcript: 1 cycle of 5 min at 95 °C, 40 cycles of 95 °C for 30 s, 55 °C for 1 min and 72 °C for 30 s, followed by 1 cycle of 95 °C for 1 min, 55 °C for 30 s and 95 °C for 30 s. Relative expression was calculated using the following equation ∆ct = 2−(ct target gene‐ct TIF5A), where TIF5A was used as the reference gene (Coleman et al., 2009).
Growth measurements
After 4 months of greenhouse growth, tree height from root collar to the apex of the tree was recorded, and stem diameter was measured using digital calipers 10 cm above the root collar (soil level). AtGolS3‐OE lines and corresponding wild‐type trees were harvested after 5 months of growth, and tissues were kept at −80 °C until further use.
Structural chemistry analysis
Dried wood samples from 5‐month‐old greenhouse‐grown trees were used to determine lignin and carbohydrate content following a modified Klason method described by Cullis et al. (2004).
Soluble sugar analysis
Soluble sugar content of phloem, developing xylem, source and sink leaf tissue was analyzed following the procedure by Coleman et al. (2006) with some modifications. An aliquot (1 mL) of the upper phase from the extraction was collected and dried using a vacuum centrifuge. The pellet was resuspended in 1 mL of water and analyzed for sucrose, raffinose, galactinol and myo‐inositol on an Dionex HPLC fitted with a PA 200 (sucrose and raffinose) and a MA‐1 (myo‐inositol and galactinol) column (Dionex) with 600 mm NaOH at 0.5 mL/min. Fucose was added as internal standard.
Starch analysis
The pellet retained from the soluble sugar isolation was dried overnight in a 50 °C oven and extracted according to Coleman et al. (2006), An aliquot of the supernatant was analyzed by HPLC to quantify glucose release, representing the starch that was hydrolyzed by the acid treatment, using the same conditions as described above.
Cell wall characterization
Fibre length, wood density and microfibril angle were measured according to Ukrainetz et al. (2008) with some modifications. Fibre length was determined on a 1‐cm segment isolated from sections taken 10 cm above the root collar. Fibre length (in mm) was estimated for each sample by measuring 10 000 fibres. Wood density was determined in bark‐to‐bark samples isolated from sections taken 9 cm above the root collar. Density was measured on both sides of the pith and averaged for each sample.
Microfibril angle (MFA) and cell wall crystallinity were determined by X‐ray diffraction using a Bruker D8 Discover X‐ray diffraction unit. Both the X‐ray source and the detector were set to θ = 0° for MFA determination. The average T value of the two 002 diffraction arc peaks was used for MFA calculations, as per the method of Megraw et al. (1998). In contrast, the 2θ (source) was set to 17° for wood crystallinity determination. Crystallinity was determined by mathematically fitting the data using the method of Vonk (1973). Crystallinity measures were pre‐calibrated by capturing diffractograms of pure A. xylinum bacterial cellulose known to be 87% crystalline.
Cross‐sectional staining and microscopy
Wood samples from 6‐month‐old AtGolS3‐OE trees were soaked overnight in dH2O. Samples were then cut into 40 μm cross‐sections with a Spencer AO860 hand sliding microtome (Spencer Lens Co., Buffalo, NY) and stored with dH2O until visualized. Sections were treated with 0.01% Calcofluor‐white in 1× PBS for 3 min, and then washed 3 × 5 min in 1× PBS for cellulose staining (Falconer and Seagull, 1985). Sections were also treated with a saturated solution of phloroglucinol in 10% HCl for lignin staining. Cross‐sections were treated with Lugol's solution (2% KI and 0.2% Iodine) to visualize starch. The sections were mounted onto glass slides and visualized with a Leica DRM microscope (Leica Microsystems, Wetzlar, Germany). Pictures were taken with a QICam camera (Q‐imaging, Surrey, BC) and analyzed with OpenLab 4.0Z software (PerkinElmer Inc., Waltham, MA).
Vessel number, length and area were calculated from the 40 μm cross‐sections stained with phloroglucinol. Three trees per line were analyzed. Pictures were taken in different zones of the sections and approximately 180 vessel areas were measured per tree. The sections were analyzed on the Carl Zeiss Jena ‘Jenamed’ 2 fluorescence microscope (Carl Zeiss Microscopy LLC, NY). Photos were taken with an Infinity 3 camera (Lumenera Corporation, Ottawa, ON) and analyzed with the Infinity capture program.
Antibody labelling
The prepared cross‐section samples (described above) were subjected to antibody labelling. Briefly, nonspecific protein binding was blocked with 5% BSA in TBST (10 mm Tris‐buffer, 0.25 m NaCl, pH 7, with 0.1% Tween 20) for 20 min. Sections were then treated with diluted primary antibody (1:50), anti‐β‐(1–4)‐β‐mannan monoclonal antibody (catalogue #400‐4; Biosupplies Australia Pty Ltd, Melbourne, Australia), anti‐xylan LM10 antibody (kind gift of Dr. J. Paul Knox; www.plantprobes.co.uk) or CCRC‐M7 against RGI (Puhlmann et al., 1994) at room temperature for 1 h. The sections were then washed twice with TBST for 5 min. The diluted secondary antibody (Alexa 543: anti‐rat or anti‐mouse) 1:50 was added, incubated for 1 h and washed twice with TBST. Samples were mounted on glass slides with 90% glycerol or anti‐fade mounting media. Fluorescent localization was observed on a Leica DRM (Leica Microsystems) light microscope using a Texas Red filter, and images captured with a QICam camera (Qimaging) and analyzed with OpenLab 4.0Z software (Perkinelmer Inc.). The antibody‐tagged sections were stored at 4 °C in TBST 1× in microfuge tubes if they were not used immediately.
NMR
NMR analysis was performed as described in the recent protocol (Mansfield et al., 2012). Briefly, plant biomass was air‐dried to a constant moisture content and cryogenically pre‐ground for 2 min at 30 Hz using a Retsch (Newtown, PA) MM301 mixer mill. Approximately, 30–60 mg of extract‐free, ball‐milled plant cell wall material was transferred to a 5‐mm NMR tube, and 500 μL of pre‐mixed DMSO‐d6/pyridine‐d5 (4:1) was added directly into the NMR tube containing individual samples. The NMR tubes were then placed in an ultrasonic bath and sonicated for 1–5 h, until the gel became homogeneous. 2D 1H–13C HSQC spectra were acquired using a standard Bruker pulse program (‘hsqcetgpsisp.2’ or ‘hsqcetgpsisp2.2’) Bruker Biospin (Billerica, MA) AVANCE 700 MHz spectrometer fitted with a cryogenically cooled 5‐mm QCI (1H/31P/13C/15N) gradient probe with inverse geometry (proton coils closest to the sample). The central residual DMSO peak was used as the internal reference (δC, 39.52 ppm; δH, 2.50 ppm). Interactive integrations of contours in 2D HSQC plots were carried out using Bruker's TopSpin 3.5 (Mac) software, as well as all data processing.
Statistical analysis
Parametric or non‐parametric Student's t‐tests were performed (depending on equal or non‐equal variances). Student's t‐test values were calculated with Microsoft Excel (Microsoft Corp., WA). Significant differences were calculated between wild‐type trees and transgenic lines at the 95% confidence level.
RNA purification, library construction and sequencing
RNA‐Seq data were analyzed from cambium/bark, developing xylem and source leaf tissue of 5‐month‐old wild type and AtGolS3‐OE poplar (line 6). Tissue was ground on mortar and pestle under liquid N. RNA was extracted and purified using the PureLink® Plant RNA Reagent (Invitrogen) following the manufacturer's protocol. Subsequently, RNA was purified using RNeasy Plant Mini Kit (Qiagen Inc., Toronto, ON) with the RNA Cleanup and On‐Column DNase digestion steps following the manufacturer's protocol. RNA quantification and quality were measured with a 2100 BioAnalyzer instrument (Agilent Technologies, Santa Clara, CA). Samples with RIN (RNA integrity number) above 7 were processed at the Michael Smith Genome Sciences Centre (Vancouver, BC) where the library was assembled and the transcriptome sequenced. Sequencing was carried out on an Illumina HiSeq instrument (Illumina Inc., San Diego, CA).
mRNA‐Seq data processing and quality control
The raw RNA‐Seq data were analyzed using a local Galaxy pipeline (http://usegalaxy.org) as described by Hefer et al. (2015) with some modifications. Paired end reads were trimmed to remove low‐quality reads and adapters using Trimmomatic (reads with average quality of 20 were kept and reads shorter than 50 bp were discarded; Bolger et al., 2014). Tophat v. 2.0.8 (Trapnell et al., 2012) was then used to map the trimmed reads to v3.0 of the P. trichocarpa genome (www.phytozome.com). Cufflinks v2.1.1 (Trapnell et al., 2012) was used to calculate fragments per kilobase of transcript per million mapped reads (FPKM) values for each transcript. MapMan (http://mapman.gabipd.org/web/guest/home) was used to visualize the data.
Supporting information
Figure S1. MapMan visualization of the transcriptional response of poplar to the overexpression of the AtGolS3.
Table S1. Differentially expressed genes in transgenic poplar overexpressing AtGolS3 poplar leaves.
Acknowledgements
The research was supported by an NSERC Postgraduate Scholarships‐Doctoral (PGS‐D) to FU, NSERC Discovery Grant to SDM, and HK, JR and SDM were funded by the DOE Great Lakes Bioenergy Research Center (DOE Office of Science BER DE‐FC02‐07ER64494). The authors declare no conflict of interest.
Accession number: AtGolS3 (At1g09350), Gene ID: 837457, Genomic Sequence: NC_003070.9
References
- Andersson‐Gunneras, S. , Mellerowicz, E. , Love, J. , Segerman, B. , Ohmiya, Y. , Coutinho, P. , Nilsson, P. et al. (2006) Biosynthesis of cellulose‐enriched tension wood in Populus: global analysis of transcripts and metabolites identifies biochemical and developmental regulators in secondary wall biosynthesis. Plant J. 45, 144–165. [DOI] [PubMed] [Google Scholar]
- Azuma, J. , Fujii, M. and Koshijima, T. (1983) Studies on hemicelluloses in tension wood. II. Structural studies on xylans from tension, opposite and side woods of Japanese beech (Fagus crenata Blume). Wood Res. 69, 12–21. [Google Scholar]
- Barratt, D.H.P. , Derbyshire, P. , Findlay, K. , Pike, M. , Wellner, N. , Lunn, J. , Feil, R. et al. (2009) Normal growth of Arabidopsis requires cytosolic invertase but not sucrose synthase. Proc. Natl. Acad. Sci. USA, 106, 13124–13129. [DOI] [PMC free article] [PubMed] [Google Scholar]
- Bolger, A.M. , Lohse, M. and Usadel, B. (2014) Trimmomatic: a flexible trimmer for illumina sequence data. Bioimformaticas, 5, 2114–21120. [DOI] [PMC free article] [PubMed] [Google Scholar]
- Bowling, A.J. and Vaughn, K.C. (2008) Immunocytochemical characterization of tension wood: Gelatinous fibers contain more than just cellulose. Am. J. Bot. 95, 655–663. [DOI] [PubMed] [Google Scholar]
- Canam, T. , Park, J. , Yu, K.Y. , Campbell, M.M. , Ellis, D.D. and Mansfield, S.D. (2006) Varied growth, biomass and cellulose content in tobacco expressing yeast‐derived invertases. Planta, 224, 1315–1327. [DOI] [PubMed] [Google Scholar]
- Canam, T. , Mak, S.W.Y. and Mansfield, S.D. (2008a) Spatial and temporal expression profiling of cell‐wall invertase genes during early development in hybrid poplar. Tree Physiol. 28, 1059–1067. [DOI] [PubMed] [Google Scholar]
- Canam, T. , Unda, F. and Mansfield, S.D. (2008b) Heterologous expression and functional characterization of two hybrid poplar cell‐wall invertases. Planta, 228, 1011–1019. [DOI] [PubMed] [Google Scholar]
- Cho, S.M. , Kang, E.Y. , Kim, M.S. , Yoo, S.J. , Im, Y.J. , Kim, Y.C. , Yang, K.Y. et al. (2010) Jasmonate‐dependent expression of a galactinol synthase gene is involved in priming of systemic fungal resistance in Arabidopsis thaliana . Botany, 88, 452–461. [Google Scholar]
- Coleman, H. , Ellis, D. , Gilbert, M. and Mansfield, S. (2006) Up‐regulation of sucrose synthase and UDP‐glucose pyrophosphorylase impacts plant growth and metabolism. Plant Biotechnol. J. 4, 87–101. [DOI] [PubMed] [Google Scholar]
- Coleman, H.D. , Samuels, A.L. , Guy, R.D. and Mansfield, S.D. (2008) Perturbed lignification impacts tree growth in hybrid poplar‐a function of sink strength, vascular integrity, and photosynthetic assimilation. Plant Physiol. 148, 1229–1237. [DOI] [PMC free article] [PubMed] [Google Scholar]
- Coleman, H.D. , Yan, J. and Mansfield, S.D. (2009) Sucrose synthase affects carbon partitioning to increase cellulose production and altered cell wall ultrastructure. Proc. Natl. Acad. Sci. USA, 106, 13118–13123. [DOI] [PMC free article] [PubMed] [Google Scholar]
- Cullis, I.F. , Saddler, J.N. and Mansfield, S.D. (2004) Effect of initial moisture content and chip size on the bioconversion efficiency of softwood lignocellulosics. Biotechnol. Bioeng. 85, 413–421. [DOI] [PubMed] [Google Scholar]
- Cunningham, S.M. , Nadeau, P. , Castonguay, Y. , Laberge, S. and Volenec, J.J. (2003) Raffinose and stachyose accumulation, galactinol synthase expression, and winter injury of contrasting alfalfa germplasms. Crop Sci. 43, 562–570. [Google Scholar]
- Downie, B. , Gurusinghe, S. , Dahal, P. , Thacker, R.R. , Snyder, J.C. , Nonogaki, H. , Yim, K. et al. (2003) Expression of a GALACTINOL SYNTHASE gene in tomato seeds is up‐regulated before maturation desiccation and again after imbibition whenever radicle protrusion is prevented. Plant Physiol. 131, 1347–1359. [DOI] [PMC free article] [PubMed] [Google Scholar]
- Falconer, M.M. and Seagull, R.W. (1985) Xylogenesis in tissue‐culture: Taxol effects on microtubule reorientation and lateral association in differentiating cells. Protoplasma, 128, 157–166. [Google Scholar]
- Faruya, N. , Takahashi, S. and Miazaki, H. (1970) The chemical composition of the gelatinous layer from the tension wood of Populus euramericana . J. Jap. Wood Res. Soc., 16, 26–30. [Google Scholar]
- Friml, J. , Wisniewska, J. , Benkova, E. , Mendgen, K. and Palme, K. (2002) Lateral relocation of auxin efflux regulator PIN3 mediates tropism in Arabidopsis. Nature, 415, 806–809. [DOI] [PubMed] [Google Scholar]
- Gerttula, S. , Zinkgraf, M. , Muday, G.K. , Lewis, D.R. , Ibatullin, F.M. , Brumer, H. , Hart, F. et al. (2015) Transcriptional and hormonal regulation of gravitropism of woody stems in Populus . Plant Cell, 27, 2800–2813. [DOI] [PMC free article] [PubMed] [Google Scholar]
- Gorshkova, T.A. , Gurjanov, O.P. , Mikshina, P.V. , Ibragimova, N.N. , Mokshina, N.E. , Salnikov, V.V. , Ageeva, M.V. et al. (2010) Specific type of secondary cell wall formed by plant fibers. Russ. J. Plant Physiol. 57, 328–341. [Google Scholar]
- Gustafsson, C. , Ollinmaa, P.J. and Saarnio, J. (1952) The carbohydrates in birchwood. Acta Chem. Scand. 6, 1299–1300. [Google Scholar]
- Hanson, J. and Smeekens, S. (2009) Sugar perception and signaling – an update. Curr. Opin. Plant Biol. 12, 562–567. [DOI] [PubMed] [Google Scholar]
- Hedenstrom, M. , Wiklund‐Lindstrom, S. , Oman, T. , Lu, F. , Gerber, L. , Schatz, P. , Sundberg, B. et al. (2009) Identification of lignin and polysaccharide modifications in Populus wood by chemometric analysis of 2D NMR spectra from dissolved cell walls. Molecular Plant, 2, 933–942. [DOI] [PubMed] [Google Scholar]
- Hefer, C.A. , Mizrachi, E. , Myburg, A.A. , Douglas, C.J. and Mansfield, S.D. (2015) Comparative interrogation of the developing xylem transcriptomes of two wood‐forming species: Populus trichocarpa and Eucalyptus grandis . New Phytol. 206, 1391–1405. [DOI] [PubMed] [Google Scholar]
- Kim, M.S. , Cho, S.M. , Kang, E.Y. , Im, Y.J. , Hwangbo, H. , Kim, Y.C. , Ryu, C. et al. (2008) Galactinol is a signaling component of the induced systemic resistance caused by Pseudomonas chlororaphis O6 root colonization. Mol. Plant‐Microbe Interact, 21, 1643–1653. [DOI] [PubMed] [Google Scholar]
- Kolosova, N. , Miller, B. , Ralph, S. , Ellis, B.E. , Douglas, C. , Ritland, K. and Bohlmann, J. (2004) Isolation of high‐quality RNA from gymnosperm and angiosperm trees. Biotechniques, 36, 821–824. [DOI] [PubMed] [Google Scholar]
- Kuo, C.M. and Timell, T.E. (1969) Isolation and characterization of a galactan from tension wood of American beech (Fagus grandifolia Ehrl). Svensk Papperstidning‐Nordisk Cellulosa, 72, 703‐&. [Google Scholar]
- Kutschera, U. and Heiderich, A. (2002) Sucrose metabolism and cellulose biosynthesis in sunflower hypocotyls. Physiol. Plantarum, 114, 372–379. [DOI] [PubMed] [Google Scholar]
- Landucci, L. , Deka, G. and Roy, D. (1992) A 13C NMR study of milled wood lignins from hybrid Salix Clones. Holzforschung, 46, 505–511. [Google Scholar]
- Leplé, J. , Dauwe, R. , Morreel, K. , Storme, V. , Lapierre, C. , Pollet, B. , Naumann, A. et al. (2007) Downregulation of cinnamoyl‐coenzyme a reductase in poplar: Multiple‐level phenotyping reveals effects on cell wall polymer metabolism and structure. Plant Cell, 19, 3669–3691. [DOI] [PMC free article] [PubMed] [Google Scholar]
- Liu, J.J.J. , Odegard, W. and Delumen, B.O. (1995) Galactinol synthase from kidney bean cotyledon and zucchini leaf. Purification and N‐terminal sequences. Plant Physiol. 109, 505–511. [DOI] [PMC free article] [PubMed] [Google Scholar]
- Maloney, V.J. , Park, J. , Unda, F. and Mansfield, S.D. (2015) Sucrose phosphate synthase and sucrose phosphate phosphatase interact in planta and promote plant growth and biomass accumulation. J. Exp. Bot. 66, 4383–4394. [DOI] [PMC free article] [PubMed] [Google Scholar]
- Mansfield, S. , Kim, H. , Lu, F. and Ralph, J. (2012) Whole plant cell wall characterization using solution‐state 2D NMR. Nat. Protoc. 7, 1–11. [DOI] [PubMed] [Google Scholar]
- Megraw, R. , Leaf, G. and Bremer, D. (1998) Longitudinal shrinkage and microfibril angle in Loblolly pine. In Microfibril Angle in Wood:, University of Canterbury Press, Christchurch NZ 27–61.
- Meier, H. (1962) Studies on a galactan from tension wood of beech (Fagus silvatica L.). Acta Chem. Scand. 16, 2275‐&. [Google Scholar]
- Meyermans, H. , Morreel, K. , Lapierre, C. , Pollet, B. , De Bruyn, A. , Busson, R. , Herdewijn, P. et al. (2000) Modifications in lignin and accumulation of phenolic glucosides in poplar xylem upon down‐regulation of caffeoyl‐coenzyme A O‐methyltransferase, an enzyme involved in lignin biosynthesis. J. Biol. Chem. 275, 36899–36909. [DOI] [PubMed] [Google Scholar]
- Miller, A. , Schlagnhaufer, C. , Spalding, M. and Rodermel, S. (2000) Carbohydrate regulation of leaf development: Prolongation of leaf senescence in Rubisco antisense mutants of tobacco. Photosynthesis Res. 63, 1–8. [DOI] [PubMed] [Google Scholar]
- Mizrachi, E. , Maloney, V.J. , Silberbauer, J. , Hefer, C.A. , Berger, D.K. , Mansfield, S.D. and Myburg, A.A. (2015) Investigating the molecular underpinnings underlying morphology and changes in carbon partitioning during tension wood formation in Eucalyptus. New Phytol. 206, 1351–1363. [DOI] [PubMed] [Google Scholar]
- Mooney, C. , Stolle‐Smits, T. , Schols, H. and de Jong, E. (2001) Analysis of retted and non retted flax fibres by chemical and enzymatic means. J. Biotechnol. 89, 205–216. [DOI] [PubMed] [Google Scholar]
- Munnik, T. and Vermeer, J.E.M. (2010) Osmotic stress‐induced phosphoinositide and inositol phosphate signalling in plants. Plant, Cell Environ. 33, 655–669. [DOI] [PubMed] [Google Scholar]
- Panikulangara, T.J. , Eggers‐Schumacher, G. , Wunderlich, M. , Stransky, H. and Schoffl, F. (2004) Galactinol synthase1. A novel heat shock factor target gene responsible for heat‐induced synthesis of raffinose family oligosaccharides in Arabidopsis. Plant Physiol. 136, 3148–3158. [DOI] [PMC free article] [PubMed] [Google Scholar]
- Park, A. , Canam, T. , Kang, K. , Ellis, D.D. and Mansfield, S.D. (2008) Over‐expression of an Arabidopsis family A sucrose phosphate synthase (SPS) gene alters plant growth and fibre development. Transgenic Res. 17, 181–192. [DOI] [PubMed] [Google Scholar]
- Perera, I. , Hilmann, I. , Chang, S. , Boss, W. and Kaufman, P. (2001) A role for inositol 1,4,5‐trisphosphate in gravitropic signaling and the retention of cold‐perceived gravistimulation of oat shoot pulvini. Plant Physiol. 125, 1499–1507. [DOI] [PMC free article] [PubMed] [Google Scholar]
- Perera, I. , Davis, A. , Galanopilou, D. , Im, Y. and Boss, W. (2005) Characterization and comparative analysis of Arabidopsis phosphatidylinositol phosphate 5‐kinase 10 reveals differences in Arabidopsis and human phosphatidylinositol phosphate kinases. FEBS Lett. 579, 3427–3432. [DOI] [PubMed] [Google Scholar]
- Philippe, R.N. , Ralph, S.G. , Mansfield, S.D. and Bohlmann, J. (2010) Transcriptome profiles of hybrid poplar (Populus trichocarpa× deltoides) reveal rapid changes in undamaged, systemic sink leaves after simulated feeding by forest tent caterpillar (Malacosoma disstria). New Phytol. 188, 787–802. [DOI] [PubMed] [Google Scholar]
- Puhlmann, J. , Bucheli, E. , Swain, M.J. , Dunning, N. , Albersheim, P. , Darvill, A.G. and Hahn, M.G. (1994) Generation of monoclonal‐antibodies against plant cell‐wall polysaccharides. I. Characterization of a monoclonal‐antibody to a terminal α‐(1→2)‐linked fucosyl‐containing epitope. Plant Physiol. 104, 699–710. [DOI] [PMC free article] [PubMed] [Google Scholar]
- Raines, C.A. and Paul, M.J. (2006) Products of leaf primary carbon metabolism modulate the developmental programme determining plant morphology. J. Exp. Bot. 57, 1857–1862. [DOI] [PubMed] [Google Scholar]
- Ralph, J. (2010) Hydroxycinnamates in lignification. Phytochem. Rev. 9, 65–83. [Google Scholar]
- Reich, P. , Walters, M. and Ellsworth, D. (1997) From tropics to tundra: Global convergence in plant functioning. Proc. Natl. Acad. Sci. USA, 94, 13730–13734. [DOI] [PMC free article] [PubMed] [Google Scholar]
- Rolland, F. and Sheen, J. (2005) Sugar sensing and signalling networks in plants. Biochem. Soc. Trans. 33, 269–271. [DOI] [PubMed] [Google Scholar]
- Rolland, F. , Baena‐Gonzalez, E. and Sheen, J. (2006) Sugar sensing and signaling in plants: Conserved and novel mechanisms. Annu. Rev. Plant Biol. 57, 675–709. [DOI] [PubMed] [Google Scholar]
- Russin, W. and Evert, R. (1985) Studies on the leaf of Populus deltoides (Salicaceae): Ultrastructure, plasmodesmatal frequency, and solute concentrations. Am. J. Bot. 72, 1232–1247. [Google Scholar]
- Schwerin, G. (1958) The chemistry of reaction wood. Part II. The polysaccharides of Eucalyptus goniocalyx and Pinus radiata . Holzforschung, 12, 43–48. [Google Scholar]
- Sharkey, T. , Laporte, M. , Lu, Y. , Weise, S. and Weber, A. (2004) Engineering plants for elevated CO2: A relationship between starch degradation and sugar sensing. Plant Biol. 6, 280–288. [DOI] [PubMed] [Google Scholar]
- Slewinski, T.L. , Zhang, C. and Turgeon, R. (2013) Structural and functional heterogeneity in phloem loading and transport. Front Plant Sci. 4, 244. [DOI] [PMC free article] [PubMed] [Google Scholar]
- Smith, D. (1955) p‐Hydroxybenzoate groups in the lignin of Aspen (Populus tremula). J. Chem. Soc. 1955, 2347–2351. [Google Scholar]
- Sturm, A. (1999) Invertases. Primary structures, functions, and roles in plant development and sucrose partitioning. Plant Physiol. 121, 1–7. [DOI] [PMC free article] [PubMed] [Google Scholar]
- Taji, T. , Ohsumi, C. , Iuchi, S. , Seki, M. , Kasuga, M. , Kobayashi, M. , Yamaguchi‐Shinozaki, K. et al. (2002) Important roles of drought‐ and cold‐inducible genes for galactinol synthase in stress tolerance in Arabidopsis thaliana . Plant J. 29, 417–426. [DOI] [PubMed] [Google Scholar]
- Telewski, F.W. (2006) A unified hypothesis of mechanoperception in plants. Am J Bot 93, 1466–1476. [DOI] [PubMed] [Google Scholar]
- Trapnell, C. , Roberts, A. , Goff, L. , Pertea, G. , Kim, D. , Kelley, D.R. , Pimentel, H. et al. (2012) Differential gene and transcript expression analysis of RNA‐Seq experiments with TopHat and Cufflinks. Nat. Protoc. 7, 562–578. [DOI] [PMC free article] [PubMed] [Google Scholar]
- Tsai, C. , Mielke, M. , Popko, J. , Podila, G. and Chiang, V. (1997) Novel wood coloration and altered lignin composition in transgenic aspen through manipulation of caffeic acid 5‐hydroxyferulic acid O‐methyltransferase gene expression. Plant Physiol. 114, 1570. [Google Scholar]
- Ukrainetz, N.K. , Ritland, K. and Mansfield, S.D. (2008) Identification of quantitative trait loci for wood quality and growth across eight full‐sib coastal Douglas‐fir families. Tree Genet. Genom. 4, 159–170. [Google Scholar]
- Unda, F. , Canam, T. , Preston, L. and Mansfield, S.D. (2012) Isolation and characterization of galactinol synthases from hybrid poplar. J. Exp. Bot. 63, 2059–2069. [DOI] [PMC free article] [PubMed] [Google Scholar]
- Valluru, R. and Van den Ende, W. (2011) Myo‐inositol and beyond – Emerging networks under stress. Plant Sci. 181, 387–400. [DOI] [PubMed] [Google Scholar]
- Volk, G. , Turgeon, R. and Beebe, D. (1996) Secondary plasmodesmata formation in the minor‐vein phloem of Cucumis melo L and Cucurbita pepo L. Planta, 199, 425–432. [Google Scholar]
- Vonk, C.G. (1973) Computerization of rulands X‐ray method for determination of crystallinity in polymers. J. Appl. Crystallogr. 6, 148–152. [Google Scholar]
- Wiese, A. , Elzinga, N. , Wobbes, B. and Smeekens, S. (2004) A conserved upstream open sucrose‐induced repression reading frame mediates of translation. Plant Cell, 16, 1717–1729. [DOI] [PMC free article] [PubMed] [Google Scholar]
Associated Data
This section collects any data citations, data availability statements, or supplementary materials included in this article.
Supplementary Materials
Figure S1. MapMan visualization of the transcriptional response of poplar to the overexpression of the AtGolS3.
Table S1. Differentially expressed genes in transgenic poplar overexpressing AtGolS3 poplar leaves.


