Abstract
Waveguide based optofluidic resonator features high precision and high sensitivity in real-time fluorescent analysis. We present a novel optofluidic resonator following the hollow-core metal-cladding waveguide structure, which is then used to record the real-time binding process of Fe2+ and Fe3+ with protoporphyrin IX (PpIX) in PBS solution, respectively. The central fluorescent wavelength of compound with Fe2+ is in good accordance with that of the normal hemoglobin, whilst the peaks of the Fe3+ compound match the hemoglobin specimen from sickle-cell disease (SCD) patients. Similar statement holds when we monitor the real-time oxidation processes of these products by injecting oxygen into the optofluidic chip. These observations lead to the speculation that the SCD is caused by replacing the Fe2+ in hemoglobin with Fe3+, which may be insightful in the discovery of new clinical routes to cure this disease.
Introduction
Sickle cell disease (SCD) occurs when the mutant sickle hemoglobin (Hb S) differs from the normal hemoglobin A by a single amino acid1–5. More than 300,000 children suffer from SCD in Africa every year6, 7, and the mortality is very high due to acute vaso-occlusive crises and increased risk of bacteremia8, 9. Although inexpensive interventions such as penicillin prophylaxis, vaccinations can be used to limit infection; and most of the childhood mortality could be avoided, if simple interventions and necessary diagnosis are accessible. Still more than 50% of children under 5 years of age die in low resource areas10–13. Many Studies analyzed the structural and physical properties of Hb S, which forms intracellular polymers upon deoxygenation. These investigations on SCD take place at the leading edge of the efforts devoted to elucidate the molecular basis of human disease. Pioneering studies by Pauling et al. established that SCD results from a defect in the hemoglobin molecule. Molecule fluorescent techniques have emerged as a powerful approach to describe bio-molecule structure, monitor reaction kinetics and detect molecule mutation. During the past decade, numerous applications based on the high-sensitivity fluorescent detection have been introduced, including DNA sequencing14, DNA fragment analysis15, fluorescence staining of gels following electrophoretic separations16, and a variety of fluorescence immunoassays17. Many present applications can be traced back to the early reports18, which has already anticipated them in advance. These efforts on the bio-molecule fluorescent are driven by the desire to eliminate the use of radioactive tracers, which are expensive to use and dispose of. However, the fluorescence technique has not received much attention in SCD clinicopathologic analysis. There is also an urgent need for rapid and low-cost testing methods, which are capable in a wide range of clinical, bioprocess, and environmental applications19. The purpose of this paper is twofold. First we illustrate the enhancement effect of the fluorescence spectra via a simple metallic waveguide structure by applying this technique to SCD. Second, we point out a possible clue that related with the SCD, which would be insightful in the searching of cure method. In our hypothesis, the heme in normal blood, which consists of Fe2+ and Protoporphyrin IX, can combine with and carry oxygen atom. In the contrast, Metheme exists in the blood of SCD patient and leads to the oxidized form of heme containing Fe3+ instead of Fe2+, which is incapable of binding oxygen.
The optofluidic resonator we used in this paper adopts the basic design of the symmetrical metal cladding optical waveguide structure20, where a fluidic chamber is inserted in the guiding layer. This kind of slab waveguide provides high-quality confinement to achieve efficient amplification of the radiation, which can be applied to enhance the fluorescence intensity. The quality factors Q, the spontaneous emission rate enhancement ration η of the hollow-core metal-cladding optofluidic resonator are detailed discussed in the supplementary information.Let us begin with the fluorescence spectrum of the hemoglobin specimen from the SCD patient and the healthy person. The Protoporphyrin, Hemoglobin and Sickle Hemoglobin provided by Ruijin Hospital (Informed consent was obtained from all subjects) are injected into the optofluidic resonator for fluorescent detection, and the concentrations of these samples are 10−9 g/ml. The structural parameters of the optofluidic resonator and the experimental setup will be described later.
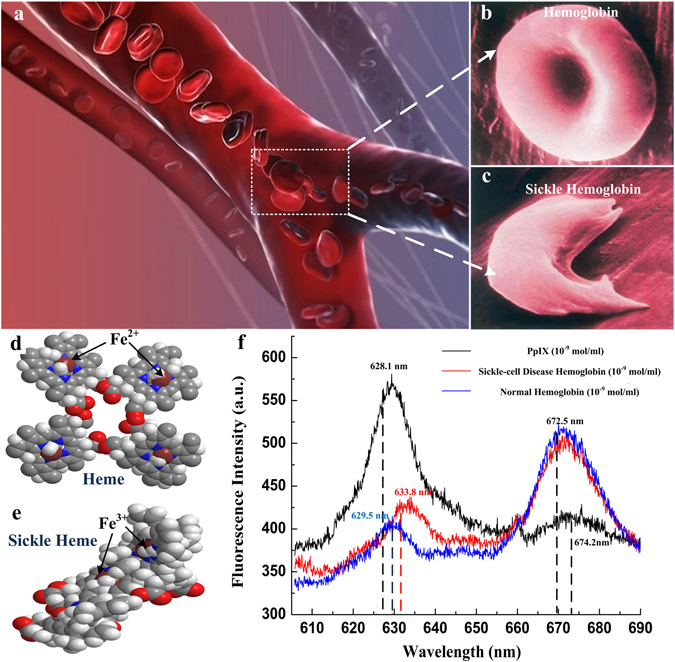
As can be seen from Fig. 1f, two fluorescent peaks with central wavelength at 628.10 nm and 674.20 nm appear in the fluorescent spectrum of Protoporphyrin, whilst the peak locates at 628.10 nm exhibits higher intensity. In comparison, Hemoglobin and Sickle Hemoglobin show different patterns that the fluorescent intensity at 672.50 nm appears higher. More important, when compared with Protoporphyrin, discernible shifts can be observed for the both left peaks, that the central wavelengths of the Hemoglobin and the Sickle Hemoglobin are shifted to 629.50 nm and 633.80 nm, respectively.
Figure 1.

Hemoglobin from SCD patient and normal person. (a) SCD hemoglobin in vessels (drawn by 3ds Max 2013 soft ware); (b) and (c) Schematic diagrams of the normal Hemoglobin and SCD hemoglobin (drawn by 3ds Max 2013 soft ware); (d) and (e) Molecule models of the Heme and sickle heme (drawn by Chem 3D soft ware); (f) The fluorescent spectra of Protoporphyrin, Hemoglobin and Sickle Hemoglobin.
As shown in Fig 2b, the heme is combined by a Protoporphyrin IX molecule and Fe2+, while metheme is synthesized in the reaction with Fe3+. In our experiment, the Protoporphyrin IX (C34H34N4O4) is synthesized and dissolved in organic solvent N,N-Dimelthylformamide (C3H7NO) at room temperature of 20 °C. Fe2+ can be obtained when ferrous chloride (FeCl2·4H2O) is dissolved in deionizedwater. To avoid being oxidized, the solution should be kept in a weak acid environment (PH~6.3), and a trace of iron powder (0.01 mg) should be added. Furthermore, FeCl3 powder is dissolved in deionizedwater and to synthesize Fe3+, which is stable. All of the above mentioned solution are used immediately after they were ready.
Figure 2.

Y-style fluidic channel and molecules structure of metheme and heme. (a) The Y-style fluidic passageway (drawn by Solid Works 2012 soft ware); (b) The reaction process of Protoporphyrin IX with Fe2+ and Fe3+, respectively (drawn by Chem 3D software).
The solutions are injected into sample room by intelligent trace syringes, and their mixing ratio can be controlled by the flow velocity of samples (Fig. 2a). In experiment, it is adequate to use the theoretical value for the approximate blending ratio 1:1. The Protoporphyrin IX, FeCl2 and FeCl3 solutions with low concentration of 10−16g/ml are used. If the concentration of Fe2+ or Fe3+ is much higher than Protoporphyrin IX, the excess iron ion will alter both the central wavelength and the fluorescence intensity21. On the other hand, the extremely low concentration of sample would result in weak fluorescent intensity, thus enhancement effect of the proposed resonator appears particularly important.
The optical setup as shown in Fig. 3a is not complicate, due to the free space coupling technique. A computer controlled θ/2θ goniometer is applied for the accurate angular scan of the incidence to ensure the efficient energy coupling. The optofluidic resonator includes five layers, where the middle three layers form the guiding layer to support oscillating guided modes. From the top to the bottom, these five layers are a 35 nm Ag coupling layer, a 0.3 mm glass slab, a 0.5 mm sample layer, another 0.3 mm glass slab and a 300 nm Ag substrate. The size of the rectangular sample channel is 10 × 4 × 0.5 mm3. All these parts are optically contacted together with excellent parallelism. A spectrograph (Andor SR-750) is used to record the signal data collect by a 0.1 mm diameter fiber-optics probe, which locates close to the optofluidic resonator surface. The flow velocity is 10 μl/s, and the time interval of the recorded data is Δt = 1s. Our strategy can be described as follows. First, fill the sample channel with Protoporphyrin, and excite an specific ultrahigh order modes (UOM) in the guiding layer by adjusting the incident angle to fulfill the phase match condition22. Second, the iron ion solution is injected into the sample channel to active reaction, while the fluorescence is significant enhanced due to the energy confinement and high sensitivity of the waveguide structure. Finally, the leaked fluorescence through the coupling layer is collected and recorded.
Figure 3.

Experimental system and the optofluidic resonator. (a) The schematic image of the experimental setup (drawn by 3ds Max 2013 soft ware); (b) Structure of optofluidic resonator and the coupling light path (drawn by Solid Works 2012 soft ware).
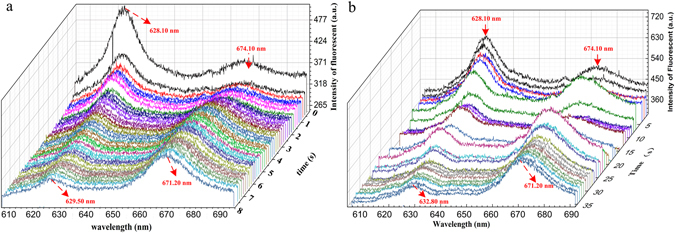
The dynamic fluorescent spectra during the whole reaction process are illustrated in Fig. 4. For the reaction includes Fe2+, it is obvious that the fluorescence intensity of central wavelength at 629.50 nm reduces gradually for 10 s, while the fluorescent intensity of the other peak at 672.10 nm slowly increases. The fluorescent intensity of both peaks tend towards a steady state in the end. Under the same experimental condition, the reaction between Fe3+ and Protoporphyrin IX are also demonstrated, which takes a much longer time to become stable. For the experiment with Fe3+, drastic fluctuations can be observed for both fluorescent peaks during the first 25 s, which is completely different from the Fe2+ reaction. Several statements can be made on the above results. i) Different central wavelength for the left fluorescent peaks are observed for different reactions, i.e., 629.50 nm for the Fe2+ compound and 632.80 nm for the Fe3+ compound; ii) The reaction time of Fe2+ is shorter than Fe3+; iii) The fluorescent emission wavelengths of the above reactions are in good accordance with the Hemoglobin samples shown in Fig. 1f. The Fe2+ compound has the same central wavelengths with the normal hemoglobin, while the fluorescent peaks of the Fe3+ compound coincide with the SCD hemoglobin.
Figure 4.

Monitoring the Fe2+ and Fe3+ combination with Protoporphyrin IX. (a–c) Dynamic reaction process between Fe2+ and Protoporphyrin. The X-, Y- and Z- axis are wavelength (nm), reaction time (s) and fluorescence intensity (a.u.), respectivity; (d–f) Dynamic reaction process between Fe3+ and Protoporphyrin.
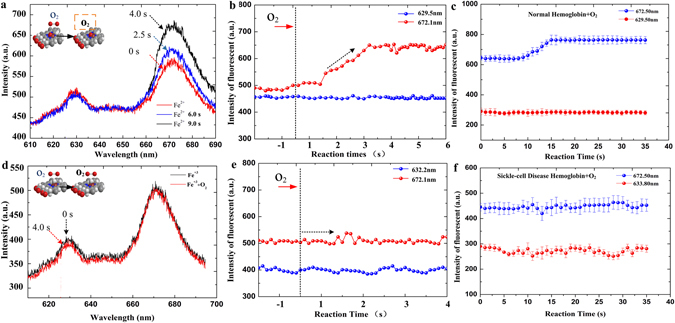
The second experiment is designed to observe the dynamic processes of the reactions between the oxygen gas and the two compounds of the previous experiments. From now on, we will refer to the product of the combination reaction of Protoporphyrin IX and Fe2+ as Heme, whilst Metheme is applied to denote the product of the Protoporphyrin IX and Fe2+ reaction. In Fig. 5a,d, the fluorescent spectra at different times are recorded, while the time dependent fluorescent intensities of each peak are also plotted in Fig. 5b,e. It is obviously that both the fluorescent spectra and peak intensity varies very little for the Metheme, which indicates that Metheme is difficult to be oxidized, i.e., incapable of binding oxygen. On the other hand, the fluorescent spectra of Heme vary drastically during the oxidation. It is also interesting to note that the fluorescent peak at 672.1 nm increases gradually till the intensity finally reaches a stable value, while the fluorescent peak at 629.5 nm remains unchanged. Comparing the above phenomenon with the Hemoglobin specimen obtained from Ruijin hospital, it is clear that normal Hemoglobin specimen displays a very similar pattern with the Heme product, and the SCD patient specimen resembles the Metheme product. Inner connect between the Heme and normal Hemoglobin must exists based on the above experimental observation, while same remarks can also be applied to the Metheme and SCD Hemoglobin.
Figure 5.

Dynamic oxidation process of the Heme and Metheme, respectively. (a) and (d) Fluorescent spectra of the Heme and Metheme before and after the oxidation. (b) and (e) Time dependent variation of the fluorescent peak intensities during the oxidation process. (c) and (f) Comparison experiments via the Hemoglobin specimen from normal person and SCD patient, which are provided by Ruijin Hospital.
Conclusions
The investigations on SCD are urgent and of significant importance to reduce the children mortality in low resource area. This paper adopts a high sensitivity optofluidic resonator based on a metallic cladding waveguide structure. The enhanced fluorescent effect enables the usage of specimen of very low concentration, while real time detection is also available due to the short switching time. The reactions of Protoporphyrin IX with Fe2+ and Fe3+ are studied in details, while the dynamic oxidation processes of their products are also researched. Comparison experiments are also carried out via bio-specimen provided by hospital, and a possible hypothesis on the pathogenetic factor of SCD is also proposed, that the heme in the blood of normal person is replaced by the Metheme in the blood of SCD patients.
Ethics
All methods were carried out in accordance with relevant guidelines and regulations. And all experimental protocols were approved by National Health and Family Planning Commission of the People’s Republic China and Shanghai Jiaotong University. And informed consent was obtained from all subjects.
Electronic supplementary material
Acknowledgements
This work was supported by the National Basic Research Programmer of China (Grant Nos 2013CBA01703), the National Natural Science Foundation of China (Grant Nos 61125503, 61405117, 11404092, 61367003) and Natural science foundation of Jiangsu Province (BK20140246).
Author Contributions
H.L.D., C.Y. and Z.Q.C. designed and developed the concept for the optofluidic waveguide cavity of millimeter scale, produced the hardware and software, conducted the ultralow threshold is came true and experiments and wrote the manuscript. B.J., M.W.R. and X.N.Y. prepared the Fe2+, Fe3+ and PpIX fluorescent samples solution and attend to research experiment. B.J. provided SCD hemoglobin and normal hemoglobin material and prepared samples during the course of this research that were important in the development of this new research. X.F.C. organized and supervised this work.
Competing Interests
The authors declare that they have no competing interests.
Footnotes
Electronic supplementary material
Supplementary information accompanies this paper at doi:10.1038/s41598-017-03634-8
Publisher's note: Springer Nature remains neutral with regard to jurisdictional claims in published maps and institutional affiliations.
References
- 1.Pauling L, Itano HA, Singer SJ, Wells IC. Sickle cell anemia, a molecular disease. Science. 1949;110:543–548. doi: 10.1126/science.110.2865.543. [DOI] [PubMed] [Google Scholar]
- 2.Perutz MF, Liquori AM, Eirich F. X-ray and solubility studies of the haemoglobin of sickle-cell ananemia patients. Nature. 1951;167:929–31. doi: 10.1038/167929a0. [DOI] [PubMed] [Google Scholar]
- 3.John AB, et al. Prevention of pneumococcal infection in children with homozygous sickle cell disease. B.M.J. 1984;26:1567–1570. doi: 10.1136/bmj.288.6430.1567. [DOI] [PMC free article] [PubMed] [Google Scholar]
- 4.Gaston MH, et al. Prophylaxis with oral penicillin in children with sickle cell anemia. N. Engl. J. Med. 1986;314:1593–1599. doi: 10.1056/NEJM198606193142501. [DOI] [PubMed] [Google Scholar]
- 5.Piel FB, Hay SI, Gupta S, Weatherall DJ, Williams TN. Global burden of sickle cellanaemia in children under five, 2010–2050: Modelling based on demographics, excessmortality, and interventions. PLoS Med. 2013;10(7):e1001484. doi: 10.1371/journal.pmed.1001484. [DOI] [PMC free article] [PubMed] [Google Scholar]
- 6.Serjeant GR. One hundred years of sickle cell disease. Br. J. Haematol. 2010;151(5):425–429. doi: 10.1111/j.1365-2141.2010.08419.x. [DOI] [PubMed] [Google Scholar]
- 7.Weatherall DJ. The inherited diseases of hemoglobin are an emerging globalhealth burden. Blood. 2010;115(22):4331–4336. doi: 10.1182/blood-2010-01-251348. [DOI] [PMC free article] [PubMed] [Google Scholar]
- 8.Emond AM, et al. Acute splenic sequestration in homozygous sickle cell disease: Natural history and management. J. Pediatr. 1985;107(2):201–206. doi: 10.1016/S0022-3476(85)80125-6. [DOI] [PubMed] [Google Scholar]
- 9.Williams TN, et al. Bacteraemia in Kenyan children with sickle-cell anaemia: Aretrospective cohort and case-control study. Lancet. 2009;374(9698):1364–1370. doi: 10.1016/S0140-6736(09)61374-X. [DOI] [PMC free article] [PubMed] [Google Scholar]
- 10.Gaston MH, et al. Prophylaxis with oral penicillin in children with sickle cellanemia. A randomized trial. N. Engl. J. Med. 1986;314(25):1593–1599. doi: 10.1056/NEJM198606193142501. [DOI] [PubMed] [Google Scholar]
- 11.Hankins J, Ware RE. Sickle-cell disease: An ounce of prevention, a pound ofcure. Lancet. 2009;374(9698):1308–1310. doi: 10.1016/S0140-6736(09)61602-0. [DOI] [PubMed] [Google Scholar]
- 12.Aikens RS, Agard DA, Sedat JW. Solide-state imagers for microscopy. Methods Cell Biol. 1989;29:291–313. doi: 10.1016/S0091-679X(08)60199-5. [DOI] [PubMed] [Google Scholar]
- 13.Matsuda T, Miyawaki A, Nagai T. Direct measurement of protein dynamics inside cells using a rationally designed photoconvertible protein. Nat. Methods. 2008;5:339–345. doi: 10.1038/nmeth.1193. [DOI] [PubMed] [Google Scholar]
- 14.Shaner NC, et al. A bright monomeric green fluorescent protein derived from Branchiostoma lanceolatum. Nat. Methods. 2013;10:407–409. doi: 10.1038/nmeth.2413. [DOI] [PMC free article] [PubMed] [Google Scholar]
- 15.Smith LM, et al. Fluorescence detection in automated DNA sequence analysis. Nature. 1986;321:674–379. doi: 10.1038/321674a0. [DOI] [PubMed] [Google Scholar]
- 16.Prober JM, et al. A system for rapid DNA sequencing with fluorescent chain-terminating dideoxynucleotides. Science. 1987;238:336–343. doi: 10.1126/science.2443975. [DOI] [PubMed] [Google Scholar]
- 17.Joseph MZ, et al. DNA Sequence-Dependent Compartmentalization and Silencing of Chromatin at the Nuclear Lamina. Cell. 2012;104(7):1474–1487. doi: 10.1016/j.cell.2012.04.035. [DOI] [PubMed] [Google Scholar]
- 18.S. Ahmed DG, et al. DNA zip codes control an ancient mechanism for gene targeting to the nuclear periphery. Nat. Cell Biol. 2010;12:111–118. doi: 10.1038/ncb2011. [DOI] [PMC free article] [PubMed] [Google Scholar]
- 19.Graeme AK, et al. Revealing the competition between peeled ssDNA, melting bubbles, and S-DNA during DNA overstretching using fluorescence microscopy. P.N.A.S. 2012;110(10):3859–3864. doi: 10.1073/pnas.1213676110. [DOI] [PMC free article] [PubMed] [Google Scholar]
- 20.Yuan W, et al. Microsecond-scale switching time of magnetic fluids due to the optical trapping effect in waveguide structure. Microfluid & Nanofluid. 2011;11:781–785. doi: 10.1007/s10404-011-0844-z. [DOI] [Google Scholar]
- 21.Hirokazu K, et al. Single molecular multianalyte (Ca2+, Mg2+) fluorescent probe and applications to bioimaging. J.am. Chem. Soc. 2005;127:10798–10799. doi: 10.1021/ja0528228. [DOI] [PubMed] [Google Scholar]
- 22.Yuan W, et al. Wideband slow light assisted by ultrahigh-order modes. J.O.S.A. B. 2011;28(5):968–971. doi: 10.1364/JOSAB.28.000968. [DOI] [Google Scholar]
Associated Data
This section collects any data citations, data availability statements, or supplementary materials included in this article.


