Abstract
Objectives
Venous thromboembolism (VTE) risk increases within months of combination oral contraceptive (COC) initiation. Because elevated endogenous thrombin potential (ETP) has been found in several studies to be a VTE risk factor, we evaluated the extent of ETP changes during the initial cycle of an ethinyl estradiol (EE) and levonorgestrel (LNG) COC. We also assessed the relationship between ETP changes and systemic EE and LNG concentrations.
Study Design
Participants provided multiple blood samples during a first 21-day cycle of a 30 µg EE/150 µg LNG COC and after a further 7 days without an active COC. Thrombin generation measured with and without addition of activated protein C (APC) yielded ETP+APC and ETP−APC and the normalized APC sensitivity ratio (nAPCsr). EE and LNG pharmacokinetic analyses were conducted over 24 hours after the first COC tablet and again at steady state.
Results
Thrombin generation was determined in 16 of the 17 women who completed the study. Mean ETP−APC increased steadily to 21% above baseline at 24 hours after the 6th COC tablet (COC624; p < 0.001) and to 28% above baseline at steady state (COC21; p < 0.001). Mean ETP+APC increased considerably more – by 54% at COC624 and by 79% at steady state. Mean nAPCsr increased by 28% at COC624 and by 41% at steady state. Higher concentrations of EE or LNG were not correlated with greater increases in ETP.
Conclusions
ETP increases during the first COC cycle were substantial.
Implications
The early increases in ETP may provide biological support for the rapid increase in VTE risk during initial COC use. The lack of association between this clotting system perturbation and the systemic EE concentration is surprising and deserves further study.
Keywords: oral contraceptives, venous thromboembolism, endogenous thrombin potential
1. Introduction
The risk of venous thromboembolism (VTE) increases within the first 3 months of combination oral contraceptive (COC) use, and then gradually decreases between the first 3 months and 1 year [1–3], although this has not been invariably found [4]. Rosing and colleagues measured activated protein C (APC) resistance in two women and found increases during the first week of the first COC cycle [5]. Similar increases occurred in six women after receiving an emergency contraceptive containing two high doses of ethinyl estradiol (EE) and levonorgestrel (LNG) [6]. Other studies of hemostatic changes during COC use have not evaluated early changes [7, 8]. The large ‘Seven-OC Study’ [8], measured 24 hemostatic variables, including APC resistance, at baseline and after 3 and 6 COC cycles in 707 women. In that study, D-dimer concentration, a marker of fibrinolysis assCOCiated with future VTE risk [9, 10], increased approximately 50% after 6 cycles of all COC regimens tested [8]. Factor VIII activity, independently associated with risk of VTE [11–13], increased approximately 20% after 6 cycles [8]. We recently evaluated D-dimer and factor VIII changes during the first COC cycle, and found changes comparable to those seen with longer use [14]. The relationship between these observed changes in D-dimer and factor VIII to the increased VTE risk experienced among COC users has not been studied directly.
The measurement of thrombin generation via the Calibrated Automated Thrombogram is an excellent tool to determine the “thrombotic-hemostatic function of the blood” [15]. Hemker and colleagues developed this method to measure the time course of thrombin generation (TG) initiated with tissue factor (TF) in platelet-poor plasma and proposed that the area under the TG curve, termed the Endogenous Thrombin Potential (ETP), is a global measure of the clotting potential of blood [15]. ETP has been found to be associated with VTE risk [16–21]. Although ETP is strongly affected by COC use [5, 22], there has only been a single study of the association of ETP with VTE risk in COC users [23]. The ETP laboratory test we use provokes TG under several standardized conditions, including with and without the addition of APC, and these are denoted ETP+APC and ETP−APC, respectively. APC is a natural anticoagulant protein generated in plasma after thombin activates protein C and which, supported by its cofactor protein S, dramatically reduces thrombin generation. The increased VTE risks associated with protein C and protein S deficiencies and with so-called ‘APC resistance’ illustrate the importance of the protein C system in down-regulating coagulation [24–30]. During COC use, the normal reduction of TG with the addition of APC is mitigated, and COC use has thus been described as causing ‘acquired APC resistance’ [5, 31]. The ‘Seven-OC Study’ found a 74% increase in the normalized APC sensitivity ratio (nAPCsr) during use of a 30 µg EE/150 µg LNG COC at 6 months, but did not report the results for ETP−APC or ETP+APC [8]. In the present analysis we evaluated the changes in TG during the first cycle of use of this COC.
Because epidemiological studies show that COCs with higher doses of EE are associated with a greater increase in VTE risk [32, 33], we also explored whether a woman’s systemic EE concentration during the first COC cycle was related to the magnitude of her TG changes.
2. Materials and Methods
Study population and blood collection
This single-arm, open-label pilot study took place at Columbia University Medical Center (CUMC) after Institutional Review Board approval. We have previously reported details of the study [14, 34]. Briefly, participants provided written informed consent prior to enrollment; were aged 18–35 years and self-identified as white. We excluded any women with medical contraindications to COC use [35]. Additional exclusion criteria included: medication use known to affect the CYP450 system; injectable contraception in the past 6 months or other hormonal contraceptive use within the past month; pregnancy within the past six weeks; smoking; and a body mass index ≥ 30.0 kg/m2.
The study COC contained 30 µg EE and 150 µg LNG packaged with 21 active and 7 placebo tablets (Portia®, Teva Pharmaceuticals, Philadelphia, PA, USA). Treatment began within 7 days of the start of menses. Each participant selected a particular time to take her daily COC; we directly observed COC intake at this particular time on study visit days. Participants underwent multiple blood draws to measure hormone and hemostatic variables over 4 weeks: immediately before each COC was taken on days 1 (COC10), 2 (COC124), 3 (COC224), 4 (COC324), 7 (COC624), and 21 (COC2024 = COC210); and at the same time on day 22 (COC2124) and on day 28 (COC28). Each participant also returned to take a single COC pill within the first 5 days of her next spontaneous menses and we collected blood samples over the following 4 days. Participants sat quietly for 30 minutes prior to each blood draw, which the phlebotomist performed using a 21-gauge butterfly needle in the antecubital vein. We admitted each participant for 24 hours on days 1 and 21 to collect 14 timed samples for pharmacokinetic analyses of EE and LNG. All study visits occurred in winter 2012–2013.
Samples for clotting factor analyses were collected in a citrated vacutainer and centrifuged at 1200×g at 4°C for 10 minutes; plasma was then frozen in 1 mL aliquots at −80°C. Normal pooled plasma used as a reference in this study was collected in Maastricht by pooling plasma of 23 healthy individuals with an average age of 34.7 years (13 men and 10 women among whom were two COC users) as previously described [36].
Laboratory methods
We measured ETP by CAT [36] in wells of a microtiter plate (total volume 125 µL) containing 80 µL platelet poor plasma to which 25 µL of a tissue factor/phospholipids mixture with or without APC was added. Thrombin generation was triggered by the addition of 20 µL of a CaCl2/fluorogenic substrate I-1140 (Z-Gly-Gly-Arg-AMC, BACHEM, Bubendorf, Switzerland) mixture resulting in the following final concentrations: 10 pM TF, 30 µM PL (DOPS/DOPC/DOPE 20/60/20), 16 mM CaCl2, 0.3 mM I-1140 and 5 nM APC if present. We added thermos-stable contact inhibitor (TICA) to the plasma to a final concentration of 40 µg/mL to prevent contact activation. All samples from a single subject were measured in one run in duplicate. Fluorescence was read in a Fluoroskan Ascent® reader (ThermoLabsystems, Helsinki, Finland) and thrombin generation curves were calculated using Thrombinoscope™ software (Thrombinoscope BV, Maastricht, The Netherlands). ETP−APC, ETP+APC and nAPCsr were calculated as previously described [37]. The APC concentration was chosen such that TG in the normal pooled plasma was inhibited ~90% (ETP+APC is ~10% of ETP−APC).
The CUMC Biomarkers Core Laboratory measured EE and LNG serum concentrations using liquid chromatography-tandem mass spectrometry and we conducted standard PK analyses using the Stata 14 (Stata Corporation, College Station, TX, USA) non-compartmental analysis procedure, pkexamine, using the trapezoidal rule. Concentrations of corticosteroid-binding globulin (CBG) were measured in serum at baseline and steady state (COC210) with a radioimmunoassay kit (IBL-America, Minneapolis, MN, USA) to evaluate treatment compliance [38].
Laboratory Materials
Hepes, Tris-hydrochloride, CaCl2 and ovalbumin were obtained from Sigma Aldrich (Zwijndrecht, The Netherlands). NaCl and EDTA were obtained from Merck (Darmstadt, Germany). Bovine serum albumin (BSA) was purchased from MP Biomedicals (Illkirch, France). The fluorogenic substrate I-1140 (Z-Gly-Gly-Arg-7-amino-4-methylcoumarin-HCL) was obtained from Bachem (Bubendorf, Germany). The phospholipids 1,2-dioleoyl-sn-glycero-3-phosphCOCholine (DOPC), 1,2-dioleoyl-sn-glycero-3-phosphoserine (DOPS) and 1,2-dioleoyl-sn-glycero-3-phosphoethanolamine (DOPE) were from Avanti Polar Lipids (Alabaster, AL, USA). Phospholipids vesicles (DOPS/DOPE/DOPC; 20/20/60; M/M/M) were prepared as previously described [36]. Recombinant tissue factor (Innovin) was purchased from Siemens Healthcare (Marburg, Germany). TICA was made in house. Recombinant APC (Xigris "drotrecogin alfa") was obtained from Eli Lilly (Indianapolis, IN, USA). The Thrombin calibrator was purchased from Thrombinoscope BV (Maastricht, The Netherlands).
Statistics
To reduce random variation at steady state we averaged the values of the hemostatic variables immediately before and 24 hours after COC21 (COC2024 and COC2124), except in Figure 1 where we show these values separately. We summarized the levels of TG using descriptive statistics, and conducted matched-pairs t-tests to evaluate changes over time in ETP−APC, ETP+APC, nAPCsr, Peak−APC, and Peak+APC. We used linear regression to assess the relationship between the logarithm of steady-state 24-hour EE area-under-the-curve (EEAUC21) and the change in hemostatic variables from baseline to COC21. Confidence intervals for Pearson correlation coefficients (r values) were calculated using Fisher’s z transformation. We used Stata 14 (StataCorp, College Station, TX) to conduct statistical analyses. All statistical significance levels (p values) quoted are 2-sided. The sample size of the study was based on available funding.
Fig. 1.
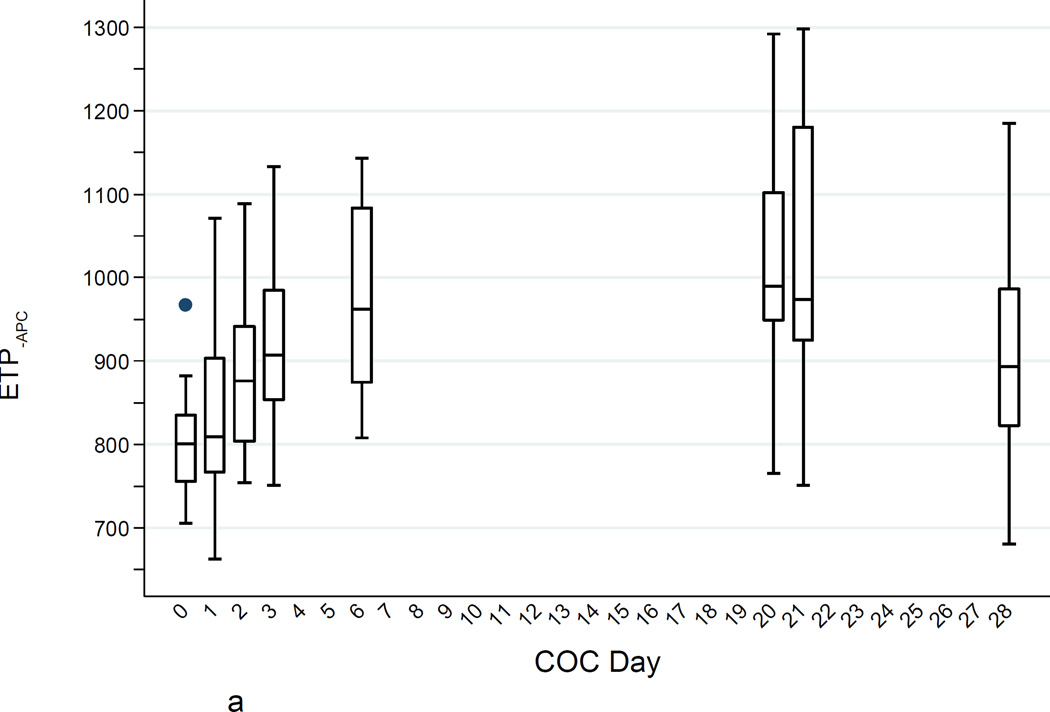
a. ETP−APC (nM·min) levels during the COC cycle. Boxes show medians and interquartile ranges (IQR); lower whiskers denote the smallest values ≥ (25th percentile − 1.5 × IQR); upper whiskers denote the largest values ≤ (75th percentile + 1.5 × IQR); and individual points denote values outside the whiskers.
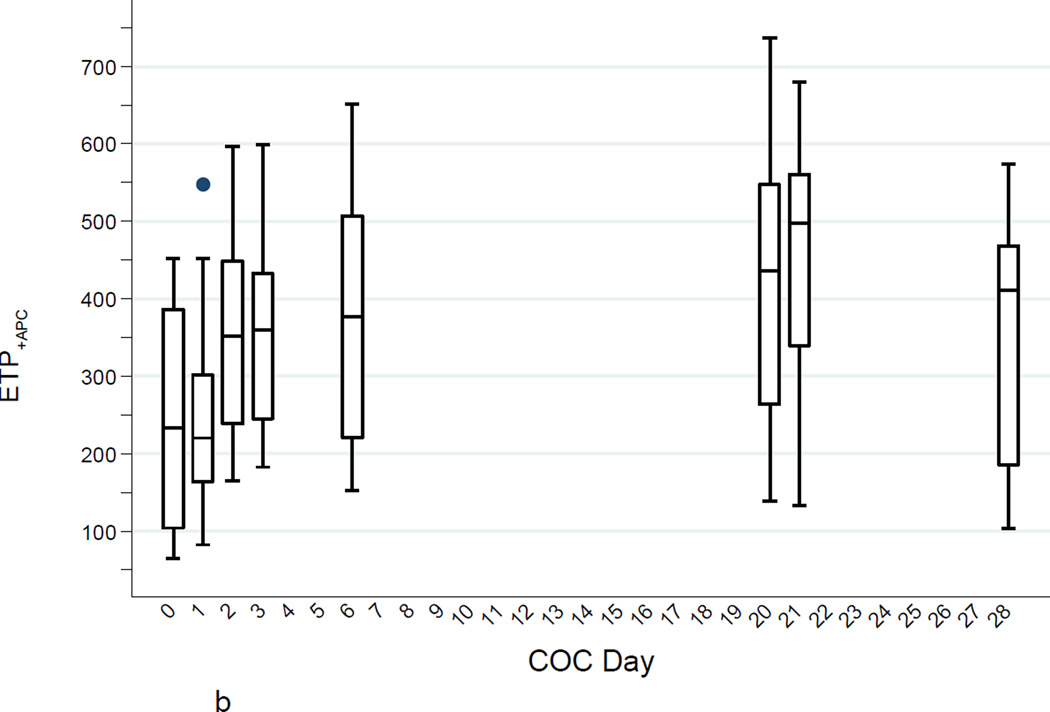
b. ETP+APC (nM·min) levels (high TF) during the COC cycle (boxes as in Fig. 1a).
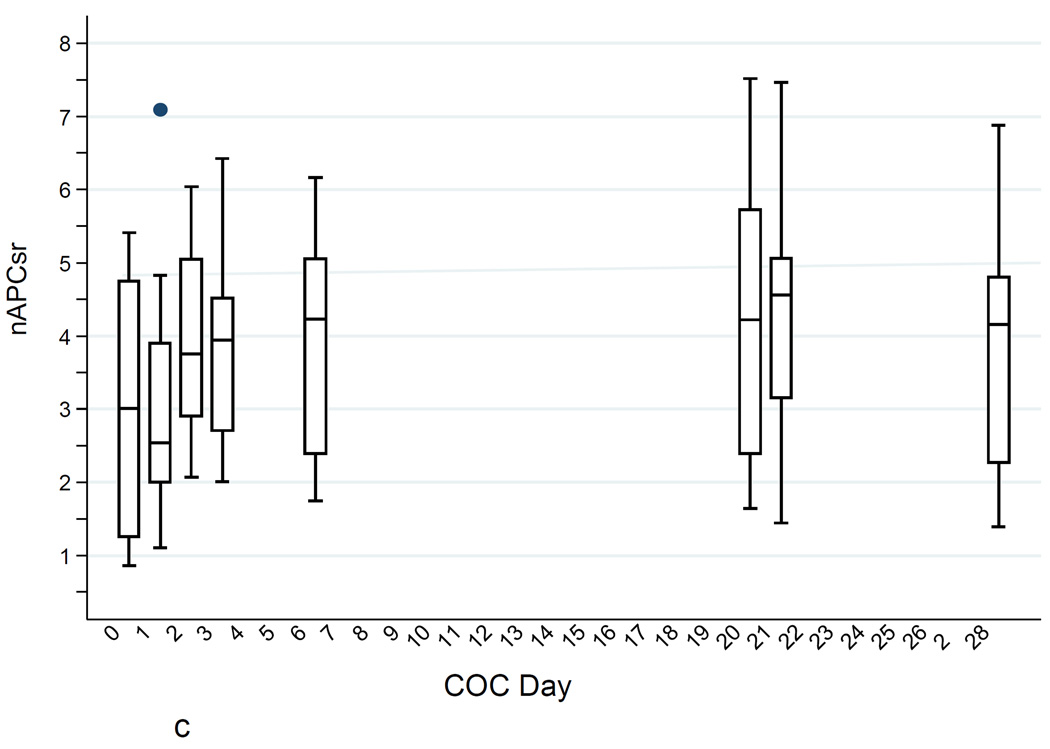
c. ETPnAPCsr levels (high TF) during the COC cycle (boxes as in Fig. 1a).
3. Results
Seventeen women participated in this study completing 163 of 170 scheduled visits. Three participants missed the day 28 visit, and one missed the last four visits after the one month COC-free period. CBG changes from baseline to day 21 were consistent with good compliance. Table 1 shows their baseline characteristics.
Table 1.
Baseline characteristics of study participants (n=17)
| Variable | Study Participant |
|---|---|
| Age | 24.9 (±3.9) |
| Height (cm) | 168.1 (±7.7) |
| Weight (kg) | 63.9 (±10.5) |
| BMI (kg/m2) | 22.6 (±3.1) |
| Ever been pregnant | 2 (11.8%) |
| Ever given birth | 0 (0.0%) |
| Previously used an OC | 11 (64.7%) |
Values are shown as mean (±SD) or n (%).
The duplicate TG measurements of one of the participants were far apart, and, as we did not have sufficient plasma to repeat the measurements, this participant’s results were not used in our calculations. Table 2 shows values of the TG parameters for the 16 remaining subjects over the study period.
Table 2.
Endogenous Thrombin Potential (ETP) values during the first COC cycle (n = 16)
| Cycle Day | COC10 | COC124 | COC224 | COC324 | COC624 | COC21a | COC28 |
|---|---|---|---|---|---|---|---|
| ETP−APC (nM.min) | |||||||
| Mean (95% CI)b |
805 (770, 841) |
832 (777, 887) |
881 (826, 936) |
919 (864, 974) |
975 (916, 1035) |
1029 (958, 1101) |
914 (831, 997) |
| p-valuec | - | 0.054 | 0.001 | <0.001 | <0.001 | <0.001 | 0.001 |
| Correlation w baselined (95% CI)bd |
- | 0.91 (0.75, 0.97) |
0.70 (0.31, 0.89) |
0.70 (0.31, 0.89) |
0.59 (0.13, 0.84) |
0.53 (0.05, 0.81) |
0.81 (0.47, 0.94) |
| p-valued | <0.001 | 0.003 | 0.002 | 0.016 | 0.033 | 0.001 | |
| Correlation w SSe (95% CI)be |
0.53 (0.05, 0.81) |
0.69 (0.30, 0.88) |
0.61 (0.16, 0.85) |
0.73 (0.37, 0.90) |
0.61 (0.16, 0.85) |
- | 0.84 (0.54, 0.95) |
| p-valued | 0.035 | 0.003 | 0.011 | 0.001 | 0.012 | <0.001 | |
| ETP+APC (nM.min) | |||||||
| Mean (95% CI)b |
244 (171, 317) |
247 (180, 314) |
347 (279, 415) |
359 (293, 425) |
375 (291, 460) |
437 (359, 514) |
347 (248, 445) |
| p-valuec | - | 0.91 | 0.002 | 0.007 | 0.007 | <0.001 | 0.004 |
| Correlation w baselined (95% CI)bd |
- | 0.65 (0.23, 0.87) |
0.65 (0.23, 0.87) |
0.35 (−0.18, 0.72) |
0.35 (−0.18, 0.72) |
0.42 (−0.10, 0.76) |
0.61 (0.09, 0.87) |
| p-valued | 0.006 | 0.006 | 0.19 | 0.18 | 0.10 | 0.027 | |
| Correlation w SSe (95% CI)be |
0.43 (−0.08, 0.76) |
0.65 (0.23, 0.87) |
0.78 (0.46, 0.92) |
0.82 (0.55, 0.94) |
0.77 (0.44, 0.92) |
- | 0.83 (0.51, 0.95) |
| p-valued | 0.098 | 0.006 | <0.001 | <0.001 | 0.001 | <0.001 | |
| nAPCsr | |||||||
| Mean (95% CI)b |
3.00 (2.12, 3.88) |
2.99 (2.17, 3.80) |
3.95 (3.21, 4.68) |
3.91 (3.22, 4.61) |
3.83 (3.03, 4.63) |
4.24 (3.45, 5.03) |
3.77 (2.70, 4.85) |
| p-valuec | - | 0.96 | 0.007 | 0.042 | 0.073 | 0.010 | 0.016 |
| Correlation w baselined (95% CI)bd |
- | 0.63 (0.20, 0.86) |
0.70 (0.31, 0.89) |
0.41 (−0.11, 0.75) |
0.41 (−0.11, 0.75) |
0.43 (−0.08, 0.76) |
0.64 (0.14, 0.88) |
| p-valued | 0.009 | 0.003 | 0.12 | 0.11 | 0.10 | 0.020 | |
| Correlation w SSe (95% CI)be |
0.43 (−0.08, 0.76) |
0.72 (0.35, 0.90) |
0.78 (0.46, 0.92) |
0.83 (0.57, 0.94) |
0.77 (0.44, 0.92) |
- | 0.79 (0.42, 0.93) |
| p-valued | 0.094 | 0.002 | <0.001 | <0.001 | 0.001 | 0.001 |
COC21, mean of values at t=0 and t=24 hrs;
95% CI, 95% confidence interval;
Paired t-test against COC10;
Correlation with COC10;
Correlation with COC21 (steady state, SS).
Mean ETP−APC increased to 9% above baseline at day 3 (COC224; p = 0.001); to 21% above baseline at day 7 (COC624; p < 0.001) and to 28% above baseline at steady state (COC21; p < 0.001). At day 28, 7 days after intake of the last active pill, the mean ETP−APC had fallen, but was still 14% above baseline (p = 0.001).
Mean ETP+APC also increased steadily from baseline, by day 3 it was increased 42% over baseline (p = 0.002) and was increased 79% above baseline at steady state (p < 0.001). By day 28, the mean ETP+APC had fallen, but was still 42% over baseline (p = 0.004). The percentage change in ETP+APC was much greater than the percentage change in ETP−APC. Moreover, the absolute change from baseline to steady state in ETP+APC was only slightly less than the absolute change in ETP−APC (193 vs 224 nM.min).
Mean nAPCsr was increased 32% over baseline after two pills (COC224; p = 0.007) and there was a further increase at steady state (a 41% increase over baseline; p = 0.010). At day 28, mean nAPCsr had decreased, but there was still a 33% increase over baseline (p = 0.018). There was a very high correlation between the changes (difference in logarithms of baseline to steady state) in nAPCsr and ETP+APC (r = 0.96).
The change in Peak−APC was highly correlated with the change in ETP−APC (r = 0.81). And the change in Peak+APC was even more highly correlated with the change in ETP+APC (r = 0.94).
Figures 1A–C show the increases in ETP−APC, ETP+APC, and nAPCsr and the substantial between-individual variability in all of these measures. The increases were quite noticeable within a few days of starting the COC and the thrombin generation parameters determined in the presence of APC (ETP+APC and nAPCsr) 24 hours after taking two COCs was strongly correlated with the steady-state values. All thrombin generation parameters returned to baseline after the one-month washout.
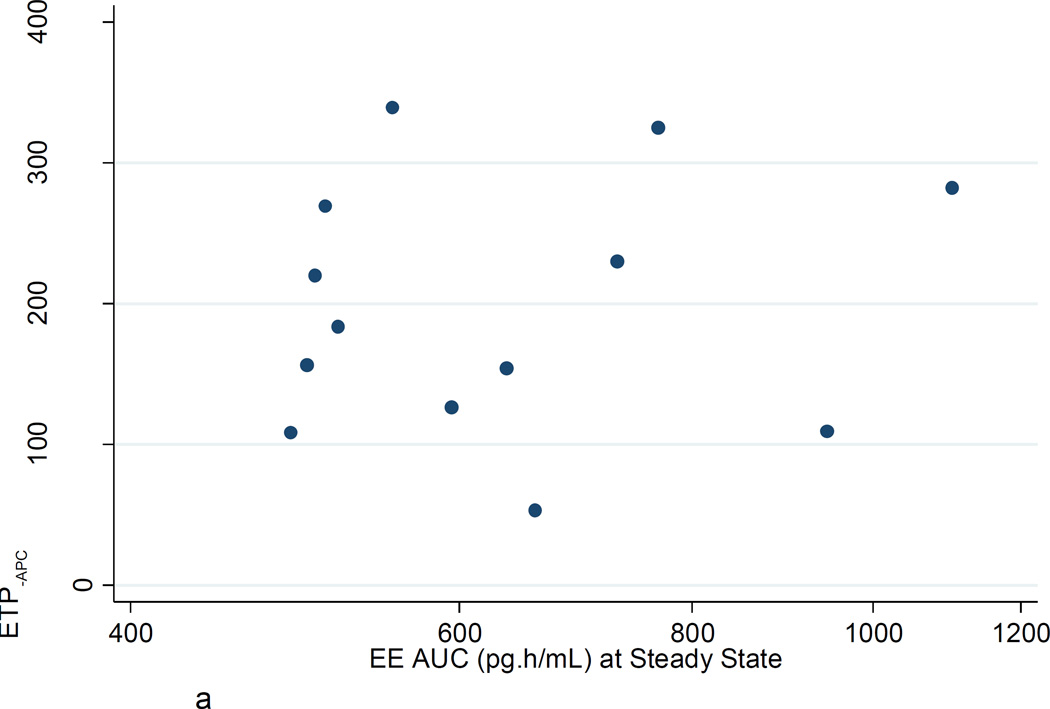
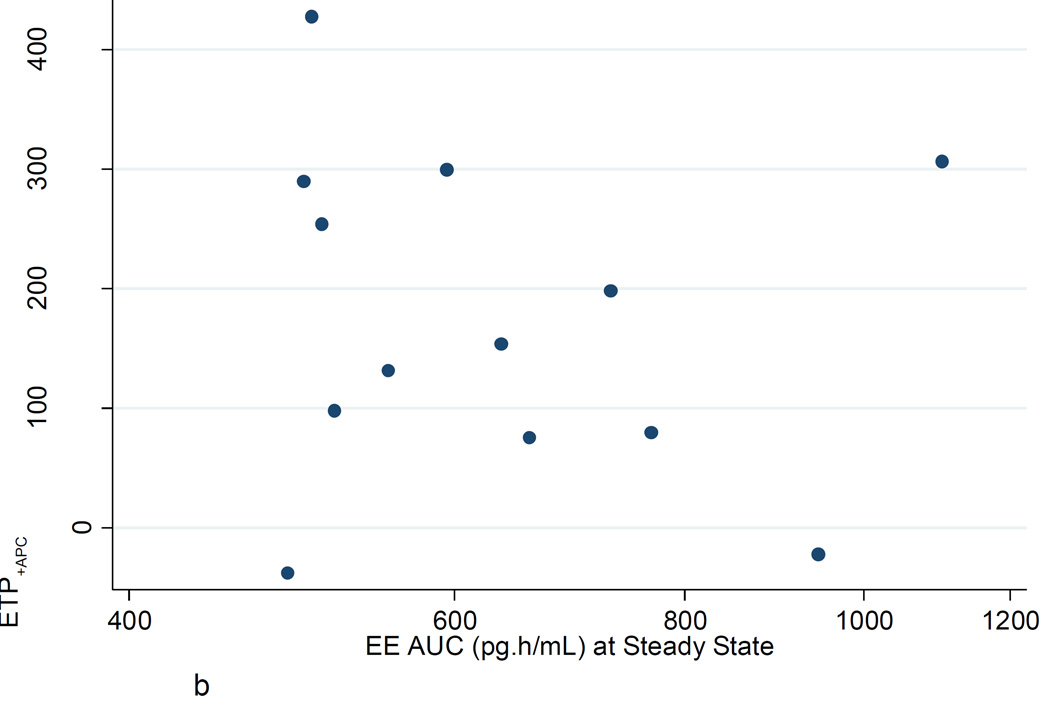
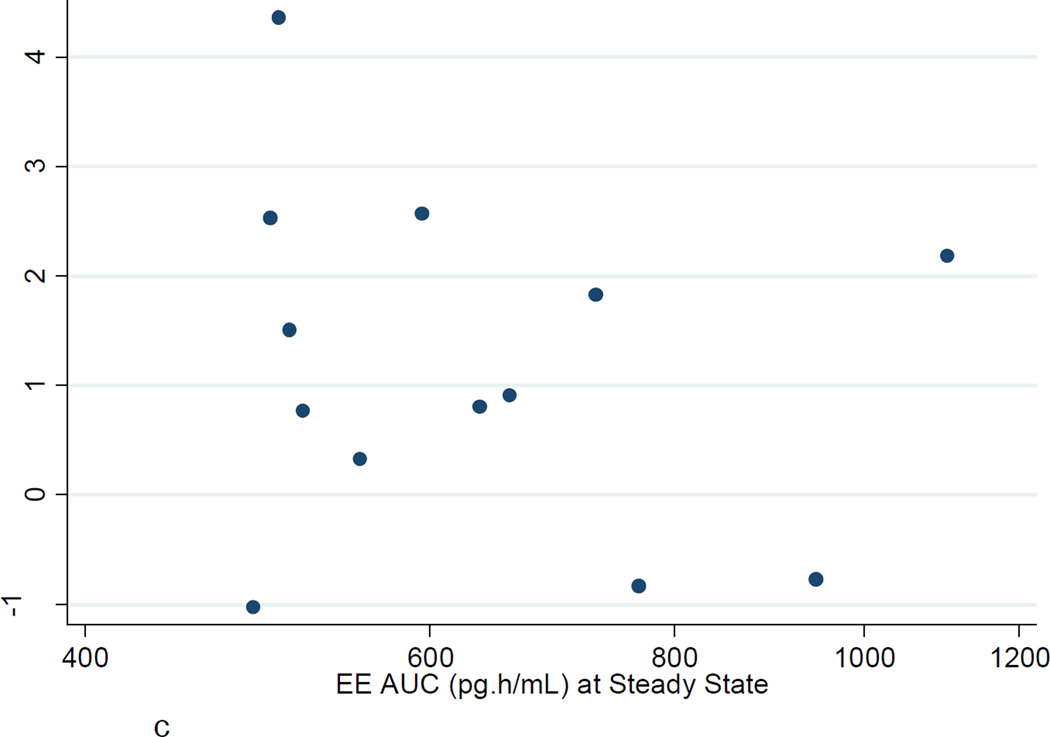
Figures 2A–C show the poor correlation between the increase in ETP−APC, ETP+APC, and nAPCsr from baseline to steady state and the EE AUC at steady state. Similar poor correlations were found with LNG AUC at steady state. There were no significant correlations between changes in ETP−APC, ETP+APC, and nAPCsr with changes in D-dimer or factor VIII.
Fig. 2.
a. ETP−APC: Ratio steady state to baseline vs EE AUC (pg·h/mL) at steady state.
b. ETP+APC: Ratio steady state to baseline vs EE AUC (pg·h/mL) at steady state.
c. ETPnAPCsr: Ratio steady state to baseline vs EE AUC (pg·h/mL) at steady state.
4. Discussion
In this pilot study the mean nAPCsr level increased 41% during the first cycle of COC use; an increase about two-thirds as great as the increase reported after 6 cycles in the ‘Seven-OC Study’ (based on comparisons of median values, as the ‘Seven-OC Study’ reported) [8]. As noted in the Introduction, this rapid increase in nAPCsr was previously reported in two women started on a monophasic COC containing desogestrel [5]. In addition, we found that mean ETP+APC was increased 79% from baseline to steady state (p < 0.001) and mean ETP−APC was increased 28% from baseline to steady state. Most of these changes occurred within a few days of beginning the COC. These preliminary results together with the changes we observed in D-dimer and factor VIII [14] provide some biological support to the epidemiological studies showing an increased VTE risk during the very first months of COC use [1–3]. It should be noted that within individual women, the changes in TG, D-dimer and factor VIII were poorly correlated.
Among women in this study, all taking the same COC, we found the expected greater than two-fold range in steady state 24-hour EE exposure (488–1103 pg·h/mL). However, contrary to expectation, higher individual EE exposures were not associated with greater changes in TG, D-dimer or factor VIII. It may be that serum EE concentration is poorly correlated with the first-pass exposure of the liver to EE. These results may also indicate that coagulation system mechanisms other than changes in TG, D-dimer and factor VIII may be responsive to serum EE concentration. In the 'Seven-OC Study' [8] the EE dose significantly affected several other coagulation parameters; in the future, larger studies should further evaluate individual EE exposure and consider its effects on a wide range of hemostatic parameters. The small number of participants and of hemostasis variables tested are a substantial limitation of this pilot study. However, we demonstrated that, like D-dimer and factor VIII, TG changes are readily detectable during the first few days of a COC cycle. These laboratory findings are preliminary, and given the known limitations of surrogate markers as a measure of clinical outcomes, these results are not directly useful for clinical recommendations. More laboratory and clinical studies are needed to corroborate these findings and judge the clinical utility of ETP testing.
The short-term COC effects on TG found here support reports of early increases in VTE risk from COC use. A short-term study, such as this, is far easier to carry out than a 6-month study; this approach may thus be useful for the study of changes in additional hemostatic variables, and for making comparisons among different COCs.
The high correlations between peak TG and ETP show that the results Lutsey and colleagues reported of the strong relationship between Peak−APC and risk of VTE [21] are also indicative of a strong relationship between ETP−APC and risk of VTE.
The absolute increase we found in ETP−APC from baseline to steady state was almost the same as the absolute increase of the ETP+APC (Table 2). We have no good explanation for this observation, and further studies on the effects of COCs on ETP−APC, ETP+APC and other coagulation factors are required to elucidate the determinants of the changes of the ETP−APC and ETP+APC during COC use.
Acknowledgments
We especially wish to thank the volunteers for this study without whom research such as this cannot be accomplished. In addition, we wish to thank the Biomarkers Core Laboratory staff at the Irving Institute for Clinical and Translational Research, Columbia University for serum analyses; in particular, May Huang, Susan Pollack, Tiffany Thomas, and Roseann Zott. We also wish to thank Mary-Jane McEneaney, DNP of the School of Nursing; Arielle Rodman, MD of the Department of Medicine; and Da Li of the Department of Obstetrics and Gynecology for assistance with study visits. We also thank Rosalind Tang, Monica Sull, and Marianne DiNapoli of the Department of Obstetrics and Gynecology for the pharmacokinetic analysis results used here.
Financial support: This pilot study was funded by a Collaborative and Multidisciplinary Pilot Research Award from the Irving Institute for Clinical and Translational Research (IICTR) at Columbia University Medical Center (CUMC), and by the Howard Solomon Research Fund (CUMC). The ethinyl estradiol and levonorgestrel assays were conducted by the Biomarkers Core Laboratory of the IICTR. The IICTR is supported by the National Center for Advancing Translational Sciences, National Institutes of Health, through Grant Number UL1 TR000040, formerly the National Center for Research Resources, Grant Number UL1 RR024156. This research was partially supported by National Cancer Institute award number P30 CA008748 (P.I. C.B. Thompson) to Memorial Sloan Kettering Cancer Center. The content is solely the responsibility of the authors.
Dr. Westhoff receives honoraria as a data safety and monitoring board member from Merck and Bayer, both of which produce oral contraceptives; however, not the oral contraceptive studied here.
Footnotes
Publisher's Disclaimer: This is a PDF file of an unedited manuscript that has been accepted for publication. As a service to our customers we are providing this early version of the manuscript. The manuscript will undergo copyediting, typesetting, and review of the resulting proof before it is published in its final citable form. Please note that during the production process errors may be discovered which could affect the content, and all legal disclaimers that apply to the journal pertain.
Conflicts of Interest: None of the other authors have any conflicts to report.
References
- 1.Suissa S, Blais L, Spitzer WO, Cusson J, Lewis M, Heinemann L. First-time use of newer oral contraceptives and the risk of venous thromboembolism. Contraception. 1997;56:141–146. doi: 10.1016/s0010-7824(97)00119-4. [DOI] [PubMed] [Google Scholar]
- 2.Farley TM, Meirik O, Marmot MG, Chang CL, Poulter NR. Oral contraceptives and risk of venous thromboembolism: impact of duration of use. Contraception. 1998;57:61–65. doi: 10.1016/s0010-7824(97)00209-6. [DOI] [PubMed] [Google Scholar]
- 3.van Hylckama Vlieg A, Helmerhorst FM, Vandenbroucke JP, Doggen CJ, Rosendaal FR. The venous thrombotic risk of oral contraceptives, effects of oestrogen dose and progestogen type: results of the MEGA case-control study. BMJ. 2009;339:b2921. doi: 10.1136/bmj.b2921. [DOI] [PMC free article] [PubMed] [Google Scholar]
- 4.Vinogradova Y, Coupland C, Hippisley-Cox J. Use of combined oral contraceptives and risk of venous thromboembolism: nested case-control studies using the QResearch and CPRD databases. BMJ. 2015;350:h2135. doi: 10.1136/bmj.h2135. coi:10.1136/bmj.h2135. [DOI] [PMC free article] [PubMed] [Google Scholar]
- 5.Rosing J, Tans G, Nicolaes GA, Thomassen MCLGD, Van Oerle R, van der Ploeg PMEN, et al. Oral contraceptives and venous thrombosis: different sensitivities to activated protein C in women using second- and third-generation oral contraceptives. Br J Haematol. 1997;97:233–238. doi: 10.1046/j.1365-2141.1997.192707.x. [DOI] [PubMed] [Google Scholar]
- 6.van Rooijen M, Silveira A, Thomassen S, Hansson L-O, Rosing J, Hamsten A, et al. Rapide activation of haemostasis after hormonal emergency contraception. Thromb Haemost. 2007;97:15–20. [PubMed] [Google Scholar]
- 7.Bloemenkamp KW, Rosendaal FR, Helmerhorst FM, Koster T, Bertina RM, Vandenbroucke Hemostatic effects of oral contraceptives in women who developed deep-vein thrombosis while using oral contraceptives. Thromb Haemost. 1998;80:382–387. [PubMed] [Google Scholar]
- 8.The Oral Contraceptive and Hemostasis Study Group. The effects of seven monophasic oral contraceptive regimens on hemostatic variables: conclusions from a large randomized multicenter study. Contraception. 2003;67:173–185. doi: 10.1016/s0010-7824(02)00476-6. [DOI] [PubMed] [Google Scholar]
- 9.Cushman M, Folsom AR, Wang L, Aleksic N, Rosamond WD, Tracy RP, et al. Fibrin fragment D-dimer and the risk of future venous thrombosis. Blood. 2003;101:1243–1248. doi: 10.1182/blood-2002-05-1416. [DOI] [PubMed] [Google Scholar]
- 10.Verhovsek M, Douketis JD, Yi Q, Shrivastava S, Tait RC, Baglin T, et al. Systematic review: D-dimer to predict recurrent disease after stopping anticoagulant therapy for unprovoked venous thromboembolism. Ann Intern Med. 2008;149:481–490. doi: 10.7326/0003-4819-149-7-200810070-00008. [DOI] [PubMed] [Google Scholar]
- 11.Bloemenkamp KWM, Helmerhorst FM, Rosendaal FR, Vandenbroucke JP. Venous thrombosis, oral contraceptives and high factor VIII levels. Thromb Haemost. 1999;82:1024–1027. [PubMed] [Google Scholar]
- 12.De Mitrio V, Marino R, Scaraggi FA, Di Bari L, GiannCOCcaro F, Petronelli M, et al. Influence of factor VIII/von Willebrand complex on the activated protein C-resistance phenotype and on the risk for venous thromboembolism in heterozygous carriers of the factor V Leiden mutation. Blood Coagul Fibrinolysis. 1999;10:409–416. [PubMed] [Google Scholar]
- 13.Kraaijenhagen RA, in’t Anker PS, Koopman MM, Reitsma PH, Prins MH, van den Ende A, et al. High plasma concentration of factor VIIIc is a major risk factor for venous thromboembolism. Thromb Haemost. 2000;83:5–9. [PubMed] [Google Scholar]
- 14.Westhoff CL, Eisenberger AB, Tang R, Cremers S, Grossman LV, Pike MC. Clotting factor changes during the first cycle of oral contraceptive use. Contraception. 2016;93:70–76. doi: 10.1016/j.contraception.2015.09.015. [DOI] [PMC free article] [PubMed] [Google Scholar]
- 15.Hemker HC, Giesen P, AlDieri R, Regnault V, de Smed E, Wagenvoord R, et al. The Calibrated Automated Thrombogram (CAT): a universal routine test for hyper- and hypo-coagulability. Pathophysiol Haemost Thromb. 2002;32:249–253. doi: 10.1159/000073575. [DOI] [PubMed] [Google Scholar]
- 16.Hron G, Kollars M, Binder BR, Eichinger S, Kyrle PA. Identification of patients at low risk of recurrent venous thromboembolism by measuring thrombin generation. JAMA. 2006;296:397–402. doi: 10.1001/jama.296.4.397. [DOI] [PubMed] [Google Scholar]
- 17.Besser M, Baglin C, Luddington R, van Hylckama Vlieg A, Baglin T. High rate of unprovoked recurrent venous thrombosisis associated with high thrombin-generating potential in a prospective cohort study. J Thromb Haemost. 2008;6:1720–1725. doi: 10.1111/j.1538-7836.2008.03117.x. [DOI] [PubMed] [Google Scholar]
- 18.Eichinger S, Hron G, Kollars M, Kyrle PA. Prediction of recurrent venous thromboembolism by endogenous thrombin potential and D-dimer. Clin Chem. 2008;54:2042–2048. doi: 10.1373/clinchem.2008.112243. [DOI] [PubMed] [Google Scholar]
- 19.ten Cate-Hoek AJ, Dielis AWJH, Spronk HMH, van Oerle R, Hamulyak K, Prins MH, ten Kate H. Thrombin generation in patients after acute deep-vein thrombosis. Thromb Haemost. 2008;100:240–245. [PubMed] [Google Scholar]
- 20.Tripodi A, Legnani C, Chantarangkul V, Cosmi B, Palareti G, Mannucci PM. High thrombin generation measured in the presence of thrombomodulin is associated with an increased risk of recurrent venous thromboembolism. J Thromb Haemost. 2008;6:1327–1333. doi: 10.1111/j.1538-7836.2008.03018.x. [DOI] [PubMed] [Google Scholar]
- 21.Lutsey PL, Folsom AR, Heckbert SR, Cushman M. Peak thrombin generation and subsequent venous thromboembolism: the Longitudinal Investigation of Thromboembolism Etiology (LITE) study. J Thromb Haemost. 2009;7:1639–1648. doi: 10.1111/j.1538-7836.2009.03561.x. [DOI] [PMC free article] [PubMed] [Google Scholar]
- 22.Rotteveel RC, Roozendaal KJ, Eijsman L, Hemker HC. The influence of oral contraceptives on the time-integral of thrombin generation (thrombin potential) Thromb Haemost. 1993;70:959–962. [PubMed] [Google Scholar]
- 23.Tans G, van Hylckama Vlieg A, Christella M, Thomassen GD, Curvers J, Bertina RM, et al. Activated protein C resistance determined with a thrombin generation-based test predicts for venous thrombosis in men and women. Br J Haematol. 2003;122:465–470. doi: 10.1046/j.1365-2141.2003.04443.x. [DOI] [PubMed] [Google Scholar]
- 24.Bertina RM, Broekmans AW, van der Linden IK, Mertens K. Protein C deficiency in a Dutch family with thrombotic disease. Thromb Haemost. 1982;48:1–5. [PubMed] [Google Scholar]
- 25.Comp PC, Nixon RR, Cooper MR, Esmon CT. Familial protein S deficiency is associated with recurrent thrombosis. J Clin Invest. 1984;74:2082–2088. doi: 10.1172/JCI111632. [DOI] [PMC free article] [PubMed] [Google Scholar]
- 26.Schwarz HP, Fischer M, Hopmeier P, Batard MA, Griffin JH. Plasma protein S deficiency in familial thrombotic disease. Blood. 1984;64:1297–1300. [PubMed] [Google Scholar]
- 27.Dahlbäck B, Carlsson M, Svensson PJ. Familial thrombophilia due to a previously unrecognized mechanism characterized by poor anticoagulant response to activated protein C: prediction of a cofactor to activated protein C. Proc Natl Acad Sci U S A. 1993;90:1004–1008. doi: 10.1073/pnas.90.3.1004. [DOI] [PMC free article] [PubMed] [Google Scholar]
- 28.Bertina RM, Reitsma PH, Rosendaal FR, Vandenbroucke JP. Resistance to activated protein C and factor V Leiden as risk factors for venous thrombosis. Thromb Haemost. 1995;74:449–453. [PubMed] [Google Scholar]
- 29.de Visser MCH, Rosendaal FR, Bertina RM. A reduced sensitivity for activated protein C in the absence of factor V Leiden increases the risk of venous thrombosis. Blood. 1999;93:1271–1276. [PubMed] [Google Scholar]
- 30.Rodeghiero F, Tosetto A. Activated protein C resistance and factor V Leiden mutation are independent risk factors for venous thromboembolism. Ann Intern Med. 1999;130:643–650. doi: 10.7326/0003-4819-130-8-199904200-00004. [DOI] [PubMed] [Google Scholar]
- 31.Rosing J, Tans G. Effects of oral contraceptives on hemastasis and thrombosis. Am J Obstet Gynecol. 1999;180:S375–S382. doi: 10.1016/s0002-9378(99)70699-x. [DOI] [PubMed] [Google Scholar]
- 32.Gerstman BB, Piper JM, Tomita DK, Ferguson WJ, Stadel BV, Lundin FE. Oral contraceptive estrogen dose and the risk of deep venous thromboembolic disease. Am J Epidemiol. 1991;133:32–37. doi: 10.1093/oxfordjournals.aje.a115799. [DOI] [PubMed] [Google Scholar]
- 33.Lidegaard O, Nielsen LH, Skovlund CW, Skjeldestad FE, Lokkegaard E. Risk of venous thromboembolism from use of oral contraceptives containing different progestogens and oestrogen doses: Danish cohort study, 2001–9. BMJ. 2011;343:d6423. doi: 10.1136/bmj.d6423. [DOI] [PMC free article] [PubMed] [Google Scholar]
- 34.Westhoff CL, Pike MC, Tang R, DiNapoli MN, Sull M, Cremers S. Estimating systemic exposure to ethinyl estradiol from an oral contraceptive. Am J Obstet Gynecol. 2015;212:614.e1–614.e7. doi: 10.1016/j.ajog.2014.12.007. [DOI] [PMC free article] [PubMed] [Google Scholar]
- 35.World Health Organization. Reproductive Health and Research. 4th. Geneva: World Health Organization; 2010. Medical eligibility criteria for contraceptive use; pp. 15–43. [Google Scholar]
- 36.Seré KM, Rosing J, Hackeng TM. Inhibition of thrombin generation by protein S at low procoagulant stimuli: implications for maintenance of the hemostatic balance. Blood. 2004;104:3624–3630. doi: 10.1182/blood-2004-03-1146. [DOI] [PubMed] [Google Scholar]
- 37.Hemker HC, Giesen P, Al Dieri R, Regnault V, de Smedt E, Wagenvoord R, et al. Calibrated automated thrombin generation measurement in clotting plasma. Pathophysiol Haemost Thromb. 2003;33:4–15. doi: 10.1159/000071636. [DOI] [PubMed] [Google Scholar]
- 38.Westhoff CL, Petrie KA, Cremers S. Using changes in binding globulins to assess oral contraceptive compliance. Contraception. 2013;87:176–181. doi: 10.1016/j.contraception.2012.06.003. [DOI] [PMC free article] [PubMed] [Google Scholar]


