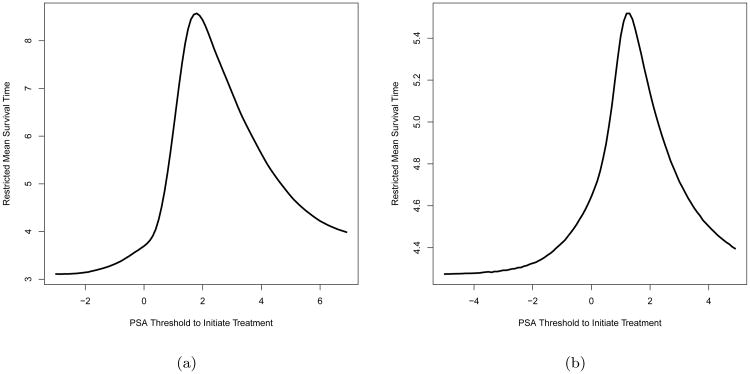
Figure 2.
True under Scenario 1 (Figure 2a) and Scenario 2 (Figure 2b) in the simulation study. In each figure, The x-axis stands for the regime specific PSA threshold for SADT initiation b, while the y-axis stands for the true regime specific RMST calculated from Monte Carlo method. Each point in the plots above are calculated from 107 Monte Carlo samples.

