

Abstract
The changing epidemiology of Clostridium difficile infection over the past decades presents a significant challenge in the management of C. difficile associated diseases. The gastrointestinal tract microbiota provides colonization resistance against C. difficile, and growing evidence suggests that gut microbial derived secondary bile acids (SBAs) play a role. We hypothesized that the C. difficile life cycle; spore germination and outgrowth, growth, and toxin production, of strains that vary by age and ribotype will differ in their sensitivity to SBAs. C. difficile strains R20291 and CD196 (ribotype 027), M68 and CF5 (017), 630 (012), BI9 (001) and M120 (078) were used to define taurocholate (TCA) mediated spore germination and outgrowth, growth, and toxin activity in the absence and presence of gut microbial derived SBAs (deoxycholate, isodeoxycholate, lithocholate, isolithocholate, ursodeoxycholate, ω-muricholate, and hyodeoxycholate) found in the human and mouse large intestine. C. difficile strains varied in their rates of germination, growth kinetics, and toxin activity without the addition of SBAs. C. difficile M120, a highly divergent strain, had robust germination, growth, but significantly lower toxin activity compared to other strains. Many SBAs were able to inhibit TCA mediated spore germination and outgrowth, growth, and toxin activity in a dose dependent manner, but the level of inhibition and resistance varied across all strains and ribotypes. This study illustrates how clinically relevant C. difficile strains can have different responses when exposed to SBAs present in the gastrointestinal tract.
Keywords: C. difficile, bile acids, gut microbiota, metabolome, germination, growth, toxin
Introduction
Clostridium difficile is a Gram-positive, spore forming, anaerobic bacillus and is the leading cause of nosocomial infection worldwide [1]. In the United States half a million cases of C. difficile infection (CDI) and 29,000 deaths are reported annually [2, 3]. Clinical disease can range from mild or moderate diarrhea to fulminant and pseudomembranous colitis and even death [4, 5]. Incidence, severity, mortality, and recurrence rates of CDI have increased during the past 15 years. The changing global epidemiology of CDI has been largely attributed to the emergence of epidemic C. difficile strains, PCR ribotype 027 and 078. Other PCR ribotypes such as 001, 053, and 106 have also been associated with outbreaks and severe cases [6]. The epidemic strains are often associated with increased production of toxins A and B, increased resistance to fluoroquinolone antibiotics, and production of binary toxin [7]. A recent advisory from the Center for Disease Control and Prevention (CDC) puts C. difficile on the urgent threat list, and warns of increased incidence of community acquired CDI in individuals who have not been exposed to hospital settings or antibiotic therapy. This is a population that was previously considered low risk [8]. Due to the dynamic epidemiology of C. difficile, it is important to phenotypically characterize both historic and current epidemic strains to define how they adapt to different environmental pressures, especially those found in the gastrointestinal (GI) tract.
Antibiotics significantly disrupt the indigenous gut microbiota, but they also alter the host and gut microbiota derived bile acids allowing for C. difficile colonization [9–12]. Bile acids are end products of cholesterol metabolism and essential for lipoprotein, glucose, drug, and energy metabolism [13, 14]. Primary bile acids made by humans are cholate (CA) and chenodeoxycholate (CDCA). These bile acids are further conjugated with either taurine or glycine. Mice are slightly different, where a significant amount of CDCA is converted by the host into α-muricholate (αMCA) and β-muricholate (βMCA) [15]. Primary bile acids are released in response to food into the duodenum and a majority of them (~95%) are reabsorbed in the terminal ileum, and returned to the liver via enterohepatic recirculation. Primary bile acids that reach the large intestine (~5%) are acted upon by specific members of the gut microbiota and biotransformed via two enzymatic reactions, deconjugation and dehydroxylation, into secondary bile acids (SBAs), where they remain at relatively high concentrations (200–1000 μM) [16]. There are approximately 50 different chemically distinct SBAs found in human large intestine [17]. Figure 1 illustrates the most abundant SBAs: deoxycholate (DCA), lithocholate (LCA), and ursodeoxycholate (UDCA) [16]. Isodeoxycholate (iDCA) and isolithocholate (iLCA) are 3β-OH epimers of DCA and LCA [16, 18]. Additionally, ω-muricholate (ωMCA) an epimer of βMCA and hyodeoxycholate (HDCA) are only present in mice [19–21]. The physiologically relevant concentrations of SBAs in the human and mouse large intestine, and the concentrations used in the present study are presented in Table 1.
Figure 1. Production of gut microbial derived secondary bile acids.
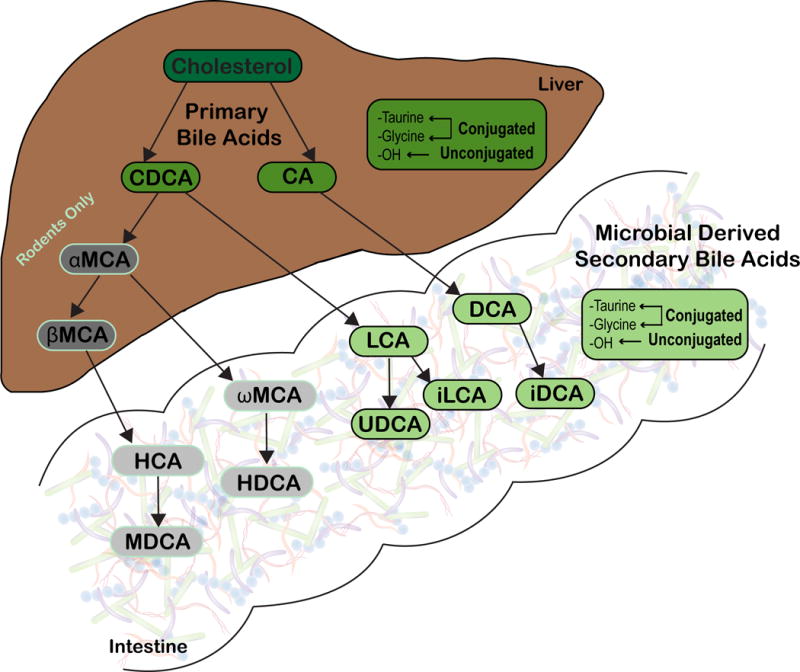
Primary bile acids, chenodeoxycholate (CDCA) and cholate (CA) are synthesized from cholesterol by hepatocytes in humans and rodents. In rodents, a portion of CDCA is further converted into α-muricholate (αMCA) and β-muricholate (βMCA), which are not recognized in humans (represented in gray). Primary bile acids can be unconjugated or further modified via conjugation to taurine or glycine within the liver. Once synthesized, host derived primary bile acids (represented in darker shades) enter into bile. Bile is stored in the gallbladder until release in the duodenum following ingestion of a meal. Once within the gastrointestinal tract, the gut microbiota can convert host derived primary bile acids into secondary bile acids (represented in lighter shades). Microbial derived secondary bile acids can also be unconjugated or conjugated to taurine or glycine. Image modified from Winston et al., [27]. Abbreviations: CA, cholate; CDCA, chenodeoxycholate; DCA, deoxycholate; iDCA, iso-deoxycholate; HCA, hyocholate; HDCA, hyodeoxycholate; LCA, lithocholate; iLCA, iso-lithocholate; MDCA, murideoxycholate; UDCA, ursodeoxycholate; αMCA, α-muricholate; βMCA, β-muricholate; ωMCA, ω-muricholate
Table 1.
Physiological range of secondary bile acids used in this study and present in the gut
| Secondary bile acids | Concentration (%) in this study | Concentration (mM) in this study | Concentration (mM) physiologicala | Species | Reference |
|---|---|---|---|---|---|
| Deoxycholate | 0.002–0.02 | 0.051–5.095 | 0.03–0.700 | Human | 16 |
| Isodeoxycholate | 0.01–0.1 | 0.255–2.547 | 0–0.290 | Human | 16 |
| Lithocholate | 0.001–0.01 | 0.027–0.266 | 0.001–0.450 | Human | 16 |
| Isolithocholate | 0.00003–0.1 | 0.001–2.656 | 0–0.360 | Human | 16 |
| Ursodeoxycholate | 0.004–0.04 | 0.102–1.019 | 0–0.769 | Human | 16 |
| ω-Muricholate | 0.004–0.04 | 0.098–0.979 | 0.002–38.21 | Mouse | 19, 21 |
| Hyodeoxycholate | 0.002–0.02 | 0.051–0.509 | 0.0001–5.09 | Mouse | 19, 21 |
per ml large intestinal contents
C. difficile spores require specific bile acids and amino acids for germination into metabolically active vegetative cells [22]. Primary bile acids such as taurocholate (TCA) and CA are present in high concentrations in the distal small intestine and are primary germinants for C. difficile spores along with glycine. [16]. However, CDCA, another primary bile acid, is able to inhibit C. difficile germination [23]. Recent studies show that depletion of the microbial members responsible for converting primary bile acids to SBAs reduces resistance against C. difficile in the large intestine [24–27]. There are studies showing that the SBAs ωMCA, LCA, UDCA, and HDCA inhibit TCA mediated spore germination in C. difficile UK1, M68, and VPI 10463, and growth of strains CD196, UK14, UK1, M68, and VPI 10463 in vitro [11, 28, 29]. However, there are fewer studies showing how SBAs alter all stages of the C. difficile life cycle (spore germination, growth, and toxin activity) of clinically relevant epidemic, non-epidemic, historic, and more recent strains.
Past studies have shown that spore germination rates of clinically relevant C. difficile isolates varied when exposed to primary bile acid TCA and CDCA, a known inhibitor of spore germination in vitro [23, 30]. Therefore, it is conceivable that differences may also exist in the inhibitory effect of SBAs on not only spore germination, but on other stages of the C. difficile life cycle including growth, and toxin activity, which mediates disease. We hypothesize that spore germination, growth, and toxin activity of clinically diverse C. difficile strains will vary in their sensitivity to SBAs. Here we show the differences in the inhibitory effect of SBAs; specifically DCA, iDCA, LCA, iLCA, UDCA, ωMCA, and HDCA, on TCA mediated spore germination and outgrowth, growth, and toxin activity of clinically relevant C. difficile strains R20291 and CD196 (ribotype 027), M68 and CF5 (017), 630 (012), BI9 (001) and M120 (078). Defining how SBAs affect different stages of the C. difficile life cycle in clinically relevant strains will help us understand how different strains are able to survive and cause disease in the GI tract. It will also allow us to better understand how these SBAs could be used as potential therapeutics against CDI.
Materials and Methods
Strain selection
C. difficile strains were provided by Trevor Lawley by way of Joe Sorg and Aimee Shen. The origin and ribotype information for each strain is listed in Table 2. C. difficile strains were selected from a range of PCR ribotypes that included epidemic (R20291 [31] and M68 [32]), non-epidemic (CD196 [31] and CF5 [32]), historic (CD196, CF5 and 630 [33]), current (R20291, M68 and BI9 [32]), and a genetically divergent strain (M120 [32]).
Table 2.
C. difficile strains used in this study
| Strain | Ribotype | Strain isolation source/place/date | Reference |
|---|---|---|---|
| R20291 | 027 | Human/ London/ 2006 | 31 |
| CD196 | 027 | Human/ France/ 1985 | 31 |
| M68 | 017 | Human/ Dublin/ 2006 | 32 |
| CF5 | 017 | Human / Belgium/ 1995 | 32 |
| 630 | 012 | Human/ Zurich/ 1982 | 33 |
| BI9 | 001 | Gerding Collection | 32 |
| M120 | 078 | Human/ UK/ 2007 | 32 |
Microbial derived secondary bile acid selection
The bile acids [ωMCA (Steraloids, Catalog ID No. C1888-000), HDCA (Steraloids Catalog ID No. C0860-000), UDCA (Steraloids, Catalog ID No. C1020-000), LCA (Steraloids, Catalog ID No. C1420-000), iLCA (Steraloids, Catalog ID No. C1475-000), DCA (Steraloids, Catalog ID No. C1070-000), iDCA (Steraloids, Catalog ID No. C1170-000)] selected were representative of those present in the mouse and human intestine [11, 16, 18]. The bile acids used in all the assays were soluble in 100% ethanol (Fisher Scientific BP2818), whereas TCA (T40009, Sigma-Aldrich, St Louis, MO) was dissolved in ultrapure water. The SBA concentrations used in this study are expressed % and mM in Table 1.
Spore preparation
C. difficile spores were prepared as described previously [11, 34]. Briefly, individual C. difficile strains were grown at 37°C anaerobically overnight in 2 ml Columbia broth and then added to 40 ml culture of Clospore media in which it was allowed to sporulate for 5–7 days. Spores were harvested by centrifugation, and subjected to 3–5 washes with sterile cold water to ensure spore purity. Spore stocks were stored at 4°C in sterile water until use.
Spore germination and outgrowth assay
The spore germination and outgrowth assay protocol is modified from Carlson et al., and Theriot et al. [11, 30]. Purified spores were enumerated and tested for purity before use. The spores were examined under phase contrast microscope to observe phase-bright bodies, which indicates non-germinated intact spores. The spore stock was resuspended in ultrapure water to achieve an initial spore concentration of approximately 106 spores/ml. The spore suspension was subjected to heat treatment (65°C for 20 min) to eliminate any vegetative cells. The spores were then plated on both brain heart infusion (BHI) with 100 mg/liter L-cysteine, and BHI media supplemented with 0.1% TCA, and further incubated at 37°C for 24 hr. We further observed a lawn of C. difficile colonies on BHI media supplemented with 0.1% TCA, and no visible growth on BHI media alone, which indicates that the spore suspension was devoid of vegetative cells. Bile acid solutions containing two concentrations were used to study a dose response [DCA (0.02 %, 0.2%), iDCA (0.01%, 0.1%), LCA (0.001%, 0.01%), iLCA (0.01%, 0.1%), UDCA (0.004%, 0.04%), ωMCA (0.004%, 0.04%), and HDCA (0.002%, 0.02%)]. Bile acids were dissolved in either water or ethanol, passed into the anaerobic chamber (Coy labs), and added to BHI broth with 0.1% TCA. Chendeoxycholate (CDCA, Fisher Scientific, 50328656) at 0.04% is a known inhibitor of TCA mediated spore germination, and was used as a negative control. TCA at 0.1% made in water, and water and ethanol was used as positive controls. C. difficile spores were added to BHI broth supplemented with and without TCA 0.1% and secondary bile acids at concentrations listed above, and allowed to incubate for 30 min at 37°C anaerobically. Bacterial enumeration of the samples was performed on both BHI agar (vegetative cells only) and BHI agar supplemented with 0.1% TCA (germinated spores and vegetative cells). Percent germination was calculated as [(CFUs on BHI supplemented with TCA + SBAs) / (CFUs on BHI supplemented with TCA alone)] × 100. All measurements were performed in triplicate for each isolate and expressed as percent germination.
Growth kinetics assay
C. difficile strains were cultured overnight at 37°C in BHI plus 100 mg/liter L-cysteine broth in an anaerobic growth chamber. After 14 hr of growth, C. difficile was subcultured 1:10 and 1:5 into BHI plus 100 mg/liter L-cysteine and allowed to grow for 3 hr anaerobically at 37°C. The culture was then diluted in fresh BHI so that the starting optical density at 600 nm (OD600) was 0.01. The cell suspension was added to a 96-well plate at a final volume of 0.2 ml. All bile acid solutions were used at the same concentrations used in the germination assay except iLCA (0.00003%, 0.0003%) and DCA (0.002%, 0.02%), which were used at lower concentrations either due to solubility issues or due to precipitation of these bile acids when incubated over a 24 hr period. Filter-sterilized bile acids were added to the wells of a 96-well flat bottom microtiter plate in triplicate, and two to three biological replicates were run. The optical density was monitored every 30 min for 24 hr, shaking the plate for 90 sec before each reading, in a Tecan plate reader inside an anaerobic chamber. A growthcurver package in R was used to fit growth data into a non-linear least-squares Levenberg-Marquardt algorithm to summarize growth dynamics of clinical C. difficile strains without that addition of SBAs. Table 2 displays the growth rates and doubling times of each strain in BHI alone and in BHI supplemented with ethanol [35].
Vero cell cytotoxicity assay
This protocol is modified from Winston et al [36]. Vero cells were grown and maintained in DMEM media (Gibco Laboratories, 11965-092) with 10% fetal bovine serum (Gibco Laboratories, 16140-071) and 1% Penicillin streptomycin solution (Gibco Laboratories, 15070-063). Cells were incubated with 0.25% trypsin (Gibco Laboratories, 25200-056) washed with 1X DMEM media and harvested by centrifugation 1,000 RPM for 5 min. Cells were plated at 1 × 10⁴ cells per well in a 96-well flat bottom microtiter plate (Corning, 3596) and incubated overnight at 37°C / 5% CO2. Growth plates described above (24 hr) were defrosted on ice and then centrifuged at 1,750 RPM for 5 min to pellet vegetative C. difficile. Supernatants were collected from each well and 10-fold dilutions, to a maximum of 10−6, were performed. Sample dilutions were incubated 1:1 with PBS (for all dilutions) or antitoxin (performed for 10−1 and 10−4 dilutions only, TechLabs, T5000) for 40 min at room temperature. Following incubation, these admixtures were added to the Vero cells and plates were incubated overnight at 37°C / 5% CO2. Vero cells were viewed under 200X magnification for rounding after overnight incubation. The cytotoxic titer was defined as the reciprocal of the highest dilution that produced rounding in 80% of Vero cells for each sample. Vero cells treated with purified C. difficile toxins (A and B) and antitoxin (List Biological Labs, 152C and 155C; TechLabs, T5000) were used as controls.
Statistical methods
Statistical tests were performed using Prism version 7.0a for Mac OS X (GraphPad Software, La Jolla California USA). One-way analysis of variance test followed by Tukey’s Multiple Comparison Test was used to calculate significance in growth rate and doubling time between C. difficile strains in Table 3, and differences between strains for TCA mediated spore germination and outgrowth, and toxin activity in Figure 2. Significance between positive controls and treatment groups for each strain in spore germination and toxin activity assays were calculated by Student’s parametric t-test with Welch’s correction (Figure 2–9). Statistical significance was set at a p value of < 0.05 for all analyses (*, p < 0.05; **, p < 0.01; ***, p < 0.001; ****, p < 0.0001). Spearman’s rank correlation coefficients (r) were calculated for all pairs of terminal OD and toxin activity at 24 hr for each strain (Figure 10).
Table 3.
Growth rate and doubling times for C. difficile strains
| Strain | Ribotype | Growth rate BHI + EthOH (hr)−1 | Doubling time BHI + EthOH (hr) |
|---|---|---|---|
| R20291 | 027 | 0.65 ± 0.096bc | 0.83 ± 0.116b |
| CD196 | 027 | 0.60 ± 0.106bc | 1.08 ± 0.186b |
| M68 | 017 | 0.96 ± 0.209ba | 0.89 ± 0.103b |
| CF5 | 017 | 0.64 ± 0.036bc | 1.01 ± 0.090b |
| 630 | 012 | 0.31 ± 0.019c | 1.95 ± 0.009a |
| BI9 | 001 | 0.81 ± 0.009b | 0.85 ± 0.200b |
| M120 | 078 | 1.40 ± 0.059a | 0.72 ± 0.287b |
Values are expressed as mean ± SEM for n = 9 from three independent experiments.
Means in a column bearing different superscript letters are significantly different (P < 0.0001).
BHI: Brain heart infusion, EthOH: Ethanol.
Figure 2. Diverse C. difficile strains vary in TCA mediated spore germination and outgrowth, growth kinetics, and toxin activity.
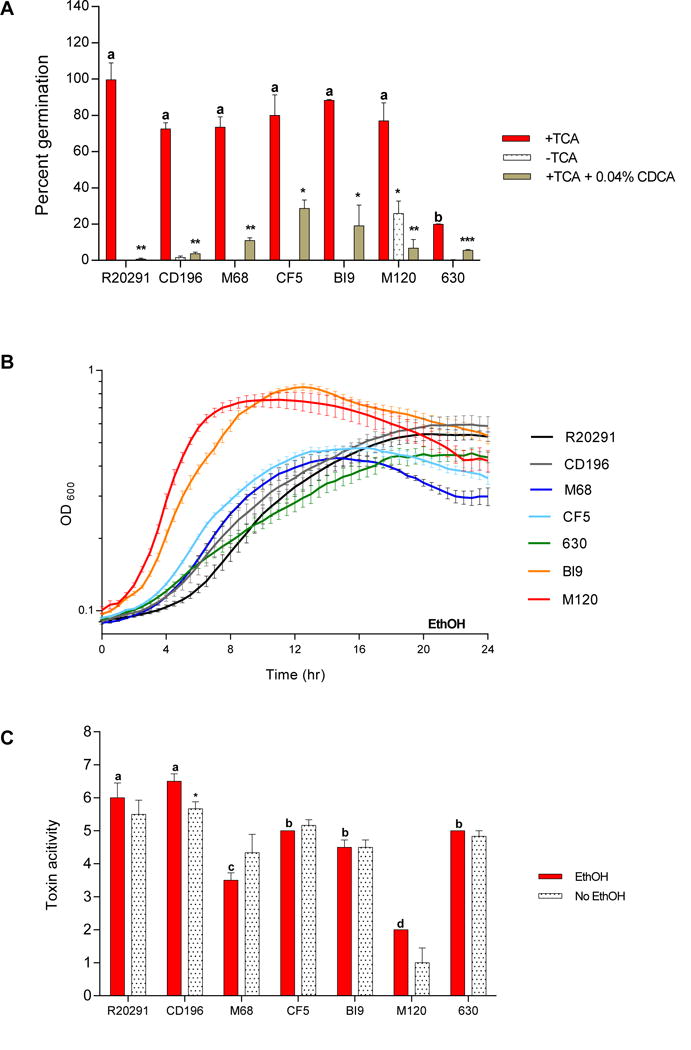
(A) In vitro spore germination and outgrowth assay of C. difficile in 0.1% TCA with ethanol (+TCA, positive control), with 0.04% CDCA (+TCA+0.04% CDCA, negative control), and without TCA (−TCA). (B) Growth curves of C. difficile strains in BHI media supplemented with ethanol without SBAs (EthOH, solid lines). (C) Culture supernatants after 24 hr growth were used for a Vero cell cytotoxicity assay. Toxin titer is expressed as log10 reciprocal dilution toxin per 100 μ1 of C. difficile culture supernatant. C. difficile strains grown in BHI media supplemented with ethanol (EthOH, positive control), and without ethanol (No EthOH) are shown. Data presented represents mean ± SEM of triplicate experiments in A, and duplicate experiments done in triplicate in B and C. Statistical significance between positive controls and treatment groups was determined by Student’s parametric t-test with Welch’s correction for A and C (*, p < 0.05; **, p < 0.01; ***, p < 0.001; ****, p < 0.0001). Differences between strains for TCA mediated spore germination and outgrowth (red bars in 2A), and toxin activity (red bars in 2C) was determined by One-way analysis of variance test followed by Tukey’s Multiple Comparison Test. Bars bearing different letters (a–d) are significantly different (p < 0.0001).
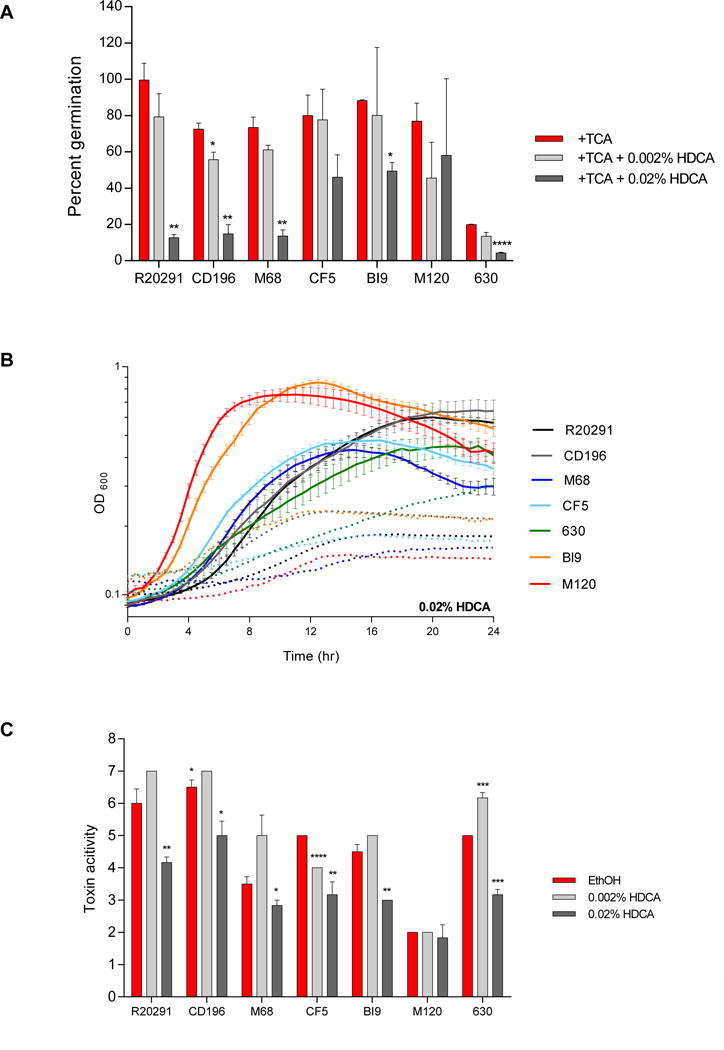
Figure 9. Effect of HDCA on TCA-mediated spore germination and outgrowth, growth kinetics, and toxin activity of C. difficile strains.
(A) In vitro assay to assess if the addition of HDCA (0.002% and 0.02%) will inhibit TCA-mediated spore germination and outgrowth compared to positive controls, 0.1% TCA with ethanol (+TCA, red bar). All treatment groups were supplemented with 0.1% TCA. (B) Growth curves of C. difficile strains in BHI media with ethanol alone (solid lines), and the addition of 0.02% HDCA (dotted lines). The data presented represents OD600 ± SEM for positive controls and OD600 mean for HDCA from triplicate experiments. (C) Culture supernatants after 24 hr growth were used for a Vero cell cytotoxicity assay and the data is expressed as log10 reciprocal dilution toxin per 100 μ1 of C. difficile culture supernatant. C. difficile strains grown in BHI media with ethanol without SBAs (EthOH, positive control) and with HDCA (0.002% and 0.02%).
Figure 10. Positive correlation of C. difficile growth with toxin activity measured at 24 hr.
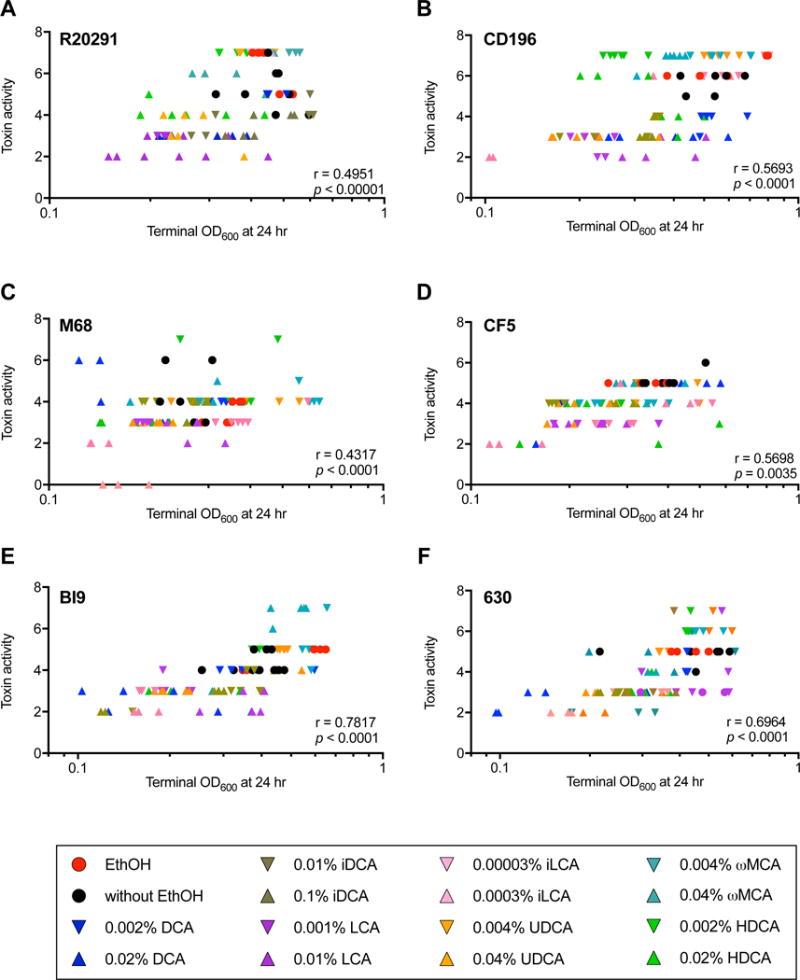
Using Spearman’s correlation (r) the terminal OD and toxin activity at 24 hr were correlated for C. difficile strains in the presence and absence of SBAs. C. difficile (A) R20291, (B) CD196, (C) M68, (D) CF5, (E) BI9, and (F) 630 had a significant positive correlation between terminal OD and toxin activity at 24 hr (p < 0.0001). M120 had no significant correlation between C. difficile growth and toxin activity (data not shown). Positive controls include C. difficile strains in the absence of SBAs (circles); lower concentration of SBAs (down triangles), and higher concentration of SBAs (up triangles). The color code are as follows: ethanol only (red), without ethanol (black), DCA (blue), iDCA (brown), LCA (purple), iLCA (pink), UDCA (orange), ωMCA (teal), and HDCA (lime green).
Results
Diverse C. difficile clinical strains vary in TCA mediated spore germination and outgrowth, growth kinetics, and toxin activity
In this study all bile acids were dissolved in 100% ethanol, so positive controls include the addition of ethanol without the addition of SBAs to ensure that ethanol alone does not inhibit C. difficile, Figure 2A (+TCA, red bar), Figure 2B (solid lines), and Figure 2C (EthOH, red bar). There was no significant difference in germination rates between spores supplemented with and without ethanol with TCA (data not shown). All C. difficile strains exhibit more than 70% spore germination and outgrowth with the addition of 0.1% TCA except for strain 630, which exhibited less than 20% germination and was significantly different from all other strains (R20291, p < 0.001; CD196, p < 0.001; M68, p < 0.001; CF5, p < 0.001; BI9, p < 0.0001; and M120, p < 0.001,in Figure 2A). A potent inhibitor of TCA mediated spore germination, CDCA, significantly inhibited germination of all strains in Figure 2A (+TCA+0.04% CDCA, grey bar). In order to assess if spore germination was possible in the absence of 0.1% TCA, we incubated spores in BHI media without TCA (Figure 2A, -TCA). Five of the seven strains tested did not show germination and outgrowth, however CD196 and M120 spores were able to germinate and outgrow without the addition of TCA.
For C. difficile growth experiments, differences in growth kinetics were observed between strains as seen in Figure 2B. Again ethanol was supplemented in BHI media to mimic the same concentrations with the addition of SBAs. The growth rates and doubling times differed between C. difficile strains (Table 3, One-way ANOVA followed by Tukey’s Multiple Comparison Test, p < 0.0001). Increased growth rate correlated with a decrease in doubling time. C. difficile culture supernatants after 24 hr of incubation with (EthOH, gray bar) and without the addition of ethanol (no EthOH) were used to determine the toxin activity using the Vero cell cytotoxicity assay. Toxin titers for all strains ranged between 4–7 log10 reciprocal dilution toxin per 100 μ1 of C. difficile culture supernatant (Figure 2C). The addition of ethanol to growth media only affected the toxin activity of CD196, which showed significantly higher toxin activity compared to no ethanol. The toxin activity of R20291 and CD196 (red bar) was significantly greater than the toxin activity of all other strains (M68, p < 0.0001; CF5, p < 0.001; BI9, p < 0.0001; and M120, p < 0.0001). Interestingly, the toxin activity of M120 (red bar) was significantly less than all other C. difficile strains (R20291, p < 0.0001; CD196, p < 0.0001; M68, p < 0.001; CF5, p < 0.0001, and 630, p < 0.0001).
Secondary bile acids alter TCA mediated spore germination and outgrowth, growth kinetics, and toxin activity of clinically relevant C. difficile strains
Deoxycholate
As presented in Figure 3A, spore germination and outgrowth with the addition of 0.2% DCA was significantly lower for all strains compared to controls without the addition of DCA. The lower concentration of DCA (0.02%) significantly inhibited CD196, but did not inhibit other strains. Although the lower concentration did not reach significance, there was a decrease in germination compared to controls, suggesting a dose response. At a concentration of 0.002%, DCA did not significantly alter TCA mediated spore germination in all strains (data not shown). We further evaluated the differences in the growth kinetics of C. difficile strains with the addition of DCA (Figure 3B). Deoxycholate at 0.002% did not affect the growth of any strains (Supplemental Figure 1A). In contrast, with the addition of 0.02% DCA, strains 630 and BI9 were unable to grow. The growth kinetics of other strains was altered and overall growth was diminished by the additional 0.02% DCA compared to the ethanol control. The toxin activity measured from culture supernatants of strains, M68, CF5, BI9, and 630 treated with 0.002% DCA were comparable to the ethanol controls. However, at this DCA concentration R20291 and CD196 toxin activity was significantly decreased compared to the ethanol control despite unaltered growth kinetics (Figure 3C). Strain M120 displayed a significant increase in toxin activity at this concentration of DCA. At the higher concentration of DCA (0.02%), all strains except for M68 and M120 had significantly less toxin activity. Although 0.02% DCA diminished growth kinetics, the toxin activity was not reduced for M68, and M120 toxin activity was significantly increased (Figure 3C).
Figure 3. Effect of DCA on TCA mediated spore germination and outgrowth, growth kinetics, and toxin activity of C. difficile strains.
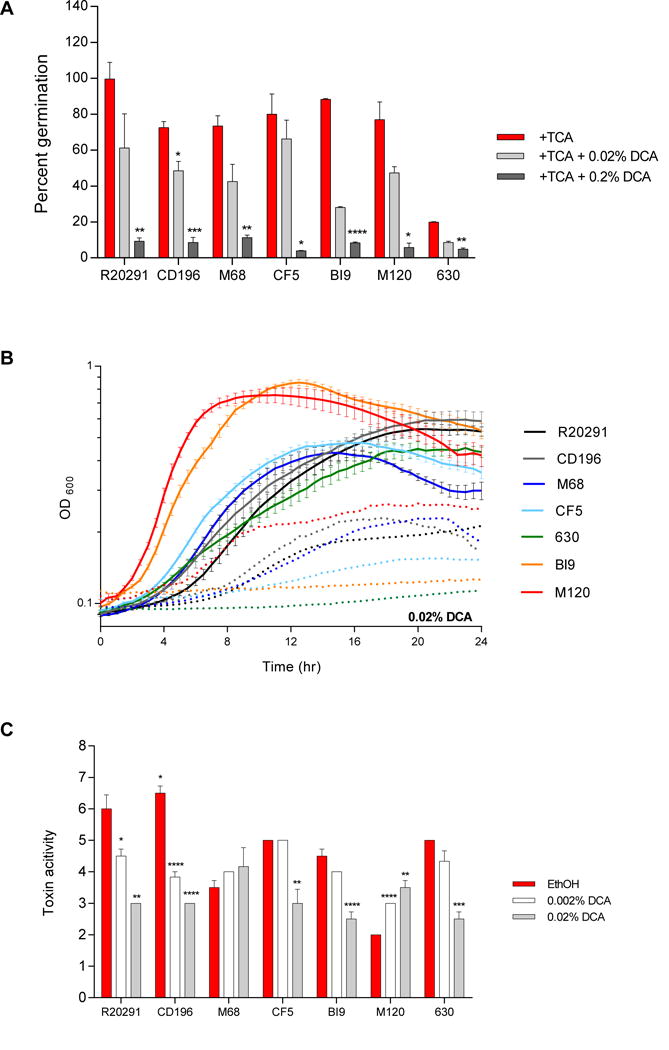
(A) In vitro assay to assess if the addition of DCA (0.02% and 0.2%) will inhibit TCA mediated spore germination and outgrowth compared to positive controls, 0.1% TCA with ethanol (+TCA, red bar). All treatment groups were supplemented with 0.1% TCA. (B) Growth curves of C. difficile strains in BHI media with ethanol alone (solid lines), and the addition of 0.02% DCA (dotted lines). The data presented represents OD600 ± SEM for positive controls and OD600 mean for DCA from triplicate experiments. (C) Culture supernatants after 24 hr growth were used for a Vero cell cytotoxicity assay. Toxin titer is expressed as log10 reciprocal dilution toxin per 100 μ1 of C. difficile culture supernatant. C. difficile strains grown in BHI media with ethanol without SBAs (EthOH, positive control) and with DCA (0.002% and 0.02%). Data presented represents mean ± SEM of triplicate experiments in A, and duplicate experiments done in triplicate in B and C. Statistical significance between positive controls and treatment groups was determined by Student’s parametric t-test with Welch’s correction for A and C (*, p < 0.05; **, p < 0.01; ***, p < 0.001; ****, p < 0.0001) in Figures 3–9.
Isodeoxycholate
R20291 and M120 were resistant to both concentrations of iDCA (0.01% and 0.1%) and therefore did not exhibit any differences in spore germination and outgrowth when compared to the ethanol controls (Figure 4A). Spore germination for CD196, M68, CF5, BI9, and 630 were significantly inhibited by 0.1% iDCA. Addition of 0.01% iDCA minimally altered growth (Figure 4B). The growth kinetics of the higher iDCA concentration (0.1%) is not presented due to interference with OD. The toxin activity of the different C. difficile strains also varied in response to iDCA (Figure 4C). R20291, CD196, CF5, and BI9 had significantly decreased toxin activity when exposed to 0.01% iDCA, despite normal growth kinetics. At 0.1% iDCA toxin activity was significantly decreased in all strains except M68 and M120. Toxin activity of M68 was unaffected by exposure to either concentration of iDCA. For strain M120, toxin activity was significantly increased at both concentrations of iDCA compared to its ethanol control.
Figure 4. Effect of iDCA on TCA mediated spore germination and outgrowth, growth kinetics, and toxin activity of C. difficile strains.
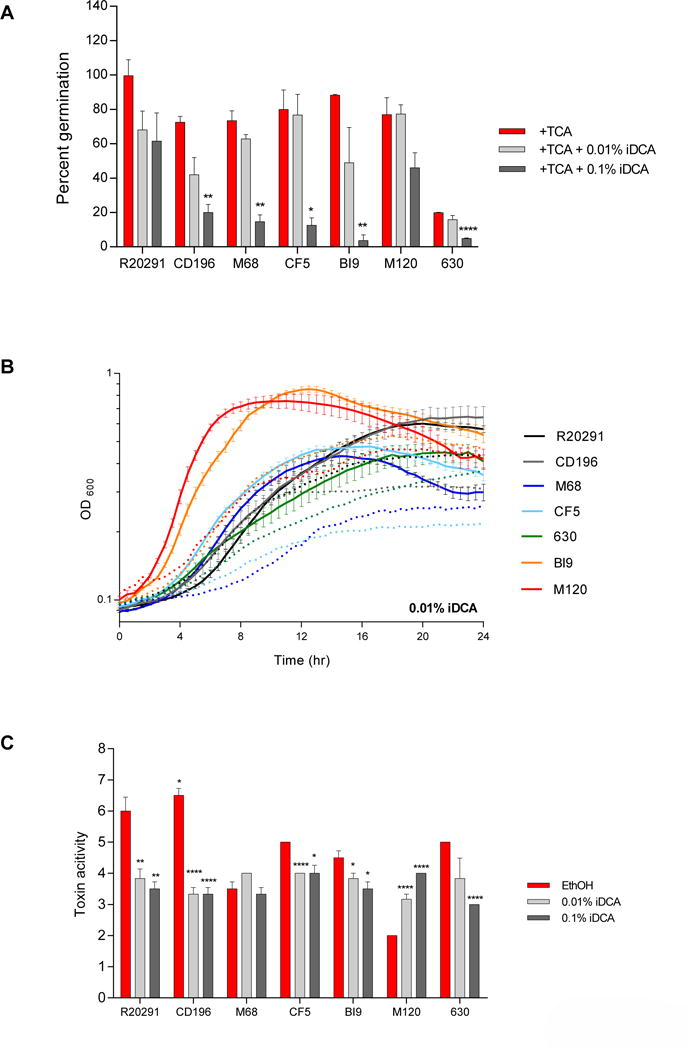
(A) In vitro assay to assess if the addition of iDCA (0.01% and 0.1%) will inhibit TCA-mediated spore germination and outgrowth compared to positive controls, 0.1% TCA with ethanol (+TCA, red bar). All treatment groups were supplemented with 0.1% TCA. (B) Growth curves of C. difficile strains in BHI media with ethanol alone (solid lines), and the addition of 0.1% iDCA (dotted lines). The data presented represents OD600 ± SEM for positive controls and OD600 mean for iDCA from triplicate experiments. (C) Culture supernatants after 24 hr growth were used for a Vero cell cytotoxicity assay and the data is expressed as log10 reciprocal dilution toxin per 100 μ1 of C. difficile culture supernatant. C. difficile strains grown in BHI media with ethanol without SBAs (EthOH, positive control) and with iDCA (0.01% and 0.1%).
Lithocholate
Spore germination and outgrowth of two, CD196 and M68, out of the seven strains were significantly inhibited at 0.001% LCA (Figure 5A). Spore germination of R20291 decreased with both concentrations of LCA, although it did not reach statistical significance. In the remaining strains, CD196, M68, CF5, BI9, M120, and 630, spore germination was significantly inhibited with the addition of a higher concentration of LCA (0.01%). Altered and diminished growth kinetics were present for all strains exposed to 0.001% LCA, except in strain 630 (Figure 5B). The growth kinetics of the higher concentration of LCA (0.01%) is not presented due to interference with OD. At the lower concentration of LCA, toxin activity was significantly decreased only in strains R20291, CD196, CF5, and BI9. However, toxin activity was significantly decreased in all strains exposed to the higher concentration of LCA (0.01%), except for strain M120. For strain M120, 0.001% LCA resulted in a significant increase in toxin activity compared to the ethanol control. Growth kinetics were not evaluated at 0.01% LCA due to interference with optical density, although the toxin is still active.
Figure 5. Effect of LCA on TCA mediated spore germination and outgrowth, growth kinetics, and toxin activity of C. difficile strains.
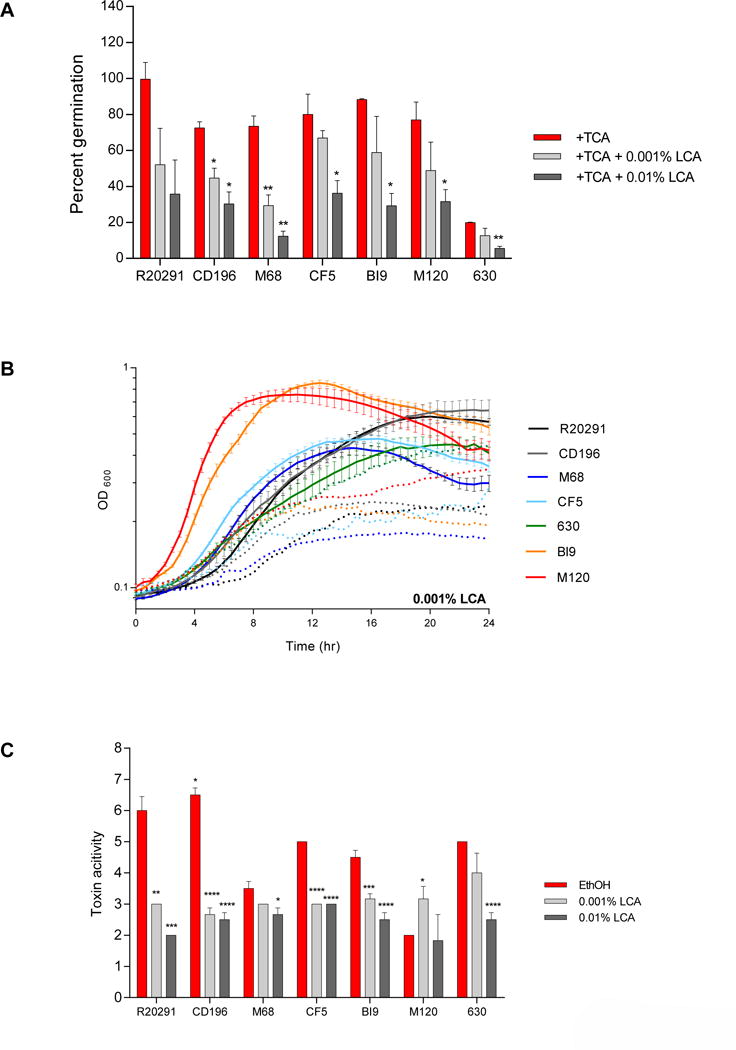
(A) In vitro assay to assess if the addition of LCA (0.001% and 0.01%) will inhibit TCA-mediated spore germination and outgrowth compared to positive controls, 0.1% TCA with ethanol (+TCA, red bar). All treatment groups were supplemented with 0.1% TCA. (B) Growth curves of C. difficile strains in BHI media with ethanol alone (solid lines), and the addition of 0. 001% LCA (dotted lines). The data presented represents OD600 ± SEM for positive controls and OD600 mean for LCA from triplicate experiments. (C) Culture supernatants after 24 hr growth were used for a Vero cell cytotoxicity assay and the data is expressed as log10 reciprocal dilution toxin per 100 μ1 of C. difficile culture supernatant. C. difficile strains grown in BHI media with ethanol without SBAs (EthOH, positive control) and with LCA (0.001% and 0.01%).
Isolithocholate
Isolithocholate at 0.01% did not inhibit spore germination and outgrowth of CF5 and M120, but it significantly inhibited at the higher concentration (0.1% iLCA) (Figure 6A). Spore germination in all other strains was sensitive to both concentrations of iLCA. The spore germination of all strains was resistant to 0.0003% iLCA (data not shown). As presented in Figure 6B, growth of CD196, M68, CF5, 630, and BI9 was prevented with the addition of 0.0003% iLCA to media. Although strain R20291 exposed to 0.0003% iLCA is able to grow, its growth kinetics were altered. At 0.00003% iLCA, strains CF5, BI9, M120, and 630 have a significant decrease in toxin activity (Figure 6C). At this concentration, growth was inhibited for strains R20291, BI9, and 630 (Supplemental Figure 1B). The growth of CF5 and M120 was unaffected, yet toxin activity was significantly decreased. At the higher concentration of iLCA (0.0003%), all strains displayed a significant decrease in toxin activity, except for R20291 and M120. For these strains, growth was altered, however toxin activity was not significantly different from ethanol controls (Figure 6C).
Figure 6. Effect of iLCA on TCA mediated spore germination and outgrowth, growth kinetics, and toxin activity of C. difficile strains.
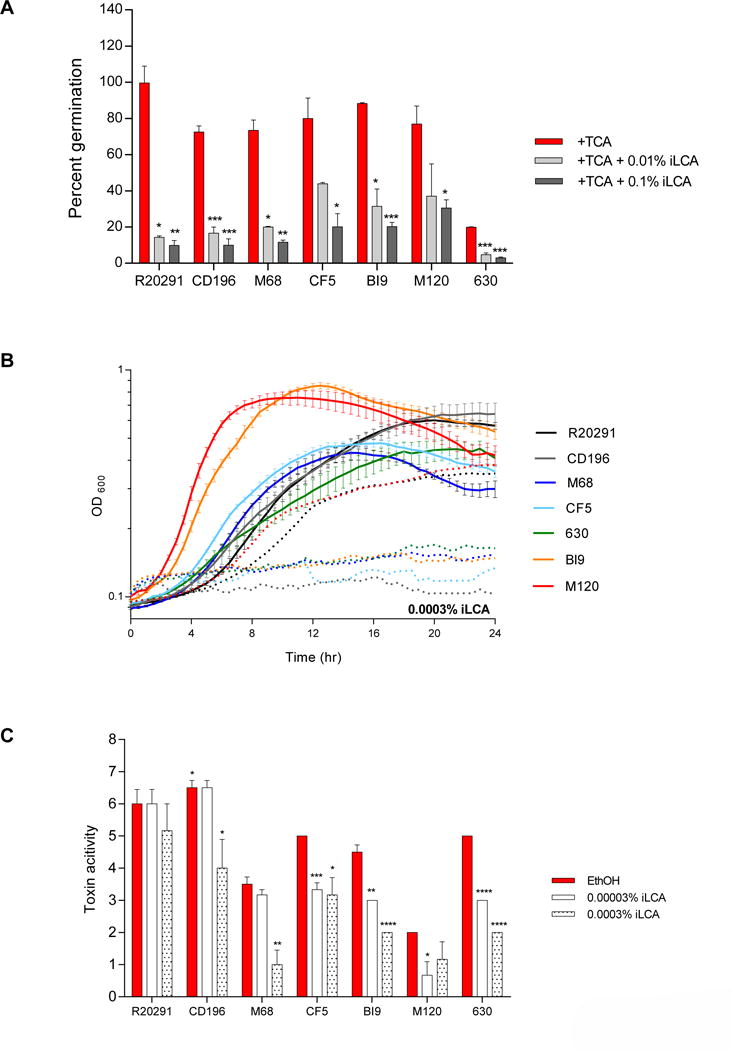
(A) In vitro assay to assess if the addition of iLCA (0.01% and 0.1%) will inhibit TCA-mediated spore germination and outgrowth compared to positive controls, 0.1% TCA with ethanol (+TCA, red bar). All treatment groups were supplemented with 0.1% TCA. (B) Growth curves of C. difficile strains in BHI media with ethanol alone (solid lines), and the addition of 0. 0003% iLCA (dotted lines). The data presented represents OD600 ± SEM for positive controls and OD600 mean for iLCA from triplicate experiments. (C) Culture supernatants after 24 hr growth were used for a Vero cell cytotoxicity assay and the data is expressed as log10 reciprocal dilution toxin per 100 μ1 of C. difficile culture supernatant. C. difficile strains grown in BHI media with ethanol without SBAs (EthOH, positive control) and with iLCA (0.0003% and 0.00003%).
Ursodeoxycholate
Spore germination and outgrowth of CD196 was significantly inhibited at 0.004% UDCA (Figure 7A). All other strains were resistant at this concentration. However, the higher concentration of UDCA (0.04%) significantly inhibited spore germination of five strains, R20291, CD196, M68, CF5, and 630. Spore germination of strains M120 and BI9 were resistant to both concentrations of UDCA. The growth of all strains was unaffected by exposure to 0.004% UDCA (Supplemental Figure 1C). However, 0.04% UDCA diminished growth and altered growth kinetics in all strains (Figure 7B). The lower concentration of UDCA (0.004%) did not significantly impact toxin activity for any strains tested (Figure 7C). Toxin activity was significantly inhibited for R20291, CD196, CF5, BI9, and 630 when exposed to 0.04% UDCA. Interestingly, toxin activity for M68 and M120 was unaffected by exposure to UDCA despite impaired growth at the higher concentration (0.04%).
Figure 7. Effect of UDCA on TCA mediated spore germination and outgrowth, growth kinetics, and toxin activity of C. difficile strains.

(A) In vitro assay to assess if the addition of UDCA (0.004% and 0.04%) will inhibit TCA-mediated spore germination and outgrowth compared to positive controls, 0.1% TCA with ethanol (+TCA, red bar). All treatment groups were supplemented with 0.1% TCA. (B) Growth curves of C. difficile strains in BHI media with ethanol alone (solid lines), and the addition of 0.04% UDCA (dotted lines). The data presented represents OD600 ± SEM for positive controls and OD600 mean for UDCA from triplicate experiments. (C) Culture supernatants after 24 hr growth were used for a Vero cell cytotoxicity assay and the data is expressed as log10 reciprocal dilution toxin per 100 μ1 of C. difficile culture supernatant. C. difficile strains grown in BHI media with ethanol without SBAs (EthOH, positive control) and with UDCA (0.004% and 0.04%).
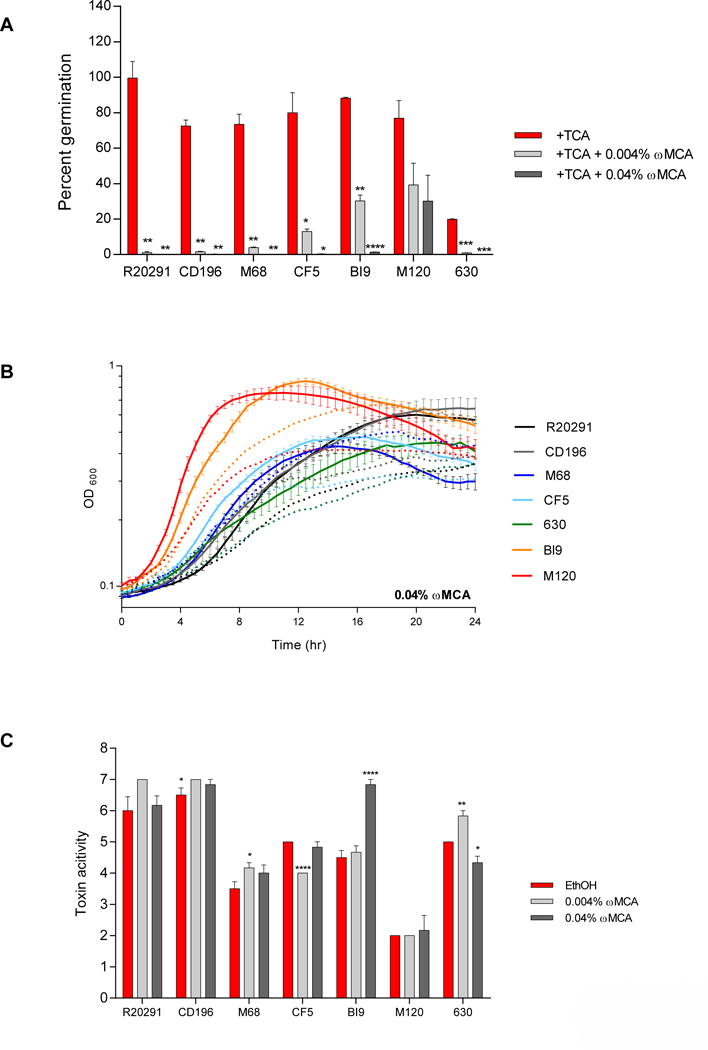
Omega-muricholate
Spore germination and outgrowth of all strains except M120 was significantly inhibited by both concentrations of ωMCA (Figure 8A). The lower concentration of ωMCA (0.004%) had no effect on growth for any of the strains (Supplemental Figure 1D). The higher concentration of ωMCA (0.04%) minimally altered the growth kinetics of all strains tested (Figure 8B). Additionally, cgMCA did not diminish toxin activity in any strain, except strains CF5 and 630, which displayed a significant decrease in toxin activity when exposed to the lower (0.004%) and higher (0.04%) concentration of ωMCA respectively (Figure 8C). Interestingly, for strains M68 and 630, 0.004% ωMCA resulted in a significant increase in culture supernatant toxin activity compared to the ethanol controls. BI9 exposed to 0.04% ωMCA also resulted in a significant increase in toxin activity compared to the ethanol control. Toxin activity for R20291 and M120 was unaffected by either concentration of ωMCA evaluated.
Figure 8. Effect of ω.
MCA on TCA-mediated spore germination and outgrowth, growth kinetics, and toxin activity of C. difficile strains. (A) In vitro assay to assess if the addition of ωMCA (0.004% and 0.04%) will inhibit TCA-mediated spore germination and outgrowth compared to positive controls, 0.1% TCA with ethanol (+TCA, red bar). All treatment groups were supplemented with 0.1% TCA. (B) Growth curves of C. difficile strains in BHI media with ethanol alone (solid lines), and the addition of 0.04% ωMCA (dotted lines). The data presented represents OD600 ± SEM for positive controls and OD600 mean for ωMCA from triplicate experiments. (C) Culture supernatants after 24 hr growth were used for a Vero cell cytotoxicity assay and the data is expressed as log10 reciprocal dilution toxin per 100 μ1 of C. difficile culture supernatant. C. difficile strains grown in BHI media with ethanol without SBAs (EthOH, positive control) and with ωMCA (0.004% and 0.04%).
Hyodeoxycholate
Hyodeoxycholate at 0.002% significantly inhibited spore germination and outgrowth for CD196 and all other strains were resistant (Figure 9A). When the concentration of HDCA was increased to 0.02%, CF5, and M120 were still resistant, however, spore germination was significantly inhibited in all other strains. Growth was unaffected at 0.002% HDCA (Supplemental Figure 1E), but 0.02% HDCA altered growth kinetics of all strains (Figure 9B). Toxin activity was significantly inhibited at 0.002% HDCA for strain CF5, despite normal growth of this strain at this concentration of HDCA (Figure 9C). For strain 630, toxin activity was significantly increased when exposed to 0.002% HDCA compared to the ethanol control. The higher concentration of HDCA (0.02%) resulted in significant suppression of toxin activity in strains R20291, CD196, M68, CF5, BI9, and 630 in accordance with diminished growth. For strain M120, the toxin activity was unaffected by either concentration of HDCA.
Discussion/Conclusion
Seven different gut microbial derived secondary bile acids (DCA, iDCA, LCA, iLCA, UDCA, ωMCA, and HDCA) were tested at physiologically relevant concentrations in vitro for their ability to differentially impact spore germination and outgrowth, growth kinetics, and toxin activity of seven clinically relevant and diverse C. difficile strains (R20291, CD196, M68, CF5, BI9, M120, and 630). Comparisons of the effects of individual SBAs between strains was not presented due to substantial differences in the baseline physiology of each strain tested (Figure 2). The results revealed that the three stages of the C. difficile life cycle assayed were impacted by the different SBAs; however, the sensitivity varied by strain and SBA. Spore germination and outgrowth, as well as growth kinetics were either inhibited or comparable to controls, however toxin activity in some strains increased in the presence of specific bile acids. For instance, all seven SBAs significantly decreased spore germination and outgrowth of CD196, but only five of the seven SBAs inhibited R20291 spore germination. Addition of LCA or iDCA did not enhance or inhibit TCA mediated spore germination of R20291. We also saw that CD196 and M120 spores were able to germinate and outgrow without the addition of TCA during the initial 30 min incubation in BHI or subsequent germination on the BHI plate during the 24 hr incubation.
Growth kinetics for all C. difficile strains were affected by the addition of SBAs when compared to growth curves without the addition of SBAs. Decreased growth or low optical densities correlated with low toxin activity (Figure 10). However, in strain M68 though growth was diminished by DCA, iDCA, and UDCA toxin activity was not affected. More interestingly, when M68, 630, and BI9 were exposed to ωMCA, and 630 was exposed to the low concentration of HDCA (0.002%), significantly higher toxin activity was reported. Toxin activity was always detected, even when the cells did not reach exponential phase in response to SBAs. ωMCA differentially inhibits different stages of the C. difficile lifecycle. It significantly inhibits spore germination and outgrowth, whereas it minimally alters growth and increases toxin activity in M68, BI9, and 630.
It is clear that bile acids play a dynamic role in the life cycle of C. difficile. It is well established that the primary bile acid TCA and other cholic acid derivatives trigger C. difficile spore germination via the germinant receptor, CspC, in vitro [37, 38]. In contrast, certain microbial derived SBAs are able to inhibit spore germination [27]. In particular, TCA mediated spore germination is inhibited by the secondary bile acids ωMCA, LCA, and UDCA in non-epidemic C. difficile strains [11, 28, 29]. Our results corroborate and expand on this by demonstrating that DCA, iDCA, iLCA, and HDCA can also inhibit spore germination and outgrowth. Inhibition of spore germination and outgrowth by SBAs was strain dependent. It is unknown how SBAs inhibit TCA mediated spore germination, however the primary bile acid CDCA inhibits germination via the germinant receptor, CspC [37]. Additional studies to investigate the mechanism of action of SBAs on C. difficile germination are needed as they are outside the scope of this study.
C. difficile anaerobic growth is also impacted by SBA exposure. The SBAs ωMCA, HDCA, UDCA, LCA, and DCA all alter the growth of C. difficile in vitro [11, 25, 29, 38–40]. In the present study, the impact of the SBAs on growth kinetics varied and in some instances was strain dependent. Additionally, the mechanism of how SBAs impact C. difficile growth is currently unknown. The effect of SBAs on C. difficile viability or initiation of sporulation was not assessed in this study, but could provide additional information about how SBAs can affect another stage of the C. difficile life cycle.
Toxin production is essential to the virulence of C. difficile and mediates clinical disease in vivo [41]. The impact of microbial derived SBAs on C. difficile toxin expression, production, and/or activity is unknown. A single publication assessed the effects of a primary bile acid TCA on C. difficile toxins [42]. Based on their results, TCA inhibited toxin B and A mediated cytotoxicity in an epithelial cell line but had no effect on C. difficile growth or overall toxin production. The mechanism of TCA mediated inhibition of toxin activity remains unknown. In the present study, we demonstrated that SBAs affect toxin activity in a variety of C. difficile strains. In general, inhibition of toxin activity by SBAs significantly correlated with SBA induced alteration in C. difficile growth; meaning that if the SBAs diminished C. difficile growth (measured as terminal OD at 24 hr), then toxin activity was subsequently reduced (Figure 10). However, exceptions were noted in particular for strains M120 and M68. For strain M120, there was no significant correlation between terminal OD and toxin activity (data not shown). When M68 was exposed to higher concentrations of DCA, iDCA, and UDCA its growth kinetics were diminished; however, the toxin activity in M68 was unaffected and paralleled its control (Figure 10C). These results support that toxin activity is not solely dependent on growth of C. difficile.
C. difficile toxin synthesis has been linked to increasing cell density as part of the accessory gene regulator quorum signaling system; specifically involving a novel thiolactone that acts as an extracellular autoinducer peptide [43]. However, quorum sensing is only one pathway that affects C. difficile toxin synthesis (recently reviewed in [44]). Nutrient limitations and environmental stressors also play a major role in regulation of toxin synthesis in C. difficile, but in our study the nutrients were controlled, suggesting differences in strains and SBAs [44]. Although the exact mechanism of how SBAs modulate toxin production and/or activity is unknown, our data provide evidence that its effects can be independent of growth in some C. difficile strains (Figure 10).
Recent characterization of the biosynthetic pathway used to convert DCA into iDCA, by the gut commensal Ruminococcus gnavus, reveals that gut microbes can also derive bile acid iso-forms [18]. The iso-forms of DCA and LCA are abundant in the human GI tract, [16] however their effects on the lifecycle of C. difficile has not previously been investigated. We demonstrated that iDCA and iLCA could inhibit spore germination, alter growth, and inhibit toxin activity in seven strains of C. difficile. Interestingly, these bile acid isoforms do not affect spore germination, growth, or toxin activity exactly the same as their parent bile acids. This is likely related to the unique and distinct chemical structures of these bile acids. Since iso-bile acids are thought to be less toxic to host cells [18], the effectiveness of iDCA and iLCA against C. difficile in vivo should be evaluated.
Although this paper focuses on the effects of individual SBAs on the life cycle of C. difficile, in reality this enteric pathogen in vivo is exposed to a combination of host derived primary bile acids and microbial derived SBAs at varying concentrations [11, 40]. It is unknown how exposure to a variety of bile acids will impact the sensitivity of C. difficile strains to SBAs. Investigating the potency of physiologically relevant cocktails of SBAs on C. difficile in vitro may reveal additional information about the therapeutic potential of SBAs in C. difficile infection.
All seven SBAs evaluated in this study had distinct impacts on the life cycle of recent epidemic strains (R20291, M68, and M120) of C. difficile in vitro (summarized in supplemental Table 1). Although each strain responded differently to SBAs, this provides evidence that further investigation into SBAs as a therapeutic option for C. difficile infection is warranted and clinically relevant. Additionally, two SBAs evaluated in this study are murine specific (i.e. ωMCA and HDCA derived from muricholate) [19]. Although these SBAs are not observed in humans, their therapeutic potential in humans has recently been discussed [45]. The results of this study support further investigation into the murine specific SBAs, ωMCA and HDCA, as a novel therapeutic option for patients with CDI.
Finally, the protocols used in this study do have some limitations. Our germination and outgrowth assay assesses the ability of dormant spores to return to vegetative cells following incubation in the presence of bile acids. Therefore, the assay reads not only initiation of germination, but also outgrowth. For growth kinetic assays, the OD600 for certain bile acids was altered over the 24-hour incubation due to decreased solubility at higher concentrations. These bile acids were used at lower concentrations for measuring growth kinetics and toxin activity. Another limitation was that Vero cell cytotoxicity assay is semi-quantitative, hence other techniques such as qRT-PCR and immunoblotting will be helpful to quantify the exact amount of toxin in the samples.
Since SBAs are able to alter the C. difficile life cycle in many different ways, it is interesting to think about their use as a potential therapeutic against CDI. Before this can happen, future research is needed to investigate the effect of SBAs on sporulation, and also understand the mechanism by which SBAs are able to modulate germination, growth, toxin activity, and sporulation.
Supplementary Material
Growth curves of C. difficile strains in BHI media with ethanol alone (solid lines), and the addition of SBAs (dotted lines) (A) 0.002% DCA, (B) 0.00003% iLCA, (C) 0.004% UDCA, (D) 0.004% ωMCA, and (E) 0.002% HDCA. The data presented represents OD600 ± SEM for positive controls and OD600 mean for a n=3–6)
Highlights.
The impact of gut microbial derived secondary bile acids (SBAs) on the life cycle (spore germination and outgrowth, growth kinetics, and toxin activity) of seven clinically diverse Clostridium difficile strains varies by strain and SBA.
TCA mediated spore germination and outgrowth, and growth kinetics of multiple C. difficile strains were either inhibited or resistant to SBAs.
For some C. difficile strains the presence of specific SBAs altered growth kinetics, yet toxin activity was similar to controls or higher.
Acknowledgments
The authors would like to thank Trevor Lawley, Aimee Chen, and Joe Sorg for providing the Theriot lab with the C. difficile clinical strains tested in this manuscript. JAW is funded by Ruth L. Kirschstein National Research Service Award Research Training grant T32OD011130 by NIH. Research reported in this publication was supported by the National Institute of General Medical Sciences of the National Institutes of Health under Award Number R35GM119438 (CMT) and by career development award in metabolomics grant K01GM109236 (CMT).
Footnotes
Publisher's Disclaimer: This is a PDF file of an unedited manuscript that has been accepted for publication. As a service to our customers we are providing this early version of the manuscript. The manuscript will undergo copyediting, typesetting, and review of the resulting proof before it is published in its final citable form. Please note that during the production process errors may be discovered which could affect the content, and all legal disclaimers that apply to the journal pertain.
References
- 1.Cooper CC, Jump RLP, Chopra T. Prevention of Infection Due to Clostridium difficile. Infectious Disease Clinics of North America. doi: 10.1016/j.idc.2016.07.005. [DOI] [PubMed] [Google Scholar]
- 2.Lessa FC, Mu Y, Bamberg WM, Beldavs ZG, Dumyati GK, Dunn JR, et al. Burden of Clostridium difficile infection in the United States. New England Journal of Medicine. 2015;372:825–34. doi: 10.1056/NEJMoa1408913. [DOI] [PMC free article] [PubMed] [Google Scholar]
- 3.C.D.C. Control, Prevention. Antibiotic resistance threats in the United States, 2013: Centres for Disease Control and Prevention, US Department of Health and Human Services. 2013 [Google Scholar]
- 4.Lucado J, Gould C, Elixhauser A. Clostridium difficile infections (CDI) in hospital stays, 2009. 2012 [PubMed] [Google Scholar]
- 5.Leffler DA, Lamont JT. Clostridium difficile Infection. New England Journal of Medicine. 2015;372:1539–48. doi: 10.1056/NEJMra1403772. [DOI] [PubMed] [Google Scholar]
- 6.Rupnik M, Wilcox MH, Gerding DN. Clostridium difficile infection: new developments in epidemiology and pathogenesis. Nature Reviews Microbiology. 2009;7:526–36. doi: 10.1038/nrmicro2164. [DOI] [PubMed] [Google Scholar]
- 7.McDonald LC, Killgore GE, Thompson A, Owens RC, Jr, Kazakova SV, Sambol SP, et al. An epidemic, toxin gene-variant strain of Clostridium difficile. New England Journal of Medicine. 2005;353:2433–41. doi: 10.1056/NEJMoa051590. [DOI] [PubMed] [Google Scholar]
- 8.C.f.D. Control, Prevention. Severe Clostridium difficile-associated disease in populations previously at low risk–four states, 2005. MMWR Morbidity and mortality weekly report. 2005;54:1201. [PubMed] [Google Scholar]
- 9.Reeves AE, Theriot CM, Bergin IL, Huffnagle GB, Schloss PD, Young VB. The interplay between microbiome dynamics and pathogen dynamics in a murine model of Clostridium difficile Infection. Gut Microbes. 2011;2:145–58. doi: 10.4161/gmic.2.3.16333. [DOI] [PMC free article] [PubMed] [Google Scholar]
- 10.Buffie CG, Jarchum I, Equinda M, Lipuma L, Gobourne A, Viale A, et al. Profound alterations of intestinal microbiota following a single dose of clindamycin results in sustained susceptibility to Clostridium difficile-induced colitis. Infection and immunity. 2012;80:62–73. doi: 10.1128/IAI.05496-11. [DOI] [PMC free article] [PubMed] [Google Scholar]
- 11.Theriot CM, Bowman AA, Young VB. Alterations of the Gut Microbiota Alter Secondary Bile Acid Production and Allow for Clostridium difficile Spore Germination and Outgrowth in the Large Intestine. mSphere. 2016;1:00045–15. doi: 10.1128/mSphere.00045-15. [DOI] [PMC free article] [PubMed] [Google Scholar]
- 12.Sayin SI, Wahlström A, Felin J, Jäntti S, Marschall H-U, Bamberg K, et al. Gut microbiota regulates bile acid metabolism by reducing the levels of tauro-beta-muricholic acid, a naturally occurring FXR antagonist. Cell metabolism. 2013;17:225–35. doi: 10.1016/j.cmet.2013.01.003. [DOI] [PubMed] [Google Scholar]
- 13.Ridlon JM, Kang DJ, Hylemon PB. Bile salt biotransformations by human intestinal bacteria. Journal of lipid research. 2006;47:241–59. doi: 10.1194/jlr.R500013-JLR200. [DOI] [PubMed] [Google Scholar]
- 14.Chiang JY. Bile acids: regulation of synthesis. Journal of lipid research. 2009;50:1955–66. doi: 10.1194/jlr.R900010-JLR200. [DOI] [PMC free article] [PubMed] [Google Scholar]
- 15.Russell DW. The enzymes, regulation, and genetics of bile acid synthesis. Annual review of biochemistry. 2003;72:137–74. doi: 10.1146/annurev.biochem.72.121801.161712. [DOI] [PubMed] [Google Scholar]
- 16.Hamilton JP, Xie G, Raufman JP, Hogan S, Griffin TL, Packard CA, et al. Human cecal bile acids: concentration and spectrum. American Journal of Physiology-Gastrointestinal and Liver Physiology. 2007;293:G256–G63. doi: 10.1152/ajpgi.00027.2007. [DOI] [PubMed] [Google Scholar]
- 17.Setchell K, Lawson A, Tanida N, Sjövall J. General methods for the analysis of metabolic profiles of bile acids and related compounds in feces. Journal of lipid research. 1983;24:1085–100. [PubMed] [Google Scholar]
- 18.Devlin AS, Fischbach MA. A biosynthetic pathway for a prominent class of microbiota-derived bile acids. Nature chemical biology. 2015:285–90. doi: 10.1038/nchembio.1864. [DOI] [PMC free article] [PubMed] [Google Scholar]
- 19.Takahashi S, Fukami T, Masuo Y, Brocker CN, Xie C, Krausz KW, et al. Cyp2c70 is responsible for the species difference in bile acid metabolism between mice and humans. Journal of Lipid Research. 2016:2130–37. doi: 10.1194/jlr.M071183. jlr. [DOI] [PMC free article] [PubMed] [Google Scholar]
- 20.Zhang Y, Klaassen CD. Effects of feeding bile acids and a bile acid sequestrant on hepatic bile acid composition in mice. Journal of lipid research. 2010;51:3230–42. doi: 10.1194/jlr.M007641. [DOI] [PMC free article] [PubMed] [Google Scholar]
- 21.Zhang Y, Limaye PB, Lehman-McKeeman LD, Klaassen CD. Dysfunction of organic anion transporting polypeptide 1a1 alters intestinal bacteria and bile acid metabolism in mice. PLoS One. 2012;7:e34522. doi: 10.1371/journal.pone.0034522. [DOI] [PMC free article] [PubMed] [Google Scholar]
- 22.Wilson KH, Kennedy MJ, Fekety FR. Use of sodium taurocholate to enhance spore recovery on a medium selective for Clostridium difficile. Journal of clinical microbiology. 1982;15:443–6. doi: 10.1128/jcm.15.3.443-446.1982. [DOI] [PMC free article] [PubMed] [Google Scholar]
- 23.Heeg D, Burns DA, Cartman ST, Minton NP. Spores of Clostridium difficile clinical isolates display a diverse germination response to bile salts. PloS one. 2012;7:e32381. doi: 10.1371/journal.pone.0032381. [DOI] [PMC free article] [PubMed] [Google Scholar]
- 24.Theriot CM, Koenigsknecht MJ, Carlson PE, Jr, Hatton GE, Nelson AM, Li B, et al. Antibiotic-induced shifts in the mouse gut microbiome and metabolome increase susceptibility to Clostridium difficile infection. Nature communications. 2014;5:3114. doi: 10.1038/ncomms4114. [DOI] [PMC free article] [PubMed] [Google Scholar]
- 25.Buffie CG, Bucci V, Stein RR, McKenney PT, Ling L, Gobourne A, et al. Precision microbiome reconstitution restores bile acid mediated resistance to Clostridium difficile. Nature. 2015;517:205–8. doi: 10.1038/nature13828. [DOI] [PMC free article] [PubMed] [Google Scholar]
- 26.Weingarden AR, Chen C, Bobr A, Yao D, Lu Y, Nelson VM, et al. Microbiota transplantation restores normal fecal bile acid composition in recurrent Clostridium difficile infection. American Journal of Physiology-Gastrointestinal and Liver Physiology. 2014;306:G310–G9. doi: 10.1152/ajpgi.00282.2013. [DOI] [PMC free article] [PubMed] [Google Scholar]
- 27.Winston JA, Theriot CM. Impact of microbial derived secondary bile acids on colonization resistance against Clostridium difficile in the gastrointestinal tract. Anaerobe. 2016:44–50. doi: 10.1016/j.anaerobe.2016.05.003. [DOI] [PMC free article] [PubMed] [Google Scholar]
- 28.Sorg JA, Sonenshein AL. Inhibiting the initiation of Clostridium difficile spore germination using analogs of chenodeoxycholic acid, a bile acid. Journal of bacteriology. 2010;192:4983–90. doi: 10.1128/JB.00610-10. [DOI] [PMC free article] [PubMed] [Google Scholar]
- 29.Francis MB, Allen CA, Sorg JA. Muricholic acids inhibit Clostridium difficile spore germination and growth. PLoS One. 2013;8:e73653. doi: 10.1371/journal.pone.0073653. [DOI] [PMC free article] [PubMed] [Google Scholar]
- 30.Carlson PE, Kaiser AM, McColm SA, Bauer JM, Young VB, Aronoff DM, et al. Variation in germination of Clostridium difficile clinical isolates correlates to disease severity. Anaerobe. 2015;33:64–70. doi: 10.1016/j.anaerobe.2015.02.003. [DOI] [PMC free article] [PubMed] [Google Scholar]
- 31.Stabler RA, He M, Dawson L, Martin M, Valiente E, Corton C, et al. Comparative genome and phenotypic analysis of Clostridium difficile 027 strains provides insight into the evolution of a hypervirulent bacterium. Genome Biol. 2009;10:R102. doi: 10.1186/gb-2009-10-9-r102. [DOI] [PMC free article] [PubMed] [Google Scholar]
- 32.He M, Sebaihia M, Lawley TD, Stabler RA, Dawson LF, Martin MJ, et al. Evolutionary dynamics of Clostridium difficile over short and long time scales. P Natl Acad Sci USA. 2010;107:7527–32. doi: 10.1073/pnas.0914322107. [DOI] [PMC free article] [PubMed] [Google Scholar]
- 33.Sebaihia M, Wren BW, Mullany P, Fairweather NF, Minton N, Stabler R, et al. The multidrug-resistant human pathogen Clostridium difficile has a highly mobile, mosaic genome. Nat Genet. 2006;38:779–86. doi: 10.1038/ng1830. [DOI] [PubMed] [Google Scholar]
- 34.Perez J, Springthorpe VS, Sattar SA. Clospore: a liquid medium for producing high titers of semi-purified spores of Clostridium difficile. Journal of AOAC International. 2011;94:618–26. [PubMed] [Google Scholar]
- 35.Sprouffske K, Wagner A. Growthcurver: An R package for obtaining interpretable metrics from microbial growth curves. BMC bioinformatics. 2016;17:1. doi: 10.1186/s12859-016-1016-7. [DOI] [PMC free article] [PubMed] [Google Scholar]
- 36.Winston JA, Thanissery Rajani, Montgomery Stephanie A, Theriot Casey M. Cefoperazone treated mouse model of Clostridium difficile strain R20291: A clinically relevant platform for testing therapeutics. Journal of visualized experiments. 2016;118:e56850. doi: 10.3791/54850. [DOI] [PMC free article] [PubMed] [Google Scholar]
- 37.Francis MB, Allen CA, Shrestha R, Sorg JA. Bile acid recognition by the Clostridium difficile germinant receptor, CspC, is important for establishing infection. PLoS Pathog. 2013;9:e1003356. doi: 10.1371/journal.ppat.1003356. [DOI] [PMC free article] [PubMed] [Google Scholar]
- 38.Sorg JA, Sonenshein AL. Bile salts and glycine as cogerminants for Clostridium difficile spores. Journal of bacteriology. 2008;190:2505–12. doi: 10.1128/JB.01765-07. [DOI] [PMC free article] [PubMed] [Google Scholar]
- 39.Weingarden AR, Chen C, Zhang N, Graiziger CT, Dosa PI, Steer CJ, et al. Ursodeoxycholic Acid Inhibits Clostridium difficile Spore Germination and Vegetative Growth, and Prevents the Recurrence of Ileal Pouchitis Associated With the Infection. Journal of clinical gastroenterology. 2015:624–30. doi: 10.1097/MCG.0000000000000427. [DOI] [PMC free article] [PubMed] [Google Scholar]
- 40.Weingarden AR, Dosa PI, DeWinter E, Steer CJ, Shaughnessy MK, Johnson JR, et al. Changes in colonic bile acid composition following fecal microbiota transplantation are sufficient to control clostridium difficile germination and growth. PloS one. 2016;11:e0147210. doi: 10.1371/journal.pone.0147210. [DOI] [PMC free article] [PubMed] [Google Scholar]
- 41.Kuehne SA, Cartman ST, Heap JT, Kelly ML, Cockayne A, Minton NP. The role of toxin A and toxin B in Clostridium difficile infection. Nature. 2010;467:711–3. doi: 10.1038/nature09397. [DOI] [PubMed] [Google Scholar]
- 42.Darkoh C, Brown EL, Kaplan HB, DuPont HL. Bile salt inhibition of host cell damage by Clostridium difficile toxins. PloS one. 2013;8:e79631. doi: 10.1371/journal.pone.0079631. [DOI] [PMC free article] [PubMed] [Google Scholar]
- 43.Darkoh C, DuPont HL, Norris SJ, Kaplan HB. Toxin synthesis by Clostridium difficile is regulated through quorum signaling. MBio. 2015;6:e02569–14. doi: 10.1128/mBio.02569-14. [DOI] [PMC free article] [PubMed] [Google Scholar]
- 44.Martin-Verstraete I, Peltier J, Dupuy B. The Regulatory Networks That Control Clostridium difficile Toxin Synthesis. Toxins. 2016;8:153. doi: 10.3390/toxins8050153. [DOI] [PMC free article] [PubMed] [Google Scholar]
- 45.Rudling M. Understanding mouse bile acid formation: Is it time to unwind why mice and rats make unique bile acids? Journal of Lipid Research. 2016;57:2097–8. doi: 10.1194/jlr.C072876. [DOI] [PMC free article] [PubMed] [Google Scholar]
Associated Data
This section collects any data citations, data availability statements, or supplementary materials included in this article.
Supplementary Materials
Growth curves of C. difficile strains in BHI media with ethanol alone (solid lines), and the addition of SBAs (dotted lines) (A) 0.002% DCA, (B) 0.00003% iLCA, (C) 0.004% UDCA, (D) 0.004% ωMCA, and (E) 0.002% HDCA. The data presented represents OD600 ± SEM for positive controls and OD600 mean for a n=3–6)