Figure 3.

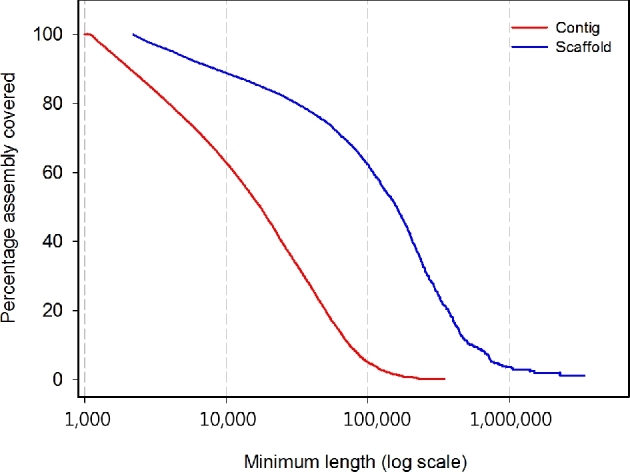
Scaffold and contig size distributions of Tigriopus kingsejongensis. The percentage of the assembly included (y-axis) in contigs or scaffolds of a minimum size (x-axis, log scale) is shown for the contig (red) and scaffold (blue)

Scaffold and contig size distributions of Tigriopus kingsejongensis. The percentage of the assembly included (y-axis) in contigs or scaffolds of a minimum size (x-axis, log scale) is shown for the contig (red) and scaffold (blue)