Abstract
Laminin-α2 related Congenital Muscular Dystrophy (LAMA2-CMD) is a progressive muscle disease caused by partial or complete deficiency of laminin-211, a skeletal muscle extracellular matrix protein. In the last decade, basic science research has queried underlying disease mechanisms in existing LAMA2-CMD murine models and identified possible clinical targets and pharmacological interventions. Experimental rigor in preclinical studies is critical to efficiently and accurately quantify both negative and positive results, degree of efficiency of potential therapeutics and determine whether to move a compound forward for additional preclinical testing. In this review, we compare published available data measured to assess three common parameters in the widely used mouse model DyW, that mimics LAMA2-CMD, we quantify variability and analyse its possible sources. Finally, on the basis of this analysis, we suggest standard set of assessments and the use of available standardized protocols, to reduce variability of outcomes in the future and to improve the value of preclinical research.
Keywords: LAMA2-CMD, mouse models, preclinical, MDC1A, LAMA2-RD
INTRODUCTION
The congenital muscular dystrophies (CMDs) are a group of rare neuromuscular diseases with an estimated prevalence around 0.5 per 100,000, with LAMA2-CMD accounting for approximately 24% of cases [1]. In 1994, Tome et al identified a subset of CMD patients with an absence of laminin α2 staining on muscle biopsy [2]. Immunohistochemical testing led to the subsequent identification of the LAMA2 gene. Since then, a number of mutations have been reported [3, 4]. It is now clear that the mutations that result in laminin-211 deficiency lead to an early-onset, severe phenotype, whereas partial deficiency typically results in a milder phenotype [5]. The clinical features of LAMA2-CMD include hypotonia at birth and development delay. Progressive muscle weakness, contractures and scoliosis contribute to respiratory insufficiency. Patients may achieve unsupported sitting, but very few attain ambulation. Additional secondary complications may include feeding difficulties, seizures, cardiac arrhythmias and subclinical cardiomyopathy. Due to the presence of laminin-211 in myelin, some patients may demonstrate a peripheral neuropathy [4, 6, 7]. There is currently no treatment for this progressive and usually fatal disease.
Given the limited patient numbers and prohibitive cost of clinical trials, it is critical to design pre-clinical testing to yield high quality, interpretable and reproducible data. The DyW model was created 1998 by homologous recombination in Lama2-knockout ES cells [8, 9] and therefore mimics the severe form of LAMA2-CMD. These mice are passive, small and thin at birth. A preliminary review of the literature revealed that there is a significant range of variability of natural history data on the most common phenotypic assessments, like survival, body weight and locomotion from lab to lab. For instance, early data showed that most mice die within 2–4 weeks [9], however, most publications report a longer median survival between 8 and 14 weeks [10–15]. There is no consensus on the type of muscle that should be histologically assessed or the limbs to be used for grip strength assessment; in other cases there is no consensus on the unit chosen (absolute values vs percentage of wild-type). This variability makes it difficult to merge the scarce drug efficacy data available for this model and to obtain robust evidence to proceed in a promising direction. A more strict use of standardized assessment protocols and the reporting of absolute values would undoubtedly increase comparability of results.
For the purpose of this review, we collected historic preclinical data in DyW from four different laboratories to better define variability and identify challenges in the reproducibility of experimental DyW data. We then propose a standard set of assessment and the use of the standardized protocols created by TREAT-NMD and by CureCMD, to assist in generating consistent preclinical testing and outcomes.
METHODS
Data collection
To evaluate inter-laboratory variability, we collected published and unpublished raw data on survival and body weight from four separate laboratories (labelled A, B, C and D in this study) and assessed the prognostic usefulness of body weight at various time points as a predictor of survival. Survival time was collected once for each of 117 DyW mice and not collected for WT mice. In some laboratories dyW mice were from Jackson laboratories and fully backcrossed on the C57Bl/6 background and others dyW mice were obtained from Dr. Eva Engvall or collaborators [8, 9] and were on a mixed strain background that included C57Bl/6. Males and female mice were included in the study, but data sets and analysis were not separated by sex. All other measurements were repeated on the same mice over various time periods (ranging from 2 to 11 weeks depending on the measure and the laboratory); therefore the total number of data points is greater than the number of mice (Table 1). Feeding and handling regimens were compared between the laboratories to evaluate the possible effect on body weight and survival. Additionally, data on respiratory assessments (plethysmography) from two laboratories was evaluated given the relevance to patient pathophysiology.
Table 1.
Number of data points and mice included in this analysis
| Measurement | Total number of data points | Number of mice | ||||
| DyW–/– | WT | Total | DyW–/– | WT | Total | |
| Survival | 117 | N/A | 117 | 117 | N/A | 117 |
| Body weight | 1126 | 395 | 1521 | 555 | 138 | 693 |
| PenH | 130 | 128 | 258 | 55 | 50 | 105 |
| PenH/BW | 125 | 126 | 251 | 51 | 48 | 99 |
Statistical methods
We explored the following outcome measures in this analysis; survival time in days, body weight, and plethysmography measurements including respiratory rate, tidal volume and enhanced pause (PenH) normalized for body weight. All outcomes were examined for quality and descriptive statistics were produced. The Shapiro-Wilk test showed that body weight was normally distributed while plethysmography measurements were not; therefore PenH and PenH/BW were log transformed for all analyses.
Survival analysis was performed on all mice expiring by natural death. Survival time was compared between the four laboratories using a log-rank test. The significant overall comparison led to further pair-wise comparisons between each laboratory via log-rank test and the resulting p-values were adjusted for multiple comparisons. Kaplan-Meier survival curves were generated for survival in all four laboratories. Body weight was measured using two methods that differed in assessment frequency. One laboratory measured body weight once a week; the other measured body weight multiple times per week but reported only the maximum for the week. The analysis used whichever value was provided regardless of method. For mice where peak weight and weight at single time points was reported, only the peak value was used. This approach was applied to 73 data points although the weight difference between single and peak values was less than 5%. The analysis was limited to mice up to the age of 12 weeks as all data beyond 12 weeks was limited to one laboratory and only three data points were available for WT mice beyond 12 weeks.
Body weight was compared between laboratories and between mice within each laboratory using a mixed effects linear regression model. This model tested the main effects of laboratory and age along with a laboratory×age interaction term, and including the individual mouse as a random coefficient to account for repeated measurements on the same animal. The predictive value of body weight on survival in DyW mice was determined at weeks 1 through 8 using linear regression models where survival time in days was the outcome and body weight the predictor.
Plethysmography outcomes were measured and reported by two laboratories (Lab A and Lab D) and all analyses were performed separately for each laboratory. Data was limited to weeks 3 through 10 as only 3 data points were available after week 10, and all analyses used log-transformed values. Both PenH and PenH/BW were compared between strains within each laboratory using a mixed effects linear regression model testing main effects of strain and age along with a strain×age interaction term, and including the individual mouse as a random coefficient to account for repeated measurements on the same animal.
Assessment of variability with increasing age and magnitude did not account for repeated values and used all available data points for that category. For age assessment, stratification by laboratory was retained and all available mice for each one week age group were combined. Means and 95% confidence interval (CI) were calculated by strain and plotted. For magnitude assessment, data from both laboratories were combined and all available values binned into categories to produce an even distribution through the magnitude range. Means and 95% CI were calculated by strain and plotted.
Sample sizes and power were calculated for a comparison of each outcome between WT and DyW mice to evaluate which outcomes and which time points are potentially most useful in experimental studies. We calculated the power a comparison of 12 mice per group would yield, and the number of mice per strain needed to detect a statistically significant difference between WT and DyW. All calculations were performed at a 0.05 type I error rate and using a t-test.
All analyses were performed using Stata V13 (College Station, TX) and a nominal α= 0.05 was used to define statistical significance.
VARIABILITY ASSESSMENT
Survival and weight gain
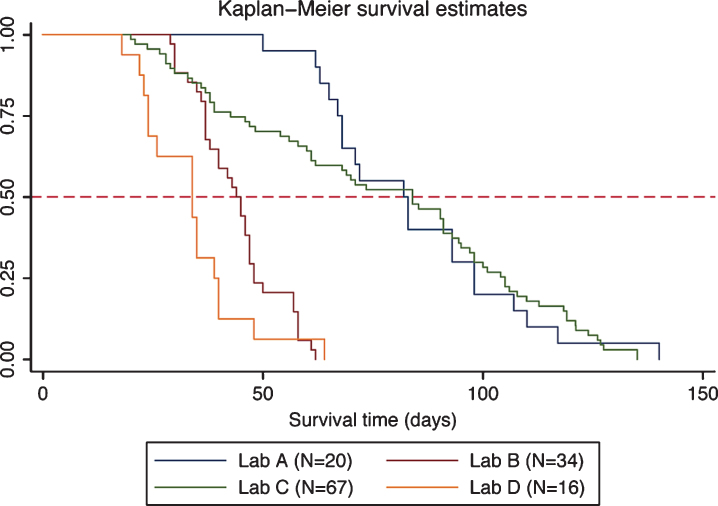
We observed and compared survival of DyW mice from four laboratories and found that survival clustered into two groups (Fig. 1; Table 2). Two laboratories showed median survival times of 34 and 44 days (Labs D and B, respectively) and two laboratories showed greater median survival times of 82 and 84 days (Labs A and C, respectively). Median survival time was significantly different between most laboratories (see Table 2). For each laboratory, the number of mice, the median survival, standard errors and 95% CI are reported. The last column shows pair-wise comparisons of median survival time between each laboratory. The curves clearly show the diversity in the mouse populations between laboratories.
Fig.1.
Kaplan-Meier plot of DyW survival by laboratory. Survival estimates are shown for each laboratory along with a reference line at 50% survival.
Table 2.
Comparison of median survival (natural deaths) by laboratory. Overall comparison between all laboratories and pairwise comparisons between each laboratory pair are shown
| Laboratory | N (observed) | Median | SE | 95% CI | Overall | Pairwise comparisons of |
| survival | p-value | median survival time | ||||
| between laboratories | ||||||
| Lab A | 20 | 82 | 8.2 | 67–98 | <0.0001 | Lab A vs. Lab B (p < 0.001) |
| Lab B | 34 | 44 | 2.2 | 37–47 | Lab A vs. Lab C (p = NS) | |
| Lab C | 67 | 84 | 10.3 | 61–93 | Lab A vs. Lab D (p < 0.001) | |
| Lab D | 16 | 34 | 5.3 | 24–39 | Lab B vs. Lab C (p < 0.001) | |
| Lab B vs. Lab D (p = 0.03) | ||||||
| Lab C vs. Lab D (p < 0.001) |
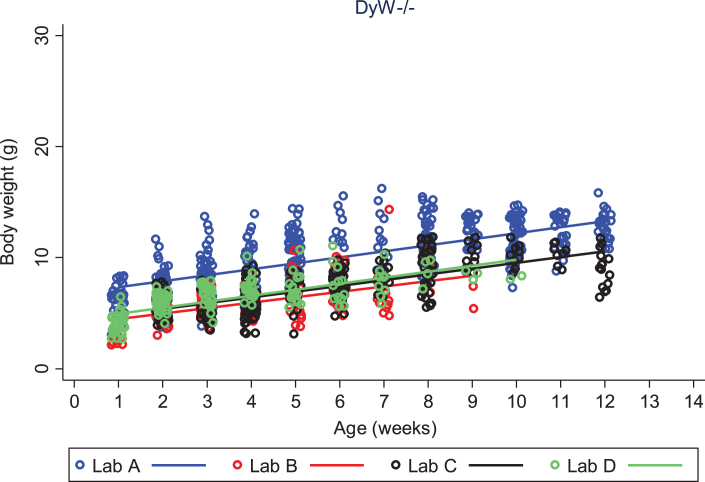
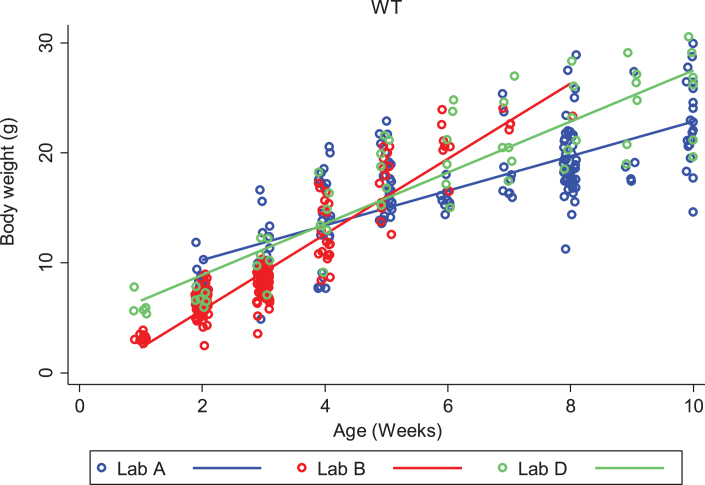
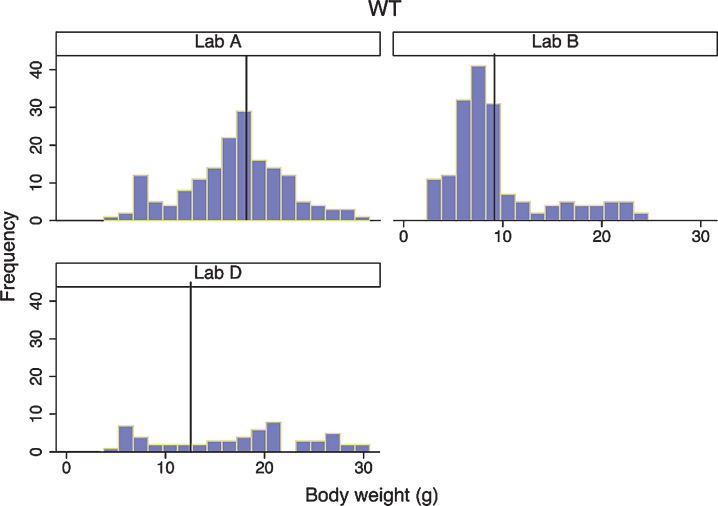
We looked closely at body weight development of both DyW and wild type (C57BL/6) mouse strains to assess the variability seen between colonies at different laboratories. We first compared each strain among different laboratories, then compared strains within the same laboratory. Looking only at DyW mice, there was an overall significant gain in weight over time (gain of 0.5 g per week; p < 0.001) and the slopes of these growth curves were strikingly similar (Fig. 2). However, DyW mice from Lab A showed a consistently greater body weight than the other three laboratories (p < 0.001) over all time points. The comparison of body weight in WT mice from three of the laboratories which provided data (A, B, and D) is shown in Fig. 3. Overall, WT mice in all three labs had an average rate of gain of 2.1 g per week; p < 0.001. Assessing over all time points, mean body weight was not significantly different between Lab A and Lab B (p = 0.052), but Lab D showed significantly greater overall mean body weight than both Lab A (p = 0.001) and Lab B (p = 0.023). Here the rate of gain, or slope, in WT mice was not shown to be significantly different between different labs, however Fig. 4 shows the rate of weight gain is not identical between labs as we saw in the DyW mice (Fig. 3).
Fig.2.
DyW body weight over time by laboratory. The change in body weight of DyW mice over time is shown for each of the four laboratories. Individual body weights are represented with open circles and regression lines from the mixed effects linear model are represented by solid lines.
Fig.3.
WT (C57BL/6) body weight over time by laboratory. The change in body weight of WT mice over time is shown for each of the three laboratories reporting results. Individual body weights are represented with open circles and regression lines from the mixed effects linear model are represented by solid lines.
Fig.4.
Wild-type body weight distribution in three laboratories. Histograms of body weight for all WT mice from three laboratories are shown. For each laboratory, the vertical reference line represents the mean for that laboratory.
In Labs A, B and D, body weight gain over time was consistently greater in WT mice, compared to DyW mice, with mean increases in weight gain for WT animals of 1.6 g per week (Lab A, p < 0.001), 3.3 g per week (Lab B, p < 0.001) and 2.3 g per week (Lab D, p < 0.001). Weight gain data was not available for Lab B.
The predictive value of body weight on survival
With the availability of weight and survival data for a large number of mice from several laboratories, we evaluated weight at various time points as a predictor of survival using regression coefficients that estimate the increase in survival (days) for every gram increase in weight gain (Table 3). The predictability of survival by weight seems to increase regularly from week 1 to week 5 and then decrease again quickly by week 8.
Table 3.
Predictability of survival by body weight in DyW mice at ages 1 to 8 weeks
| Week | N | r2 | P-value | % variability in survival | β coefficient (95% CI) |
| described by body weight | |||||
| 1 | 34 | 0.007 | 0.63 | 0.7% | 1.29 (–4.08–6.67) |
| 2 | 52 | 0.021 | 0.30 | 2.1% | 1.99 (–1.83–5.82) |
| 3 | 58 | 0.086 | 0.025 | 8.6% | 3.92 (0.50–7.33) |
| 4 | 50 | 0.151 | 0.005 | 15.1% | 3.29 (1.03–5.56) |
| 5 | 41 | 0.397 | <0.001 | 39.7% | 3.90 (2.34–5.45) |
| 6 | 29 | 0.359 | 0.001 | 35.9% | 3.63 (1.71–5.55) |
| 7 | 23 | 0.205 | 0.030 | 20.5% | 1.80 (0.19–3.41) |
| 8 | 9 | 0.024 | 0.69 | 2.4% | –0.66 (–4.42–3.10) |
Most statistically significant (by the magnitude of both the p-value and the beta coefficient) is highlighted in bold.
Respiratory assessment
To compare respiratory assessments in both laboratories, we compared a standard set of respiratory measures (respiratory rate, tidal volume, expiratory flow), and PenH values normalized to body weight (i.e. PenH divided by BW). Lab A used a whole body plethysmography chamber from Buxco Electronics while Lab D used an unrestrained whole body plethysmography chamber PLY 4211 equipped with Halcyon TRD 5715 pneumotacograph from Buxco Electronics (Data Sciences International now).
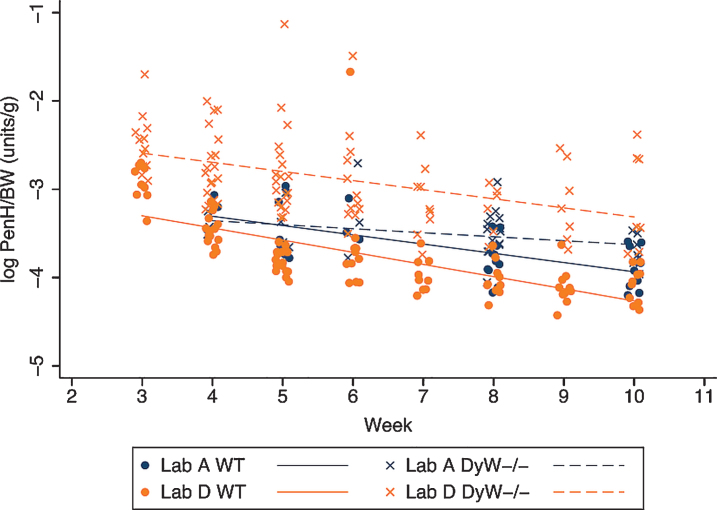
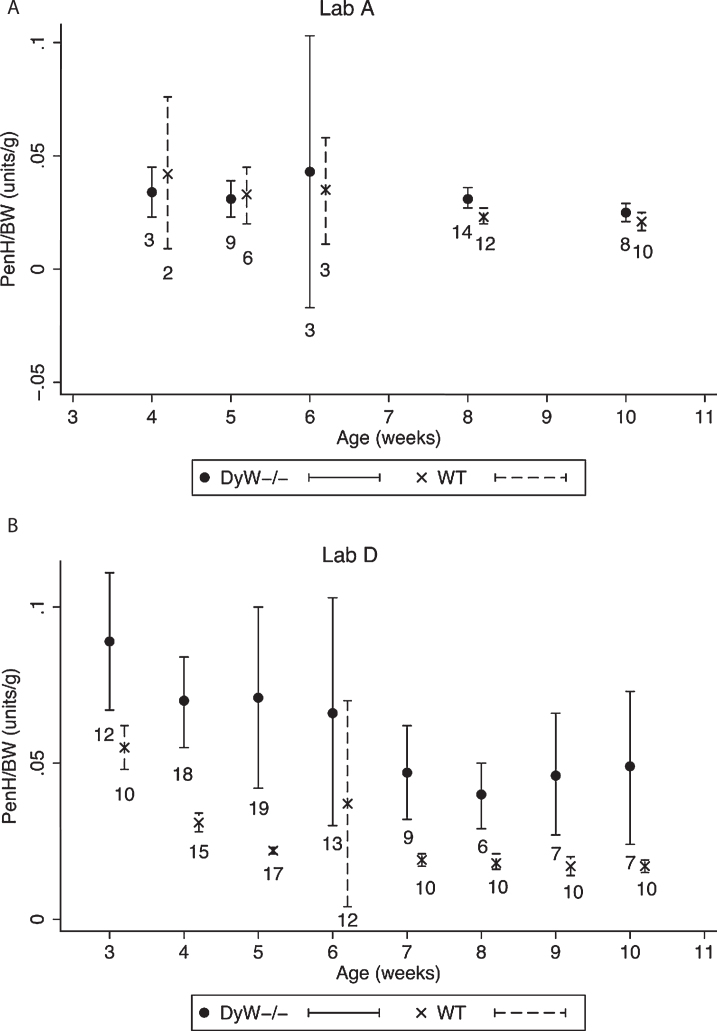
Body weight normalized PenH values are significantly higher in all DyW mice as compared to all wild-type mice and both strains show a significant decrease over time (Fig. 5). The rate of decrease is similar in both strains where all mice from Lab A showed a significant overall decrease of 0.07 PenH/BW units per week and all mice from Lab D showed a significant overall decrease of 0.12 units per week. No interaction between strain and time was evident, indicating that the rate of decrease over time was not different between DyW and WT mice. Figure 6 shows that variability in PenH/BW is strain-dependent, being generally higher in mutant mice than in WT mice. Mice from Lab D show a greater variability in PenH/BW in the mutant strain than mice from Lab A. The amount of variability in PenH and PenH/BW values with respect to magnitude was consistent through the range of values until reaching the highest values (PenH values > 0.55 and PenH/BW values > 0.072) where variability increased dramatically (data not shown).
Fig.5.
Body weight normalized PenH values over time in both DyW and WT mice. The change in logarithm transformed body weight normalized PenH values (PenH/BW) over time is shown for both WT and DyW mice from the two laboratories reporting results. Individual log PenH/BW in WT mice are represented with circles and regression lines from the mixed effects linear model are represented by solid lines. Individual log PenH/BW in DyW mice are represented with X’s and regression lines from the mixed effects linear model are represented by dashed lines.
Fig.6.
Variability of PenH/BW values. The variability observed at different ages in PenH/BW values in the two labs reporting results are shown 6A and 6B. Dots and X’s represent the mean PenH/BW value for all mice of that age, and bars represent 95% confidence intervals. Sample numbers are indicated below each bar.
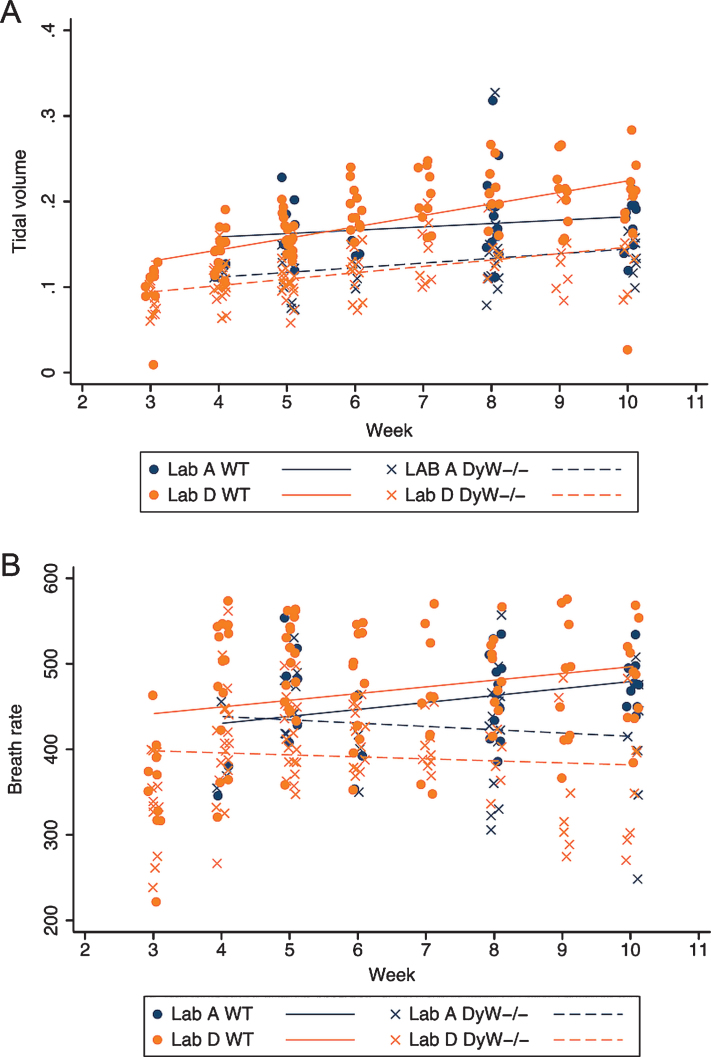
The remaining respiratory parameters are summarized over all time points in Table 4. Longitudinal analysis in each lab reporting the assessment showed that DyW have a significantly lower mean tidal volume than WT at all time points (β= –0.42, p < 0.001 for Lab A; β= –0.053, p < 0.001 for Lab D); mean tidal volumes increased significantly over time regardless of strain points (β= 0.05, p = 0.049 for Lab A; β= 0.011, p < 0.001 for Lab D); and the rate of increase in both strains was the same (Fig. 7A). DyW mice also showed a significantly lower mean breath rate over all time points than WT mice in lab D (β= –75.1, p < 0.001, but there was no significant change in mean breath rate over time for either laboratory (Fig. 7B).
Table 4.
Comparison of respiratory values
| Measurement | Lab A | Lab D | ||||||
| WT | DyW–/– | WT | DyW–/– | |||||
| N | Mean±SD | N | Mean±SD | N | Mean±SD | N | Mean±SD | |
| Exp. Flow (mL/s) | 36 | 3.668±1.224 | 46 | 2.388±0.797 | 94 | 3.420±0.991 | 93 | 2.043±0.615 |
| Insp. Flow (mL/s) | 36 | 5.906±1.620 | 46 | 4.109±1.532 | 94 | 6.382±1.537 | 93 | 3.752±1.086 |
| Breath rate (BPM) | 34 | 462±51 | 39 | 426±64 | 94 | 468±76 | 93 | 392±61 |
| Tidal volume (mL) | 34 | 0.174±0.042 | 39 | 0.129±0.041 | 94 | 0.174±0.049 | 93 | 0.115±0.032 |
Fig.7.
Tidal volume and Breath rate over time in both WT and DyW mice. (A) The change in tidal volume over time is shown for both WT and DyW mice from the two laboratories reporting results. Individual tidal volume in WT mice are represented with circles and regression lines from the mixed effects linear model are represented by solid lines. Individual tidal volume in DyW mice are represented with X’s and regression lines from the mixed effects linear model are represented by dashed lines. (B) The change in breath rate over time is shown for both WT and DyW mice from the two laboratories reporting results. Individual breath rate in WT mice are represented with circles and regression lines from the mixed effects linear model are represented by solid lines. Individual tidal volume in DyW mice are represented with X’s and regression lines from the mixed effects linear model are represented by dashed lines.
SOURCES OF VARIABILITY
Evaluation of husbandry conditions
We compared husbandry conditions of mice in Labs A, B, C and D to detect possible sources of variability. All laboratories applied group housing of up to 5 mice in individually ventilated cages, with wild-type siblings raised in the same cage and other mice strains housed in the same facility. Humidity, temperature and light cycles of 12 hours were comparable. Cage size was 607 cm2 in Lab A, 334 cm2 in Lab B, 780 cm2 in Lab C and 484 cm2 in Lab D. Only Lab C used conventional versus barrier housing without environmental enrichment and adopted warm pads for the mice. Labs B, C and D used wood chips as embedding while Lab A used corn cob. Finally, the litter size was greatest is Lab A with 8–10 pups and lower in Lab B (5-6 pups), Lab C (5 pups) and Lab D (4–8 pups). Water quality was the same and all laboratories but Lab D used softened food pellets on the bottom of cage to facilitate access for weak mice; food was available in all cases ad libitum. However, food brands were different. Analysis of the food composition as provided by the manufacturer showed little variation in the crude fat, protein and carbohydrates contents, although ingredient policies were somewhat different. Amino acid compositions were comparable in all brands; microelements concentration varied for Zn, Cu and Mn but without correlation to growth behaviour. There were clear differences in vitamin composition of the food products (Table 5).
Table 5.
Comparison of vitamin content in four rodent food products from three brands
| Vit A (IU/g) | Vit E (mg/kg) | Vit K3 (mg/kg) | Vit B1 (mg/kg) | |
| Lab A | 12.6 | 100 | 40 | 27 |
| Lab B | 20 | 30.2 | 20 | 79 |
| Lab C | 16 | 200 | 5 | 24 |
| Lab D | 29 | 75 | 1.9 | 10 |
Evaluation of genetic background
Originally, the Lama-2-knock out construct was electroporated into embryonic stem cells derived from 129S1/Sv mice, then injected into C57BL/6J blastocysts and the resulting chimeric males were bred to Black Swiss females to generate the mutant colony. These mutant mice were then backcrossed to C57BL/6 for at least four generations to produce a colony of DyW mice [8]. DyW mice were then deposited at Jackson Laboratory, where high-density SNP (single nucleotide polymorphism) panel analysis revealed the mice were ∼90% C57BL/6 allele-type. After this, the colony at the Jackson Laboratory was additionally backcrossed to C57BL/6J inbred mice using a marker-assisted speed congenic approach to complete this congenic line. Given the wide variations in phenotypes associated with the different DyW colonies, we sought to assess the genetic background of the mice from the different labs. Using the MegaMuga 76,000 SNP marker panel built on the Illumina Infinium platform available from Neogen Corporation, we performed a SNP analysis to quantify the level of genetic heterogeneity in the colonies of Lab A, C and D, along with the Jackson Laboratory colony (Lab B). The data demonstrate that genomes of mice from The Jackson Laboratory and Lab D comprised 99% of the C57BL/6J strain. In contrast, the genomes of mice from Lab C and Lab A comprised 95% and 63% of C57BL/6 strain, respectively. The SNP analysis also revealed that those SNPs that were not C57BL/6J in nature were derived from a number of different strains, consistent with the initial breeding information of the founder line being bred to a Black Swiss mouse.
DISCUSSION
By comparing data assessed in the DyW model, we observe the main variability in growth rates and overall survival. Mice clustered into two distinct populations with different life expectations. Genetic analysis revealed that mice from the first cluster with shorter half-life Labs B and D) were of almost pure C57BL/6J genetic background, while mice of the second cluster with longer half-life (Labs A and C) were more heterogeneous in their genetic background. This can be explained with the use of in-house colonies and the possibility of genetic segregation or additional genetic modifications. Indeed, a certain variability in weight was also seen in wild type mice.
Interestingly, Labs B and D, which recorded the lowest survival rates in DyW, use also two different rodent food products from the same manufacturer, and these contain lower concentrations of vitamin E (30 and 75 mg/kg, respectively) than the food from the other two manufactures used by Labs A and C with the longest survival rate (100 and 200 mg/kg). Similarly, laboratories that recorded a lower survival rate used food with a slightly higher vitamin A concentration than laboratories with a longer survival rate (20 and 29 IU/g vs 12.6 and 16 IU/g). Other vitamin contents differed according to the food brand, although they had no obvious relationship to survival rates or body weight gain rate (see Table 5). Vitamin E has antioxidant properties and stabilizes cell membranes, in particular myocytes [16], against oxidative damage, which is a cause of muscle degeneration in many neuromuscular diseases [17]. Malnutrition-derived dystrophy or muscle atrophy are known in animals [18]. Some trials with vitamin E in the 1990’s, however, did not show a beneficial effect on human muscular dystrophy [19]. Other housing conditions that were different across laboratories did not seem to correlate with survival or weightgain.
An interesting finding of our study is that body weight at 5 weeks in the DyW is, to a certain extent, predictive of survival, as evidenced by the strongest linear relationship between survival and body weight and the greatest amount of variability in survival explained by body weight at week 5. Our data suggest that for every 1 g increase in body weight in DyW mice at this age, survival increases by 3.9 days with a probability of 40%. On the contrary, weights at 1 to 3 weeks of age are poor predictors of survival. Using body weight as a surrogate measure for survival would allow an investigator to gauge efficacy early in treatment course prior to confounding factor of hind limb paralysis. We do not have survival data on WT mice to assess whether body weight at any particular time point is predictive of survival. Given the differences in body weight seen at 5 weeks between WT mice (17.3±2.7 g) and DyW mice (8.4±2.5 g), we are hesitant to comment on predicting survival in WT mice.
Respiratory assessment by whole body plethysmography has been implemented in the last years and was successfully applied to detect drug efficacy in mdx mice [20, 21]. Instrument calibration and sample size seem to play an important role in the analysis [21]. The assessment of respiratory function in mice reflects a main outcome measure in patients with muscular dystrophies. Since the application of this assay to DyW mice is only recent, we collected data from the two laboratories to evaluate the properties of this measurement in this mouse model. Only the breath rate did not change over time in either lab and does not seem to be predictive of pathology.
A survey of sample size and power calculations done at each time point shows that many of the outcomes, even with the observed variability, are able to significantly detect a difference between WT and DyW mice (Table 6). However a detectable difference is less apparent under 5 weeks of age. In addition, breath rate was not detectable in a reasonable number of mice until 9 weeks of age.
Table 6.
Sample size and power estimates using observed data
| Age | Body weight | PenH/BW | Exp. flow | Insp. Flow | Tidal volume | Breath rate | |
| (weeks) | |||||||
| 3 | Power to detect a significant difference with 12 mice per group | 69.0 | 97.2 | 51.2 | 72.7 | 17.5 | 11.1 |
| N needed (per group) to detect a significant difference at 80% power | 16 | 7 | 23 | 15 | 81 | 169 | |
| 4 | Power to detect a significant difference with 12 mice per group | 99.9 | 98.9 | 72.9 | 99.0 | 93.9 | 44.9 |
| N needed (per group) to detect a significant difference at 80% power | 5 | 7 | 15 | 6 | 9 | 27 | |
| 5 | Power to detect a significant difference with 12 mice per group | 99.9 | 98.5 | 99.8 | 99.9 | 99.7 | 80.4 |
| N needed (per group) to detect a significant difference at 80% power | 3 | 7 | 5 | 4 | 6 | 12 | |
| 6 | Power to detect a significant difference with 12 mice per group | 99.9 | 70.0 | 98.4 | 99.5 | 99.9 | 63.9 |
| N needed (per group) to detect a significant difference at 80% power | 3 | 15 | 7 | 6 | 5 | 17 | |
| 7 | Power to detect a significant difference with 12 mice per group | 99.9 | 99.9 | 99.9 | 99.9 | 97.7 | 52.6 |
| N needed (per group) to detect a significant difference at 80% power | 3 | 4 | 5 | 4 | 7 | 22 | |
| 8 | Power to detect a significant difference with 12 mice per group | 99.9 | 99.1 | 93.9 | 94.5 | 80.2 | 74.7 |
| N needed (per group) to detect a significant difference at 80% power | 3 | 6 | 9 | 8 | 12 | 14 | |
| 9 | Power to detect a significant difference with 12 mice per group | 99.9 | 99.9 | 99.9 | 99.9 | 99.7 | 94.1 |
| N needed (per group) to detect a significant difference at 80% power | 4 | 4 | 3 | 3 | 6 | 9 | |
| 10 | Power to detect a significant difference with 12 mice per group | 99.9 | 93.5 | 99.5 | 99.2 | 61.4 | 89.6 |
| N needed (per group) to detect a significant difference at 80% power | 3 | 9 | 14 | 6 | 18 | 10 |
Finally, a comparison of histological evaluations from the four laboratories was not possible because of the use of different muscles for histological parameters and sometimes of different measurement units. This shows the need of standardized assessment to be able to pool results.
RECOMMENDATIONS TO IMPROVE REPRODUCIBILITY OF PHENOTYPIC ASSESSMENTS IN THE DyW MOUSE MODEL
Our analysis suggests that the variability we observe in outcomes like survival and weight gain may result from genetic drifting or from the food composition, while husbandry condtions were acceptably similar across laboratories. However, genetics and food composition vary just as well in the human population, and studies assessed in mice obtained from one single source and fed with one single diet may deliver more constant, but probably also less representative results. We underline instead the need to adopt lab-internal standard measures of handling and feeding of mice and to report the food brand and regimen in the description of mice handling (at present, only about 16% of the publications report the food manufacturer-personal observation). Regular checks of the genetic background help avoiding excessive segregation and it is highly recommended to always run controls with untreated or sham-treated mice to account for genetic heterogeneity. We furthermore recommend a minimal data set with standardization of reporting data in papers addressing therapeutic interventions on DyW, to allow data pooling and direct comparability of results (Table 7). Finally, the use of standardized, agreed-upon protocols (see www.curecmd.org) for the assessment of single parameters and a careful estimation of the minimal sample sizes required to obtain sufficient statistical power will certainly improve consistency of results and translatability of efficacy studies.
Table 7.
Recommended standards for data collection and result reporting in DyW
| Reporting | |
| General | |
| Strain | Mutant strain, wild-type strain, sources, gender |
| Food | Report brand and product number, use of softened food |
| Sample size | Report considerations on sample size |
| Other reporting | Blinding and randomization |
| Parameters | |
| Body weight | In grams, at 1,2,3,4,5,6,8 wk, report peak weight of each week, use Kaplan-Meier plots |
| Fibrosis | H&E with quantitation as % of area in TA and Triceps at 4,6,8 wk |
| CNF | Percentage in TA and Triceps at 4,6,8 wk |
| CK | In U/ml at 4 and 8 wk |
| Locomotion | Movement time and rest time in seconds at 4,6,8 wk |
CONFLICT OF INTEREST
No potential conflict of interest was reported by the authors.
ACKNOWLEDGMENTS
This study was supported by CureCMD and AFM-Téléthon. The work of DJB is supported by NIH/NIAMS R01AR064338, CureCMD, and Struggle Against Muscular Dystrophy (SAM). PMV was supported by a post-doctoral fellowship from the Orphan Disease Center at University of Pennsylvania and CureCMD. The laboratory of MAR is supported by the Swiss National Science Foundation, the Swiss Foundation for Research on Muscle Diseases (FSRMM) and AFM-Téléthon. The research of MG is supported by research grants from Cure CMD, Struggle Against Muscular Dystrophy (SAM) and Muscular Dystrophy Association (218938).
REFERENCES
- [1]. Graziano A, Bianco F, D’Amico A, Moroni I, Messina S, Bruno C, et al. Prevalence of congenital muscular dystrophy in Italy: A population study. Neurology. 2015;84(9):904–11. Epub 2015/02/06. [DOI] [PMC free article] [PubMed] [Google Scholar]
- [2]. Tome FM, Evangelista T, Leclerc A, Sunada Y, Manole E, Estournet B, et al. Congenital muscular dystrophy with merosin deficiency. Comptes Rendus de l’Academie Des Sciences Serie III, Sciences De La Vie. 1994;317(4):351–7. Epub 1994/04/01. [PubMed] [Google Scholar]
- [3]. Helbling-Leclerc A, Zhang X, Topaloglu H, Cruaud C, Tesson F, Weissenbach J, et al. Mutations in the laminin alpha 2-chain gene (LAMA2) cause merosin-deficient congenital muscular dystrophy. Nat Genet. 1995;11(2):216–8. Epub 1995/10/01. [DOI] [PubMed] [Google Scholar]
- [4]. Allamand V, Guicheney P. Merosin-deficient congenital muscular dystrophy, autosomal recessive (MDC1A, MIM#156225, LAMA2 gene coding for alpha2 chain of laminin). European Journal of Human Genetics: EJHG. 2002;10(2):91–4. Epub 2002/04/09. [DOI] [PubMed] [Google Scholar]
- [5]. Geranmayeh F, Clement E, Feng LH, Sewry C, Pagan J, Mein R, et al. Genotype-phenotype correlation in a large population of muscular dystrophy patients with LAMA2 mutations. Neuromuscul Disord. 2010;20(4):241–50. Epub 2010/03/09. [DOI] [PubMed] [Google Scholar]
- [6]. Leivo I, Engvall E. Merosin, a protein specific for basement membranes of Schwann cells, striated muscle, and trophoblast, is expressed late in nerve and muscle development. Proc Natl Acad Sci U S A. 1988;85(5):1544–8. Epub 1988/03/01. [DOI] [PMC free article] [PubMed] [Google Scholar]
- [7]. Wang CH, Bonnemann CG, Rutkowski A, Sejersen T, Bellini J, Battista V, et al. Consensus statement on standard of care for congenital muscular dystrophies. J Child Neurol. 2010;25(12):1559–81. Epub 2010/11/17. [DOI] [PMC free article] [PubMed] [Google Scholar]
- [8]. Kuang W, Xu H, Vachon PH, Engvall E. Disruption of the lama2 gene in embryonic stem cells: Laminin alpha 2 is necessary for sustenance of mature muscle cells. Experimental Cell Research. 1998;241(1):117–25. Epub 1998/06/20. [DOI] [PubMed] [Google Scholar]
- [9]. Kuang W, Xu H, Vachon PH, Liu L, Loechel F, Wewer UM, et al. Merosin-deficient congenital muscular dystrophy. Partial genetic correction in two mouse models. J Clin Invest. 1998;102(4):844–52. Epub 1998/08/26. [DOI] [PMC free article] [PubMed] [Google Scholar]
- [10]. Girgenrath M, Dominov JA, Kostek CA, Miller JB. Inhibition of apoptosis improves outcome in a model of congenital muscular dystrophy. J Clin Invest. 2004;114(11):1635–9. Epub 2004/12/04. [DOI] [PMC free article] [PubMed] [Google Scholar]
- [11]. Doe JA, Wuebbles RD, Allred ET, Rooney JE, Elorza M, Burkin DJ. Transgenic overexpression of the alpha7 integrin reduces muscle pathology and improves viability in the dy(W) mouse model of merosin-deficient congenital muscular dystrophy type 1A. Journal of Cell Science. 2011;124(Pt 13):2287–97. Epub 2011/06/10. [DOI] [PMC free article] [PubMed] [Google Scholar]
- [12]. Erb M, Meinen S, Barzaghi P, Sumanovski LT, Courdier-Fruh I, Ruegg MA, et al. Omigapil ameliorates the pathology of muscle dystrophy caused by laminin-alpha2 deficiency. J Pharmacol Exp Ther. 2009;331(3):787–95. Epub 2009/09/18. [DOI] [PubMed] [Google Scholar]
- [13]. Moll J, Barzaghi P, Lin S, Bezakova G, Lochmuller H, Engvall E, et al. An agrin minigene rescues dystrophic symptoms in a mouse model for congenital muscular dystrophy. Nature. 2001;413(6853):302–7. Epub 2001/09/21. [DOI] [PubMed] [Google Scholar]
- [14]. Girgenrath M, Beermann ML, Vishnudas VK, Homma S, Miller JB. Pathology is alleviated by doxycycline in a laminin-alpha2-null model of congenital muscular dystrophy. Ann Neurol. 2009;65(1):47–56. Epub 2008/12/17. [DOI] [PMC free article] [PubMed] [Google Scholar]
- [15]. Meinen S, Lin S, Thurnherr R, Erb M, Meier T, Ruegg MA. Apoptosis inhibitors and mini-agrin have additive benefits in congenital muscular dystrophy mice. EMBO Mol Med. 2011;3(8):465–79. Epub 2011/06/16. [DOI] [PMC free article] [PubMed] [Google Scholar]
- [16]. Howard AC, McNeil AK, McNeil PL. Promotion of plasma membrane repair by vitamin E. Nature Communications. 2011;2:597 Epub 2011/12/22. [DOI] [PMC free article] [PubMed] [Google Scholar]
- [17]. Majima HJ, Indo HP, Suenaga S, Matsui H, Yen HC, Ozawa T. Mitochondria as possible pharmaceutical targets for the effects of vitamin E and its homologues in oxidative stress-related diseases. Current Pharmaceutical Design. 2011;17(21):2190–5. Epub 2011/07/22. [DOI] [PubMed] [Google Scholar]
- [18]. Bedford HE, Valberg SJ, Firshman AM, Lucio M, Boyce MK, Trumble TN. Histopathologic findings in the sacrocaudalis dorsalis medialis muscle of horses with vitamin E-responsive muscle atrophy and weakness, Journal of the American Veterinary Medical Association. 2013;242(8):1127–37. Epub 2013/04/04. [DOI] [PubMed] [Google Scholar]
- [19]. Orndahl G, Grimby G, Grimby A, Johansson G, Wilhelmsen L. Functional deterioration and selenium-vitamin E treatment in myotonic dystrophy. A placebo-controlled study. Journal of Internal Medicine. 1994;235(3):205–10. Epub 1994/03/01. [DOI] [PubMed] [Google Scholar]
- [20]. Nelson CA, Hunter RB, Quigley LA, Girgenrath S, Weber WD, McCullough JA, et al. Inhibiting TGF-beta activity improves respiratory function in mdx mice. Am J Pathol. 2011;178(6):2611–21. Epub 2011/06/07. [DOI] [PMC free article] [PubMed] [Google Scholar]
- [21]. Huang P, Cheng G, Lu H, Aronica M, Ransohoff RM, Zhou L. Impaired respiratory function in mdx and mdx/utrn(+/-) mice. Muscle Nerve. 2011;43(2):263–7. Epub 2011/01/22. [DOI] [PMC free article] [PubMed] [Google Scholar]


