

SUMMARY
How phospholipids are trafficked between the bacterial inner and outer membranes through the hydrophilic space of the periplasm is not known. We report that members of the mammalian cell entry (MCE) protein family form hexameric assemblies with a central channel capable of mediating lipid transport. The E. coli MCE protein, MlaD, forms a ring associated with an ABC transporter complex in the inner membrane. A soluble lipid-binding protein, MlaC, ferries lipids between MlaD and an outer membrane protein complex. In contrast, EM structures of two other E. coli MCE proteins show that YebT forms an elongated tube consisting of seven stacked MCE rings, and PqiB adopts a syringe-like architecture. Both YebT and PqiB create channels of sufficient length to span the periplasmic space. This work reveals diverse architectures of highly conserved protein-based channels implicated in the transport of lipids between the membranes of bacteria and some eukaryotic organelles.
INTRODUCTION
The bacterial outer membrane (OM) is a critical barrier, restricting the traffic of small molecules such as antibiotics into the cell. Mutations that disrupt OM integrity reduce virulence in pathogenic bacterial species (Cox et al., 1999; Kong et al., 2012; Wang et al., 2007) and increase their susceptibility to antibiotics, suggesting that targeting pathways important for OM maintenance and biogenesis may be a fruitful approach for developing new therapies for bacterial disease.
The OM of most Gram-negative bacteria is asymmetric, with an outer leaflet rich in lipopolysaccharide (LPS) and an inner leaflet composed of phospholipids. Much research has uncovered a detailed, but still evolving, picture of how LPS is synthesized, trafficked and inserted into the OM (May et al., 2015; Ruiz et al., 2009). Yet, the mechanisms and structural basis of how nascent phospholipids are trafficked between the inner membrane (IM) and OM, and how asymmetry between the leaflets of the OM is maintained remain unclear.
Proteins of the MCE superfamily [originally thought to mediate Mammalian Cell Entry in M. tuberculosis (Arruda et al., 1993)] are defined by the presence of one or more conserved MCE domain at the sequence level, but have no similarity to other proteins of known structure or function. MCE proteins are ubiquitous among double-membraned bacteria (Casali and Riley, 2007) (Figure 1A) and eukaryotic chloroplasts (Awai et al., 2006), a double-membraned bacteria-derived organelle. In contrast, MCE proteins are absent in bacteria bounded by a single membrane. MCE proteins are important virulence factors pathogenic bacteria (Carpenter et al., 2014; Gioffré et al., 2005; Nakamura et al., 2011; Pandey and Sassetti, 2008; Senaratne et al., 2008; Zhang et al., 2012), and have been implicated in the transport of lipids (Awai et al., 2006; Malinverni and Silhavy, 2009; Roston et al., 2011; Sutterlin et al., 2016; Xu et al., 2003, 2008), cholesterol and steroids (Klepp et al., 2012; Mohn et al., 2008; Pandey and Sassetti, 2008), and other hydrophobic molecules (Kim et al., 1998). MCE proteins from plants (Awai et al., 2006), and more recently from V. parahaemolyticus and E. coli, have been shown to bind phospholipids (Krachler et al., 2011; Thong et al., 2016). MCE systems are thought to drive the transport of hydrophobic molecules from the OM to the IM, although it has also been suggested that they may function as exporters to move molecules towards the OM and the outside of the cell (Kim et al., 1998).
Figure 1. MCE proteins are important for OM integrity.
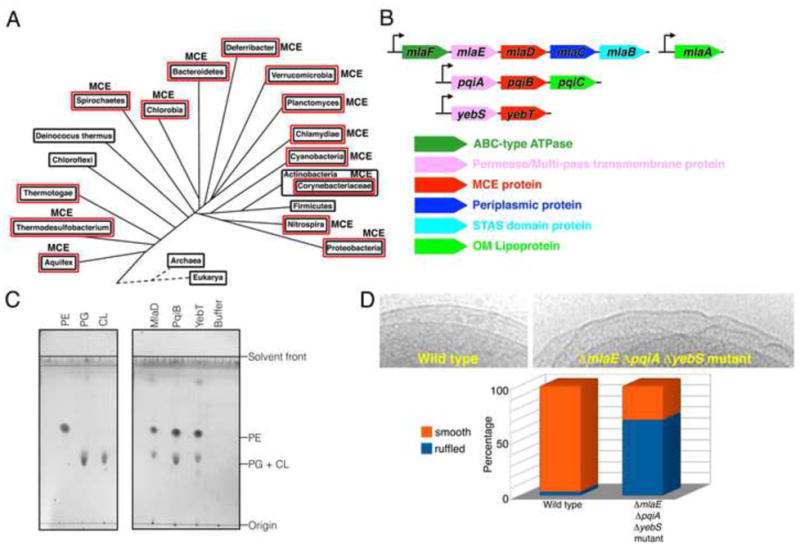
(A) Distribution of MCE proteins across bacterial lineages. Red boxes indicate double-membranes.
(B) Organization of MCE operons from E. coli.
(C) TLC of phospholipids bound to purified E. coli MCE proteins. Left, lipid standards. Right, lipids co-purifying with MlaD, PqiB, and YebT.
(D) OM ruffling of MCE mutants. Top, electron micrographs of WT and ΔmlaE ΔpqiA ΔyebS E. coli cells, with smooth and ruffled OM, respectively. Bottom, frequency of OM ruffling (n~50 cells).
Here we report the X-ray and EM structures for the three MCE proteins from E. coli. One MCE protein, MlaD, forms a homo-hexameric ring, is part of a larger multi-protein complex in the IM, and interacts with a periplasmic lipid-carrying protein, which likely shuttles lipids between transport complexes in the IM and OM. In contrast, MCE proteins YebT and PqiB form two different, more elongated structures by stacking hexameric rings together to form barrels and tubes, which result in continuous channels that are of sufficient length to directly span the distances between the IM and OM, without the need for a periplasmic shuttle protein. The distinct architectures of these MCE proteins suggest multiple strategies for moving lipids through the hydrophilic environment of the periplasm.
RESULTS
Mutations in MCE operons result in OM defects
E. coli strain MG1655 contains 3 MCE genes (Figure 1B): mlaD (maintenance of OM lipid asymmetry D), pqiB (paraquat inducible B), and yebT (also known as MAM7 (Krachler et al., 2011)). These MCE genes are part of three different operons, each of which also encode a multi-pass transmembrane (TM) protein (MlaE, PqiA, and YebS)(Figure 1B). The mla operon also encodes an ABC-type (ATP binding cassette) ATPase (MlaF), a periplasmic protein MlaC, and a STAS domain protein, MlaB, and functions together with an OM lipoprotein, MlaA, encoded elsewhere in the genome (Figure 1B)(Malinverni and Silhavy, 2009). Mutations in mla genes result in increased sensitivity to a combination of SDS and EDTA (SDS+EDTA), suggestive of an OM defect, which has been attributed to a loss of OM asymmetry (Malinverni and Silhavy, 2009). The presence of an ATPase and a multi-pass TM protein in some MCE operons has led to the hypothesis that MCE systems encode a family of ABC transporters (Carpenter et al., 2014; Casali and Riley, 2007; Zhang et al., 2012). Recently, it has been shown that MlaFEDB interact to form a complex, and the MCE subunit MlaD binds phospholipids (Thong et al., 2016), supporting a role in lipid transport.
To assess whether other MCE proteins from E. coli may also be involved in lipid transport for the OM, we assayed binding of phospholipids to all three E. coli MCE proteins. Purified MlaD, PqiB, and YebT proteins expressed in E. coli were subjected to chloroform-methanol extraction, and the organic phase was analyzed by thin layer chromatography (Figure 1C). MlaD, PqiB, and YebT each bound phospholipid species that co-migrated with phosphatidylglycerol (PG), cardiolipin (CL) and phosphatidylethanolamine (PE) standards. PG and PE were found to be present in the samples by mass spectrometry, and no CL was observed. Thus, all three MCE proteins in E. coli interact with phospholipids, suggesting that the Mla, Pqi, and Yeb systems may all function in lipid transport.
To understand how the Mla, Pqi, and Yeb systems may function together to maintain OM integrity, we constructed a triple deletion mutant lacking the putative permease subunit from each operon (ΔmlaE ΔpqiA ΔyebS). The ΔmlaE ΔpqiA ΔyebS mutant is viable and shows no discernible growth defect relative to wild-type in liquid LB medium (Figure S1A). Thus, the Mla, Pqi, and Yeb systems are non-essential for E. coli growth in culture despite being critical for resistance to environmental stresses, such as those encountered by pathogens during infection. Like the ΔmlaE single mutant (Figure S1G), the ΔmlaE ΔpqiA ΔyebS mutant was also sensitive to SDS+EDTA (Figure S1H). However, the ΔmlaE ΔpqiA ΔyebS mutant is more susceptible to other OM stressors, such as 5% SDS alone or 100 mM CaCl2 (Figure S1B and S1C). As divalent cations are important for the stabilization of interactions between LPS molecules in the OM, the mutant may be more sensitive to CaCl2 due to an already weakened OM.
Exposure of ΔmlaE ΔpqiA ΔyebS mutant cells to the DNA stain DAPI resulted in strong nucleoid staining, whereas staining of wild-type cells was weaker and largely confined to the cell periphery (Figure S1E). This suggests that the barrier function of the OM is compromised in the mutants. Indeed, uptake of ethidium bromide was also elevated in the ΔmlaE ΔpqiA ΔyebS mutant relative to the wild-type (Figure S1F), consistent with previous work suggesting that E. coli MCE mutants are more susceptible to hydrophobic antibiotics (Nichols et al., 2011). Staining of live cells with propidium iodide (PI), a DNA dye which only stains cells with a disrupted plasma membrane, confirmed that only a small population of PI positive cells was present in the ΔmlaE ΔpqiA ΔyebS mutant cultures, suggesting that the IM remains intact (Figure S1E). Overall, these results are consistent with a more severe OM defect in the triple mutant, suggesting that the Mla, Pqi, and Yeb systems, or a combination thereof, act in concert to maintain the integrity of the OM barrier.
To better understand the nature of the OM defect in these mutants, we examined intact ΔmlaE ΔpqiA ΔyebS triple mutant E. coli cells by cryo transmission electron microscopy. Strikingly, most triple mutant ΔmlaE ΔpqiA ΔyebS cells exhibited cell surface ruffling, suggestive of gross disorganization of the OM, whereas the IM and OM of wild-type cells were smooth with a well-defined periplasm in between (Figures 1D, S1I, and S1J). This is consistent with results from Streptomyces coelicolor in which mutations in the single MCE gene cluster led to global changes in the cell surface (Clark et al., 2013), as well as other work suggesting that MCE mutants have altered OM lipid composition (Cantrell et al., 2013; Malinverni and Silhavy, 2009). Thus, MCE proteins are important for maintaining the morphology of the OM and the uniform spacing between the IM and OM.
MlaD forms a hexameric ring with a central hydrophobic pore
As MCE proteins have no detectable similarity to proteins of known structure or function, we obtained structural information using a combination of X-ray crystallography and electron microscopy (EM). MlaD is predicted to be anchored to the IM by a single N-terminal TM helix, with its MCE domain residing in the periplasm (Figure 2A). We determined the crystal structure of the complete periplasmic domain of E. coli MlaD (residues 32–183) at 2.85 Å resolution and its core MCE domain at 2.15 Å resolution (Tables S1 and S2; Figure S2B). The MCE core domain adopts a 7-stranded β-barrel fold, encompassing just over 100 residues (Figures 2B and 2C). A search of the Protein Databank for structural homologs using DALI (Holm and Rosenström, 2010) did not identify any other proteins that share this fold, although we identified two classes of similar domains that differ in the arrangement of β-strands (Figure S2A).
Figure 2. MCE protein MlaD forms hexameric rings with a central hydrophobic pore.
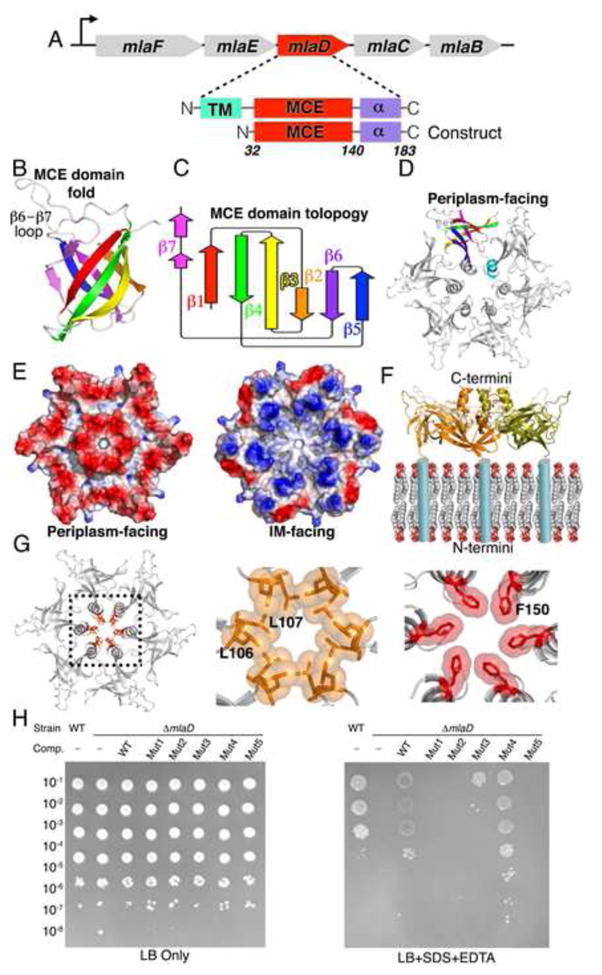
(A) E. coli mla operon and architecture of MlaD and “periplasmic domain” construct.
(B) Crystal structure of core MCE domain of MlaD adopting 7-stranded beta-barrel fold.
(C) Topology diagram of MlaD core MCE domain of MlaD.
(D) MlaD oligomerizes to form a homo-hexameric ring.
(E) Left, Electrostatic potential surface of MlaD [oriented as in (D)], with net negative charge on the periplasm facing side. Right, The membrane facing surface of MlaD is more positively charged.
(F) 90° rotation of MlaD from depiction in (D) showing that the N-terminal TM helix of each MCE domain anchors one face of the ring near the periplasmic face of the IM.
(G) Hydrophobic resides line the central channel of the MlaD ring. Middle, Leu106 and Leu107 at the tip of the β5-β6 loop. Right, Phe150 from the C-terminal helical bundle.
(H) Complementation of ΔmlaD E. coli with WT MlaD and pore mutants. Mut1 = Leu106Asn/Leu107Asn; Mut2 = Δ105–108::AsnAsn; Mut3 = Δ104–109::AsnAsn; Mut4 = Phe150Asn; Mut5 = Δ141–183.
The six copies of MlaD are assembled into a homo-hexameric ring with the C-terminal α-helical domain extending from one face of the ring (Figure 2D). The interface between subunits consists of two main parts. First, the core MCE domains interact in a “head-to-tail” fashion, mediated primarily by the connecting loops at each end of the β-barrel fold, accounting for more than half (~900 Å2) of the total interface (1,660 Å2). Second, the C-terminal helical regions from each protomer come together to form a 6-helix bundle at the center of the ring (760 Å2 interface). Truncation of the C-terminal α-helical region led to the formation of heptameric instead of hexameric rings (Figure S2C–S2G), suggesting that interactions between the C-terminal α-helices may play a role in determining the overall oligomeric state and packing of the MCE subunits.
The N-terminus of each MCE domain is connected by a short linker to a TM helix, which places the N-terminal face of the ring in close proximity to the negatively charged phospholipid head groups (Figure 2F). Consistent with this orientation, the membrane-facing surface of the ring is considerably more basic than the C-terminal, periplasm-facing side (Figure 2E). The C-terminal helix from each subunit associates to form a hollow 6-helix coiled-coil, leaving a solvent accessible channel running through the center of the ring (Figure 2G). This channel is lined with hydrophobic residues and has two notable constriction points: the first is formed by Leu106 and Leu107 at the tip of the β5-β6 loop and second by Phe150 in the C-terminal helix (Figure 2G). These narrowings, in particular the constriction formed by the Phe150 ring, are reminiscent of the Phe427 Φ-clamp in the central pore of anthrax protective antigen, where they play a key role in the transport of protein toxins through the PA translocon (Jiang et al., 2015). At the narrowest point, the channel diameter is ~6–8 Å, large enough to allow the passage of small hydrophobic molecules like phospholipids or sterols. It should also be noted that the weaker electron density in this region of the crystal structure suggests that these loops are at least somewhat flexible and therefore may allow somewhat larger molecules to pass through. Outside of these constriction points, several other residues from the C-terminal helices contribute to the hydrophobic pore lining, including Met141, Leu143, Leu146, Ile147, and Leu149. Based upon its orientation relative to the IM (Figure 2F), this hydrophobic pore through the MlaD ring is poised to function as a channel to facilitate trafficking of small hydrophobic molecules to or from the IM.
To test the functional relevance of these pore-lining residues, we made a panel of mutant constructs, and asked whether these complement a ΔmlaD mutant strain. MlaD constructs with mutations in the β5-β6 loop were unable to complement a ΔmlaD deletion (approximately isosteric mutation L106N/L107N, and L106N/L107N combined with a 2 or 4 residue loop-shortening deletion), suggesting that these pore-lining residues may be especially important for MlaD function (Figure 2H). Removal of the C-terminal helices and disordered region (residues 141–183), including most of the hydrophobic residues that make up the pore also failed to complement the ΔmlaD mutant (Figure 2H). In contrast, mutation of the final pore lining residue, Phe150, did complement the ΔmlaD mutant (F150N; Figure 2H).
Architecture of the MlaFEDB transporter complex
An MCE protein implicated in lipid transport in plants, TRIGALACTOSYLDIACYLGLYCEROL 2 (TGD2), forms part of a high-molecular weight complex in the chloroplast IM (Awai et al., 2006; Roston et al., 2011, 2012). To assess whether MlaD forms a complex with any of the other Mla proteins, we over-expressed the full mlaFEDCB operon in E. coli (Figure 3A) and determined whether any other Mla proteins co-purify with His-tagged MlaD. After affinity purification and gel filtration (Figure 3B), SDS-PAGE analysis of the purified MlaD sample revealed the presence of three additional proteins forming a stable complex with MlaD (Figure 3C) which were identified by mass spectrometry to be MlaF, MlaE, and MlaB; the co-expressed MlaC protein, however, was absent. Independently, similar results were recently reported (Thong et al., 2016).
Figure 3. MlaD is part of a large transport complex in the IM.
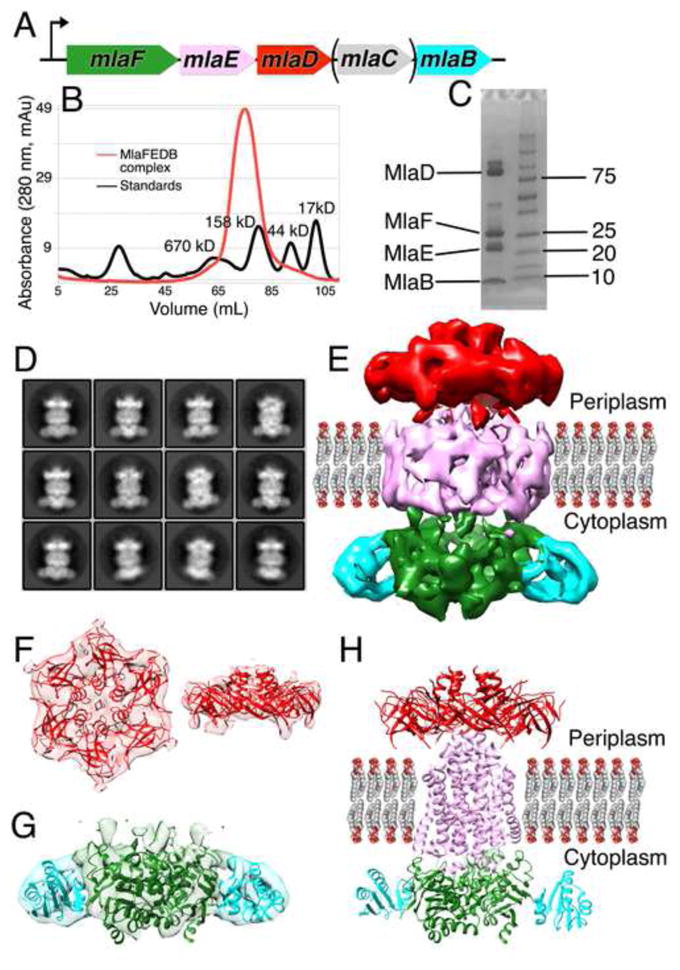
(A) Co-expression of MlaFEDCB with 6xHis tagged MlaD.
(B) Gel filtration of detergent solubilized MlaD yields a high molecular weight complex.
(C) SDS-PAGE and mass spectrometry demonstrate that MlaF, MlaE, MlaD, and MlaB form a complex.
(D) 2D cryo-EM class averages for the MlaFEDB.
(E) 3D reconstruction of MlaFEDB complex. Density colored to indicate locations of MlaD (red), MlaF (green), MlaB (cyan), and TM domain (pink, including MlaE, MlaD TM helices, and amphipol).
(F) Left, top view (from the OM towards the IM) and right, side view of periplasmic EM density fit with hexameric MlaD crystal structure.
(G) Side view of the cytoplasmic EM density, fit with homology models of MlaF (green) and MlaB (cyan).
(H) Hybrid model of MlaFEDB complex. MlaD crystal structure (red), homology models of MlaF (green) and MlaB (cyan), and de novo, computationally predicted model for MlaE (pink). The MlaD TM are not depicted.
We next sought to determine the architecture of the MlaFEDB complex by single particle cryo-electron microscopy (cryo-EM). The 2D class averages were feature-rich, and individual components within the complex and possible TM helices were clearly identifiable (Figure 3D). Some inherent flexibility in the complex was apparent in these 2D class averages, suggesting that the relative orientation of the components is not rigidly fixed, which may also limit the final resolution of our density maps. 3D classification and refinement produced a ~10 Å resolution density map (Figures 3E, S3A, and S3B). The six-fold symmetry of the MlaD ring is readily apparent at one end of the map (Figure 3F), which could be well fit by the hexameric, MlaD crystal structure (Figure 3F). The opposite end of the map is approximately two-fold symmetric, consistent with the dimeric state of known ABC transporters. Homology models of the MlaF ATPase and MlaB STAS domain were generated (Kelley et al., 2015), and two copies each of MlaF and MlaB can be fit into the map (Figure 3G). It should be noted that while the overall position of MlaB within the complex is clear, its orientation relative to MlaF is not well defined by the map and the details of this interaction await further investigation. The remaining central density corresponds to the TM subunit, MlaE, along with the six TM helices from the MlaD ring. The volume of the TM region and the apparent 2-fold symmetry of the map suggests there are most likely two copies of the MlaE subunit, although the modest resolution of our cryo-EM reconstruction does not allow us to trace the MlaE subunit, even at the secondary structure level. The apparent symmetry mismatch between the hexameric MlaD and the dimeric permease assemblies implies that the MlaD-MlaE interface cannot be identical for each of the six MlaD subunits.
Recently, a model for the MlaE structure was generated from a powerful new approach to protein structure prediction using residue contact restraints based upon co-evolving residue pairs (Ovchinnikov et al., 2015). This de novo model for MlaE is dimeric and can be accommodated within the larger density of the TM region (Figure 3E, 3H, and S3F). Additional density surrounds the MlaE model, which may be derived from the six MlaD TM segments and the amphipol used to solubilize the complex. Indeed, several residues in the MlaD TM helices show signatures of co-evolution with residues in the membrane spanning portion of MlaE, suggesting a physical interaction (Figure S3C). Several additional residues in the MlaF ATPase appear to be co-evolving with residues in MlaE. These residues lie at the predicted cytoplasmic end of MlaE and on the surface of MlaF employed by other ABC ATPases to interact with their permease subunits (Figure S3D), supporting the placement and orientation of the Mla subunits in our cryo-EM map. Strikingly, this predicted model of the MlaE permease subunit closely resembles the overall fold of ABCG5/ABCG8 (Figure S3E), a recently determined human ABC transporter structure involved in cholesterol export from hepatocytes (Lee et al., 2016). While the structure of MlaE remains to be determined experimentally, true homology with ABCG5/ABCG8 would group MCE transporters with this important class of ABCG transporters exporting another hydrophobic substrate, cholesterol, in humans.
MlaC binds lipid tails
Many ABC transporters from double-membraned bacteria employ small substrate binding proteins that facilitate cargo recognition and trafficking across the periplasm. Although MlaC has no sequence similarity canonical substrate binding proteins, it is part of the mla operon (Figure 4A), and targeted to the periplasm by an N-terminal signal sequence. Structures of two possible homologs of MlaC were previously deposited in the PDB by the Northeast Structural Genomics Consortium (NESG) without any associated publications (2QGU and 4FCZ; 27% and 22% sequence identity and Cα rmsd of 2.5 Å and 3.0 Å with E. coli MlaC, respectively). The NESG crystal structure of an MlaC-like protein from Ralstonia solanacearum (2QGU) was crystallized with a ligand of unknown origin bound in its hydrophobic pocket, which was modeled as phosphatidylethanolamine (Figures S4D and S4G). Based upon these structures, it has been proposed that MlaC-like proteins may function as periplasmic substrate binding proteins for the transport of lipids (Malinverni and Silhavy, 2009) or other hydrophobic molecules.
Figure 4. MlaC shuttles lipids across the periplasm.
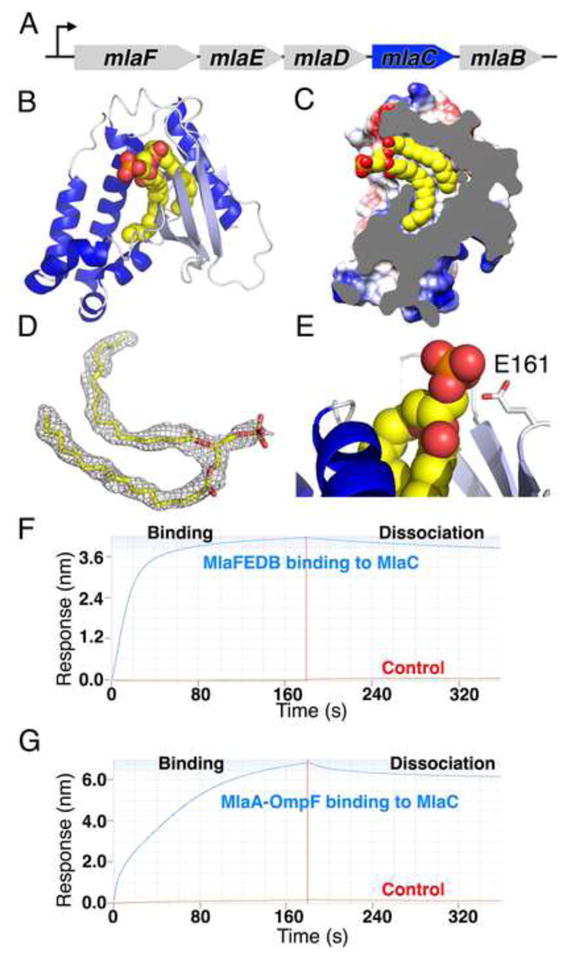
(A) MlaC is encoded in the mla operon but not stably present in the MlaFEDB complex.
(B) Crystal structure of MlaC reveals a mixed α/β fold with 4 β-strands (light blue) and 7 α-helices (dark blue). MlaC-bound lipid shown as spheres.
(C) Cut away view of MlaC surface, revealing deep hydrophobic pocket that binds the two “tails” of a lipid.
(D) Unbiased 2Fo-Fc electron density map for bound lipid, contoured at 1 σ.
(E) MlaC makes no significant interactions with the lipid head group.
(F and G) MlaC interacts with the IM MlaFEDB complex (F) and the OM MlaA-OmpF complex (G), suggesting MlaC may ferry lipid substrates between these IM and OM complexes.
To understand how MlaC might be involved in substrate recognition, we determined the crystal structure of MlaC at ~1.50 Å resolution. Like 2QGU and 4FCZ, MlaC adopts a mixed α/β-fold, consisting of a highly twisted, 4-stranded β-sheet and a bundle of 7 α-helices (Figure 4B). Outside of the three MlaC-like proteins, a structure-based comparison to other proteins in the PDB using DALI revealed distant similarities to the nuclear transport factor 2 (NTF2) protein superfamily and to the parental, Cystatin-like fold (Figure S4A). Interestingly, within a deep hydrophobic pocket in the protein core of MlaC, we observed a “wishbone”-shaped density (Figure 4D), which we have modeled as phosphatidic acid (Figures 4B, 4C, S4C, and S4F). The two acyl chains of the lipid insert snugly into the protein core where they are protected from solvent (Figure 4C), while the head group is almost entirely solvent exposed and makes only minor contacts with the protein (Figure 4E). Due to the small size of the hydrophobic cavity and the lack of head group interactions, we predict that MlaC is capable of binding to a wide range of diacyl lipids with little head group specificity. In another MlaC-like structure in the PDB (4FCZ), no ligands were explicitly modeled, but our re-refinement of the deposited coordinates and structure factors revealed additional electron density in the hydrophobic pocket of this protein (Figures S4E and S4H, and Table S3), suggestive of a tetra-acyl, cardiolipin-like lipid. The observation of lipid ligands in MlaC, 2QGU, and 4FCZ support the notion that MlaC and its close homologs are lipid-binding proteins.
MlaC binds IM and OM protein complexes
Since MlaC is a periplasmic lipid-binding protein, we hypothesized that MlaC shuttles lipid substrates between the IM MlaFEDB transporter and an OM complex, where lipids would be inserted into or removed from the OM. Lipoprotein MlaA is a candidate component for this OM complex, as it has been implicated in Mla function (Malinverni and Silhavy, 2009) and forms a complex with the OM porin proteins, OmpC and OmpF (Chong et al., 2015). Thus, we asked whether MlaC could interact directly with purified MlaFEDB and MlaA-OmpF protein using biolayer interferometry. We over-expressed and purified MlaA from E. coli, which co-purified as a stable complex with OmpF under our culture conditions, as confirmed by mass spectrometry. We observed robust and specific binding of both MlaFEDB (Figure 4F) and MlaA-OmpF assemblies (Figure 4G) to MlaC, as well as a direct interaction between MlaC and MlaD (Figure S4I). These results demonstrate that MlaC is capable of binding to both the IM and OM complexes, supporting a model where MlaC plays a central role in transferring a lipid substrate from one membrane to another.
Stacking of MCE rings yields larger assemblies in YebT and PqiB
No other homologs of MlaC are encoded in the E. coli genome, raising the question of how the Yeb and Pqi systems might move substrates across the periplasm. To gain insight into this question, we purified full-length E. coli YebT and the periplasmic domain of PqiB, which contain seven and three tandem MCE domains, respectively (Figure 5A and 5D), and obtained negative-stain EM reconstructions at ~20 Å resolution (Figures 5B, 5C, 5E, 5F, S5A, and S5B).
Figure 5. YebT and PqiB adopt elongated tube and syringe-like architectures.
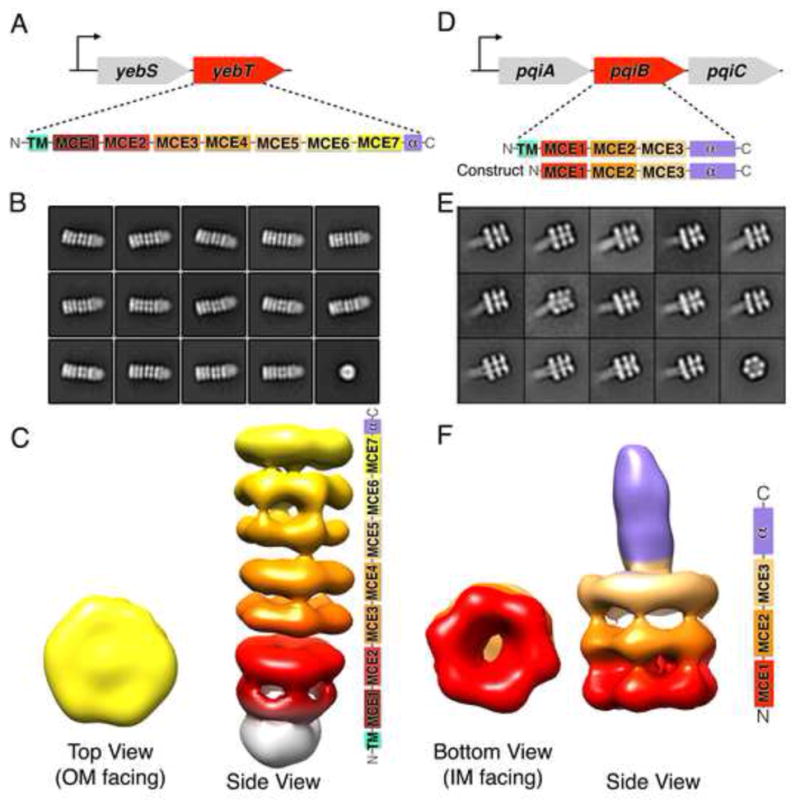
(A) E. coli yeb operon and domain architecture of MCE protein YebT.
(B) Negative stain, 2D class averages for YebT.
(C) 3D reconstructions of YebT. Right, domain organization of YebT, color coded to show how the seven tandem MCE domains contribute to the seven stacked rings of EM density. White density corresponds to the TMs in the IM. Reconstruction is viewed from the side, IM at bottom and OM at top. Left, top view of YebT EM density map (OM towards IM).
(D) E. coli pqi operon and domain architecture of MCE protein PqiB and “periplasmic construct”.
(E) Negative stain, 2D class averages for PqiB.
(F) 3D reconstruction of PqiB. Right, side view of PqiB, with domain organization at right. Left, bottom view (IM towards OM).
The overall architecture of YebT is striking, consisting of a tall stack of 7 rings of density forming an elongated, tube-like barrel, ~230 Å long and ~90 Å in diameter (Figure 5C). To a first approximation, YebT resembles other macromolecular barrels such as the proteasome, ClpXP, and GroEL, wherein one or more small globular domains assemble into rings that in turn stack on top of one another (Figure S5F). An additional, fuzzy density is observed at one end of the barrel, which likely corresponds to a detergent micelle and the N-terminal TM helices from each YebT polypeptide chain (Figure 5C, bottom).
In contrast to the 7-ringed tube of YebT, the negative stain EM reconstruction of PqiB resembles a needle and syringe, with the syringe barrel consisting of a stack of three rings of density (Figure 5F). A needle-like projection emanates from the center of the top of the barrel (Figure 5F). Recombinant PqiB proteins containing only the three MCE domains form barrels without needles, showing that the C-terminal helical regions from each subunit come together to form this needle-like structure (Figures S5C and S5D).
Each of the rings of density in the YebT and PqiB reconstructions exhibit apparent 6-fold symmetry, and is similar in overall size and shape to the hexameric ring formed by the MCE domains of MlaD. Indeed, polyalanine MCE models derived from the MlaD hexamer fit well into each of the density rings (Figure S5E). Thus, we propose that YebT is a ~570 kDa hexameric assembly of 6 copies of the YebT polypeptide which is anchored in the IM via 6 TM helices in a manner analogous to MlaD. In this orientation, the C-terminus of YebT could be as much as ~230 Å away from the IM. Similarly, hexameric PqiB would form a ~360 kDa complex, anchored on the IM by the face of one ring, with the syringe barrel and needle projecting up to ~230 Å away from the IM. As the distance between the IM and OM in E. coli is approximately 225 Å (Hoffmann et al., 2008; Matias et al., 2003), this raises the possibility that YebT and PqiB might directly span the intermembrane space, facilitating the transport of substrates (likely lipids or other hydrophobic molecules) across the intervening, aqueous periplasm.
Cryo EM structure of PqiB
To understand how these larger MCE domain proteins such as YebT and PqiB may be involved in lipid transport across the periplasm, we used single-particle cryo EM to obtain a reconstruction of the PqiB periplasmic domain with an overall resolution of 3.96 Å (Figures S6A – S6C, S6E). The final maps are of high quality, with nearly continuous backbone density across the three MCE rings and rich side-chain density which allowed the assignment of the amino acid sequence over the majority of the final model (Figure S6D).
As suggested by our lower resolution negative-stain reconstructions, six PqiB polypeptides associate to form the complete, ~360 kDa PqiB needle-and-syringe assembly (Figure 6A). The needle of PqiB is formed by a hollow, 6-helix coiled-coil, while the barrel consists of 18 MCE domains, distributed into 3 stacked hexameric rings (Figures 6B – 6D). In the hexameric assembly, 6 copies of each of the MCE1, MCE2, and MCE3 domains self-associate form each of the three observed rings: the MCE1 ring at one end of the barrel; the MCE2 ring in the middle; and the MCE3 ring on the other side of the barrel, adjacent to the base of the needle (Figures 6B and 6C). Consequently, the number of stacked rings in a given MCE protein seems likely to be determined by the number of tandem MCE domains in the protein. This is also the case for YebT, in which seven MCE domains in the primary sequence yield an architecture consisting of seven rings (Figure 5C).
Figure 6. Cryo EM structure of PqiB reveals architecture of a periplasmic bridge.
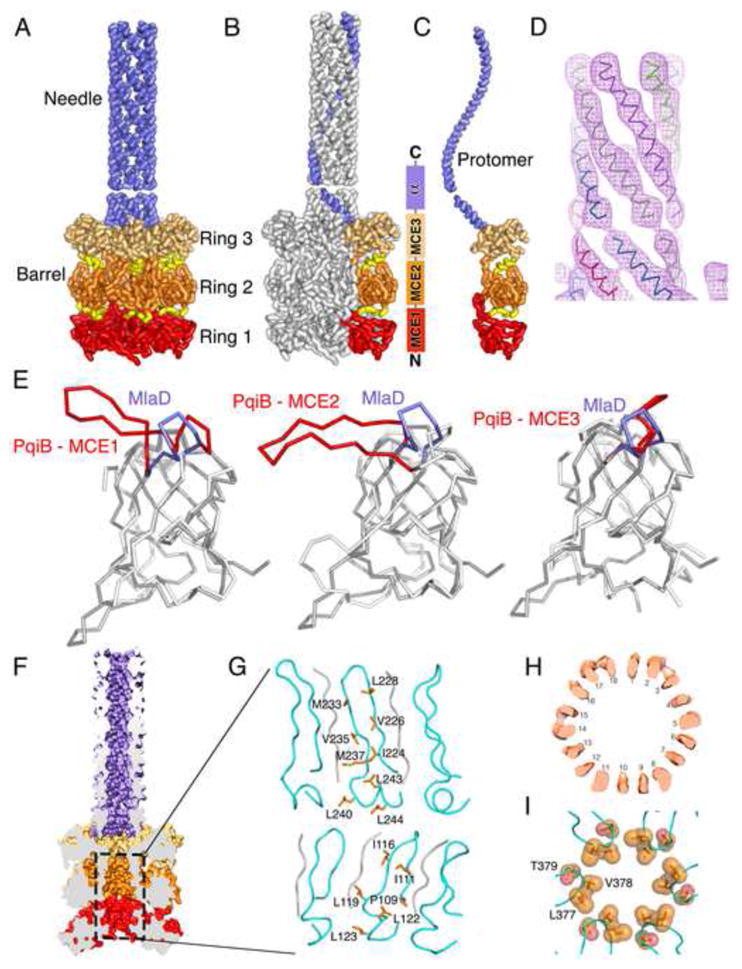
(A) Side view of PqiB, with the IM at bottom and the OM at top. The MCE1, MCE2, and MCE3 rings of the barrel (red, orange, and tan, respectively), and inter-ring connectors (yellow) are shown. The C-terminal “needle” is colored lilac.
(B and C) Similar to (A), but with single subunit colored in the complex (B), and in isolation (C).
(D) Helical density for the first half of the needle, proximal to the barrel.
(E) Superposition of the MlaD MCE domain on PqiB’s MCE1, MCE2, and MCE3 domains. The β5-β6 loop of MlaD is in lilac and the homologous PqiB loops in red.
(F) Surface representation of PqiB, cut in half vertically to reveal a long tunnel running from the tip of the needle to the bottom of the barrel.
(G) Ribbon representation of the boxed region in (F), showing the interior/lumenal surface of the barrel’s pore. The β5-β6 loops are depicted in cyan, with additional polyalanine strands in gray. The side chains facing the pore lumen are shown as orange sticks and labelled.
(H) Horizontal slice through the upper 18-stranded β-barrel motif of PqiB barrel, revealing 18 tubes of density.
(I) Residues from the β5-β6 loop of PqiB’s MCE3 domain form a constriction between the barrel and the needle. Top view (from OM towards IM), with β5-β6 loops in cyan and key residues as labeled orange spheres.
PqiB has a long tunnel running from the tip of the needle to the bottom of the barrel, consistent with a possible function as a channel for the translocation of lipids (Figure 6F). The walls of the barrel formed by the core the MCE domains themselves are incomplete, with large gaps 10–20 Å in diameter between the MCE1 and MCE2 rings, and between the MCE2 and MCE3 rings. However, in these two regions, the central pore of PqiB is lined by two 18-stranded β-barrel motifs stacked end-to-end (Figures 6G and 6H), creating a barrier that could exclude solvent from the hydrophobic, central channel. In MlaD, the β5-β6 loop forms part of the hydrophobic pore lining, including residues Leu106 and Leu107. Similarly, the homologous loop from PqiB’s MCE3 domain has a hydrophobic tip consisting of Leu377, Val378, and Thr379, forming a ~13 Å constriction at the junction between the barrel and the needle (Figure 6I). In contrast, the homologous loops from the MCE1 and MCE2 domains of PqiB are much longer, forming extended β-hairpins. These hairpins from the six MCE2 domains each contribute two strands to one of the two 18-stranded β-barrels that line the pore, 12 strands in all (Figure 6G). Similarly, the MCE1 loops contribute 12 strands to the second 18-stranded β-barrel motif. It should be noted that in each barrel, six additional tubes of density remain unaccounted for, which we have modeled as polyalanine β-strands, leaving some ambiguity in the nature of the pore lining (see Method Details). But as modeled, the β-hairpins from MCE1 and MCE2 present a large number of hydrophobic residues on the lumenal surface of the 18-stranded β-barrel motif, supporting the notion that the central pores of MCE proteins may function as channels for the transport of lipids or other hydrophobic molecules.
At the C-terminus of PqiB’s final MCE domain, there is clear additional density for 6 helices (Figure 6D), one contributed from each polypeptide chain, forming a needle-like, 6 helix coiled-coil. The resulting needle has an outer diameter of ~35 Å and a hollow lumen ~15–20 Å wide that is continuous with the channel running through the PqiB barrel (Figure 6F). A similar arrangement of 6 helices was observed near the C-terminus of MlaD in our crystal structure (Figure 2D and 2F), though the twist of the coiled-coil is more pronounced in PqiB, resulting in a wider pore through the PqiB needle. After ~ 20 helical residues, there is a pronounced break in the density followed by an additional ~40 helical residues, in good agreement with the predicted secondary structure for this region and a helix-breaking proline residue near the junction between these two helical segments (Figure 6D). The needle is somewhat flexible at the junction with the barrel, as is clear from the 2D class averages (Figure S6B) and its significantly lower local resolution compared with most of the barrel (Figure S6E). Consequently, we were unable assign the sequence register and we have modeled this region with polyalanine helices. The density becomes progressively weaker moving from the barrel towards the tip of the needle, and beyond the first ~60 helical residues, the density becomes uninterpretable. However, most of the remaining 50–60 residues in C-terminal region of PqiB are predicted to be helical, and it seems likely that the observed 6-helix coiled-coil structure continues to nearly the C-terminus. This additional modeled region is absent in the deposited PDB coordinates, but the coordinates for the complete model are available in the SI. This would result in a needle approximately 135 Å long, in good agreement with the maximum needle lengths we observed in unaveraged, single particle images. From the bottom of the barrel to the tip of the needle, our final model of PqiB is ~230 Å long, similar to the length of YebT and the ~225 Å distance between the IM and OM. In MlaD, this helical bundle forms part of the central pore and is lined with hydrophobic residues. While we were unable to model the sequence of the PqiB helices explicitly due to lower local resolution of the density, these C-terminal helices are amphipathic along their entire length, which may result in an inward-facing hydrophobic surface in the lumen of the needle and an outward-facing hydrophilic surface on the needle exterior. Thus, both PqiB and YebT are poised to serve as direct conduits for the transport of lipids or other hydrophobic molecules directly across the periplasm, without the need for a soluble carrier protein like MlaC.
DISCUSSION
Model for lipid transport by MCE systems
These structural data allow us to generate a model for how MCE transport systems traffic lipids across the periplasm (Figure 7). We present this model in the context of lipid import to the IM, for which there is some evidence (Malinverni and Silhavy, 2009). However, as the direction of transport has not been absolutely established, these systems could, in principle, also drive lipid export towards the OM, with the steps outlined occurring in the reverse order. In the case of the Mla system, lipids for import are extracted from the OM by the MlaA-OmpC/OmpF complex. This could occur via a lateral pathway into the membrane through the opening of the β-barrel structure of OmpC/OmpF, as has been proposed for the LptD subunit of the LPS transporter, or perhaps by another mechanism. Binding of MlaC to the lipid-bound MlaA-OmpC/OmpF complex results in lipid transfer to the hydrophobic pocket of MlaC, where it is protected from solvent. Lipid-bound MlaC can then diffuse across the periplasm to the MlaFEDB complex in the IM, where ATP hydrolysis may facilitate extraction of the lipid from MlaC and/or the translocation of the lipid into the IM. In this model, the function of MlaC is reminiscent of the structurally unrelated protein LolA from the Lol pathway, which acts as a chaperon to sequester lipid modifications on nascent lipoproteins during the transport of across the periplasm to the OM (Konovalova and Silhavy, 2015). In contrast, the segmented tubes formed by YebT and the syringe-like architecture of PqiB are poised to bridge the gap between the IM and OM directly, forming a continuous lipid translocation pathway that transverses the entire periplasmic space without the need for a soluble lipid carrier protein analogous to MlaC (Figure 7). This is more similar to the model proposed for the transport of the other major lipid component of the OM, LPS, which is trafficked across a periplasm-spanning bridge comprised of the LptA, LptC, and LptD proteins (Figure 7) (Okuda et al., 2012; Ruiz et al., 2008; Sperandeo et al., 2007, 2008; Suits et al., 2008; Tefsen et al., 2005; Wu et al., 2006). However, unlike the open groove utilized by the LPS transport system, we propose that MCE transporters translocate lipids through a closed channel formed by the pores of multiple stacked MCE rings (e.g., YebT), or a combination of rings and a hollow, needle-like projection formed by long C-terminal helices (e.g., PqiB, and the MCE proteins from M. tuberculosis and chloroplasts; Figure S7B and S7C). Indeed, this strategy for lipid transport is mechanistically similar to the approach employed by bacterial efflux pumps such as the AcrA/AcrB/TolC system, which create a periplasm-spanning tunnel to transport hydrophobic antibiotics, dyes, and other toxic molecules across the periplasm to the exterior of the cell (Du et al., 2014), though efflux pumps and MCE transporters appear to have evolved independently.
Figure 7. Model for MCE-mediated phospholipid transport across the periplasm in E. coli.
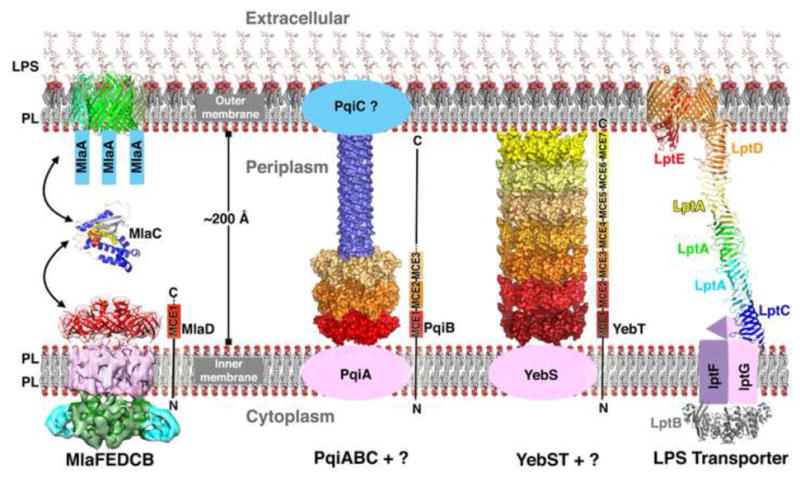
Left, model for the Mla lipid transport system. MlaC likely serves as a soluble lipid carrier protein to transport lipids between the OM MlaA-OmpC/OmpF complex and the IM MlaFEDB complex. Middle left, PqiB may interact with OM lipoprotein PqiC and IM protein PqiA to mediate periplasmic lipid transport. Middle right, YebT may associate with YebS in the IM as part of a larger transport complex. Right, model of LPS transport system based on other studies (see references in text), which has also been suggested to form a bridge for LPS transport across the periplasm using a structurally unrelated framework.
Open questions
A major unresolved issue is the directionality of lipid transport. In the case of LPS transport, the IM LptBFG complex uses ATP hydrolysis to extract LPS molecules from the IM and transport them through the LptACD bridge to the OM. It is conceivable that the Mla, Pqi, and Yeb systems may function in a similar way, using ATP hydrolysis to drive phospholipid export to create new membrane as the cell grows, perhaps in conjunction with other transport mechanisms. Alternatively, MCE systems may be involved in retrograde transport of mislocalized phospholipids from the OM to the IM (Chong et al., 2015; Malinverni and Silhavy, 2009; Sutterlin et al., 2016; Thong et al., 2016), or for the import of other hydrophobic molecules to be used for energy (Klepp et al., 2012; Mohn et al., 2008; Pandey and Sassetti, 2008) or as precursors in biosynthetic processes (Awai et al., 2006; Roston et al., 2011, 2012, Xu et al., 2003, 2008). Indeed, transport per se remains to be demonstrated experimentally, and has thus far been inferred based upon lipid binding activity of MCE proteins, changes in lipid localization in MCE mutant bacteria and plants, and the ABC transporter-like set of components shared by many systems.
There is still a great deal that we don’t understand about the components of MCE transporters and how they function together. Based on our understanding of the Mla system, it is likely that the periplasm spanning components YebT and PqiB will link proteins in the IM and OM to facilitate transport of their substrates. A small lipoprotein encoded immediately downstream from pqiB, called PqiC (aka, YmbA), may serve a similar role as MlaA, and form part of an OM complex that interacts with PqiB, though no homologous gene is present in the yeb operon. Similarly, the predicted integral membrane proteins YebS and PqiA may form part of IM complexes for each system, though ATPase genes are lacking from both the yeb and pqi operons. While the corresponding ATPase subunits may be be encoded elsewhere in the genome, genetic evidence suggests that the MlaF ATPase is not shared between all three systems (Figure S1D). We also cannot rule out the possibility that the Yeb and Pqi systems may be driven by proton motive force, or even facilitate passive equilibration of lipids between the IM and OM rather than active transport. Further studies will be required to identify additional components that may function together with YebST and PqiABC.
Finally, MCE systems exhibit great diversity within and across species, and understanding the common themes as well as differences will be of great interest. For example, in mycobacterial species such as M. tuberculosis, six distinct MCE genes are usually grouped together in an operon (Figure S7A)(Casali and Riley, 2007), instead of a single MCE gene as in most other species. It is unclear whether the resulting MCE proteins function together or independantly, though the hexameric organization of the E. coli MCE proteins suggests that mycobacterial MCE proteins in may form hetero-hexamers. It also remains unclear why M. tuberculosis, E. coli, and many other organisms encode multiple MCE systems. While they may serve partially redundant roles, their very distinct structures suggest they may have distinct substrate specificities, transport lipids in different directions, or might be subject to unique regulatory control. Certain MCE genes, namely mce1a in M. tuberculosis (Arruda et al., 1993) and MAM7 in V. parahaemolyticus (Krachler et al., 2011) have been proposed to function as adhesion factors and to play a role in attachment to other cells, and it is possible that some MCE proteins have evolved other functions apart from lipid transport. However, subsequent studies on mce1a and the larger mce1 gene cluster have revealed that mutations result in altered OM lipid composition (Cantrell et al., 2013) and defects in lipid trafficking (Pandey and Sassetti, 2008). Therefore, mce1a also likely plays a functional role in lipid transport. Intriguingly, despite the fact that MCE proteins are almost universally conserved from double-membraned bacteria to chloroplasts, we have been unable to identify homologs in mitochondria, and it is unclear if this reflects extreme drift of the protein sequences in the ~1 billion years since the divergence of bacteria and mitochondria, or if they have been functionally replaced during the domestication of this organelle. Future studies will begin to unravel these and other questions to further understand the assembly and maintenance of the OMs of bacteria and organelles.
STAR METHODS
CONTACT FOR REAGENT AND RESOURCE SHARING
Further information and requests for resources and reagents should be directed to and will be fulfilled by the Lead Contact, Damian Ekiert (damian.ekiert@med.nyu.edu).
EXPERIMENTAL MODEL AND SUBJECT DETAILS
E. coli was used as a model organism. MG1655 and BW25113 were used as a representative wild-type strains, and all deletion strains were constructed in these backgrounds. Mutant strains were constructed by P1 transduction of Kanamycin resistance-marked alleles from an appropriate strain from the Keio collection. SDS+EDTA sensitivity was assayed in LB agar supplemented with 0.5% SDS and 1.25 mM EDTA. For complementation experiments, E. coli mutants with deletions in mla genes were transformed with a pBAD-derived plasmid (Invitrogen) encoding the WT MlaFEDCB operon, of the operon with the indicated mutations. Serial dilutions of the resulting strains where spotted (2 uL each) on plates containing LB agar or LB agar supplemented with 0.5% SDS and 1.25 mM EDTA, and incubated for 2 days. Residues lining the hydrophobic pore were mutated to Asn (changing hydrophobic to non-charged but polar), and small deletions were introduced into the β5-β6 loop to widen the pore. A C-terminal truncation removes most of the hydrophobic pore-lining residues, while maintaining the overall structure of the MlaD core domain.
METHOD DETAILS
Lipid binding assay and thin-layer chromatography
The periplasmic domains of mlaD, pqiB and yebT from E. coli K-12 MG1655 were cloned into expression vector pET22b (+). The constructs were transformed into the expression strain E. coli BL21 DE3. One liter of cells were grown to an OD600 of 0.6 and induced with 1 mM IPTG overnight at 18°C. The cells were pelleted and re-suspended in 50 ml of binding buffer (50mM NaPO4 pH 7, 500 mM NaCl and 50mM imidazole) and lysed using an Emulsiflex-C3 cell disrupter. To pellet unbroken cells the suspension was centrifuged at 17400 g for 20 min at 4°C. The supernatant was bound to a 5 ml HisTrap column (GE healthcare) overnight, using a peristaltic pump. After binding, the column was washed twice using binding buffer (5× column volume). The protein was eluted in elution buffer (50 mM NaPO4 pH 7, 500 mM NaCl and 500 mM imidazole). The elution was concentrated and separated on a Superdex 200 10/300 GL column gel filtration column using the ÄKTA Pure chromatography system in 50 mM NaPO4 pH 7 and 200 mM NaCl.
To extract lipid, 2 ml of chloroform and 1 ml of methanol was added to 2 ml of 1 mg/ml protein (or buffer only) in a glass tube. The mixture was vortexed for 2 minutes and incubated at 50°C for 30 minutes. After incubation, the mixture was vortexed for a further 2 minutes and centrifuged at 1000 RPM for 10 minutes in an IEC tabletop centrifuge forming a two-phase system (top=aqueous, bottom=organic). The lower phase was collected using a glass Pasteur pipette and transferred to a fresh glass tube. The tubes were placed in a heat block at 100°C without lids until all liquid had evaporated. The lipids were re-dissolved in 200 μl of chloroform.
TLC plates (Silica gel 60 – Merck Millipore) were cut to 10 cm in length and a width that allowed 1 cm between each sample. A total of 10 μl of each sample was loaded with 5 μl glass microcapillary tubes (Sigma Aldrich) 1 cm from the bottom of the TLC plate. The plate was placed in a solvent system designed for separation of phospholipids by head group polarity: 65:25:4 chloroform: methanol: water. The silica plate remained in the solvent until the solvent front was ~1 cm from the top of the plate. The plate was left to dry thoroughly for 30 minutes and stained with phosphomolybdic acid. The stained plated was heated with a hair-dryer to activate the phosphomolybdic acid until lipid species became visible.
For identification of lipid species, two plates were run side by side. One was stained to identify the location of the lipids and one remained unstained for mass spectrometry. The unstained TLC was sent to the Centre for Chemical and Materials Analysis, School of Chemistry, University of Birmingham for identification of the lipids species by mass spectrometry. The masses were analysed directly from the TLC plates using the combined Plate ExpressTM and expression® compact mass spectrometer system from Advion. PE, PG and CL standards were also analyzed alongside to aid with identification of the masses.
TEM of E. coli outer membrane
Overnight cultures of MG1655 and mutant strains were diluted 1:100 in LB and grown with shaking at 37°C until an OD600 of ~0.7. 3μl of culture was spotted onto an electron microscopy grid (Quantifoil 2/2 holey films with 2 μM holes), and cells allowed to attach for ~30 seconds. The grid was blotted for 20 seconds and then plunge frozen in liquid ethane using an FEI Vitrobot Mark III. The grids were imaged using a FEI Polara microscope operating at 300keV, and equipped with a Gatan energy filter and K2 camera. UCSF tomography software was used to collect images of the wild-type and mutant cells.
Ethidium bromide uptake assays
Three biological replicates of each strain were grown overnight at 37°C and used to inoculate fresh cultures (1:100). The cultures were grown to an OD600 of 0.6 and 1 ml of cells were pelleted at 5000 g for 5 min and washed twice with 1 ml of phosphate buffered saline (PBS). The OD600 of the suspensions was adjusted to 0.1 in PBS. 176 μl of each suspension was added to a 96 well plate (black, flat-bottomed) with two technical replicates, alongside wells containing 176 μl PBS only. 4 μl of 500 μM carbonyl cyanide-m-chlorophenyl hydrazine (CCCP) was added to each well to reach a final concentration of 10 μM and incubated at room temperature for 10 mins. The plate was added to a FLUOstar Omega (BMG LABTECH), pre-set to 37°C and 20 μl of 60 μg/ml ethidium bromide was added with an auto injector to a final concentration of 6 μg/ml. Fluorescence readings were taken at regular intervals over 30 minutes from the top of the wells, with an excitation filter of 515 nm and an emission filter of 600 nm. For analysis, the mean value for PBS only was subtracted from the mean fluorescence value for each biological replicate. The experiment was repeated 5 times with 3 biological replicates in each run.
Expression and purification of MlaD
DNA corresponding to the “periplasmic domain” (residues 32–183) and “core MCE domain” (residues 32–140) of MlaD was amplified from the MG1655 genome and cloned by Gibson assembly into a custom pET vector (pBE1092) resulting in an N-terminal 6xHis tag followed by a TEV protease cleavage site just upstream of MlaD. The resulting plasmids (pBE1160 and pBE1161, respectively) were transformed into Rosetta 2 (DE3) cells (Novagen). For expression, overnight cultures of Rosetta 2 (DE3)/pBE1160 or Rosetta 2 (DE3)/pBE1161 were grown at 37° C with shaking to an OD600 of ~0.9, then induced by addition of IPTG to a final concentration of 1 mM and continued incubation overnight shaking at 15° C. Cultures were harvested by centrifugation, and pellets were resuspended in lysis buffer (50 mM Tris pH 8.0, 300 mM NaCl, 10 mM imidazole). Cells were lysed by two passes through an Emulsiflex-C3 cell disruptor (Avestin), then centrifuged at 38,000g to pellet cell debris. The clarified lysates were incubated with NiNTA resin (Qiagen) at 4° C, which was subsequently washed with Ni Wash Buffer (50 mM Tris pH 8.0, 300 mM NaCl, 10 mM imidazole) and bound proteins eluted with Ni Elution Buffer (50 mM Tris pH 8.0, 300 mM NaCl, 250 mM imidazole). MlaD containing fractions eluted from the NiNTA column were pooled and concentrated before separation on a Superdex 200 gel filtration column (GE Healthcare) equilibrated in 20 mM Tris pH 8.0 and 150 mM NaCl.
Crystallization and structure determination of MlaD
Gel filtration fractions containing purified MlaD proteins were concentrated to 20–60 mg/mL and sitting drop, vapor-diffusion crystallization trials were conducted using the JCSG Core I-IV screens (Qiagen). Crystals of the core MCE domain of MlaD (residues 32–140) grew from drops consisting of 100 nL protein plus 100 nL of a reservoir solution consisting of 0.1 M sodium acetate pH 4.5, and 40% 1,2 propanediol, and were cryoprotected by supplementing the reservoir solution with 25% ethylene glycol. Native diffraction data was collected at ALS beamline 8.3.1, and indexed to C2 and reduced using XDS (Table S1) (Kabsch, 2010).
As MlaD has no homology to proteins of known structure, and has no Met residues in the core MCE domain, we set out to generate a panel of single mutants in which each Leu residue of the core domain was converted to Met (Leu42Met, Leu52Met, Leu73Met, Leu79Met, Leu84Met, Leu99Met, Leu106Met, Leu107Met, Leu112Met, Leu114Met, Leu123Met, and Leu128Met). Of these 12 target mutants, we successfully generated 11 by site directed mutagenesis (reaction for Leu73Met failed). Test expressions revealed that 5 of these 11 mutants expressed at near wild-type levels (Leu79Met, Leu84Met, Leu106Met, Leu107Met, Leu123Met). We then prepared selenomethionine-derivatived protein for each of these five mutants and screened for diffraction-quality crystals, which were obtained for 4 of the 5 mutants. Multi-wavelength anomalous dispersion (MAD) datasets were collected from selenomethionine-derivatived crystals of the Leu84Met and Leu107Met mutants at ALS beamline 8.3.1. Anomalous signal from the Leu107Met crystals was weak despite high data quality and strong Se signal in X-ray fluorescence scans, and later this residue was found to be at the tip of a flexible/partially disordered loop. However, Leu84Met yielded a high quality data set, which was indexed to C2 and reduced using XDS (Kabsch, 2010), and phased by MAD using the SHELX C/D/E pipeline (Sheldrick, 2010) (Table S1 and S2). The polyalanine model from SHELXE was rebuild using the Autobuild module of Phenix (Adams et al., 2010). The resulting model was adjusted in Coot (Emsley et al., 2010) and refined using Phenix (Adams et al., 2010). The final model consists of 7 copies of the MCE domain forming a hepatmeric ring.
Crystals of the complete MlaD periplasmic domain (residues 32–183) grew from drops consisting of 100 nL protein plus 100 nL of a reservoir solution consisting of 0.2 M zinc acetate, 0.1 M MES pH 6.0, and 15% ethanol, and were cryoprotected by supplementing the reservoir solution with 20% ethylene glycol. Native diffraction data was collected at ALS beamline 8.3.1, and indexed to C2 and reduced using XDS (Table S1) (Kabsch, 2010). This data set was phased by molecular replacement using Phaser (McCoy et al., 2007), with the MlaD core MCE domain as a search model. The resulting model was adjusted in Coot (Emsley et al., 2010) and refined using Phenix (Adams et al., 2010). This final model consists of 3 copies of the MlaD periplasmic domain. Application of the 2-fold symmetry operator results in the biologically relevant hexameric ring.
Purification of the MlaFEDB complex
DNA corresponding to the complete mlaFEDCB operon (from MlaF start codon to MlaB stop codon) was amplified from the MG1655 genome and cloned by Gibson assembly into a custom pET vector (pDCE587) resulting in an C-terminal 6xHis tag. The resulting plasmid (pBE1200) was transformed into Rosetta 2 (DE3) cells (Novagen). For expression, overnight cultures of Rosetta 2 (DE3)/pBE1200 were grown at 37° C with shaking to an OD600 of ~0.9, then induced by addition of IPTG to a final concentration of 1 mM and continued incubation for ~4hr shaking at 37° C. Cultures were harvested by centrifugation, and pellets were resuspended in lysis buffer (50 mM Tris pH 8.0, 300 mM NaCl, 10 mM imidazole). Cells were lysed by two passes through an Emulsiflex-C3 cell disruptor (Avestin), then centrifuged at 35,000g to pellet cell debris. The clarified lysates were transferred to ultracentrifuge tubes and centrifuged at 200,000g to pellet membrane fraction. Membrane pellets were resuspended in lysis buffer, then n-Dodecyl-β-D-Maltopyranoside (DDM; Anatrace) was added to a final concentration of 25 mM. After incubation for ~1hr with rocking at 4° C, the DDM solublized membrane fraction was centrifuged at 200,000g. The supernatants were loaded onto a NiNTA column (Qiagen) at 4° C, which was subsequently washed with Ni Wash Buffer (50 mM Tris pH 8.0, 300 mM NaCl, 10 mM imidazole, 10% glycerol, 0.5 mM DDM) and bound proteins eluted with Ni Elution Buffer (50 mM Tris pH 8.0, 300 mM NaCl, 250 mM imidazole, 10% glycerol, 0.5 mM DDM). Eluate from the NiNTA column was concentrated before separation on a Superdex 200 gel filtration column (GE Healthcare) equilibrated in 20 mM Tris pH 8.0, 150 mM NaCl, 10% glycerol, and 0.5 mM DDM. SDS-PAGE analysis of the resulting sample revealed the presence of four proteins, which were confirmed by trypsin digestion and tandem mass spectrometry (MS/MS) to be MlaF, MlaE, MlaD and MlaB. Only MlaC was not detected. Samples were not boiled before loading on SDS-PAGE to prevent aggregation of membrane proteins, so apparent molecular weight of protein bands are unreliable (e.g., in Fig. 3C). For cryo-EM, the sample in DDM was exchanged into amphipol A8-35 prior to size exclusion chromatography. Briefly, protein at ~1mg/mL was incubated for ~5 hours with 3-fold excess by mass of A8-35. Detergent from the buffer was then absorbed by incubation with Bio-Beads (Bio-Rad) overnight at 15 mg Bio-Beads per mL of solution. The sample was filtered to remove Bio-Beads and subjected to size exclusion chromatography using 20 mM Tris pH 8.0, 150 mM NaCl. The protein quality was then assessed by negative stain EM prior to cryo-EM grid preparation.
Expression and purification of PqiB
DNA corresponding to mature, signal peptide-cleaved PqiB (residues 39–546) was amplified from the MG1655 genome and cloned by Gibson assembly into a custom pET vector (pBE1092) resulting in an N-terminal 6xHis tag and TEV protease cleavage site. The resulting plasmid (pBE1163) was transformed into Rosetta 2 (DE3) cells (Novagen). For expression, overnight cultures of Rosetta 2 (DE3)/pBE1163 were grown at 37° C with shaking to an OD600 of ~0.9, then induced by addition of IPTG to a final concentration of 1 mM and continued incubation overnight shaking at 15° C. Cultures were harvested by centrifugation, and pellets were resuspended in lysis buffer (50 mM Tris pH 8.0, 300 mM NaCl, 10 mM imidazole). Cells were lysed by two passes through an Emulsiflex-C3 cell disruptor (Avestin), then centrifuged at 38,000g to pellet cell debris. The clarified lysates were incubated with NiNTA resin (Qiagen) at 4° C, which was subsequently washed with Ni Wash Buffer (50 mM Tris pH 8.0, 300 mM NaCl, 10 mM imidazole) and bound proteins eluted with Ni Elution Buffer (50 mM Tris pH 8.0, 300 mM NaCl, 250 mM imidazole). PqiB containing fractions eluted from the NiNTA column were pooled and concentrated before separation on a Superdex 200 gel filtration column (GE Healthcare) equilibrated in 20 mM Tris pH 8.0 and 150 mM NaCl.
Expression and purification of YebT
DNA encoding the yebST operon was amplified from the MG1655 genome and cloned by Gibson assembly into pBAD-His resulting in a bicistronic YebS-YebT co-expression construct with a C-terminal 6xHis tag on YebT. The resulting plasmid (pBE1287) was transformed into Rosetta 2 (DE3) cells (Novagen). Expression and purification were carried out as described for PqiB above. Though this construct co-expresses YebS and YebT, only significant amounts of full-length YebT were obtained under our expression conditions.
Electron microscopy (EM) data collection
Negative stain EM data
To prepare grids for negative stain EM, sample after size exclusion chromatography was applied to a freshly glow discharged carbon coated 400 mesh copper grids and blotted off. Immediately after blotting, a 2% uranyl formate solution was applied for staining and blotted off. The stain was applied five times per sample. Samples were allowed to air dry before imaging. Data were collected on a Tecnai T12 microscope (FEI) equipped with a 4K × 4K CCD camera (UltraScan 4000, Gatan) at a nominal magnification of 52,000 corresponding to a pixel size of 2.21 Å2/pixel on the specimen, and a defocus range of 1 – 1.7 uM underfocus.
Cryo EM of MlaFEDB
For cryo-EM, 3μL of MlaFEDB complex at a concentration of ~1 mg/mL and containing amphipol A8-35 was applied to quantifoil holey carbon grids (1.2/1.3, 400 mesh). Grids were blotted for 6 s at 4°C and plunge frozen in liquid ethane using a Vitrobot Mark III. Cryo-EM images were collected on a Titan Krios, FEI company (Janelia Research Campus, “Krios 2”) operated at 300 kV and equipped with a K2 Summit direct electron detector camera (Gatan). Images were recorded using super-resolution counting mode following an established protocol (Li et al., 2013). Specifically, images were recorded at a nominal magnification of 20,000 x, corresponding to a calibrated super-resolution pixel size of 1.02 Å on the specimen and 0.51 Å for super-resolution images. The dose rate on the camera was set to be ~8 counts (corresponding to ~9.9 electron) per physical pixel per second. The total exposure time was 6 s, leading to a total accumulated dose of 41 electrons per Å2 on the specimen. Each image was fractionated into 30 subframes, each with an accumulation time of 0.2 s per frame. All dose-fractionated cryo-EM images were recorded using SerialEM (Mastronarde, 2005). Images were recorded with a defocus in the range from 1.5 to 3.0 μm.
Cryo EM of PqiB
For cryoEM, PqiB protein at a concentration of ~0.8 mg/mL was used. Although this is a soluble construct, 0.1 mg/mL amphipol A8-35 was added prior to freezing the grids. 3ML of sample was applied to quantifoil holey carbon grids (1.2/1.3, 400 mesh). Grids were blotted for 6 s at 4°C and plunge frozen in liquid ethane using a Vitrobot Mark III. Cryo-EM images were collected on a Titan Krios, FEI company (Janelia Research Campus, “Krios 2”) operated at 300 kV and equipped with a K2 Summit direct electron detector camera (Gatan). Data collection was carried out using SerialEM. Images were recorded at a nominal magnification of 22,500 x, corresponding to a super-resolution pixel size of 1.31 Å on the specimen and 0.655 Å for super-resolution images. The rate on the camera was set at 10 electrons per pixel per second. Each image was fractionated into 50 frames with an exposure of 280 ms/frame, resulting in a total exposure time of 14 seconds and a total dose of ~80 electrons/Å2. A total of ~1700 images were recorded during an ~2-day period with a defocus range of 0.8 to 2.0 μm.
EM Data processing
Negative stain EM data
Images were binned, resulting in a pixel size of 4.42 Å2/pixel. Particles were picked automatically using template-based picking. Simplified Application Managing Utilities for EM Labs (SAMUEL, http://liao.hms.harvard.edu/samuel) scripts were used for image preprocessing, particle picking and 2D classification, as described by Ru et al in the Supplemental Experimental Procedures section of their publication (Ru et al., 2015).
After a satisfactory stack of particles were obtained, an initial model was obtained using the software simple 2.0 (Elmlund and Elmlund, 2012; Elmlund et al., 2013). 3D classification was performed on the stack in RELION (Scheres, 2012b, 2012a) using the initial model generated from simple 2.0 filtered to 50 Å as an initial model. The data were divided into 4 classes, and each resulting class was refined using the auto-refine procedure in RELION.
Cryo EM processing of MlaFEDB
Images were binned, resulting in a pixel size of 3.03 Å2/pixel for cryo-EM data of the MlaFEDB complex. Particles were picked automatically using template-based picking. Simplified Application Managing Utilities for EM Labs (SAMUEL, http://liao.hms.harvard.edu/samuel) scripts were used for image preprocessing, particle picking and 2D classification, as described by Ru et al in Supplemental Experimental Procedures (Ru et al., 2015). After a satisfactory stack of particles were obtained, 2D classification was also carried out in RELION. The resulting stack of particles was subjected to iterative 3D classification and the auto-refine procedure in RELION until the most homogeneous set of particles was obtained. Some compositional heterogeneity was present, which resulted in a large amount of top views of MlaD alone (not in complex with MlaE, F and B). These particles were separated out early in procedure. The remaining particles of the MlaFEDB complex also contain conformational heterogeneity, and possible compositional heterogeneity with respect to the bound nucleotide, as the nucleotide state was not controlled in this dataset. No exogenous ATP, ADP or ATP analog was added, so we expect the sample to be largely in the “apo” state. However, it is possible that endogenous nucleotide may be bound in some particles. Regardless, the orientation between the permease subunit (MlaE), the ATP-binding domains (MlaF) and the potential regulatory subunits (MlaB) shows some flexibility. Therefore, while several 2D classes show detailed features, these are lost in the 3D reconstruction, even after 3D classification. Likely a much larger dataset with a more homogenous sample will be required to reach higher resolution and identify the pseudo-atomic details of the complex.
Cryo EM processing of PqiB
Drift correction was carried out using MotionCor2 (Zheng et al., 2016). CTF estimation was performed using the standalone version of Gctf (Zhang, 2016). Particles were picked using Gautomatch (currently unpublished; developed by Zhang K, MRC Laboratory of Molecular Biology, Cambridge, UK, http://www.mrc-lmb.cam.ac.uk/kzhang/Gautomatch/). Briefly, a few hundred particles were picked from ~5 micrographs. Particles were extracted in Relion and 2D classificatoin in Relion (Scheres, 2012b, 2012a) was used for alignment and classification to generate templates for further particle picking. Template-based picking was then carried out on all micrographs using Gautomatch. 2D classification in Relion was used to choose ~357,000 “good” particles, and iterative 3D classification and 3D autorefine were used to generate the final reconstruction. The particles were refined with C6 symmetry as well as no symmetry, which resulted in similar reconstructions, but higher quality maps with imposition of C6 symmetry. More details are shown in Fig. S6E. The protein can roughly be divided into 2 parts: the “barrel” and the “needle” (as described in the main text). As is evident from the 2D classes, the barrel is fairly stable, and tends to drive the alignment, whereas the needle is flexible relative to the barrel. To obtain a better reconstruction for the needle, the box size was increased and particles were re-extracted to include the whole needle, and a mask was applied, either to Ring3 and the needle, or the needle only during refinement. These reconstructions provided additoinal detail for the needle part of PqiB. Post-processing was done in Relion, and using the automask and autoB-factor options usually resulted in the highest quality map. Estimation of local resolution was done using Relion 2.0, using the new option provided in Relion.
Model building and refinement for PqiB
3 copies of the hexameric MlaD ring were docked into the EM density map and fit as rigid bodies in Chimera (Pettersen et al., 2004). Individual domains were then fit as rigid bodies in Coot (Emsley et al., 2010). Regions of poor agreement between the model and map were pruned and then refined using phenix.real_space_refine (Adams et al., 2010). The PqiB backbone model was rebuilt and the sequence register assigned by manual inspection of the EM density map in Coot (Emsley et al., 2010), along sequence and structural alignments to MlaD. Additional density for the C-terminal helical region was fit manually using idealized α-helices. The final model was refined using phenix.real_space_refine (Adams et al., 2010) against 2 different EM density maps: one masked over the entire model, which provided the best resolution of the PqiB barrel, and a second map masked on the MCE3 ring and needle, which yielded the highest quality maps for the needle.
Needle
While the positions and overall twist of the C-terminal helices was readily apparent in our maps, the lower local resolution in this area precluded the assignment of the sequence register within the needle. Consequently, these regions have only been modeled as poly-alanine.
18-stranded β-barrel lining interior of PqiB barrel
Considering only the packing of the core MCE domains in PqiB, large holes between subunits would allow for solvent and some small molecules to diffuse in and out of the PqiB barrel. However, in the regions where these holes exist (between the MCE1 and MCE2 rings; and between the MCE2 and MCE3 rings), our EM maps reveal that the interior of the barrel is lined with 18 tubes of density that run roughly parallel to the long/sixfold axis of PqiB. These densities exhibit the characteristic “pleated” shape of β-strands, with spacing between tubes of density consistent with a curved β-sheet, suggesting that the 18 densities correspond to an 18-stranded β-barrel that seals the gaps between the MCE rings. Consistent with this, densities resembling side chains protrude off from the strands, alternating between the lumenal and exterior faces of the barrel. In both parts of the structure lined by these 18 densities (between the MCE1 and MCE2 rings; and between the MCE2 and MCE3 rings), twelve of the eighteen β-strands, two from each of the 6 subunits in the ring, can be modeled as a β-hairpin emanating from the β5-β6 loops in the MCE1 and MCE2 domains of PqiB, which are much longer than the corresponding β5-β6 loop of MlaD of the MCE3 domain of PqiB. In the remaining 6 β-strand densities lining the pore, we have built polyalanine models, as we are currently unable to determine where these residues lie within the primary sequence, or if they may be derived from another polypeptide co-purifying with PqiB. Indeed, 3D classification applied during the reconstruction of PqiB yielded two major classes that differed primarily in the presence or absence of strong density for this 18-stranded β-barrel, and it is possible that the 3D class with poor density in this region is missing an a polypeptide the contributes the remaining 6 strands and thereby stabilizes the pore lining. Future work and likely higher resolution structures will be needed to resolve this ambiguity.
Identification of inter-subunit restraints in MlaFEDB complex using co-evolving residue pairs
A multiple sequence alignment was generate using HHblits (Remmert et al., 2012) with UniProt database from 2015_06 for each of the Mla components. To prevent paralogous copies of each genes from corrupting the final alignments, stringent e-values were used. For MlaE, MlaF and MlaD evalues of 1E-20, 1E-40 and 1E-20 were used respectfully. The joint alignment was restricted to genes found within the same operon (maximum of two genes apart in the same contig). The genomic distance was determined by mapping the UniProt IDs back to their respective contiguous sequences from the ENA database. The alignments were then filtered to remove sequences that don’t cover at least 75 % of the query, positions that have more than 50% gaps and redundancy was reduced to 90%. GREMLIN was then run with default parameters to predict the top inter-co-evolving residue pairs (Ovchinnikov et al., 2014). Residue pairs with predicted probability of 80% or higher are shown in Figures S3C and S3D mapped on the model structures.
The previously predicted structure of MlaE dimer (Ovchinnikov et al., 2015) was refined using the rosetta hybrid protocol (Song et al., 2013) in context of MlaF dimer and co-evolution restraints. The MlaF dimer was modeled using outward-facing Maltose/maltodextrin import ATP-binding protein MalK conformation [3RLF].
Expression and purification of MlaC
DNA corresponding to mature, signal peptide-cleaved MlaC (residues 22–211) was amplified from the MG1655 genome and cloned by Gibson assembly into a custom pET vector (pBE1092) resulting in an N-terminal 6xHis tag and TEV protease cleavage site. The resulting plasmid (pBE1203) was transformed into Rosetta 2 (DE3) cells (Novagen). For expression, overnight cultures of Rosetta 2 (DE3)/pBE1203 were grown at 37° C with shaking to an OD600 of ~0.9, then induced by addition of IPTG to a final concentration of 1 mM and continued incubation overnight shaking at 15° C. Cultures were harvested by centrifugation, and pellets were resuspended in lysis buffer (50 mM Tris pH 8.0, 300 mM NaCl, 10 mM imidazole). Cells were lysed by two passes through an Emulsiflex-C3 cell disruptor (Avestin), then centrifuged at 38,000g to pellet cell debris. The clarified lysates were incubated with NiNTA resin (Qiagen) at 4° C, which was subsequently washed with Ni Wash Buffer (50 mM Tris pH 8.0, 300 mM NaCl, 10 mM imidazole) and bound proteins eluted with Ni Elution Buffer (50 mM Tris pH 8.0, 300 mM NaCl, 250 mM imidazole). MlaC containing fractions eluted from the NiNTA column were pooled and concentrated before separation on a Superdex 200 gel filtration column (GE Healthcare) equilibrated in 20 mM Tris pH 8.0 and 150 mM NaCl.
Crystallization and structure determination of MlaC
Gel filtration fractions containing purified MlaC proteins were concentrated to 10–60 mg/mL and sitting drop, vapor-diffusion crystallization trials were conducted using the JCSG Core I-IV screens (Qiagen). Crystals of MlaC grew from drops consisting of 100 nL protein plus 100 nL of a reservoir solution consisting of 0.1 M citric acid pH 3.5 and 1.6 M ammonium sulfate, and were cryoprotected by supplementing the reservoir solution with 37.5% ethylene glycol. Native diffraction data was collected at ALS beamline 8.3.1, and indexed to P212121 and reduced using XDS (Table S1) (Kabsch, 2010). The structure was phased by molecular replacement using Phaser (McCoy et al., 2007). Initial attempts to use the crystal structures of MlaC homologs as search models (PDB IDs: 2QGU and 4FCZ) were unsuccessful. However, we were able to obtain a few clear solutions using the following approach. We created a homology model of MlaC with Phyre2 (Kelley et al., 2015), based on 2QGU as a template. This homology model rebuilt using MR-Rosetta (DiMaio et al., 2011), and the resulting 1000 rebuilt models were tested as search models using Phaser (McCoy et al., 2007). A small number of these models gave clear solutions, which were adjusted in Coot (Emsley et al., 2010) and refined using Phenix (Adams et al., 2010). In the later stages of refinement, two phosphatidic acid molecules were built into clearly defined electron density in the core of each of the two MlaC monomers in the asymmetric unit.
Expression and purification of MlaA-OmpF complex
DNA corresponding to mature, signal peptide-cleaved MlaA (residues 1–251) was amplified from the MG1655 genome and cloned by Gibson assembly into a custom pET vector (pDCE587) resulting in an C-terminal 6xHis tag. The resulting plasmid (pBE1242) was transformed into Rosetta 2 (DE3) cells (Novagen). For expression, overnight cultures of Rosetta 2 (DE3)/pBE1242 were grown at 37° C with shaking to an OD600 of ~0.9, then induced by addition of IPTG to a final concentration of 1 mM and continued incubation for ~4hr shaking at 15° C. Cultures were harvested by centrifugation, and pellets were resuspended in lysis buffer (50 mM Tris pH 8.0, 300 mM NaCl, 10 mM imidazole, 10% glycerol). Cells were lysed by two passes through an Emulsiflex-C3 cell disruptor (Avestin), then centrifuged at 38,000g to pellet cell debris. The clarified lysates transferred to ultracentrifuge tubes and centrifuged at 200,000g to pellet membrane fraction. Membrane pellets were resuspended in lysis buffer by sonication, then n-Dodecyl-β-D-Maltopyranoside (DDM; Anatrace) was added to a final concentration of 25 mM. After incubation for 1hr with rocking at 4° C, the DDM solublized membrane fraction was centrifuged at 200,000g. The supernatants were loaded onto a NiNTA column (Qiagen) at 4° C, which was subsequently washed with Ni Wash Buffer (50 mM Tris pH 8.0, 300 mM NaCl, 10 mM imidazole, 10% glycerol, 0.5 mM DDM) and bound proteins eluted with Ni Elution Buffer (50 mM Tris pH 8.0, 300 mM NaCl, 250 mM imidazole, 10% glycerol, 0.5 mM DDM). MlaA containing fractions eluted from the NiNTA column were pooled and concentrated before separation on a Superdex 200 gel filtration column (GE Healthcare) equilibrated in 20 mM Tris pH 8.0, 150 mM NaCl, 10% glycerol, and 0.5 mM DDM. SDS-PAGE analysis of the resulting sample revealed the presence of two proteins in roughly 1:1 stoichometry, which were confirmed by trypsin digestion and tandem mass spectrometry (MS/MS) to be MlaA and OmpF.
Protein-protein interactions by biolayer interferometry
DNA corresponding to mature, signal peptide-cleaved MlaC (residues 22–211) was amplified from the MG1655 genome and cloned by Gibson assembly into a custom pET vector resulting in an N-terminal 6xHis tag, biotinylation site (amino acid sequence: GGGLNDIFEAQKIEWHE), and TEV protease cleavage site. The resulting plasmid (pBE1230) was transformed into Rosetta 2 (DE3) cells (Novagen), and tagged MlaC was expressed and purified essentially as described above. Purified MlaC at ~2 mg/mL was biotinylated by the addition of 25μg BirA enzyme/mg total protein. The reactions were carried out in the following buffer: 100mM Tris pH 8.0, 10mM ATP, 10mM MgOAc, 50μM biotin. The biotinylation reactions were incubated at 4 °C overnight. Biotinylated MlaC was purified by size exclusion chromatography, and concentrated to ~5–20 mg/mL.
Biotinylated MlaC was diluted to 50 μg/mL in 1× kinetics buffer (1× PBS, pH 7.4, 0.01% BSA, and 0.002% Tween 20) and loaded onto streptavidin coated biosensors (ForteBio) and incubated with varying concentrations of MlaFEDB complex, MlaD, or MlaA-OmpF. All binding data were collected on an Octet RED384 instrument at 25 °C. In each case, an empty sensor (no MlaC loaded) was included as a negative control to test for non-specific interactions of MlaFEDB complex, MlaD, and MlaA-OmpF.
QUANTIFICATION AND STATISTICAL ANALYSIS
Ethidium bromide uptake assay
For analysis, the mean value for PBS only was subtracted from the mean fluorescence value for each biological replicate. The experiment (described in Method Details above) was repeated 5 times with 3 biological replicates in each run. A two-way ANOVA was performed with interactions, using time as a quadratic term, strain (mutant Vs. wild type), and the interaction between the two. F = 92.895, p < 2×10⁻¹⁶.
DATA AND SOFTWARE AVAILABILITY
X-ray and cryo EM structures have been deposited in the PDB and EMDB with the following accession numbers: 5UW8 (MlaD core MCE domain); 5UW2 (MlaD perplasmic domain); 5UWA (MlaC); 5UWB (re-refined coordinates for 4FCZ); 5UVN and EMD-8608 (PqiB cryo EM); EMD-8610 (MlaFEDB complex cryo EM); EMD-8612 (PqiB negative stain EM); EMD-8611 (YebT negative stain EM).
TABLE FOR AUTHOR TO COMPLETE
Please upload the completed table as a separate document. Please do not add subheadings to the Key Resources Table. If you wish to make an entry that does not fall into one of the subheadings below, please contact your handling editor.
KEY RESOURCES TABLE
| REAGENT or RESOURCE | SOURCE | IDENTIFIER |
|---|---|---|
| Bacterial and Virus Strains | ||
| E. coli K-12 MG1655/wild type | Coli Genetic Stock Center | MG1655 |
| E. coli/ΔmlaE ΔpqiA ΔyebS mutant | This work | sBE120 |
| E. coli/ΔmlaE mutant | This work | sBE104 |
| E. coli/ΔmlaD mutant | This work | sBE113 |
| E. coli K-12 BW25113/wild type | This work | N/A |
| Rosetta2 DE3 | Novagen | 71400 |
| E. coli K-12 BW25113 ΔmlaD ΔpqiAB ΔyebST | This work | N/A |
| Chemicals, Peptides, and Recombinant Proteins | ||
| IPTG | Sigma | I6758 |
| imidazole | Sigma | I5513 |
| EDTA | Sigma | ED2SS |
| chloroform | Alfa Aesar | 22920 |
| methanol | Fisher | M/4060/PB17 |
| phosphomolybdic acid | Acros organics | 417895000 |
| carbonyl cyanide-m-chlorophenyl hydrazine | Sigma | C2759 |
| NiNTA resin | Qiagen | 30210 |
| JCSG core I screen | Qiagen | 130924 |
| JCSG core II screen | Qiagen | 130925 |
| JCSG core III screen | Qiagen | 130926 |
| JCSG core IV screen | Qiagen | 130927 |
| DDM | Anatrace | D310S |
| Uranyl formate | Electron microscopy sciences | 22451 |
| DAPI | molecular probes | D1306 |
| Propidium Iodide | molecular probes | P3566 |
| amphipol A8-35 | Anatrace | A835 |
| PE standard | Avanti Lipids | 840027 |
| PG standard | Avanti Lipids | 841188 |
| CL standard | Avanti Lipids | 841199 |
| ethylene glycol | Hampton Research | HR2-621 |
| Seleno-methionine | Chem-impex international | 662 |
| Bio-beads | Biorad | 1523920 |
| Deposited Data | ||
| Crystal structure of MlaD core MCE domain | PDB | 5UW8 |
| Crystal structure of MlaD periplasmic domain | PDB | 5UW2 |
| Crystal structure of MlaC | PDB | 5UWA |
| Re-refined coordinates for 4FCZ | PDB | 5UWB |
| Cryo EM reconstruction for PqiB periplasmic domain | EMDB | EMD-8606 |
| Cryo EM structure for PqiB periplasmic domain | PDB | 5UVN |
| Cryo EM reconstruction for MlaFEDB complex | EMDB | EMD-8610 |
| Negative stain EM reconstruction for PqiB | EMDB | EMD-8612 |
| Negative stain EM reconstruction for YebT | EMDB | EMD-8611 |
| Recombinant DNA | ||
| pET22b(+)-mlaD(Δaa1-28) (MlaD for TLC) | This work | N/A |
| pET22b(+)-pqiB(Δaa1-40) (PqiB for TLC) | This work | N/A |
| pET22b(+)-yebT(Δaa1-40) (YebT for TLC) | This work | N/A |
| Custom pET vector with N-terminal 6xHis tag | This work | pBE1092 |
| Arabinose inducible expression vector | Invitrogen | pBAD-His |
| Custom pET vector with C-terminal 6xHis tag | This work | pDCE587 |
| Expression construct for MlaD(32-183) | This work | pBE1160 |
| Expression construct for MlaD(32-140) | This work | pBE1161 |
| Complementation construct containing MlaFEDCB operon, MlaD mutant L106N/L107N | This work | pBE1326 |
| Complementation construct containing MlaFEDCB operon, MlaD mutant L106N/L107N + 2 residue deletion in B5-6 | This work | pBE1327 |
| Complementation construct containing MlaFEDCB operon, MlaD mutant L106N/L107N + 4 residue deletion in B5-6 | This work | pBE1328 |
| Complementation construct containing MlaFEDCB operon, MlaD mutant C-terminal deletion 141–183 | This work | pBE1330 |
| Complementation construct containing MlaFEDCB operon, MlaD mutant F150 | This work | pBE1329 |
| Expression construct for MlaFEDCB, His-tagged MlaD | This work | pBE1200 |
| Expression construct for MlaC | This work | pBE1203 |
| Expression construct for MlaA | This work | pBE1242 |
| YebT negative stain EM reconstruction | This work | pBE1287 |
| Expression construct for PqiB | This work | pBE1163 |
| Expression construct for PqiB, C-terminally truncated | This work | pBE1222 |
| Expression construct for MlaD(32-140), Leu42Met mutant | This work | pBE1168 |
| Expression construct for MlaD(32-140), Leu52Met mutant | This work | pBE1169 |
| Expression construct for MlaD(32-140), Leu79Met mutant | This work | pBE1171 |
| Expression construct for MlaD(32-140), Leu84Met mutant | This work | pBE1172 |
| Expression construct for MlaD(32-140), Leu99Met mutant | This work | pBE1173 |
| Expression construct for MlaD(32-140), Leu106Met mutant | This work | pBE1174 |
| Expression construct for MlaD(32-140), Leu107Met mutant | This work | pBE1175 |
| Expression construct for MlaD(32-140), Leu112Met mutant | This work | pBE1176 |
| Expression construct for MlaD(32-140), Leu114Met mutant | This work | pBE1177 |
| Expression construct for MlaD(32-140), Leu123Met mutant | This work | pBE1178 |
| Expression construct for MlaD(32-140), Leu128Met mutant | This work | pBE1179 |
| Software and Algorithms | ||
| XDS Package (including XDS, XSCALE, and XDSCONV) | (Kabsch, 2010) | http://xds.mpimf-heidelberg.mpg.de |
| Phaser | (McCoy et al, 2007) | http://www-struct-med.cimr.cam.ac.uk/phaser_obsolete/ |
| SHELX Package (including SHELX C, D, and E) | (Sheldrick, 2010) | http://shelx.uni-ac.gwdg.de/SHELX/ |
| Phenix Package (including phenix.refine, phenix.real_space_refine, phenix.autobuild, phenix.reduce, phenix.reflection_file_converter, phenix.mr_rosetta) | (Adams et al, 2010) | https://www.phenix-online.org |
| Coot | (Emsley, et al, 2010) | https://www2.mrc-lmb.cam.ac.uk/personal/pemsley/coot/ |
| Chimera | (Pettersen et al., 2004) | https://www.cgl.ucsf.edu/chimera/ |
| PyMOL | N/A | https://www.pymol.org/ |
| HHblits | (Remmert et al., 2012) | https://toolkit.tuebingen.mpg.de/hhblits |
| Phyre2 | (Kelley et al., 2015) | www.sbg.bio.ic.ac.uk/phyre2 |
| Simple 2.0 | (Elmlund and Elmlund, 2012; Elmlund et al., 2013) | http://www.simplecryoem.com/2.0/ |
| SAMUEL | N/A | http://liao.hms.harvard.edu/samuel |
| Motioncor2 | Zheng et al, 2016 | http://msg.ucsf.edu/em/software/motioncor2.html |
| Gctf | Zhang, 2016 | http://www.mrc-lmb.cam.ac.uk/kzhang/ |
| Gautomatch | N/A | http://www.mrc-lmb.cam.ac.uk/kzhang/ |
| Relion 1.4 | Scheres, 2012a | https://www2.mrc-lmb.cam.ac.uk/relion/index.php/Download_%26_install |
| UCSF Tomography | N/A | http://www.msg.ucsf.edu/Tomography/tomography_main.html |
| SerialEM | Mastronarde, 2005 | http://bio3d.colorado.edu/SerialEM/ |
| GREMLIN | Ovchinnikov et al., 2014 | http://gremlin.bakerlab.org |
| Other | ||
| Quantifoil grids 2/2 | Quantifoil | N/A |
| Quantifoil grids 1.2/1.3, 400 mesh | Quantifoil | N/A |
| TLC plates | Merck Millipore | 105554 |
| microcapillary tubes | Sigma Aldrich | Z611239 |
| SA biosensors for octet | Pall | 18-5019 |
Supplementary Material
(A) After mixing equal volumes of WT and MCE mutant overnight cultures, mixed cultures were diluted 1:1000 in fresh LB and incubated ~16hr at 37° C with shaking. The fraction of mutant cells (mutant cells divided by total cells) was estimated before and after growth competition by plating dilutions on LB (total cells) and LB+Kan (mutant cells). The ratios presented here represent the change in the fraction of mutant cells between the initial mixed culture and the post-competition culture [(fraction mutant T16hr)/(fraction mutant T0)]. Values above 1 indicate a growth advantage in the mutant, while values below 1 indicate a growth defect in the mutant. For all the mutants, the frequency of mutant cells changed by less than 2-fold between the input and post-competition cultures, suggesting MCE genes are dispensable for in vitro growth in rich media.
(B-D ) After mixing equal volumes of WT and MCE mutant overnight cultures, mixed cultures were diluted 1:1000 in fresh LB+5% SDS (B) or LB+100 mM CaCl2 (C), incubated ~16 hr at 37C with shaking, and analyzed as described above. Addition of 5% SDS or 100 mM CaCl2 had little effect on the growth of any of the single mutants, but dramatically reduces the frequency of the triple mutant.
(E) Live cells growing exponentially in LB were co-stained with DAPI and PI for 30 minutes then imaged. The culture of the triple mutant had more PI-positive cells than the wild-type, though the vast majority of cells in both cultures were PI-negative, indicating that the inner membrane remains intact. DAPI staining of the triple mutant was brighter than the wild-type, with clear nucleoid localization, while the staining of wild-type cells under these conditions was strongest at the cell periphery (cell wall/membrane staining). Consistent with the role of the OM as a barrier to the entry of small molecules into the cell, DAPI entry into WT cells appears to be inefficient, while in the triple mutant the OM is compromised, allowing efficient nucleoid staining.
(F) Results of ethidium bromide uptake assay for WT and ΔmlaE ΔpqiA ΔyebS mutant, showing that in the presence of the efflux blocker CCCP, the ΔmlaD ΔpqiAB ΔyebST mutant takes up significantly more ethidium bromide than the WT (P = 5.5×10⁻⁶, two-way ANOVA). The mean from 15 biological replicates at each binned time point is plotted (5 runs, each with 3 biological replicates) and the error bars represent the standard deviation between the biological replicates.
(G) E. coli strains with mutations in the mla gene cluster (such as ΔmlaE shown here) do not grow on LB plates supplemented with 0.5 % SDS + 1.25 mM EDTA. This defect can be complemented by a plasmid-borne copy of the mlaFEDCB operon under the uninduced/leaky expression from an arabinose inducible promoter.
(H) Similar to (G), showing that the ΔmlaE single mutant and the ΔmlaE ΔpqiA ΔyebS triple mutant have similar phenotypes on LB plates supplemented with 0.5% SDS + 1.25 mM EDTA.
(I) Additional electron micrographs of wild-type E. coli cells (1–9) and cropped/zoomed sections of the IM/OM region (1′-9′, respectively).
(J) Additional electron micrographs of ΔmlaE ΔpqiA ΔyebS mutant E. coli cells (1–9) and cropped/zoomed sections of the IM/OM region (1′-9′, respectively).
(A) Topology diagrams highlighting the differences between the MCE domain and the closest structural neighbors in the PDB.
(B) Initial electron density map for the core MCE domain of MlaD [32–140] after phasing and density modification using SHELX C/D/E pipeline. Map is contoured at 2σ and displayed as a blue mesh. The Cα trace of the final model is shown in red for comparison.
(C) the full-length MlaD ectodomain, which includes an additional ~45 amino acids at the C-terminus that associate to form a helical bundle, forms a single hexameric ring.
(D) in contrast, the core MCE domain forms a tetradecamer, consisting of two rings of seven MCE domains stacked on top of one another with their pores roughly aligned (subunits of upper ring colored, bottom ring gray).
(E) 90° rotated view of the full-length, hexameric MlaD ectodomain.
(F) 90° rotated view of the tetradecameric MlaD core MCE domain, colored as in (B).
(G) 2D class averages from single particle, negative stain electron microscopy are also consistent with a 14 subunit, stacked ring organization for the MCE core domain from MlaD, suggesting that the 14-mer observed in the crystal is also stable in solution. We believe the hexamer is the predominant and perhaps the only functional form in vivo, for three reasons. 1) The complete periplasmic domain crystal structure is hexameric, and it is also hexameric in the context of the larger MlaFEDB complex. Second, PqiB and YebT, two other MCE proteins from E. coli, are only hexameric. Third, the “head-to-head” arrangement of the two stacked rings in the 14-mer places the C-terminal helical bundle from each ring at the interface, resulting in major steric overlap.
(A) Representative raw micrograph of MlaFEDB using a K2 camera.
(B) Gold standard FSC curve of final reconstruction. Horizontal line indicates 0.143 FSC.
(C and D) Location of strongly co-evolving residue pairs in the MlaFEDB complex. (C) Co-evolving residue pairs suggestive of potential contacts between MlaD (left column) and MlaE (right column).
D) Co-evolving residue pairs suggestive of potential contacts between MlaE (left column) and MlaF right column).
(E) Comparison of the de novo model of MlaE with the crystal structure of the permease domain of the ABCG5/ABCG8 transporter structure (PDB code 5DO7). Helices are colored from red to blue from the N-terminus to the C-terminus, indicating the similar fold and topology between these two proteins. An additional N-terminal helix in MlaE that is not found in ABCG5/ABCG8 and additional C-terminal helices in ABCG5/ABCG8 that are not present in MlaE are colored light grey.
(F). Fit of MlaE into TM region density. Extra density likely corresponds to N-terminal helices of MlaD as well as amphipol.
(A), Comparison of MlaC with cystatin and other NTF2 superfamily members. In contrast to cystatins, where a single α-helix (red) packs tightly against one face of the β-sheet, the NTF2 superfamily extends the sheet with 2 additional β-strands while adding two α-helices, creating a hydrophobic pocket between the sheet and helices. MlaC adds several addition helices to this core cystatin/NTF2 fold.
(B), The hydrophobic pocket varies in volume across the diverse members of the NTF2 superfamily, from a modest depression in NTF2 itself that mediates interaction with Ran-GDP (dark blue bars), to a prominent active site cleft in many enzymes where it can accommodate small hydrophobic substrates, such as steroids in the ketosteroid isomerases (green bars). Compared with other members of the NTF2 superfamily, MlaC and the related 2QGU and 4FCZ protein structures have some of the largest cavities observed to date (red bars).
(C-H) All three MlaC-like structures determined to date have bound lipid. 2Fo-Fc electron density map contoured at 1 sigma for MlaC (C), 2QGU (D), and 4FCZ (E), showing only the density corresponding to the bound lipids. In (E), the density was segmented and colored red and blue to indicate the regions corresponding to the two putative diacylglycerol-like groups. The bound lipids are similarly oriented in each structure [white spheres for MlaC (F) and 2QGU (G); and green and cyan spheres for the two diacylglycerol-like groups of 4FCZ (H)].
(I) MlaD interacts directly with biotinylated MlaC protein immobilized on a streptavidin-coated biosensor over a range of MlaD concentrations, as assayed by biolayer interferometry.
(A and B) Representative raw micrograph of negative-stained YebT (A) and PqiB (B).
(C) Schematic of constructs that were used. Top, full length construct of PqiB periplasmic domain; Bottom, construct in which the C-terminal domain, predicted to be helical, has been truncated.
(D) Representative single particles from negative stain EM data for the constructs shown in (C). Yellow arrows point to the density corresponding to a needle-like projection. This density is missing from the C-terminal truncated construct, suggesting that the needle-like projection is formed by the C-terminal domain.
(E) Negative stain single particle EM density map for full-length YebT (semi-transparent white surface). The small, roughly spherical density at bottom likely corresponds to the N-terminal TM helices from each subunit, which would be anchored in the inner membrane. Above this, 7 stacked MCE rings (colored ribbons) would extend into the periplasmic space, towards the outer membrane.
(F) Comparison of YebT and PqiB EM models with other supramolecular barrels: 20S proteasome and GroEL. All models are depicted to scale. The the barrels of YebT and PqiB are narrower than the proteasome and GroEL, but YebT’s is considerably longer.
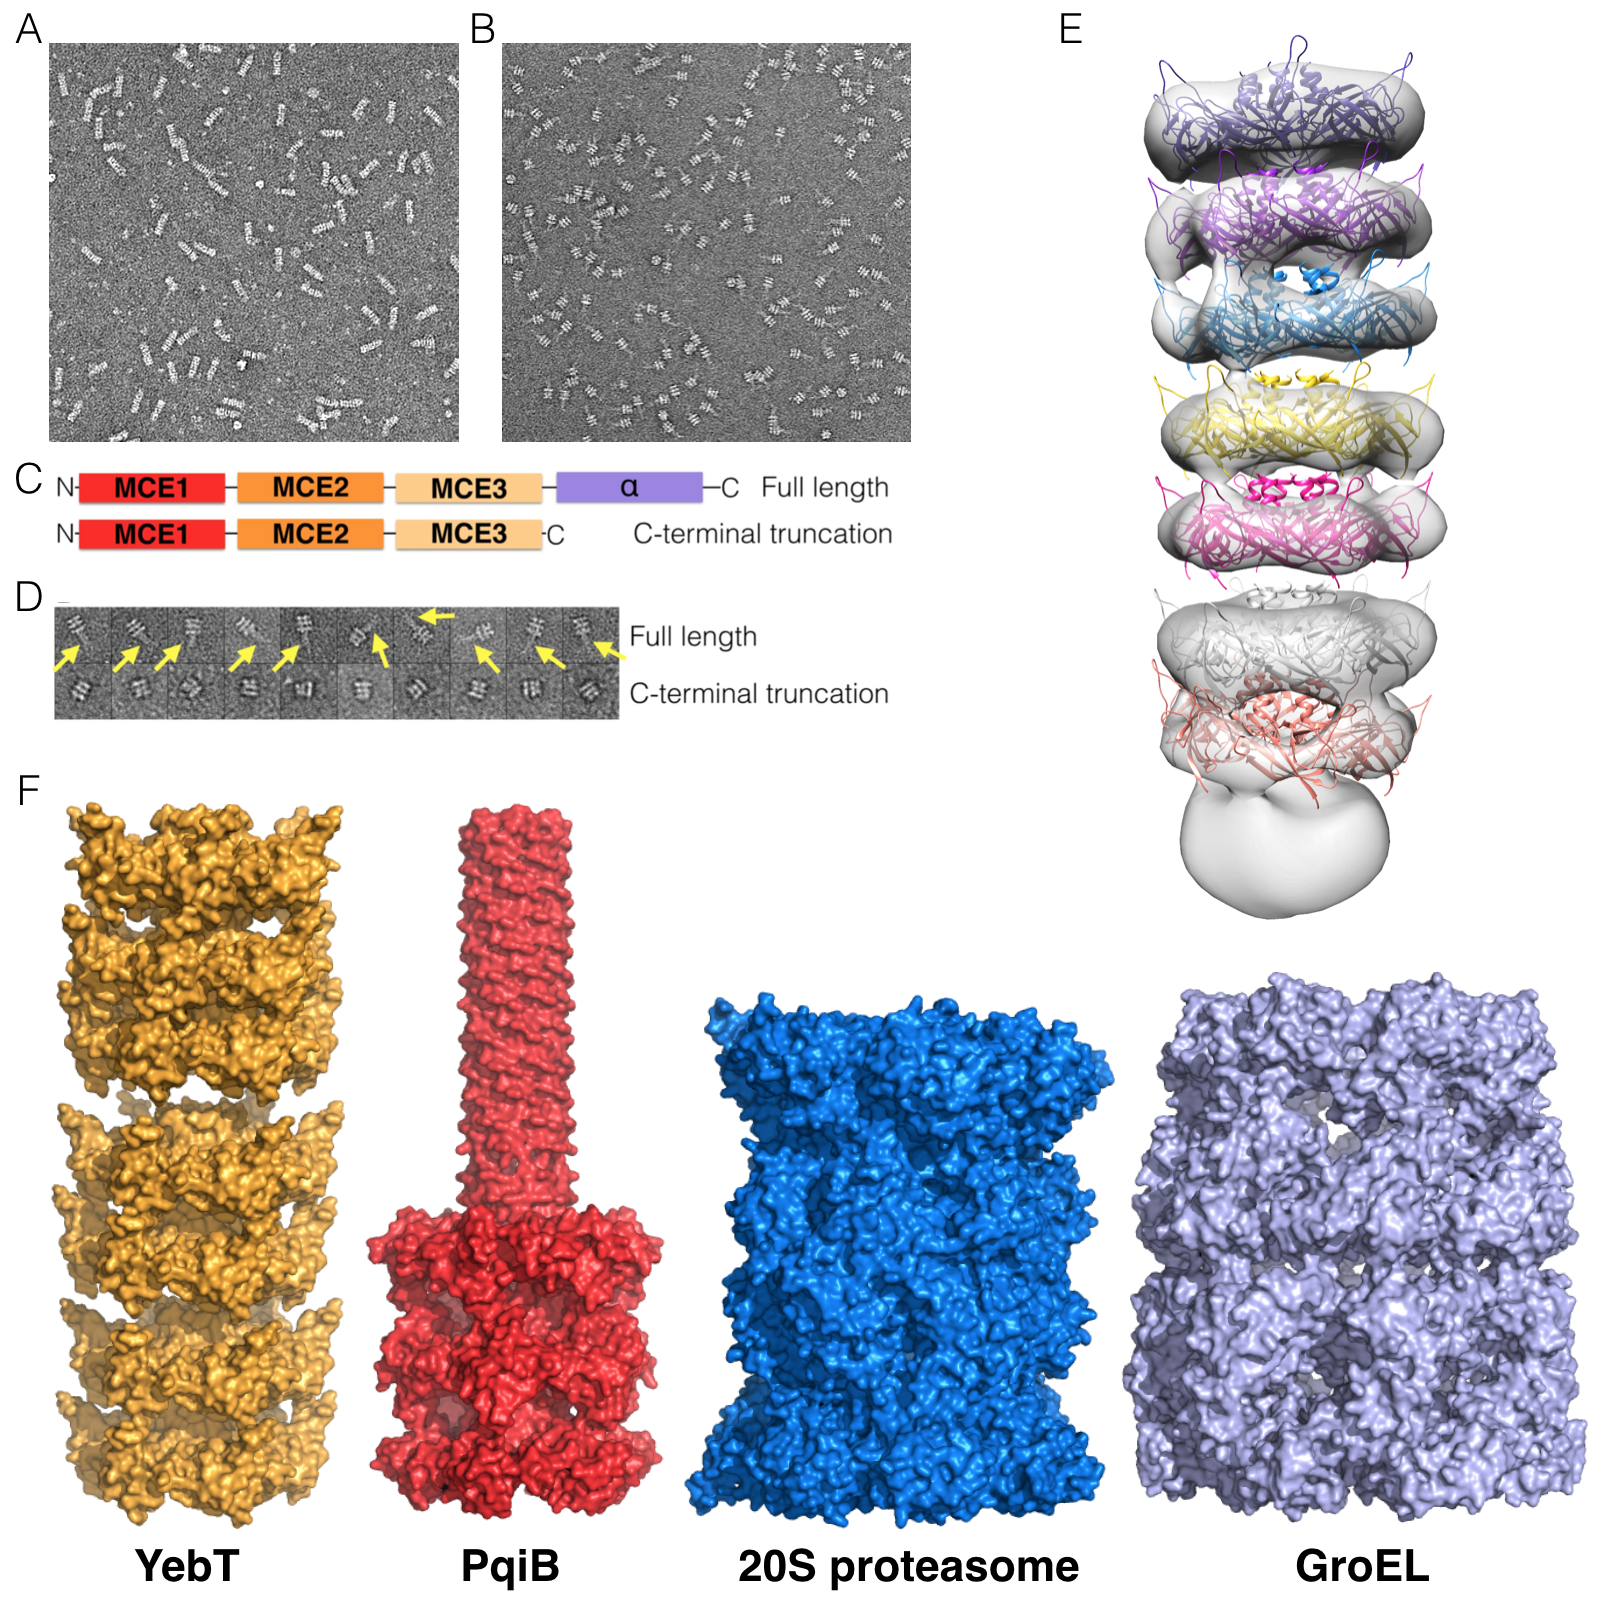
(A) Representative raw micrograph of PqiB using a K2 camera.
(B) Representative 2D class averages for PqiB.
(C) Gold standard FSC curve of final reconstruction. Horizontal line indicates 0.143 FSC.
(D) Stereo view of a representative region of the PqiB EM density map (blue mesh) and final atomic model for residues Pro175-Val176-Leu177-Phe178-Arg179.
(E) Layout for 2D and 3D classification and refinement of PqiB. Classification and refinement was done in Relion 1.4, and local resolution was estimated using Relion 2.0. Note in the second round of 3D classification the main feature that gets separated out is the central lining of the pore, comprising β-insert loops (Fig. 6G).
(A) The M. tuberculosis genome has 4 MCE operons, each encoding 6 MCE genes. Based upon the hexameric assemblies formed by E. coli MCE proteins, we propose that each MCE operon in M. tuberculosis MCE codes for a single, hetero-hexameric assembly, with 6 unique chains—one from each MCE gene.
(B) MCEs from M. tuberculosis encode a single MCE domain followed by a long C-terminal helical region. Based on the similar architecture of PqiB’s final MCE3 domain and helical C-terminal domain, we predict that M. tuberculosis MCE proteins will form a single hetero-hexameric ring with a long needle-like projection.
(C) The chloroplasts of plants and other photosynthetic eukaryotes contain a single MCE gene encoding a protein with a single MCE domain followed by a long C-terminal helical region (called TGD2 in A. thaliana). We predict that TGD2 will form a single homo-hexameric ring with a long needle-like projection.
Table S1. Crystallographic data collection and refinement statistics, related to Figures 2 and 4.
Table S2. Crystallographic data collection and MAD phasing statistics for MlaD structure, related to Figure 2.
Table S3. Crystallographic data collection and refinement statistics for re-refined 4FCZ, related to Figure 4.
Table S4. Cryo EM data collection and refinement statistics for PqiB, related to Figure 6.
Acknowledgments
We thank C. Waddling for support with crystallization; J. Holton, G. Meigs, of ALS 8.3.1 for beamline support; A. Gray, C. Gross, and M. Elvekrog (UCSF) for plasmids and strains; N. Stuurman and A. Williamson (UCSF) for assistance with microscopy; Y. Cheng, E. Palovcak, JP. Armache and A. Brilot (UCSF) for helpful suggestions and discussions; M. Braunfeld for EM technical assistance; C. Kennedy for assistance with high performance computing; C. Hong and Z. Yu at Janelia Research Campus for EM data collection; the UC Davis Campus Mass Spectrometry Facilities for protein MS assistance; T. Knowles and M. Jamshad (UoB) for help with protein purification; L. Alderwick (UoB) for help with the lipid TLC; and M. Morrissey, X. Su, M. Tanenbaum, Y. Cheng, and I. Wilson for critical reading of the manuscript. This work was supported by NIH grants K99GM112982 (G.B.) and 1S10OD020054, BBSRC grant BB/M00810X/1 (I.R.H.), and the Howard Hughes Medical Institute (R.D.V.). D.C.E. is supported by the Damon Runyon Cancer Research Foundation (DRG-2140-12). EM data were collected at the HHMI CryoEM Shared Facility at Janelia Research Campus. The ALS is supported by the US DoE, Contract DE-AC02-05CH11231.
Footnotes
Supplemental Information includes seven figures, three tables, and can be found with this article at http://dx.doi.org/xxxxxxxxxx
AUTHOR CONTRIBUTIONS: D.C.E. and G.B. conceived the research; D.C.E., G.B., G.L.I., and G.G. collected data; D.C.E., G.B., G.L.I., S.O., I.R.H, and R.V. analyzed data; D.C.E., G.B., and R.V. wrote the manuscript. D.C.E., G.B., G.L.I., G.G., S.O., I.R.H., J.S.C, and R.V. edited the manuscript.
References
- Adams PD, Afonine PV, Bunkóczi G, Chen VB, Davis IW, Echols N, Headd JJ, Hung LW, Kapral GJ, Grosse-Kunstleve RW, et al. PHENIX: a comprehensive Python-based system for macromolecular structure solution. Acta Crystallogr D Biol Crystallogr. 2010;66:213–221. doi: 10.1107/S0907444909052925. [DOI] [PMC free article] [PubMed] [Google Scholar]
- Arruda S, Bomfim G, Knights R, Huima-Byron T, Riley LW. Cloning of an M. tuberculosis DNA fragment associated with entry and survival inside cells. Science. 1993;261:1454–1457. doi: 10.1126/science.8367727. [DOI] [PubMed] [Google Scholar]
- Awai K, Xu C, Tamot B, Benning C. A phosphatidic acid-binding protein of the chloroplast inner envelope membrane involved in lipid trafficking. Proc Natl Acad Sci. 2006;103:10817–10822. doi: 10.1073/pnas.0602754103. [DOI] [PMC free article] [PubMed] [Google Scholar]
- Cantrell SA, Leavell MD, Marjanovic O, Iavarone AT, Leary JA, Riley LW. Free mycolic acid accumulation in the cell wall of the mce1 operon mutant strain of Mycobacterium tuberculosis. J Microbiol. 2013;51:619–626. doi: 10.1007/s12275-013-3092-y. [DOI] [PubMed] [Google Scholar]
- Carpenter CD, Cooley BJ, Needham BD, Fisher CR, Trent MS, Gordon V, Payne SM. The Vps/VacJ ABC Transporter Is Required for Intercellular Spread of Shigella flexneri. Infect Immun. 2014;82:660–669. doi: 10.1128/IAI.01057-13. [DOI] [PMC free article] [PubMed] [Google Scholar]
- Casali N, Riley LW. A phylogenomic analysis of the Actinomycetales mce operons. BMC Genomics. 2007;8:60. doi: 10.1186/1471-2164-8-60. [DOI] [PMC free article] [PubMed] [Google Scholar]
- Chong ZS, Woo WF, Chng SS. Osmoporin OmpC forms a complex with MlaA to maintain outer membrane lipid asymmetry in Escherichia coli. Mol Microbiol. 2015;98:1133–1146. doi: 10.1111/mmi.13202. [DOI] [PubMed] [Google Scholar]
- Clark LC, Seipke RF, Prieto P, Willemse J, van Wezel GP, Hutchings MI, Hoskisson PA. Mammalian cell entry genes in Streptomyces may provide clues to the evolution of bacterial virulence. Sci Rep. 2013;3 doi: 10.1038/srep01109. [DOI] [PMC free article] [PubMed] [Google Scholar]
- Cox JS, Chen B, McNeil M, Jacobs WR. Complex lipid determines tissue-specific replication of Mycobacterium tuberculosis in mice. Nature. 1999;402:79–83. doi: 10.1038/47042. [DOI] [PubMed] [Google Scholar]
- DiMaio F, Terwilliger TC, Read RJ, Wlodawer A, Oberdorfer G, Wagner U, Valkov E, Alon A, Fass D, Axelrod HL, et al. Improved molecular replacement by density- and energy-guided protein structure optimization. Nature. 2011;473:540–543. doi: 10.1038/nature09964. [DOI] [PMC free article] [PubMed] [Google Scholar]
- Du D, Wang Z, James NR, Voss JE, Klimont E, Ohene-Agyei T, Venter H, Chiu W, Luisi BF. Structure of the AcrAB-TolC multidrug efflux pump. Nature. 2014;509:512–515. doi: 10.1038/nature13205. [DOI] [PMC free article] [PubMed] [Google Scholar]
- Elmlund D, Elmlund H. SIMPLE: Software for ab initio reconstruction of heterogeneous single-particles. J Struct Biol. 2012;180:420–427. doi: 10.1016/j.jsb.2012.07.010. [DOI] [PubMed] [Google Scholar]
- Elmlund H, Elmlund D, Bengio S. PRIME: Probabilistic Initial 3D Model Generation for Single-Particle Cryo-Electron Microscopy. Structure. 2013;21:1299–1306. doi: 10.1016/j.str.2013.07.002. [DOI] [PubMed] [Google Scholar]
- Emsley P, Lohkamp B, Scott WG, Cowtan K. Features and development of Coot. Acta Crystallogr D Biol Crystallogr. 2010;66:486–501. doi: 10.1107/S0907444910007493. [DOI] [PMC free article] [PubMed] [Google Scholar]
- Gioffré A, Infante E, Aguilar D, Santangelo MDlaP, Klepp L, Amadio A, Meikle V, Etchechoury I, Romano MI, Cataldi A, et al. Mutation in mce operons attenuates Mycobacterium tuberculosis virulence. Microbes Infect. 2005;7:325–334. doi: 10.1016/j.micinf.2004.11.007. [DOI] [PubMed] [Google Scholar]
- Hoffmann C, Leis A, Niederweis M, Plitzko JM, Engelhardt H. Disclosure of the mycobacterial outer membrane: Cryo-electron tomography and vitreous sections reveal the lipid bilayer structure. Proc Natl Acad Sci. 2008;105:3963–3967. doi: 10.1073/pnas.0709530105. [DOI] [PMC free article] [PubMed] [Google Scholar]
- Holm L, Rosenström P. Dali server: conservation mapping in 3D. Nucleic Acids Res. 2010;38:W545–W549. doi: 10.1093/nar/gkq366. [DOI] [PMC free article] [PubMed] [Google Scholar]
- Jiang J, Pentelute BL, Collier RJ, Zhou ZH. Atomic structure of anthrax protective antigen pore elucidates toxin translocation. Nature. 2015;521:545–549. doi: 10.1038/nature14247. [DOI] [PMC free article] [PubMed] [Google Scholar]
- Kabsch W. XDS. Acta Crystallogr D Biol Crystallogr. 2010;66:125–132. doi: 10.1107/S0907444909047337. [DOI] [PMC free article] [PubMed] [Google Scholar]
- Kelley LA, Mezulis S, Yates CM, Wass MN, Sternberg MJE. The Phyre2 web portal for protein modeling, prediction and analysis. Nat Protoc. 2015;10:845–858. doi: 10.1038/nprot.2015.053. [DOI] [PMC free article] [PubMed] [Google Scholar]
- Kim K, Lee S, Lee K, Lim D. Isolation and Characterization of Toluene-Sensitive Mutants from the Toluene-Resistant Bacterium Pseudomonas putida GM73. J Bacteriol. 1998;180:3692–3696. doi: 10.1128/jb.180.14.3692-3696.1998. [DOI] [PMC free article] [PubMed] [Google Scholar]
- Klepp LI, Forrellad MA, Osella AV, Blanco FC, Stella EJ, Bianco MV, Santangelo MdlaP, Sassetti C, Jackson M, Cataldi AA, et al. Impact of the deletion of the six mce operons in Mycobacterium smegmatis. Microbes Infect. 2012;14:590–599. doi: 10.1016/j.micinf.2012.01.007. [DOI] [PMC free article] [PubMed] [Google Scholar]
- Kong Q, Six DA, Liu Q, Gu L, Wang S, Alamuri P, Raetz CRH, Curtiss R. Phosphate Groups of Lipid A Are Essential for Salmonella enterica Serovar Typhimurium Virulence and Affect Innate and Adaptive Immunity. Infect Immun. 2012;80:3215–3224. doi: 10.1128/IAI.00123-12. [DOI] [PMC free article] [PubMed] [Google Scholar]
- Konovalova A, Silhavy TJ. Outer membrane lipoprotein biogenesis: Lol is not the end. Philos Trans R Soc Lond B Biol Sci. 2015;370 doi: 10.1098/rstb.2015.0030. [DOI] [PMC free article] [PubMed] [Google Scholar]
- Krachler AM, Ham H, Orth K. Outer membrane adhesion factor multivalent adhesion molecule 7 initiates host cell binding during infection by Gram-negative pathogens. Proc Natl Acad Sci. 2011;108:11614–11619. doi: 10.1073/pnas.1102360108. [DOI] [PMC free article] [PubMed] [Google Scholar]
- Lee JY, Kinch LN, Borek DM, Wang J, Wang J, Urbatsch IL, Xie XS, Grishin NV, Cohen JC, Otwinowski Z, et al. Crystal structure of the human sterol transporter ABCG5/ABCG8. Nature. 2016;533:561–564. doi: 10.1038/nature17666. [DOI] [PMC free article] [PubMed] [Google Scholar]
- Li X, Mooney P, Zheng S, Booth CR, Braunfeld MB, Gubbens S, Agard DA, Cheng Y. Electron counting and beam-induced motion correction enable near-atomic-resolution single-particle cryo-EM. Nat Methods. 2013;10:584–590. doi: 10.1038/nmeth.2472. [DOI] [PMC free article] [PubMed] [Google Scholar]
- Malinverni JC, Silhavy TJ. An ABC transport system that maintains lipid asymmetry in the Gram-negative outer membrane. Proc Natl Acad Sci. 2009;106:8009–8014. doi: 10.1073/pnas.0903229106. [DOI] [PMC free article] [PubMed] [Google Scholar]
- Mastronarde DN. Automated electron microscope tomography using robust prediction of specimen movements. J Struct Biol. 2005;152:36–51. doi: 10.1016/j.jsb.2005.07.007. [DOI] [PubMed] [Google Scholar]
- Matias VRF, Al-Amoudi A, Dubochet J, Beveridge TJ. Cryo-Transmission Electron Microscopy of Frozen-Hydrated Sections of Escherichia coli and Pseudomonas aeruginosa. J Bacteriol. 2003;185:6112–6118. doi: 10.1128/JB.185.20.6112-6118.2003. [DOI] [PMC free article] [PubMed] [Google Scholar]
- May JM, Sherman DJ, Simpson BW, Ruiz N, Kahne D. Lipopolysaccharide transport to the cell surface: periplasmic transport and assembly into the outer membrane. Phil Trans R Soc B. 2015;370:20150027. doi: 10.1098/rstb.2015.0027. [DOI] [PMC free article] [PubMed] [Google Scholar]
- McCoy AJ, Grosse-Kunstleve RW, Adams PD, Winn MD, Storoni LC, Read RJ. Phaser crystallographic software. J Appl Crystallogr. 2007;40:658–674. doi: 10.1107/S0021889807021206. [DOI] [PMC free article] [PubMed] [Google Scholar]
- Mohn WW, van der Geize R, Stewart GR, Okamoto S, Liu J, Dijkhuizen L, Eltis LD. The Actinobacterial mce4 Locus Encodes a Steroid Transporter. J Biol Chem. 2008;283:35368–35374. doi: 10.1074/jbc.M805496200. [DOI] [PMC free article] [PubMed] [Google Scholar]
- Nakamura S, Shchepetov M, Dalia AB, Clark SE, Murphy TF, Sethi S, Gilsdorf JR, Smith AL, Weiser JN. Molecular basis of increased serum resistance among pulmonary isolates of non-typeable Haemophilus influenzae. PLoS Pathog. 2011;7:e1001247. doi: 10.1371/journal.ppat.1001247. [DOI] [PMC free article] [PubMed] [Google Scholar]
- Nichols RJ, Sen S, Choo YJ, Beltrao P, Zietek M, Chaba R, Lee S, Kazmierczak KM, Lee KJ, Wong A, et al. Phenotypic Landscape of a Bacterial Cell. Cell. 2011;144:143–156. doi: 10.1016/j.cell.2010.11.052. [DOI] [PMC free article] [PubMed] [Google Scholar]
- Okuda S, Freinkman E, Kahne D. Cytoplasmic ATP Hydrolysis Powers Transport of Lipopolysaccharide Across the Periplasm in E. coli. Science. 2012;338:1214–1217. doi: 10.1126/science.1228984. [DOI] [PMC free article] [PubMed] [Google Scholar]
- Ovchinnikov S, Kamisetty H, Baker D. Robust and accurate prediction of residue–residue interactions across protein interfaces using evolutionary information. eLife. 2014;3:e02030. doi: 10.7554/eLife.02030. [DOI] [PMC free article] [PubMed] [Google Scholar]
- Ovchinnikov S, Kinch L, Park H, Liao Y, Pei J, Kim DE, Kamisetty H, Grishin NV, Baker D. Large-scale determination of previously unsolved protein structures using evolutionary information. eLife. 2015;4:e09248. doi: 10.7554/eLife.09248. [DOI] [PMC free article] [PubMed] [Google Scholar]
- Pandey AK, Sassetti CM. Mycobacterial persistence requires the utilization of host cholesterol. Proc Natl Acad Sci. 2008;105:4376–4380. doi: 10.1073/pnas.0711159105. [DOI] [PMC free article] [PubMed] [Google Scholar]
- Pettersen EF, Goddard TD, Huang CC, Couch GS, Greenblatt DM, Meng EC, Ferrin TE. UCSF Chimera--a visualization system for exploratory research and analysis. J Comput Chem. 2004;25:1605–1612. doi: 10.1002/jcc.20084. [DOI] [PubMed] [Google Scholar]
- Remmert M, Biegert A, Hauser A, Söding J. HHblits: lightning-fast iterative protein sequence searching by HMM-HMM alignment. Nat Methods. 2012;9:173–175. doi: 10.1038/nmeth.1818. [DOI] [PubMed] [Google Scholar]
- Roston R, Gao J, Xu C, Benning C. Arabidopsis chloroplast lipid transport protein TGD2 disrupts membranes and is part of a large complex. Plant J. 2011;66:759–769. doi: 10.1111/j.1365-313X.2011.04536.x. [DOI] [PubMed] [Google Scholar]
- Roston RL, Gao J, Murcha MW, Whelan J, Benning C. TGD1, -2, and -3 Proteins Involved in Lipid Trafficking Form ATP-binding Cassette (ABC) Transporter with Multiple Substrate-binding Proteins. J Biol Chem. 2012;287:21406–21415. doi: 10.1074/jbc.M112.370213. [DOI] [PMC free article] [PubMed] [Google Scholar]
- Ru H, Chambers MG, Fu TM, Tong AB, Liao M, Wu H. Molecular Mechanism of V(D)J Recombination from Synaptic RAG1-RAG2 Complex Structures. Cell. 2015;163:1138–1152. doi: 10.1016/j.cell.2015.10.055. [DOI] [PMC free article] [PubMed] [Google Scholar]
- Ruiz N, Gronenberg LS, Kahne D, Silhavy TJ. Identification of two inner-membrane proteins required for the transport of lipopolysaccharide to the outer membrane of Escherichia coli. Proc Natl Acad Sci. 2008;105:5537–5542. doi: 10.1073/pnas.0801196105. [DOI] [PMC free article] [PubMed] [Google Scholar]
- Ruiz N, Kahne D, Silhavy TJ. Transport of lipopolysaccharide across the cell envelope: the long road of discovery. Nat Rev Microbiol. 2009;7:677–683. doi: 10.1038/nrmicro2184. [DOI] [PMC free article] [PubMed] [Google Scholar]
- Scheres SHW. RELION: Implementation of a Bayesian approach to cryo-EM structure determination. J Struct Biol. 2012a;180:519–530. doi: 10.1016/j.jsb.2012.09.006. [DOI] [PMC free article] [PubMed] [Google Scholar]
- Scheres SHW. A Bayesian View on Cryo-EM Structure Determination. J Mol Biol. 2012b;415:406–418. doi: 10.1016/j.jmb.2011.11.010. [DOI] [PMC free article] [PubMed] [Google Scholar]
- Senaratne RH, Sidders B, Sequeira P, Saunders G, Dunphy K, Marjanovic O, Reader JR, Lima P, Chan S, Kendall S, et al. Mycobacterium tuberculosis strains disrupted in mce3 and mce4 operons are attenuated in mice. J Med Microbiol. 2008;57:164–170. doi: 10.1099/jmm.0.47454-0. [DOI] [PubMed] [Google Scholar]
- Sheldrick GM. Experimental phasing with SHELXC/D/E: combining chain tracing with density modification. Acta Crystallogr D Biol Crystallogr. 2010;66:479–485. doi: 10.1107/S0907444909038360. [DOI] [PMC free article] [PubMed] [Google Scholar]
- Song Y, DiMaio F, Wang RYR, Kim D, Miles C, Brunette T, Thompson J, Baker D. High-Resolution Comparative Modeling with RosettaCM. Structure. 2013;21:1735–1742. doi: 10.1016/j.str.2013.08.005. [DOI] [PMC free article] [PubMed] [Google Scholar]
- Sperandeo P, Cescutti R, Villa R, Benedetto CD, Candia D, Dehò G, Polissi A. Characterization of lptA and lptB, Two Essential Genes Implicated in Lipopolysaccharide Transport to the Outer Membrane of Escherichia coli. J Bacteriol. 2007;189:244–253. doi: 10.1128/JB.01126-06. [DOI] [PMC free article] [PubMed] [Google Scholar]
- Sperandeo P, Lau FK, Carpentieri A, Castro CD, Molinaro A, Dehò G, Silhavy TJ, Polissi A. Functional Analysis of the Protein Machinery Required for Transport of Lipopolysaccharide to the Outer Membrane of Escherichia coli. J Bacteriol. 2008;190:4460–4469. doi: 10.1128/JB.00270-08. [DOI] [PMC free article] [PubMed] [Google Scholar]
- Suits MDL, Sperandeo P, Dehò G, Polissi A, Jia Z. Novel Structure of the Conserved Gram-Negative Lipopolysaccharide Transport Protein A and Mutagenesis Analysis. J Mol Biol. 2008;380:476–488. doi: 10.1016/j.jmb.2008.04.045. [DOI] [PubMed] [Google Scholar]
- Sutterlin HA, Shi H, May KL, Miguel A, Khare S, Huang KC, Silhavy TJ. Disruption of lipid homeostasis in the Gram-negative cell envelope activates a novel cell death pathway. Proc Natl Acad Sci. 2016;113:E1565–E1574. doi: 10.1073/pnas.1601375113. [DOI] [PMC free article] [PubMed] [Google Scholar]
- Tefsen B, Geurtsen J, Beckers F, Tommassen J, de Cock H. Lipopolysaccharide Transport to the Bacterial Outer Membrane in Spheroplasts. J Biol Chem. 2005;280:4504–4509. doi: 10.1074/jbc.M409259200. [DOI] [PubMed] [Google Scholar]
- Thong S, Ercan B, Torta F, Fong ZY, Wong HYA, Wenk MR, Chng SS. Defining key roles for auxiliary proteins in an ABC transporter that maintains bacterial outer membrane lipid asymmetry. eLife. 2016;5:e19042. doi: 10.7554/eLife.19042. [DOI] [PMC free article] [PubMed] [Google Scholar]
- Wang X, Ribeiro AA, Guan Z, Abraham SN, Raetz CRH. Attenuated virulence of a Francisella mutant lacking the lipid A 4′-phosphatase. Proc Natl Acad Sci. 2007;104:4136–4141. doi: 10.1073/pnas.0611606104. [DOI] [PMC free article] [PubMed] [Google Scholar]
- Wu T, McCandlish AC, Gronenberg LS, Chng SS, Silhavy TJ, Kahne D. Identification of a protein complex that assembles lipopolysaccharide in the outer membrane of Escherichia coli. Proc Natl Acad Sci. 2006;103:11754–11759. doi: 10.1073/pnas.0604744103. [DOI] [PMC free article] [PubMed] [Google Scholar]
- Xu C, Fan J, Riekhof W, Froehlich JE, Benning C. A permease-like protein involved in ER to thylakoid lipid transfer in Arabidopsis. EMBO J. 2003;22:2370–2379. doi: 10.1093/emboj/cdg234. [DOI] [PMC free article] [PubMed] [Google Scholar]
- Xu C, Fan J, Cornish AJ, Benning C. Lipid Trafficking between the Endoplasmic Reticulum and the Plastid in Arabidopsis Requires the Extraplastidic TGD4 Protein. Plant Cell Online. 2008;20:2190–2204. doi: 10.1105/tpc.108.061176. [DOI] [PMC free article] [PubMed] [Google Scholar]
- Zhang K. Gctf: Real-time CTF determination and correction. J Struct Biol. 2016;193:1–12. doi: 10.1016/j.jsb.2015.11.003. [DOI] [PMC free article] [PubMed] [Google Scholar]
- Zhang L, Zhang C, Ojcius DM, Sun D, Zhao J, Lin X, Li L, Li L, Yan J. The mammalian cell entry (Mce) protein of pathogenic Leptospira species is responsible for RGD motif-dependent infection of cells and animals. Mol Microbiol. 2012;83:1006–1023. doi: 10.1111/j.1365-2958.2012.07985.x. [DOI] [PubMed] [Google Scholar]
- Zheng S, Palovcak E, Armache J-P, Cheng Y, Agard D. Anisotropic Correction of Beam-induced Motion for Improved Single-particle Electron Cryo-microscopy. bioRxiv. 2016 doi: 10.1038/nmeth.4193. http://dx.doi.org/10.1101/061960. [DOI] [PMC free article] [PubMed]
Associated Data
This section collects any data citations, data availability statements, or supplementary materials included in this article.
Supplementary Materials
(A) After mixing equal volumes of WT and MCE mutant overnight cultures, mixed cultures were diluted 1:1000 in fresh LB and incubated ~16hr at 37° C with shaking. The fraction of mutant cells (mutant cells divided by total cells) was estimated before and after growth competition by plating dilutions on LB (total cells) and LB+Kan (mutant cells). The ratios presented here represent the change in the fraction of mutant cells between the initial mixed culture and the post-competition culture [(fraction mutant T16hr)/(fraction mutant T0)]. Values above 1 indicate a growth advantage in the mutant, while values below 1 indicate a growth defect in the mutant. For all the mutants, the frequency of mutant cells changed by less than 2-fold between the input and post-competition cultures, suggesting MCE genes are dispensable for in vitro growth in rich media.
(B-D ) After mixing equal volumes of WT and MCE mutant overnight cultures, mixed cultures were diluted 1:1000 in fresh LB+5% SDS (B) or LB+100 mM CaCl2 (C), incubated ~16 hr at 37C with shaking, and analyzed as described above. Addition of 5% SDS or 100 mM CaCl2 had little effect on the growth of any of the single mutants, but dramatically reduces the frequency of the triple mutant.
(E) Live cells growing exponentially in LB were co-stained with DAPI and PI for 30 minutes then imaged. The culture of the triple mutant had more PI-positive cells than the wild-type, though the vast majority of cells in both cultures were PI-negative, indicating that the inner membrane remains intact. DAPI staining of the triple mutant was brighter than the wild-type, with clear nucleoid localization, while the staining of wild-type cells under these conditions was strongest at the cell periphery (cell wall/membrane staining). Consistent with the role of the OM as a barrier to the entry of small molecules into the cell, DAPI entry into WT cells appears to be inefficient, while in the triple mutant the OM is compromised, allowing efficient nucleoid staining.
(F) Results of ethidium bromide uptake assay for WT and ΔmlaE ΔpqiA ΔyebS mutant, showing that in the presence of the efflux blocker CCCP, the ΔmlaD ΔpqiAB ΔyebST mutant takes up significantly more ethidium bromide than the WT (P = 5.5×10⁻⁶, two-way ANOVA). The mean from 15 biological replicates at each binned time point is plotted (5 runs, each with 3 biological replicates) and the error bars represent the standard deviation between the biological replicates.
(G) E. coli strains with mutations in the mla gene cluster (such as ΔmlaE shown here) do not grow on LB plates supplemented with 0.5 % SDS + 1.25 mM EDTA. This defect can be complemented by a plasmid-borne copy of the mlaFEDCB operon under the uninduced/leaky expression from an arabinose inducible promoter.
(H) Similar to (G), showing that the ΔmlaE single mutant and the ΔmlaE ΔpqiA ΔyebS triple mutant have similar phenotypes on LB plates supplemented with 0.5% SDS + 1.25 mM EDTA.
(I) Additional electron micrographs of wild-type E. coli cells (1–9) and cropped/zoomed sections of the IM/OM region (1′-9′, respectively).
(J) Additional electron micrographs of ΔmlaE ΔpqiA ΔyebS mutant E. coli cells (1–9) and cropped/zoomed sections of the IM/OM region (1′-9′, respectively).
(A) Topology diagrams highlighting the differences between the MCE domain and the closest structural neighbors in the PDB.
(B) Initial electron density map for the core MCE domain of MlaD [32–140] after phasing and density modification using SHELX C/D/E pipeline. Map is contoured at 2σ and displayed as a blue mesh. The Cα trace of the final model is shown in red for comparison.
(C) the full-length MlaD ectodomain, which includes an additional ~45 amino acids at the C-terminus that associate to form a helical bundle, forms a single hexameric ring.
(D) in contrast, the core MCE domain forms a tetradecamer, consisting of two rings of seven MCE domains stacked on top of one another with their pores roughly aligned (subunits of upper ring colored, bottom ring gray).
(E) 90° rotated view of the full-length, hexameric MlaD ectodomain.
(F) 90° rotated view of the tetradecameric MlaD core MCE domain, colored as in (B).
(G) 2D class averages from single particle, negative stain electron microscopy are also consistent with a 14 subunit, stacked ring organization for the MCE core domain from MlaD, suggesting that the 14-mer observed in the crystal is also stable in solution. We believe the hexamer is the predominant and perhaps the only functional form in vivo, for three reasons. 1) The complete periplasmic domain crystal structure is hexameric, and it is also hexameric in the context of the larger MlaFEDB complex. Second, PqiB and YebT, two other MCE proteins from E. coli, are only hexameric. Third, the “head-to-head” arrangement of the two stacked rings in the 14-mer places the C-terminal helical bundle from each ring at the interface, resulting in major steric overlap.
(A) Representative raw micrograph of MlaFEDB using a K2 camera.
(B) Gold standard FSC curve of final reconstruction. Horizontal line indicates 0.143 FSC.
(C and D) Location of strongly co-evolving residue pairs in the MlaFEDB complex. (C) Co-evolving residue pairs suggestive of potential contacts between MlaD (left column) and MlaE (right column).
D) Co-evolving residue pairs suggestive of potential contacts between MlaE (left column) and MlaF right column).
(E) Comparison of the de novo model of MlaE with the crystal structure of the permease domain of the ABCG5/ABCG8 transporter structure (PDB code 5DO7). Helices are colored from red to blue from the N-terminus to the C-terminus, indicating the similar fold and topology between these two proteins. An additional N-terminal helix in MlaE that is not found in ABCG5/ABCG8 and additional C-terminal helices in ABCG5/ABCG8 that are not present in MlaE are colored light grey.
(F). Fit of MlaE into TM region density. Extra density likely corresponds to N-terminal helices of MlaD as well as amphipol.
(A), Comparison of MlaC with cystatin and other NTF2 superfamily members. In contrast to cystatins, where a single α-helix (red) packs tightly against one face of the β-sheet, the NTF2 superfamily extends the sheet with 2 additional β-strands while adding two α-helices, creating a hydrophobic pocket between the sheet and helices. MlaC adds several addition helices to this core cystatin/NTF2 fold.
(B), The hydrophobic pocket varies in volume across the diverse members of the NTF2 superfamily, from a modest depression in NTF2 itself that mediates interaction with Ran-GDP (dark blue bars), to a prominent active site cleft in many enzymes where it can accommodate small hydrophobic substrates, such as steroids in the ketosteroid isomerases (green bars). Compared with other members of the NTF2 superfamily, MlaC and the related 2QGU and 4FCZ protein structures have some of the largest cavities observed to date (red bars).
(C-H) All three MlaC-like structures determined to date have bound lipid. 2Fo-Fc electron density map contoured at 1 sigma for MlaC (C), 2QGU (D), and 4FCZ (E), showing only the density corresponding to the bound lipids. In (E), the density was segmented and colored red and blue to indicate the regions corresponding to the two putative diacylglycerol-like groups. The bound lipids are similarly oriented in each structure [white spheres for MlaC (F) and 2QGU (G); and green and cyan spheres for the two diacylglycerol-like groups of 4FCZ (H)].
(I) MlaD interacts directly with biotinylated MlaC protein immobilized on a streptavidin-coated biosensor over a range of MlaD concentrations, as assayed by biolayer interferometry.
(A and B) Representative raw micrograph of negative-stained YebT (A) and PqiB (B).
(C) Schematic of constructs that were used. Top, full length construct of PqiB periplasmic domain; Bottom, construct in which the C-terminal domain, predicted to be helical, has been truncated.
(D) Representative single particles from negative stain EM data for the constructs shown in (C). Yellow arrows point to the density corresponding to a needle-like projection. This density is missing from the C-terminal truncated construct, suggesting that the needle-like projection is formed by the C-terminal domain.
(E) Negative stain single particle EM density map for full-length YebT (semi-transparent white surface). The small, roughly spherical density at bottom likely corresponds to the N-terminal TM helices from each subunit, which would be anchored in the inner membrane. Above this, 7 stacked MCE rings (colored ribbons) would extend into the periplasmic space, towards the outer membrane.
(F) Comparison of YebT and PqiB EM models with other supramolecular barrels: 20S proteasome and GroEL. All models are depicted to scale. The the barrels of YebT and PqiB are narrower than the proteasome and GroEL, but YebT’s is considerably longer.
(A) Representative raw micrograph of PqiB using a K2 camera.
(B) Representative 2D class averages for PqiB.
(C) Gold standard FSC curve of final reconstruction. Horizontal line indicates 0.143 FSC.
(D) Stereo view of a representative region of the PqiB EM density map (blue mesh) and final atomic model for residues Pro175-Val176-Leu177-Phe178-Arg179.
(E) Layout for 2D and 3D classification and refinement of PqiB. Classification and refinement was done in Relion 1.4, and local resolution was estimated using Relion 2.0. Note in the second round of 3D classification the main feature that gets separated out is the central lining of the pore, comprising β-insert loops (Fig. 6G).
(A) The M. tuberculosis genome has 4 MCE operons, each encoding 6 MCE genes. Based upon the hexameric assemblies formed by E. coli MCE proteins, we propose that each MCE operon in M. tuberculosis MCE codes for a single, hetero-hexameric assembly, with 6 unique chains—one from each MCE gene.
(B) MCEs from M. tuberculosis encode a single MCE domain followed by a long C-terminal helical region. Based on the similar architecture of PqiB’s final MCE3 domain and helical C-terminal domain, we predict that M. tuberculosis MCE proteins will form a single hetero-hexameric ring with a long needle-like projection.
(C) The chloroplasts of plants and other photosynthetic eukaryotes contain a single MCE gene encoding a protein with a single MCE domain followed by a long C-terminal helical region (called TGD2 in A. thaliana). We predict that TGD2 will form a single homo-hexameric ring with a long needle-like projection.
Table S1. Crystallographic data collection and refinement statistics, related to Figures 2 and 4.
Table S2. Crystallographic data collection and MAD phasing statistics for MlaD structure, related to Figure 2.
Table S3. Crystallographic data collection and refinement statistics for re-refined 4FCZ, related to Figure 4.
Table S4. Cryo EM data collection and refinement statistics for PqiB, related to Figure 6.