

Abstract
Prader–Willi syndrome (PWS) is caused by loss of function of paternally expressed genes in the 15q11-q13 region and a paucity of data exists on transcriptome variation. To further characterize genetic alterations in this classic obesity syndrome using whole genome microarrays to analyze gene expression, microarray and quantitative RT-PCR analysis were performed using RNA isolated from lymphoblastoid cells from PWS male subjects (four with 15q11-q13 deletion and three with UPD) and three age and cognition matched nonsyndromic comparison males. Of more than 47,000 probes examined in the microarray, 23,383 were detectable and 323 had significantly different expression in the PWS lymphoblastoid cells relative to comparison cells, 14 of which were related to neurodevelopment and function. As expected, there was no evidence of expression of paternally expressed genes from the 15q11-q13 region (e.g., SNRPN) in the PWS cells. Alterations in expression of serotonin receptor genes (e.g., HTR2B) and genes involved in eating behavior and obesity (ADIPOR2, MC2R, HCRT, OXTR) were noted. Other genes of interest with reduced expression in PWS subjects included STAR (a key regulator of steroid synthesis) and SAG (an arrestin family member which desensitizes G-protein-coupled receptors). Quantitative RT-PCR for SAG, OXTR, STAR, HCRT, and HTR2B using RNA isolated from their lymphoblastoid cells and available brain tissue (frontal cortex) from separate individuals with PWS and control subjects and normalized to GAPD gene expression levels validated our microarray gene expression data. Our analysis identified previously unappreciated changes in gene expression which may contribute to the clinical manifestations seen in PWS.
Keywords: Prader–Willi syndrome, gene expression microarray, neurodevelopment, obesity, transcriptome
INTRODUCTION
Prader–Willi syndrome (PWS) is a complex neurodevelopmental disorder characterized by a two-stage clinical sequence. Infants with PWS have severe hypotonia, feeding difficulties, hypogonadism, small hands and feet, respiratory problems, and genital hypoplasia. At about 2–4 years of age, children with PWS develop an insatiable appetite resulting in the onset of severe obesity if food intake is not strictly controlled. PWS subjects have a reduced metabolic rate and abnormal body composition with reduced lean mass and higher fat mass, particularly subcutaneous rather than visceral fat. In addition, PWS subjects have moderate cognitive impairment often accompanied by behavioral difficulties [Cassidy et al., 1997; Butler and Thompson, 2000; Bittel and Butler, 2005].
PWS results from the absence of expression of imprinted genes (paternally expressed) located on chromosome 15q11-q13. The chromosome 15q11-q13 region contains imprinted sequences that are differentially expressed depending on the parent of origin. Imprinted expression is coordinately controlled in cis by an imprinting center (IC) which regulates the establishment of parental specific allelic differences in DNA methylation, chromatin structure and expression [Nicholls and Knepper, 2001].
Absence of paternally expressed genes is due to a paternally derived deletion of the 15q11-q13 region in about 70% of PWS subjects, maternal disomy 15 in approximately 25% and an imprinting mutation in 2–3% [Bittel and Butler, 2005]. The 15q11-q13 region contains about 4 million base pairs of DNA and as many as 50–100 genes/transcripts. To date, ten genes have been located in this region that have been shown to be paternally expressed [Nicholls and Knepper, 2001]. In addition, at least two genes in this region are maternally expressed in some tissues (UBE3A, ATP10C), and loss of expression of these genes causes Angelman syndrome, an entirely different clinical syndrome [Nicholls and Knepper, 2001]. Analysis of gene expression in the 15q11-q13 region has identified several candidate genes which may play a role in PWS, including SNURF-SNRPN, NDN, MAGEL2, and MKRN3; but the molecular basis of the PWS phenotype remains poorly understood [Nicholls, 1999; Lee et al., 2000; Hanel and Wevrick, 2001; Bittel et al., 2003, 2005; Lee et al., 2005].
Analyses of the genetic subtypes of PWS have demonstrated a number of cognitive and behavioral differences between PWS subjects with deletions compared to those with UPD. Significantly, higher verbal IQ scores in PWS subjects with UPD compared to subjects with deletions were previously reported [Roof et al., 2000]. The UPD subgroup scored significantly higher than the deletion subgroup in four subcategories of verbal testing including information, arithmetic, vocabulary and comprehension. Several reports have indicated that PWS subjects with UPD had less severe manifestations than subjects with deletions for specific maladaptive behaviors commonly associated with PWS. These differences may be related to the underlying differences in gene expression of the genetic subtypes.
The functional and regulatory mechanisms of this region have been conserved in mice. Recently, microarray analysis of a mouse model of PWS revealed loss of expression of imprinted genes in the PWS critical region (PWSCR) from brains of PWS mice compared to control mice but surprisingly, only three genes outside the PWSCR had significantly changed expression [Stefan et al., 2005]. These three genes were all modestly upregulated and were located in close proximity to each other on mouse chromosome 18.
Microarray analysis of fibroblast cells derived from an individual with PWS who was mosaic for normal cells and cells with maternal uniparental disomy 15 revealed a significant reduction in SCG2 which is a precursor of the dopamine releasing factor secretoneurin [Horsthemke et al., 2003]. The authors speculated that the hyperphagia common in PWS might be related to disruption of dopamine metabolism. More recently it was shown using quantitative RT-PCR that CD36 was reduced in individuals with PWS providing further speculation of a possible disruption of energy homoeostatic mechanisms in PWS [Webb et al., 2006].
Many of the genes in the 15q11-q13 region appear to have either RNA or protein processing functions, suggesting a wider role for these sequences in controlling gene expression. For example, the multi-cistronic SNURF-SNRPN-snoRNA locus codes for two nuclear localized proteins, SMN and SNURF, and multiple small C/D small nucleolar RNAs (snoRNAs). SMN is a spliceosomal protein involved in RNA splicing and SNURF is rich in arginine residues suggesting that it may bind RNA but its exact function remains unknown [Gray et al., 1999]. The function of the snoRNAs is unclear, but it is likely that they play a role in mRNA splicing or methylation [Cavaille et al., 2000; de los Santos et al., 2000; Runte et al., 2001]. MKRN3 encodes a putative ribonucleoprotein, NDN, a MAGE protein, may act as a transcriptional repressor [Lee et al., 2005] and the related MAGE gene, MAGEL2, encodes a protein that is widely expressed in the central nervous system with unknown function [Boccaccio et al., 1999; Lee et al., 2000].
Although the 15q11-q13 defect underlies PWS, the genes within the region may not be directly responsible for the complex phenotype. Rather, it seems likely that the PWS phenotype results from dysregulation of multiple interconnected neurological and metabolic pathways. We have previously used custom-made microarrays to examine the expression patterns of the genes within and nearby 15q11-q13 [Bittel et al., 2003, 2005]. Our results indicated several genes/transcripts in the region had parent of origin allelic bias in expression.
Herein, we describe transcriptome analysis of lymphoblastoid cells derived from PWS representing the two major genetic subtypes (deletion and UPD) and obese comparison subjects using the Affymetrix HG-U133 Plus 2.0 human whole genome microarray and validate gene expression findings with quantitative RT-PCR. In addition, we compared gene expression in lymphoblastoid cells to brain tissue (frontal cortex) available from a separate group of PWS and control subjects.
SUBJECTS AND METHODS
Subjects
This study was approved by the local Institutional Review Board (IRB) and consent procedures followed accordingly. Each subject and parent or legal guardian signed a written consent form approved by the IRB with written and verbal explanations describing the purpose and procedures of the study, risks and benefits and the subject’s right to privacy and confidentiality.
Microarray analysis on RNA from lymphoblasts was performed on male subjects, matched for age, cognition, and obesity status. Our study subjects included young adult Caucasian males, seven with PWS [four with 15q11-q13 deletion (mean age of 23 years with a range of 16–34 years) and three with UPD (mean age of 29 years with a range of 13–45 years)] and three nonsyndromic comparison males with obesity of unknown cause (mean age of 18 years with a range of 11–23 years). Obesity was defined as BMI greater than 95%, based on age and sex. All of the study subjects were evaluated by methylation studies and chromosomal status was confirmed in the PWS subjects by FISH and microsatellite analysis using standard techniques.
Additionally, frontal cortex tissues from six separate Caucasian female subjects (three with PWS, confirmed by molecular genetic analysis, and three control samples) were available from the NIH brain and tissue banks to compare gene expression data with lymphoblastoid cells. The number of PWS males with brain tissue available was limited. Two of the samples were female infants, one with PWS with the 15q11-q13 deletion (Brain and Tissue Bank for Developmental Disorders, University of Miami; identification # 3877) and one control female infant (Brain and Tissue Bank for Developmental Disorders, University of Maryland; identification # 3278), both 1 year of age. The other four frontal cortex samples were from adult females: two with PWS with 15q11-q13 deletions confirmed by molecular genetic testing (Brain and Tissue Bank for Developmental Disorders, University of Maryland; identification #s 856 and 3570), both 32 years old and frontal cortex samples from two control females, a 39-year-old (Brain and Tissue Bank for Developmental Disorders, University of Maryland; identification # 3253) and a 71-year-old (RNA purchased from Invitrogen, Carlsbad, CA. cat # 735459).
RNA Isolation
Lymphoblast cultures are grown in RPMI 1640 medium (JRH Biosciences) supplemented with 2.05 mM L-glutamine, 10% fetal calf serum and 1% Pen/Strep. 48 hr prior to RNA extraction, 2 ml of media containing ~106 cells/ml were seeded into 10 ml of media in a T25 flask. Cells were pelletted by gentle centrifugation and media removed. The cells were resuspended in Trizol reagent (Invitrogen) and total RNA extracted following the manufacturer’s instructions. Brain tissue was kept frozen at −80°C until use. RNA was extracted from brain tissue (frontal cortex) using Trizol reagent. A small piece of tissue was ground with a Kontes motorized micropestle in Trizol reagent followed by extraction according to the manufacturer’s instructions. RNA quantity and quality were evaluated by spectrophotometry.
Microarrays
Human whole genome microarrays (HG-U133 Plus 2.0 Array, Affymetrix, Inc., Santa Clara, CA) were used to compare gene expression from lymphoblastoid cells derived from our study subjects. Target preparation, hybridization, and initial data collection were done at the microarray facility, University of Alabama, Birmingham. GeneSpring software (Silicon Genetics, Agilent Technologies, Palo Alto, CA) was used for microarray data characterization and analysis as previously described [Bittel and Butler, 2005]. In addition, microarray data were available using Codelink Uniset Human 20K arrays (Amersham Biosciences, GE Healthcare, Piscataway, NJ) with RNA from brain tissue (frontal cortex) from the two infant females and analyzed in our study.
Analysis and Statistics
The microarray data, analyzed using GeneSpring software, was initially transformed by setting all values less than 0.01 to 0.01. Normalization to the median baseline signal was accomplished using the software and a global scaling process for all probe sets. Essentially, all microarrays were normalized to the median value of the control samples such that each measurement for each probe in each microarray was divided by the median of that probe’s measurement in the corresponding control sample. Each measurement was then divided by the 50th centile of all measurements in that sample. This has the effect of minimizing discrepancies between an experiment and control baseline array value due to variation in preparation, hybridization or staining conditions or probe array lot number [McLachlan et al., 2004]. The inclusion criteria for further analysis required a “present” or “marginal” signal in at least two of the three control arrays or three of the four PWS deletion arrays or two of the three PWS UPD arrays. In addition, probes were included for further analysis which had a mean change in intensity level between subject groups of 1.5-fold. Furthermore, within the PWS group, all values for the probe had to be in the same direction (up or down) relative to the control group. Differences between mean probe signal intensity were evaluated using a Welsh t-test with Bonferroni correction without assuming equal variances and a false discovery rate (fdr) of 20% or less as undertaken in other studies [Stefan et al., 2005].
Quantitative RT-PCR
To validate gene expression from lymphoblastoid cells from our PWS and control subjects, we performed quantitative reverse transcription-PCR (RT-PCR) on a subset of genes/transcripts using a QuantiTect SYBR Green RT-PCR kit (Qiagen, Valencia, CA) according to the manufacturer’s directions and previous experience [Bittel et al., 2006]. Total RNA was isolated from cell lines and tissues using Trizol reagent (Invitrogen) and quantified by spectroscopy. An equal quantity of total RNA (500 ng) from each subject, together with gene specific primers were added to a reaction mix containing all components necessary for reverse transcription and PCR. The reaction was carried out in an ABI 7000 system (Applied Biosystems, Foster City, CA) beginning with a 30 min step at 50°C to allow for reverse transcription, followed by 15 min at 95°C. The PCR followed for 45 cycles during which the intensity of the SYBR Green fluorescence was measured at the extension step of each PCR cycle. The point at which the intensity level crossed the PCR cycle threshold (CT) was used to compare individual reactions. At least five replicates were performed on each sample for each gene. A dissociation curve was generated for all reactions and reactions were run on agarose gels to verify the presence of a single band.
Normalization of Quantitative RT-PCR
Amplification of GAPD RNA served as a standardization control for each sample to correct for minor differences in RNA quality and quantity. Normalization of expression was performed by dividing the mean GAPD RNA value (CT) from each subject to the mean GAPD RNA value (CT) of one of the comparison subjects to produce a correction value. Each mean CT value for the other genes was divided by the correction value to produce the normalized value. The normalized CT values were averaged to produce the mean CT value for each gene analyzed. A t-test was performed to determine statistically significant differences in gene expression (using normalized mean CT values).
RESULTS
Prader–Willi Syndrome Versus Comparison Subjects
We analyzed total RNA expression isolated from actively growing lymphoblastoid cells derived from seven PWS males with an average age of 23 years, four with deletions and three with UPD and compared to three males with obesity and an average age of 18 years. Of more than 47,000 probes on the microarrays, 23,383 met the inclusion criteria for detectable expression. A total of 607 probes had increased expression of at least 1.5-fold and 1,488 had reduced expression of at least 1.5-fold in the PWS subjects relative to the obese comparison subjects. Of these, 698 probes had at least a twofold change in expression (142 higher in PWS and 556 lower in PWS) and 226 had at least a threefold change in expression (40 higher in PWS and 186 lower in PWS) relative to the comparison subjects. Of the 2,095 probes with at least a 1.5-fold or greater change, 323 were statistically significant with a fdr set at 20%, 16 were significant with an fdr of 10% and 5 probes were significant with an fdr of 5%. Table I lists the top 50 genes from the set of 323 probes representing 303 genes with a significant change in expression between the PWS and comparison subjects (ranked by fold change) and Table II lists the genes which had a significant change in expression with fdr of 10 and 5%.
Table I.
Fifty Genes With Most Significant P-Values From the 323 Probes (From a Total of 23,383 Probes Analyzed) and an Expression 1.5-Fold Change Between the Seven Prader–Willi Syndrome Males and the Three Comparison Males (Ranked by Fold Change)
| Gene | Fold change | P-value | Genbank acc. | Chromosome location | Description |
|---|---|---|---|---|---|
| Decreased expression in Prader–Willi syndrome | |||||
| SNRPN | −68.8 | 1.65E-08 | NM_003097 | 15q11.2 | Small nuclear ribonucleoprotein polypeptide N |
| PAR1 | −32.4 | 3.22E-05 | BE783065 | 15q11.2 | Prader–Willi/Angelman region-1 |
| Transcript | −18.7 | 2.88E-04 | AL520272 | 12q13.13 | Hypothetical gene |
| PLOD2 | −10.2 | 5.25E-04 | NM_000935 | 3q23-q24 | Procollagen-lysine, 2-oxoglutarate 5-dioxygenase |
| IGLJ3 | −8.9 | 4.73E-04 | X79782 | 22q11.1-q11.2 | IG lambda light chain |
| IPW | −6.8 | 4.45E-05 | AI672541 | 15q11-q12 | Imprinted in Prader–Willi |
| CNN3 | −4.9 | 5.50E-04 | AI807004 | 1p22-p21 | Calponin 3, acidic |
| LUC7A | −2.6 | 2.08E-04 | AA005430 | 17q21 | Cisplatin resistance-associated overexpressed protein |
| DKFZp762A217 | −2.0 | 7.51E-04 | AI765006 | 12q21.31 | Hypothetical protein DKFZp762A217 |
| PPP1R10 | −2.0 | 3.71E-06 | AI492873 | 6p21.3 | Protein phosphatase 1, regulatory subunit 10 |
| USP6 | −2.0 | 6.16E-04 | AA291110 | 17q11 | Ubiquitin specific protease 6 |
| PNAS-4 | −2.0 | 6.34E-04 | AK025651 | 1q44 | CGI-146 protein |
| Transcript | −1.9 | 9.08E-05 | BE675040 | Transcribed sequence | |
| TIMM22 | −1.9 | 2.61E-05 | H87708 | 17p13 | Translocase of inner mitochondrial membrane 22 homolog |
| Transcript | −1.8 | 1.72E-04 | AI669022 | 3q26.32 | transcribed sequences |
| Transcript | −1.8 | 3.46E-04 | AF085995 | 4q27 | CDNA FLJ42757 |
| C20orf14 | −1.8 | 5.95E-04 | AB019219 | 20q13.33 | Chromosome 20 open reading frame 14 |
| IPP | −1.8 | 5.21E-04 | NM_005897 | 1p34-p32 | Intracisternal A particle-promoted polypeptide |
| HNRPU | −1.7 | 4.35E-05 | D13413 | 1q44 | Tumor-associated 120 kDa nuclear protein |
| MHC2TA | −1.7 | 4.73E-04 | NM_000246 | 16p13 | MHC class II transactivator |
| DKFZp566O084 | −1.7 | 1.25E-04 | NM_015510 | 17p12 | DKFZP566O084 protein |
| FNBP3 | −1.7 | 6.05E-04 | AA176247 | 2q24.1 | Formin binding protein 3 |
| MAN1B1 | −1.6 | 8.43E-04 | AA631254 | 9q34 | Mannosidase, alpha, class 1B, member 1 |
| PPP2R1B | −1.6 | 5.84E-04 | AW009884 | 11q23.2 | Protein phosphatase 2 (formerly 2A), regulatory subunit A (PR 65), beta isoform |
| SENP1 | −1.6 | 7.42E-04 | AW665440 | 12q13.1 | SUMO1/sentrin specific protease 1 |
| ELAC2 | −1.6 | 4.01E-04 | NM_018127 | 17p11.2 | elaC homolog 2 |
| RBM17 | −1.6 | 2.26E-04 | BF063156 | 10p15.1 | RNA binding motif protein 17 |
| IL28RA | −1.5 | 2.68E-04 | AW340139 | 1p36.11 | mRNA sequence contains element MER30 repetitive element |
| PES1 | −1.5 | 5.84E-04 | NM_014303 | 22q12.1 | Pescadillo homolog 1, containing BRCT domain |
| ASH1L | −1.5 | 3.95E-04 | AI806500 | 1q22 | ash1 (absent, small, or homeotic)-like |
| Increased expression in Prader–Willi syndrome | |||||
| SRRM2 | +4.3 | 9.00E-05 | AC004493 | 16p13.3 | Serine/arginine repetitive matrix 2 |
| Transcript | +2.2 | 3.41E-04 | AC007228 | 19q13.43 | Transcribed sequence |
| Transcript | +2.1 | 7.49E-04 | AI869296 | 19q13.42 | Transcribed sequence |
| RREB1 | +2.1 | 2.08E-04 | BF591556 | 6p25 | ras responsive element binding protein 1 |
| FXYD3 | +2.0 | 2.19E-04 | NM_005971 | 19q13.13 | FXYD domain containing ion transport regulator 3 |
| Transcript | +2.0 | 7.40E-05 | BC015876 | 12q13.3 | Homo sapiens cDNA clone IMAGE:4715948, partial cds. |
| Transcript | +1.9 | 2.88E-04 | AI760978 | 15q26.3 | Similar to RIKEN cDNA |
| Transcript | +1.9 | 5.52E-04 | BC035102 | 10q21.3 | Clone IMAGE:5262215, mRNA |
| Transcript | +1.9 | 1.58E-04 | AW080025 | 12q13.3 | Transcribed sequences |
| E2F5 | +1.8 | 3.35E-05 | AW139195 | 8q21.2 | E2F transcription factor 5, p130-binding |
| SDAD1 | +1.7 | 2.91E-04 | AA768015 | 4q21.21 | Hypothetical protein FLJ10498 |
| POLR2C | +1.7 | 6.31E-04 | AJ224143 | 16q13-q21 | Polymerase (RNA) II (DNA directed) polypeptide C |
| FLJ10846 | +1.7 | 3.53E-04 | NM_018241 | 4q31.22 | Hypothetical protein FLJ10846 |
| OFD1 | +1.7 | 1.51E-04 | AW292752 | Xp22.2-p22.3 | Oral-facial-digital syndrome 1 |
| FLJ14082 | +1.7 | 3.13E-04 | NM_025024 | 2q11.2 | Hypothetical protein |
| SCAMP5 | +1.6 | 6.28E-04 | BE222801 | 15q23 | mRNA sequence contains TAR1 repetitive element |
| CRELD1 | +1.5 | 4.71E-04 | NM_015513 | 3p25.3 | Cysteine-rich with EGF-like domains 1 |
| UBAP1 | +1.5 | 1.46E-04 | AL136733 | 9p22-p21 | Ubiquitin-associated protein 1 |
| CDC5L | +1.5 | 1.93E-04 | AB007892 | 6p21 | CDC5 cell division cycle 5-like |
| Transcript | +1.5 | 8.36E-05 | AK026869 | 3p25.1 | Transcribed sequence |
Table II.
Sixteen Genes With a Significant Change in Intensity Comparing the Seven Prader–Willi Syndrome Males to the Three Comparison Males With a 10% False Discovery Rate
| Gene | Fold change | P-value | Genbank acc. | Chromosome location | Description |
|---|---|---|---|---|---|
| DKFZp434E0519 | +2.3 | 0.001 | AL136788 | 3p25.2 | Hypothetical protein DKFZp434E0519 |
| Transcript | +2.1 | 7.49E-04 | AI869296 | 19q13.42 | Transcribed sequence |
| Transcript | +1.9 | 5.52E-04 | BC035102 | 10q21.3 | Clone IMAGE:5262215, mRNA |
| SCAMP5 | +1.6 | 6.28E-04 | BE222801 | 15q23 | Transcribed sequence |
| SNRPNa | −68.8 | 2.58E-06 | NM_022804a | 15q11.2 | Small nuclear ribonucleoprotein polypeptide N |
| Transcripta | −32.4 | 3.22E-05 | BE783065a | 15q11.2 | Clone IMAGE:5288750, mRNA (contains Alu sequences) |
| HBII-85 | −19.9 | 8.48E-04 | AW770748 | 15q11.2 | snoRNA |
| Transcript | −18.7 | 2.88E-04 | AL520272 | 12q13.13 | Transcribed sequence |
| CNN3 | −8.7 | 8.52E-04 | NM_001839 | 1p22-p21 | Calponin 3, acidic |
| IPWa | −6.8 | 4.45E-05 | AI672541a | 15q12 | Imprinted in Prader–Willi syndrome |
| LUC7Aa | −2.6 | 2.08E-04 | AA005430a | 17q21 | Cisplatin resistance-associated overexpressed protein |
| USP6 | −2.0 | 6.16E-04 | AA291110 | 17q11 | Ubiquitin specific protease 6 (Tre-2 oncogene) |
| Transcripta | −1.9 | 9.08E-05 | BE675040a | 11q24.3 | Transcribed sequence |
| MHC2TA | −1.7 | 4.73E-04 | NM_000246 | 16p13 | MHC class II transactivator |
| MAN1B1 | −1.6 | 8.43E-04 | AA631254 | 9q34 | Mannosidase, alpha, class 1B, member 1 |
| ELAC2 | −1.6 | 4.01E-04 | NM_018127 | 17p11.2 | elaC homolog 2 (E. coli) |
fdr of 5%.
Analysis of Specific Pathways
We grouped the 303 genes that had a significant change in expression of at least 1.5-fold between the PWS subjects relative to the comparison subjects in functional categories using Ingenuity Pathways Analysis software (Ingenuity Systems, Mountain View, CA, http://www.ingenuity.com/index.html). Several categories were statistically over represented in the list of the top ten categories including 24 genes for gene expression; 19 genes for hematological system development and function; 16 genes for tissue morphology; 14 genes for nervous system development and function; 14 genes for cancer; 13 genes for immune and lymphatic system development and function; 13 genes for cellular assembly and organization; 13 genes for organismal survival; 11 genes for organismal development; and 11 genes for cellular growth and proliferation. Two lists of genes were assembled by searching for the keywords “neurodevelopment” and “lipid metabolism and/or obesity” for small group analysis with the aid of Ingenuity Pathways Analysis software and the Entrez Gene database (http://www.ncbi.nlm.nih.gov/entrez/query.fcgi?db=gene).
Neurodevelopment Genes
Because PWS is a neurodevelopmental disorder, a list of genes was created relating to neurological development and function as identified by the Ingenuity Pathways Analysis software. The list contained 889 probes found on our array which met the inclusion criteria. Analysis of this set of genes produced 14 that had a significant change in expression (at least 1.5-fold with an fdr of 20%, Table III). We then created a set of 900 random gene probes from the microarray and graphically represented their expression (Fig. 1A) to allow a comparison with a list of neurological genes (Fig. 1B). Comparison of the graphical images (Fig. 1A,B) revealed a wider range of color variation (probe intensity differences, either increased or decreased) in the subjects with PWS than in the control individuals for the neurodevelopment and function genes relative to the set of random probes.
Table III.
Genes With a Significant Change of Expression (≥1.5 Fold With False Discovery Rate of 20%) in Small Group Analysis Comparing Mean Intensity Signal Value in Prader-Willi Syndrome Males Relative to Median Intensity Signal Value for Control Males
| Gene | Fold change | Genbank acc. | Chromosome location | Function |
|---|---|---|---|---|
| Neurodevelopment | ||||
| LMX1A | +9.4 | NM_177398 | 1q22-q23 | LIM homeobox transcription factor 1, alpha |
| GRIN2B | +5.8 | U90278 | 12p12 | Glutamate receptor, ionotropic, N-methyl D-aspartate 2B |
| TH | +5.3 | NM_000360 | 11p15.5 | Tyrosine hydroxylase |
| PAX2 | +4.9 | AW769732 | 10q24 | Paired box gene 2 |
| TNRC4 | +4.7 | NM_007185 | 1q21 | Trinucleotide repeat containing 4 |
| ACHE | +3.1 | AI190022 | 7q22 | Acetylcholinesterase |
| RPGRIP1 | +1.5 | NM_020366 | 14q11 | Retinitis pigmentosa GTPase regulator interacting protein 1 |
| SLC17A1 | −10.0 | AW779672 | 6p23-p21.3 | Solute carrier family 17 (sodium phosphate), member 1 |
| SIX3 | −5.0 | NM_005413 | 2p16-p21 | Sine oculis homeobox homolog 3 |
| SAG | −5.0 | NM_000541 | 2q37.1 | S-antigen; (arrestin) |
| NTSR1 | −2.0 | NM_002531 | 20q13.33 | Neurotensin receptor 1 |
| NOTCH1 | −1.5 | NM_017617 | 9q34.3 | Notch homolog 1 |
| UBE3A | −1.5 | U84404 | 15q11-q13 | Ubiquitin protein ligase E3A |
| NHLH2 | −1.5 | NM_005599 | 1p12-p11 | Nescient helix loop helix 2 |
| Lipid metabolism/obesity | ||||
| INMT | +5.6 | AF128846 | 7p15.3-p15.2 | Indolethylamine N-methyltransferase |
| SNRPN | −68.8 | NM_022804 | 15q11.2 | Small nuclear ribonucleoprotein polypeptide N |
| STAR | −5.0 | NM_000349 | 8p11.2 | Steroidogenic acute regulatory protein |
| GABA receptors | ||||
| GABRA4 | +12.6 | NM_000809 | 4p12 | GABA-A receptor, alpha 4 |
| GLRA2 | +6.1 | NM_002063 | xp22.1-p21.3 | Glycine receptor, alpha 2 |
| GABRG2 | +5.0 | BC036030 | 5q31.1-q33.1 | GABA-A receptor, gamma 2 |
| GLRB | +1.5 | AF094754 | 4q31.3 | Glycine receptor, beta |
| GABRA2 | −3.3 | BC022488 | 4p12 | GABA-A receptor, alpha 2 |
| GABRD | −1.5 | NM_000815 | 1p36.3 | GABA-A receptor, delta |
| Serotonin receptors | ||||
| HTR1B | +6.5 | M81590 | 6q13 | Serotonin receptor 1B |
| HTR3A | +1.5 | AJ005205 | 11q23.1 | Serotonin receptor 3A |
| HTR2B | −10.0 | NM_s000867 | 2q36.3-q37.1 | Serotonin receptor 2B |
| Candidate genes | ||||
| HCRT | +19.4 | NM_001524 | 17q21 | Hypocretin (orexin) neuropeptide |
| MCR2 | −2.0 | NM_000529 | 18p11.2 | Melanocortin 2 receptor |
| ADIPOR2 | −1.5 | NM_024551 | 12p13.31 | Adiponectin receptor 2 |
| OXTR | −1.5 | NM_000916 | 3p25 | Oxytocin receptor |
Fig. 1.
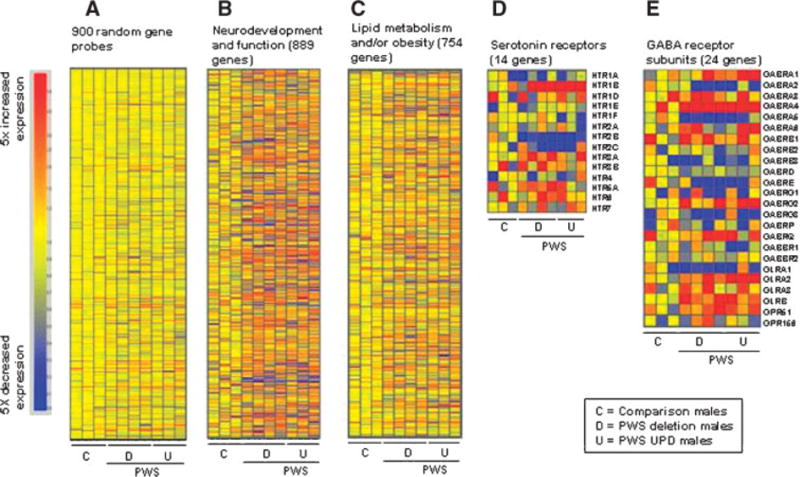
Heat maps of microarray data of groups of genes from the three comparison males followed by the four PWS deletion subjects and three PWS UPD subjects. A: 900 probes chosen at random from the 23,383 probes meeting inclusion criteria, (B) neurodevelopment and function genes, (C) lipid metabolism and/or obesity genes, (D) serotonin receptor genes, and (E) GABA receptor subunit genes.
Lipid Metabolism and/or Obesity-Related Genes
Since PWS causes metabolic changes resulting in altered fat utilization and deposition, we similarly assembled a list of genes related to lipid metabolism and/or obesity. There were 754 probes on our arrays associated with lipid metabolism and/or obesity and 191 of these had a change in expression of at least 1.5-fold. Three of these had changes between PWS and control subjects which were significant, INMT (indolethylamine N-methyltransferase), STAR (steroidogenic acute regulator), and SNRPN (Table III). Figure 1C shows the heatmap of the 754 lipid associated genes. In addition, we performed quantitative RT-PCR (QRT-PCR) on STAR using RNA from both lymphoblastoid cells and from brain tissue (frontal cortex) from a separate group of PWS and control subjects to validate the gene expression findings from the microarray study. There was reduced RNA from STAR in both tissue sources of RNA in subjects with PWS relative to controls (Table IV, Fig. 2A,B) in agreement with the micro-array data using RNA from lymphoblastoid cells.
Table IV.
Comparison of Gene Expression Data for RNA Isolated From Lymphoblastoid Cells and Brain Tissue (Frontal Cortex) From Prader–Willi Syndrome (PWS) or Comparison Subjects
| Gene | Lymphoblastoid cells
|
Frontal cortex
|
|||||||
|---|---|---|---|---|---|---|---|---|---|
| Microarray (intensity units)a
|
QRT-PCR (normalized CT)b
|
QRT-PCR (normalized CT)b
|
|||||||
| Obese (n = 3) | PWS (n = 7) | Gene fold change | Obese (n = 3) | PWS (n = 7) | Gene fold changec | controls (n = 3) | PWS (n = 7) | Gene fold changec | |
| SAG | 1.0±0.1 (0.9–1.1) | 0.2±0.3 (0.1–0.7) | −4.3 | 19.3±3.8 (15.3–22.6) | 22.5±4.0 (17.6–28.4) | −9.2 | 22.2±1.7 (20.2–23.4) | 20.1±0.8 (19.4–21.0) | 4.3 |
| OXTR | 1.2±0.4 (0.9–1.7) | 0.7±0.3 (0.4–1.3) | −1.7 | 17.3±1.8 (15.4–18.3) | 20.2±1.4 (18.8–22.8) | −7.5 | 25.9±0.7 (25.6 – 26.5) | 27.2±0.7 (26.7–27.8) | −2.5 |
| STAR | 1.0±0.1 (0.9–1.1) | 0.2±0.2 (0.1–0.3) | −5.4 | 22.7±2.9 (19.0–24.1) | 26.6±2.1 (24.7–29.7) | −14.9 | 23.3±1.6 (21.2 – 24.0) | 27.4±2.3 (24.9–29.3) | −17.2 |
| HCRT | 2.3±7.4 (0.8–13.8) | 19.4±7.9 (10.4–31.6) | 8.6 | 15.6±2.1 (13.6–17.9) | 17.9±3.6 (15.8–24.4) | −5.3 | 13.7±0.5 (13.2–14.3) | 17.5 ± 1.54 (16.2–19.2) | −13.9 |
| HTR2B | 1.0±0.6 (0.6–1.7) | ndd | 18.5±1.5 (16.9–19.9) | 21.4±4.4 (16.8–28.4) | −7.5 | 24.0±2.0 (22.1 –26.1) | 27.9 ± 3.3 (24.1–30.3) | −14.9 | |
Microarray intensity units represent internally normalized data. Using GeneSpring software, microarray data were normalized to produce similar global intensity signals across arrays. A comparison value was developed by taking the mean value of expression of the gene from the controls. The individual gene data were then divided by the comparison value to produce a ratio relative to the comparison value. The mean ± standard deviation and range (in parenthesis) relative to the comparison value are shown.
CT values given are normalized values relative to GAPD expression (see Methods for description of normalization process) to account for quantity and quality differences between RNA samples.
Fold change for quantitative RT-PCR (QRT-PCR) data are calculated using the formula 2|Control CT–PWS CT| where a difference of one cycle represents a twofold change in gene expression. CT equals the normalized cycle threshold set at the signal intensity which exceeds the detection threshold at the narrowest point of the logarithmic phase of PCR amplification.
nd, not detected.
Fig. 2.
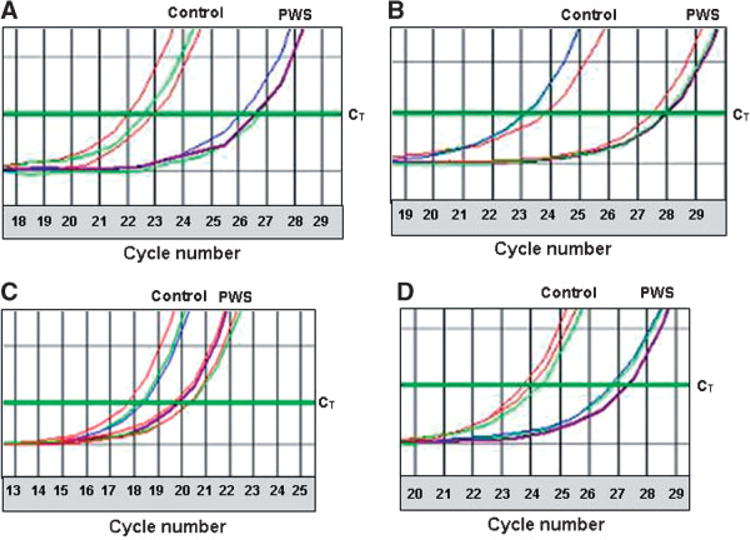
Representative examples of quantitative RT-PCR assays using RNA from lymphoblastoid cells from three controls and four PWS males and the frontal cortex from a separate group of three controls and three PWS females from the NIH brain and tissue banks for both STAR and HTR2B clearly showing reduced gene expression in the PWS subjects in both lymphoblastoid cells and frontal cortex. The cycle threshold (CT) for sample comparison was set at the narrowest portion of the logarithmic phase of PCR cycle amplification at which the signal intensity exceeds the detection threshold. Reported CT values were normalized relative to GAPD expression (see Methods for description of normalization process) to account for quantity and quality differences between RNA samples. A: Representative quantitative RT-PCR with primers specific to STAR using RNA from lymphoblastoid cells. The GAPD normalized mean CTs were 22.7 and 26.6 for obese and PWS subjects respectively which represents a 14.9-fold reduction in the PWS subjects. B: Representative quantitative RT-PCR with primers specific to STAR using RNA from the frontal cortex. The GAPD normalized mean CTs were 23.3 and 27.4 for comparison and PWS subjects respectively which represents a 17.2-fold reduction in the PWS subjects. C: Representative quantitative RT-PCR with primers specific to HTR2B using RNA from lymphoblastoid cells. The GAPD normalized mean CTs were 18.5 and 21.4 for obese and PWS subjects respectively which represents a 7.5-fold reduction in the PWS subjects. D: Representative quantitative RT-PCR with primers specific to HTR2B using RNA from frontal cortex. The GAPD normalized mean CTs were 24.0 and 27.9 for comparison and PWS subjects respectively which represents a 14.9-fold reduction in the PWS subjects.
Genes Involved in Serotonin Regulation
Serotonin reuptake inhibitors are frequently used to treat behavioral problems seen in PWS [Bittel and Butler, 2005], therefore we elected to analyze the serotonin receptor genes. There were 14 probes for serotonin receptor genes on the array. One of the receptor genes (HTR2B) was expressed at a significantly lower level and two (HTR1B, HTR3A) were expressed significantly higher in our PWS subjects relative to comparison subjects. A graphical representation of the serotonin genes is shown in Figure 1D. We then verified the change in expression of HTR2B by quantitative RT-PCR in lymphoblastoid cells and in available brain tissue (frontal cortex) from PWS and control subjects. The PWS subjects had a cycle threshold (CT) value of 2.9 and 3.9 cycles larger than in the comparison subjects from lymphoblastoid cells and frontal cortex, respectively (Fig. 2C,D). This reflects a 7.5- and 14.9-fold reduction in HTR2B gene expression in our PWS subjects relative to the controls in agreement with our microarray data (Table IV).
GABA Receptor Subunit Gene Family
PWS subjects are reported to have increased circulating GABA levels [Ebert et al., 1997] and the presence of three GABA receptor subunit genes (GABRA5, GABRB3, and GABRG3) in the 15q11-q13 region suggests the possibility of perturbation of the GABA signaling network in PWS. There are two types of GABA receptors, GABAA and GABAB. The microarrays contained 24 GABAA receptor subunit genes, including GABRA5, GABRB3, and GABRG3 from 15q11.2-q12. The signal intensity was low but detectable in lymphoblastoid cells for two of the three GABAA receptor subunit genes on chromosome 15 (GABRA5 and GABRB3). However, the third GABAA receptor subunit probe (GABRG3) was only detectable in brain tissue as discussed later. GABRA5 and GABRB3 had reduced expression in PWS subjects relative to comparison subjects consistent with our previous observations [Bittel et al., 2003, 2005]. Additionally, four members of the GABA receptor subunit family had robust signals and significantly higher expression (at least 1.5-fold higher) in PWS subjects relative to comparison subjects (GABRG2, GABRA4, GLRB, GLRA2) and two had significantly reduced expression in PWS (GABRA2, GABRD) relative to the comparison subjects (Table III, Fig. 1E). There were five GABAB receptor subunit genes on the microarray but none of them had a detectable significant change in expression between the PWS subjects and comparison subjects.
Chromosome 5q31-q33 (Homologous to Mouse 18B3)
Recently, gene expression analysis of a mouse model of PWS with a deletion in the region homologous to human 15q11-q13 demonstrated modestly increased expression in eight genes, all of which were tightly linked on mouse chromosome 18B3 [Stefan et al., 2005]. We examined gene expression from the corresponding chromosome region in human, 5q31-q33. We could detect expression from only two of these genes on our microarrays, LARS and TCERG. We could detect no change in gene expression between PWS and comparison subjects for either gene using small group analysis. Furthermore, we examined the pattern of expression of all the detectable genes in the 5q31-q33 region (333 probes) and saw no significant changes in expression between PWS subjects and comparison subjects. The mice evaluated by Stefan et al. [2005] resulted from an insertion, making them similar to a human PWS deletion subject. Therefore, we repeated the analysis comparing only the PWS deletion subjects to the comparison subjects but again did not find statistically significant changes in expression of any genes studied in the 5q31-q33 region.
Imprinted Genes
PWS was the first human disorder reported involving defects in genomic imprinting. To determine if the defect on chromosome 15 produces alterations of other imprinted genes outside of chromosome 15, we examined the signal intensity changes for probes of all known imprinted genes contained on the arrays. As expected, we detected no measurable signal from paternally expressed genes in the 15q11-q13 region, SNRPN, IPW and the snoRNA HBII-85 in the PWS subjects. The expression of NDN, MAGEL2, and MKRN3 were below the level of detection for all samples. There were 52 probes on the array for genes known to be imprinted (identified using the Genomics Imprinting website: http://www.geneimprint.-com/) and 18 of those produced detectable signals and met the inclusion criteria. Of those 18 genes, three had expression reduced by at least 1.5-fold: SNRPN, IPW, and UBE3A, all from the 15q11-q13 region. Thus, disruption of chromosome 15 imprinting in PWS does not alter expression of imprinted genes residing in other areas of the genome.
The expression of UBE3A was very uniform within the PWS groups and was significantly reduced in the deletion subjects with one maternal allele compared to the control subjects. However, UBE3A expression was slightly higher (although not significantly) in our UPD subjects with two maternal alleles compared to the control subjects. These data are consistent with our previous report that UBE3A is expressed from both alleles in lymphoblasts but with maternal bias [Bittel et al., 2003, 2005].
Analysis of Selected Candidate Genes Outside the 15q11-q13 Region
The genes identified in the 15q11-q13 region have not been consistently linked to a specific phenotype related to PWS with the possible exception of NDN [Lee et al., 2005]. Therefore, it is probable that the loss of expression of these genes results in expression changes in other genes which produces the PWS phenotype. We and others [Bittel and Butler, 2005] have suggested a number of possible candidate genes that may contribute to the clinical manifestations of PWS (e.g., ghrelin and its receptors, oxytocin, POMC). Many of these probes had very weak signals in the current analysis. However, a small number of genes are worth noting as they had measurable changes in expression. We detected a reduction in expression of oxytocin receptor (OXTR), adiponectin receptor 2 (ADIPOR2), and melanocortin 2 receptor (MC2R) (Tables III and IV). Quantitative RT-PCR using RNA from frontal cortex in PWS and comparison subjects, indicated a significant reduction in HCRT expression (Table IV) in this tissue which is supportive of a report that orexin protein is reduced in the cerebrospinal fluid of PWS subjects compared to controls [Nevsimalova et al., 2005].
Prader–Willi Syndrome Deletion Versus UPD
We analyzed the 23,383 detectable probes for differences in signal intensity between the PWS deletion and PWS UPD subjects. We found that 2,771 probes had a difference of at least 1.5-fold: 1,460 were higher in PWS deletion subjects and 1,311 were higher in PWS UPD subjects. Of the 2,441 probes with a change in signal intensity of 1.5-fold, only three genes showed significant expression differences between the two groups with an fdr of 20%; SLC12A2, ARHGAP26, GPR89 (P-values; 0.005, 0.004, and 0.002, respectively). All three were more highly expressed in the deletion group.
Analysis of Chromosome 15 Gene Expression Bias in UPD Versus Control
PWS subjects with deletions have biallelic expressed genes (maternal and paternal) outside the 15q11-q13 region while PWS subjects with UPD have two maternal copies of all genes on chromosome 15. Therefore, we compared expression between PWS subjects with UPD to control subjects for genes on chromosome 15 located outside the PWS 15q11-q13 critical region to identify perturbations that might suggest higher order gene regulation (e.g., maternal/paternal bias). A total of 1,290 probes assigned to chromosome 15 were present on the array and 658 met the inclusion criteria for further analysis of expression differences. In the PWS UPD subjects compared to the control subjects, four probes showed statistically significant differences in expression of at least 1.5-fold with an fdr of 20%. Three of these genes (KIAA0377, AKAP13, PEX11A) had lower levels of expression in the PWS UPD (P-values; 0.02, 0.004, and 0.03, respectively) subjects indicating paternal bias since the two maternal alleles produced less RNA (paternal bias) than the maternal and paternal allele of the comparison subjects. Conversely, one gene (ABHD2) had increased expression in the PWS UPD subjects (P-value, 0.03) indicating two maternal alleles produced more RNA (maternal bias) than a maternal and paternal allele of the comparison subjects.
Two approaches were undertaken to validate the results and interpretation of data from the microarray assays on RNA isolated from lymphoblastoid cells from PWS and obese comparison subjects. These include: (1) quantitative RT-PCR analyses of selected genes identified from the microarray assays using RNA from lymphoblastoid cells and; (2) analysis of RNA isolated from a different tissue source (brain— frontal cortex) from a separate group of control subjects and individuals with PWS. The results of our validation experiments were generally compatible with our microarray analyses of RNA from lymphoblastoid cells. A summary of the gene expression results can be seen in Table IV.
DISCUSSION
Prader–Willi syndrome originates with the loss of expression of paternally expressed genes on 15q11-q13, which directly or indirectly causes the dysregulation of genes that control neurodevelopment, metabolism, and behavior. While the underlying expression changes in the 15q11-q13 region have been delineated, little is known about the global effects on gene expression that result from disruption of this region. Whole genome expression analysis together with validation by other approaches such as quantitative RT-PCR using lymphoblastoid cell lines and brain tissue can begin to identify the downstream transcriptional effects of the PWS chromosome 15 disruption.
We validated our results from lymphoblasts by performing quantitative RT-PCR on SAG, OXTR, STAR, HCRT, and HTR2B, genes identified from the microarray analysis with differential expression in PWS. As seen in Table IV, we found general agreement between our microarray and QRT-PCR data using RNA from lymphoblastoid cells and frontal cortex from PWS and comparison subjects. Similarly, change of expression was in agreement between the two RNA sources (brain and lymphoblasts). For example, no signal was detected from the probe for HTR2B on the microarrays and from the subjects with PWS but there was detectable signal from the comparison subjects. Quantitative RT-PCR data showed a 7.5-fold reduction in PWS lymphoblast RNA compared to controls and a 14.9-fold reduction in frontal cortex RNA from PWS compared to controls supporting our observations from the microarray analysis performed on RNA isolated from actively growing lymphoblastoid cells.
Using two approaches to validate the interpretation of microarray data from lymphoblastoid cells (e.g., QRT-PCR and another tissue source of RNA), we observed two examples of gene expression discordance (Table IV). For example, our validation using QRT-PCR with RNA from lymphoblastoid cells showed discordance for HCRT (gene expression fold change for microarray was 8.6 vs. −5.3). However, two of our three obese subjects showed very low intensity signal units (0.8 and 1.0) for HCRT on the microarrays compared with the seven PWS subjects (range 10.4–31.6) and the third control (13.8). In addition, only one probe for the HCRT gene was available on the microarray. Therefore, we would consider the QRT-PCR data to be more reliable for determining the expression status for this gene. A second example of gene expression discordance was found with the use of a separate tissue source of RNA, that is, lymphoblastoid cells versus frontal cortex (gene expression fold change for SAG was −9.2 in lymphoblastoid cells and 4.3 in the frontal cortex using QRT-PCR). In addition, our frontal cortex tissue samples were obtained from lean controls while the lymphoblastoid cell lines were established from obese subjects thus raising the possibility of the obese status as well as tissue type as factors contributing to the gene expression discordance.
Furthermore, by setting our fdr at 20%, we expect one out of five detected differences in expression with microarray analysis to be false positives. As an acceptable approach, we allowed false positives (i.e., 20%) in order to improve the chance of discovering a larger number of potential genes of importance which may contribute to the phenotype but should be validated with further studies.
Changes in Gene Expression Between PWS and Comparison Subjects
About 50% of the probes on the microarray were detectable and met the inclusion criteria (23,383 of 47,000). Approximately 1.4% of the detectable probes (323 of 23,383) had a significant change in signal intensity of 1.5-fold or greater with a fdr of 20% in PWS subjects relative to obese comparison subjects. Of these 323 probes with a significant change in expression only 50 (5 up and 45 down) had a threefold or greater change in expression between the PWS subjects and the comparison subjects which represents less than 0.3% of the detectable probes on the array. Figure 1 contains heat maps of (A) 900 gene probes chosen at random from the 23,383 probes meeting inclusion criteria, (B) neurodevelopment and function genes, (C) lipid metabolism and/or obesity genes, (D) serotonin receptor genes, and (E) GABA receptor subunit genes. The maps are arranged with the three comparison males first followed by the four PWS deletion subjects and then the three PWS UPD subjects. The maps present a visual image of an overall difference in the PWS subjects that is particularly evident in the neurodevelopment gene group compared to the random group. There is a distinct change in the shading pattern in the PWS subjects relative to the controls perhaps reflecting a subtle trend of misregulation of neurodevelopmental gene expression.
Lipid Metabolism
PWS is often thought of as an obesity syndrome resulting from dysregulation of genes which regulate metabolism and/or energy homeostasis. However, it has been suggested that PWS may result primarily from neurodevelopmental abnormalities with weight gain and fat accumulation secondary to disruption of neurological and hormonal networks [Bittel and Butler, 2005]. We analyzed the lipid metabolism/obesity-related genes on the microarray as a separate group to help increase the precision of the analysis. Surprisingly, the only genes which were significantly different in expression between the PWS subjects and obese comparison subjects were INMT, STAR, and SNRPN. This suggests that lipid metabolism, fat accumulation and deposition and energy homeostasis do not differ greatly between our PWS and obese subjects, at least as measured by changes in gene expression in lymphoblastoid cell lines.
Interestingly, the expression of the STAR gene is reduced in our PWS subjects in both lymphoblastoid cells and frontal cortex. STAR plays a key role in the acute regulation of steroid hormone synthesis by enhancing the conversion of cholesterol into pregnenolone. This observation is supported by steroid metabolite disturbances previously reported in PWS [Chasalow et al., 1987]. Specifically, Chasalow et al. [1987] reported that PWS subjects secreted large amounts of sulfo-conjugates, including dehydroepiandrosterone (DHEA) and mono- and dihydroxypregnenolone. In addition, pregnane steroids can potently and specifically enhance GABAA receptor function acting as remote endocrine messengers [Lambert et al., 2003; Belelli and Lambert, 2005]. Neurosteroids can also be synthesized in the brain, where they modify neuronal activity locally by modulating GABAA receptor function, thus influencing mood and behavior in various physiological and pathophysiological situations. It is possible that reduced expression of STAR in PWS subjects could result in misregulation of neurosteroids, exacerbating defects in the already disorganized GABA neuroinhibitory network. STAR has also been shown to regulate POMC expression [Caron et al., 1997], potentially impacting networks of numerous genes of importance for understanding PWS, including the melanocortin and oxytocin receptors.
As noted, another interesting gene identified in our study having significantly lower expression in the PWS subjects relative to comparison subjects was SAG (arrestin) which was verified by QRT-PCR in lymphoblastoid cells and frontal cortex. Arrestins are thought to participate in agonist-mediated desensitization of G-protein-coupled receptors (e.g., opioid receptors) and cause specific dampening of cellular responses to stimuli such as hormones or neurotransmitters. B-arrestins serve as adaptors, scaffolds, and/or signal transducers, and they connect activated receptors to diverse signaling pathways within the cell [Lefkowitz and Shenoy, 2005]. Dysregulation of the opioid receptors has been linked to behavioral and eating disorders, including hyperphagia, decreased pain sensitivity and self-injury, all commonly seen in PWS subjects. Additional studies to quantify the protein level and function of these neural systems in individuals with PWS are warranted to determine their potential role in the PWS phenotype.
Receptor Genes
Six GABA receptor family genes (GABRG2, GABRA4, GLRA2, GLRB, GABRA2, GABRD, Table III) had significant changes in expression. Of particular interest is GABRA4 which was recently identified as a candidate gene in the etiology of autism, potentially increasing the risk of autism through an interaction with GABRB1 [Ma et al., 2005]. We also noted a change in three serotonin receptor genes (HTR1B, HTR2B, HTR3A, Table III), and verified by QRT-PCR with a significant reduction in expression of HTR2B in the PWS subjects in both lymphoblasts and brain tissue. We also saw a reduction in expression of MC2R and an OXTR. Taken together these results suggest a subtle pattern of disruption of hormone receptor networks.
Genes on Chromosome 15 That may Have Bias in Expression Pattern
We analyzed probes on chromosome 15, excluding the probes for genes within 15q11-q13, for higher order regulatory mechanisms which might influence allele specific expression. Comparing the expression level of the PWS UPD subjects, with two maternal copies of chromosome 15, to the comparison subjects with one maternal and one paternal copy revealed transcripts with maternal allelic bias (higher expression from the PWS UPD subjects) or paternal bias (lower expression from the PWS UPD subjects). Out of 1,290 probes on chromosome 15 analyzed, four had significant differences in expression in the PWS UPD subject relative to the comparison subjects, three had paternal bias and one had maternal bias. As expected, there was no significant change in signal intensity of these probes in the PWS deletion subjects relative to the controls since maternal and paternal copies of each gene are present outside the deleted region.
These studies focused on lymphoblastoid cell line-derived RNA as a source of readily available samples. A recent microarray analysis relevant to the current study is an analysis of global gene expression in brain tissue from a mouse model of PWS [Stefan et al., 2005]. The functional and regulatory mechanisms of the PWSCR are conserved in mice. Microarray analysis of a 12,000 gene array revealed dramatically reduced expression of imprinted genes in the PWSCR from brains of PWS-Tg mice postnatal day 1 compared to control mice [Stefan et al., 2005]. Surprisingly, only three genes outside the PWSCR were detected with significantly altered expression. These three genes were all modestly upregulated and were located in close proximity to each other on mouse chromosome 18. Analysis of human lymphoblastoid RNA identified a greater number of genes with altered expression, but these did not include those genes identified in the mouse. These discrepancies may be attributable to differences in species, tissue, or age between the sample sets. More similar to the current analysis, a microarray study of human fibroblasts derived from an individual with PWS who was mosaic for cells with UPD identified a number of gene expression changes but with relatively little overlap with changes in expression identified in our analysis of lymphoblastoid cells [Horsthemke et al., 2003]. Horsthemke et al. [2003] noted a strong reduction in mRNA levels in PWS UPD fibroblast cells of the gene encoding secretogranin II (SCG2), which is a precursor of the dopamine releasing factor secretoneurin. They speculated that hyperphagia in patients with PWS might be due to a defect in dopamine processing. We observed a significant reduction in SCG2 expression, although only about a 30% reduction, which is below our selection criteria of a 1.5-fold change, in the PWS subjects. Therefore, our measurement of SCG2 mRNA in subjects with PWS is in general agreement with that of Horsthemke et al. [2003]. Additional caveats include the small sample size in all of these studies, and the generally modest changes in gene expression levels. Further, individual variation may mask important changes in expression, especially since the magnitude of change is small. The number of probes with detectable differences in signal intensity between our PWS subjects and our comparison subjects is relatively small but some of the identified genes are of great interest in PWS causation, for example SAG and STAR, which have not been previously considered in the etiology of PWS. These genes will need further analysis in a larger number of subjects. In addition, the magnitude of the change in expression is also small, with the exception of the genes on chromosome 15q11-q13. Perhaps the most interesting observation regarding these data are the number of receptor genes that were observed to have modest reductions in expression. These included GABA, serotonin, melanocortin, oxytocin, and adiponectin receptors. This may suggest a common pattern of transcriptional regulation of these receptor genes that may be subtly influenced by genes on chromosome 15q11-q13.
Acknowledgments
This research was supported by the NIH (NICHD grant number 5R21HD040788-02 and RO141672), the Hall Foundation of Kansas City and the Kansas City Area Life Science Institute. We also acknowledge the NICHD Brain and Tissue Bank for Developmental Disorders (University of Maryland and University of Miami) for providing brain tissue on subjects utilized in our study.
References
- Belelli D, Lambert JJ. Neurosteroids: Endogenous regulators of the GABA(A) receptor. Nat Rev Neurosci. 2005;6:565–575. doi: 10.1038/nrn1703. [DOI] [PubMed] [Google Scholar]
- Bittel DC, Butler MG. Prader-Willi syndrome: Clinical genetics, cytogenetics and molecular biology. Expert Rev Mol Med. 2005;7:1–20. doi: 10.1017/S1462399405009531. [DOI] [PMC free article] [PubMed] [Google Scholar]
- Bittel DC, Kibiryeva N, Talebizadeh Z, Butler MG. Microarray analysis of gene/transcript expression in Prader-Willi syndrome: Deletion versus UPD. J Med Genet. 2003;40:568–574. doi: 10.1136/jmg.40.8.568. [DOI] [PMC free article] [PubMed] [Google Scholar]
- Bittel DC, Kibiryeva N, Talebizadeh Z, Driscoll DJ, Butler MG. Microarray analysis of gene/transcript expression in Angelman syndrome: Deletion versus UPD. Genomics. 2005;85:85–91. doi: 10.1016/j.ygeno.2004.10.010. [DOI] [PMC free article] [PubMed] [Google Scholar]
- Bittel DC, Kibiryeva N, Dasouki M, Knoll JH, Butler MG. A 9-year-old male with a duplication of chromosome 3p25.3p26.2: Clinical report and gene expression analysis. Am J Med Genet Part A. 2006;140A:573–579. doi: 10.1002/ajmg.a.31132. [DOI] [PMC free article] [PubMed] [Google Scholar]
- Boccaccio I, Glatt-Deeley H, Watrin F, Roeckel N, Lalande M, Muscatelli F. The human MAGEL2 gene and its mouse homologue are paternally expressed and mapped to the Prader-Willi region. Hum Mol Genet. 1999;8:2497–2505. doi: 10.1093/hmg/8.13.2497. [DOI] [PubMed] [Google Scholar]
- Butler MG, Thompson T. Prader-Willi syndrome: Clinical and genetic findings. Endocrinol. 2000;10:35–165. doi: 10.1097/00019616-200010041-00002. [DOI] [PMC free article] [PubMed] [Google Scholar]
- Caron KM, Soo SC, Wetsel WC, Stocco DM, Clark BJ, Parker KL. Targeted disruption of the mouse gene encoding steroidogenic acute regulatory protein provides insights into congenital lipoid adrenal hyperplasia. Proc Natl Acad Sci USA. 1997;94:11540–11545. doi: 10.1073/pnas.94.21.11540. [DOI] [PMC free article] [PubMed] [Google Scholar]
- Cassidy SB, Forsythe M, Heeger S, Nicholls RD, Schork N, Benn P, Schwartz S. Comparison of phenotype between patients with Prader-Willi syndrome due to deletion 15q and uniparental disomy 15. Am J Med Genet. 1997;68:433–440. [PubMed] [Google Scholar]
- Cavaille J, Buiting K, Kiefmann M, Lalande M, Brannan CI, Horsthemke B, Bachellerie JP, Brosius J, Huttenhofer A. Identification of brain-specific and imprinted small nucleolar RNA genes exhibiting an unusual genomic organization. Proc Natl Acad Sci USA. 2000;97:14311–14316. doi: 10.1073/pnas.250426397. [DOI] [PMC free article] [PubMed] [Google Scholar]
- Chasalow FI, Blethen SL, Tobash JG, Myles D, Butler MG. Steroid metabolic disturbances in Prader-Willi syndrome. Am J Med Genet. 1987;28:857–864. doi: 10.1002/ajmg.1320280410. [DOI] [PMC free article] [PubMed] [Google Scholar]
- de los Santos T, Schweizer J, Rees CA, Francke U. Small evolutionarily conserved RNA, resembling C/D box small nucleolar RNA, is transcribed from PWCR1, a novel imprinted gene in the Prader-Willi deletion region, which is highly expressed in brain. Am J Hum Genet. 2000;67:1067–1082. doi: 10.1086/303106. [DOI] [PMC free article] [PubMed] [Google Scholar]
- Ebert MH, Schmidt DE, Thompson T, Butler MG. Elevated plasma gamma-aminobutyric acid (GABA) levels in individuals with either Prader-Willi syndrome or Angelman syndrome. J Neuropsychiatry Clin Neurosci. 1997;9:75–80. doi: 10.1176/jnp.9.1.75. [DOI] [PMC free article] [PubMed] [Google Scholar]
- Gray TA, Saitoh S, Nicholls RD. An imprinted, mammalian bicistronic transcript encodes two independent proteins. Proc Natl Acad Sci USA. 1999;96:5616–5621. doi: 10.1073/pnas.96.10.5616. [DOI] [PMC free article] [PubMed] [Google Scholar]
- Hanel ML, Wevrick R. The role of genomic imprinting in human developmental disorders: Lessons from Prader-Willi syndrome. Clin Genet. 2001;59:156–164. doi: 10.1034/j.1399-0004.2001.590303.x. [DOI] [PubMed] [Google Scholar]
- Horsthemke B, Nazlican H, Husing J, Klein-Hitpass L, Claussen U, Michel S, Lich C, Gillessen-Kaesbach G, Buiting K. Somatic mosaicism for maternal uniparental disomy 15 in a girl with Prader-Willi syndrome: Confirmation by cell cloning and identification of candidate downstream genes. Hum Mol Genet. 2003;12:2723–2732. doi: 10.1093/hmg/ddg291. [DOI] [PubMed] [Google Scholar]
- Lambert JJ, Belelli D, Peden DR, Vardy AW, Peters JA. Neurosteroid modulation of GABAA receptors. Prog Neurobiol. 2003;71:67–80. doi: 10.1016/j.pneurobio.2003.09.001. [DOI] [PubMed] [Google Scholar]
- Lee S, Kozlov S, Hernandez L, Chamberlain SJ, Brannan CI, Stewart CL, Wevrick R. Expression and imprinting of MAGEL2 suggest a role in Prader-Willi syndrome and the homologous murine imprinting phenotype. Hum Mol Genet. 2000;9:1813–1819. doi: 10.1093/hmg/9.12.1813. [DOI] [PubMed] [Google Scholar]
- Lee S, Walker CL, Karten B, Kuny SL, Tennese AA, O’Neill MA, Wevrick R. Essential role for the Prader-Willi syndrome protein necdin in axonal outgrowth. Hum Mol Genet. 2005;14:627–637. doi: 10.1093/hmg/ddi059. [DOI] [PubMed] [Google Scholar]
- Lefkowitz RJ, Shenoy SK. Transduction of receptor signals by beta-arrestins. Science. 2005;308:512–517. doi: 10.1126/science.1109237. [DOI] [PubMed] [Google Scholar]
- Ma DQ, Whitehead PL, Menold MM, Martin ER, Ashley-Koch AE, Mei H, Ritchie MD, Delong GR, Abramson RK, Wright HH, Cuccaro ML, Hussman JP, Gilbert JR, Pericak-Vance MA. Identification of significant association and gene-gene interaction of GABA receptor subunit genes in autism. Am J Hum Genet. 2005;77:377–388. doi: 10.1086/433195. [DOI] [PMC free article] [PubMed] [Google Scholar]
- McLachlan GJ, Do K-A, Ambroise C. Analyzing microarray gene expression data Hoboken. New Jersey: Wiley InterScience; 2004. [Google Scholar]
- Nevsimalova S, Vankova J, Stepanova I, Seemanova E, Mignot E, Nishino S. Hypocretin deficiency in Prader-Willi syndrome. Eur J Neurol. 2005;12:70–72. doi: 10.1111/j.1468-1331.2004.00969.x. [DOI] [PubMed] [Google Scholar]
- Nicholls RD. Incriminating gene suspects, Prader-Willi style. Nat Genet. 1999;23:132–134. doi: 10.1038/13758. [DOI] [PubMed] [Google Scholar]
- Nicholls RD, Knepper JL. Genome organization, function, and imprinting in Prader-Willi and Angelman syndromes. Annu Rev Genomics Hum Genet. 2001;2:153–175. doi: 10.1146/annurev.genom.2.1.153. [DOI] [PubMed] [Google Scholar]
- Roof E, Stone W, MacLean W, Feurer ID, Thompson T, Butler MG. Intellectual characteristics of Prader-Willi syndrome: Comparison of genetic subtypes. J Intellect Disabil Res. 2000;44:25–30. doi: 10.1046/j.1365-2788.2000.00250.x. [DOI] [PMC free article] [PubMed] [Google Scholar]
- Runte M, Huttenhofer A, Gross S, Kiefmann M, Horsthemke B, Buiting K. The IC-SNURF-SNRPN transcript serves as a host for multiple small nucleolar RNA species and as an antisense RNA for UBE3A. Hum Mol Genet. 2001;10:2687–2700. doi: 10.1093/hmg/10.23.2687. [DOI] [PubMed] [Google Scholar]
- Stefan M, Portis T, Longnecker R, Nicholls RD. A nonimprinted Prader-Willi syndrome (PWS)-region gene regulates a different chromosomal domain in trans but the imprinted PWS loci do not alter genome-wide mRNA levels. Genomics. 2005;85:630–640. doi: 10.1016/j.ygeno.2005.02.004. [DOI] [PubMed] [Google Scholar]
- Webb T, Whittington J, Holland AJ, Soni S, Boer H, Clarke D, Horsthemke B. CD36 expression and its relationship with obesity in blood cells from people with and without Prader-Willi syndrome. Clin Genet. 2006;69:26–32. doi: 10.1111/j.1399-0004.2006.00536.x. [DOI] [PubMed] [Google Scholar]