Abstract
Background. Standardised Prostate Imaging Reporting and Data System (PI-RADS) guidelines for the assessment of prostate alterations were designed for the assessment of prostate pathology. Published by the ESUR in 2012, PI-RADS v1 was based on the total score of different MRI sequences with subsequent calculation. PI-RADS v2 was published by the American College of Radiology in 2015 and featured different assessment criteria for prostate peripheral and transitory zones.
Aim. To assess the correlations of PI-RADS v1 and PI-RADS v2 with Gleason score values and to define their predictive values of the diagnosis of prostate cancer.
Materials and methods. A retrospective analysis of 66 patients. Prostate specific antigen (PSA) value and the Gleason score (GS) were assessed. One the most malignant focal lesion was selected in the peripheral zone of each lobe of the prostate (91 in total). Statistical analysis was carried out applying SPSS software, v.23, p < 0.05.
Results. Focal lesions assessed by PI-RADS v1 score: 10% – 1, 12% – 2, 41% – 3, 23% – 4, 14% – 5. Assessment applying PI-RADS v.2: 20% – 1, 7.5% – 2, 26%, 29.5%, and 17% were assessed by 3, 4, and 5 scores. Statistically relevant correlation was found only between GS and PI-RADS (p = 0.033).
The positive predictive value of both versions of PI-RADS – 75%, negative predictive value of PI-RADS v1 – 46%, PI-RADS v2 – 43%.
Conclusions. PI-RADS v1 was more statistically relevant in assessing the grade of tumour. Prediction values were similar in both versions
Keywords: prostate, malignant, cancer, genomics, multiparametric, MRI, PI-RADS
Abstract
SKIRTINGŲ PI-RADS VERSIJŲ REIKŠMĖ VERTINANT PROSTATOS MULTIPARAMETRINIO MAGNETINIO REZONANSO TOMOGRAFIJOS DUOMENIS
Santrauka
Įvadas. Pradėjus plačiai naudoti multiparametrinio magnetinio rezonanso tomografijos tyrimą (toliau – mpMRT) prostatos pakitimams vertinti pritrūko standartizuotų diagnostinių kriterijų, apibendrinančių rezultatus. 2012 m. Europos urogenitalinės radiologijos draugija (ESUR – European Society of Urogenital Radiology), remdamasi ekspertų sutarimu, išleido standartizuotas prostatos MRT vertinimo gaires, pavadintas PI-RADS (Prostate Imaging Reporting and Data System). Šios gairės (PI-RADS v1) rėmėsi balų suma ir kiekvieną židinį įvertino skirtingose sekose (T2, difuzijos restrikcijos (DWI), dinaminio kontrastavimo ir pasirinktinai spektroskopijos). Vėliau šias gaires (PI-RADS v2) atnaujino Amerikos radiologų koledžo (ACR – American College of Radiology), ESUR ir Ad MeTech fondas. Atnaujintose gairėse neįtrauktas spektroskopijos vertinimas, o dinaminis kontrastavimas tapo mažiau reikšmingas.
Tikslas. Įvertinti PI-RADS v1 ir PI-RADS v2 koreliacijas su Gleason skaičiaus vertėmis ir rasti prostatos vėžio diagnostikos prediktyvines vertes.
Tyrimo medžiaga ir metodai. Atlikta retrospektyvinė 66 pacientų, kuriems nustatyti prostatos navikiniai pakitimai ir atliktas mpMRT, ligos analizė. Vertintas prostatos specifinio antigeno (PSA) rodiklis ir Gleasono skaičius (GS). mpMRT tyrimas atliktas 1,5T aparatu naudojant dubens ritę. Vertintos anatominės (T2) ir funkcinės (DWI ir ADCmap, dinaminio kontrastavimo) sekos. Atrinkta po vieną piktybiškiausią židinį prostatos periferinės zonos dešinėje ir kairėje skiltyse atskirai (iš viso 91 židinys, kai skirtingose prostatos skiltyse navikas nustatytas histologiškai). Prostatos pakitimai mpMRT įvertinti PI-RADS v1 ir PI-RADS v2 balais. Statistinė duomenų analizė atlikta SPSS programa, 23 versija, statistiniam patikimumui patikrinti naudoti χ2 testas ir t-testas nepriklausomoms imtims. Pasirinktas statistinio reikšmingumo lygis p < 0,05.
Rezultatai. Įvertinus židinius PI-RADS balais (remiantis ESUR 2012 m. rekomendacijomis (PIRADS v1)) paaiškėjo, kad daugiausia židinių yra su PI-RADS 3 – 41 %, o PI-RADS 4 ir PI-RADS 5 atitinkamai 23 ir 14 %. Remiantis ACR 2015 m. PI-RADS v2 kriterijais, atitinkamai PI-RADS 3, PI-RADS 4 ir PI-RADS 5 balais įvertinta 26; 29,5 ir 17 %. Statistiškai patikima koreliacija su Gleason suma pastebėta tik remiantis pirmąja PI-RADS versija (atitinkamai PI-RADS v1 p = 0,033, PI-RADS v2 p = 0,076). Abiejų PI-RADS versijų teigiama prediktyvinė vertė – ~75 %, neigiama prediktyvinė vertė PI-RADS v1 – ~46 %, PI-RADS v2 – ~43 %.
Išvados. Vertinant židinių piktybiškumą statistiškai patikimesnė buvo 2012 m. ESUR PIRADS v1 versija, tačiau abiejų PI-RADS versijų predikcinės vertės panašios.
Raktažodžiai: prostata, piktybinis, vėžys, multiparametrinis, MRT, PI-RADS
INTRODUCTION
Prostate cancer is the most common malignant tumour in males and, according to the 2012 data of the Cancer Registry in Lithuania (1), accounts for 29% of cases in different age groups. According to the guidelines of the European Association of Urology, transrectal ultrasound-guided (TRUS) 10–12-core needle biopsy is recommended in the case of elevated PSA level and/or any abnormal findings during digital rectal examination (2). Modern randomized strategy for the biopsy provides insufficient prostate tumour detection. More than 30% of clinically significant tumours are not detected during the initial biopsy while comparing with prostatectomy material, Gleason score is not sufficiently determined in 26–41% of cases (3, 4). This could lead to a false risk identification (3). Insufficient diagnostics requires repeated biopsies, leads to late disease detection and overly intensive treatment (5). The precise localization and staging of the tumour is required with increasing tendencies of active surveillance and local treatment (5).
Due to accessibility and a larger number of studies confirming the diagnostic mpMRI reliability in determining the malignant prostate lesions, mpMRI became an important and widely used tool for prostate cancer diagnostics (7). Prostate tumours are divided into clinically significant and clinically insignificant, on which depends on patient’s survival rate (8). There is no common definition for a clinically significant prostate tumour, but in most cases it is defined as a tumour with ≥7 Gleason score (including 3+4 with confirmed but non-dominant component of Gleason 4) and/or tumour volume ≥0.5 cm3 and/ or extracapsular spread (8). With increasing use of mpMRI for the assessment of prostate lesions, the lack of standardised diagnostic criteria that could summarize the results has emerged (5). In 2012, the European Society of Urogenital Radiology (ESUR), released the standardized prostate MRI assessment called PI-RADS (Prostate Imagining Reporting and Data System) based on expert consensus guidelines (9). These guidelines (PI-RADS v1) were based on the amount of points for the evaluation of each focal lesion with different sequences (T2, diffusion restriction (DWI, ADC), dynamic contrast, and selective spectroscopy) (9). In 2015 these guidelines (PI-RADS v2) were updated by the American College of Radiology (ACR), the ESUR (6). In the updated version, spectroscopy assessment was not included and DCE-MRI became less significant (6).
PI-RADS v2 introduces two important changes to PI-RADS v.1: the concept of a dominant sequence (DWI for the periphery and T2W for the transitional gland) and the relegation of DCEMRI to a tie-breaker role when a lesion remains indeterminate on T2W and DWI (Richenberg).
The PI-RADS indicates the probability of a clinically significant cancer with 5-point evaluation system for focal lesions: PI-RADS 1 – very low (clinically significant cancer is highly unlikely to be present), PI-RADS 2 – low (clinically significant cancer is unlikely to be present), PIRADS 3 – intermediate (the presence of clinically significant cancer is equivocal), PI-RADS 4 – high (clinically significant cancer is likely to be present), PI-RADS 5 – very high (clinically significant cancer is highly likely to be present).
The aim of this study is to assess the mpMRI signs to predict the malignancy of prostate cancer and to compare different versions of the PI-RADS published by the ESUR in 2012 (PI-RADS v1) and by the ACR in 2015 (PI-RADS v2).
METHODS AND MATERIALS
From 1 January 2015 to 1 January 2016, 390 pelvic mpMRI were performed on male patients at the Department of Radiology of the National Cancer Institute, Lithuania. The inclusion criteria for the 66 patients included in the final analysis were the following: (1) prostate cancer lesions verified by biopsy, (2) anatomical (T2W) and two functional sequences (DWI/ADC and DCE) were performed, and (3) no observed alterations (post-biopsy haemorrhage, artefacts caused by body movement or peristalsis) that could distort the results. The exclusion criteria of the study were the following: (1) MRI was performed on neoplastic lesions of organs other than the prostate, (2) no verification of prostate cancer, (3) treated prostate cancer (after hormonotherapy, radiotherapy, radical prostatectomy), (4) traces of haemorrhage in the prostate tissue on MRI, (5) MRI traces of stage IV tumour (in all cases, the tumour extended to the entire prostate diffusely and the differentiation of different prostate zones and individual focal lesions was not possible), (6) an increased level of creatinine prevented the usage of intravenous contrast media, and (7) technical parameters (artefacts).
The patient age, the prostate specific antigen (PSA) level, and the Gleason score from biopsy or radical prostatectomy (selected top Gleason score separately for the right and left lobes of prostate) were assessed. On all patients mpMRI was perfomed with 1.5T MRI (Phillips Achieva XR 35083 Phillips Netherlands 2011) using the pelvic coil. In the study the anatomical (T1W axial, T2W axial, and sagittal) and functional (DWI/ADC and dynamic contrast-enhanced – e-THRIVE) sequences were evaluated. The presence of post-biopsy haemorrhage was evaluated in the T1W sequence.
The most malignant focal lesion in the peripheral zone in the right and the left prostate lobes were selected using mpMRI. Only focal lesions of the peripheral zone were included in the study. Lesions in the transition zone of the prostate were excluded due to low count (on mpMRI, focal lesions in the transition zone were suspected for cancer for only four patients).
Ninety-one focal lesions were selected for the final analysis. The volume of the focus, the T2W signal value, the ADCmap value, and the type of contrast enhancement curve were assessed, and PI-RADS scores (based on the 2012 ESUR recommendations and on the criteria provided by the ACR in 2015) were calculated. According to the volume of the prostate cancer focus, two groups – of <0.5 cm3 and of ≥0.5 cm3 – were formed and mpMRI parameters and different PI-RADS versions were compared in these groups. Statistical analysis was performed using SPSS software, version 23. χ2 and t-test for independent samples were used to check statistical reliability. The selected statistical significance level – p < 0.05.
RESULTS
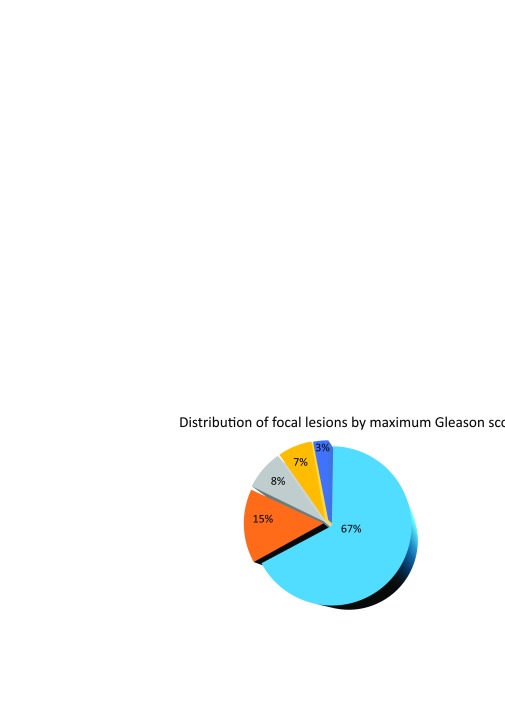
The final study group included 66 patients whose age ranged from 46 to 78 years (mean ± SD: 62.85 ± 6.56 years). The PSA levels ranged from 0.695 ng/ml to 100 ng/ml (mean ± SD: 11.98 ± 8.77 ng/ml). The low-risk group consisted of 28 (42%) patients, medium-risk of 15 (23%), and 23 (35%) comprised the high-risk group. Forty TRUS biopsies, 28 transperineal biopsies, and 12 radical prostatectomies were performed in the study group. The distribution of focal lesions by maximum Gleason score is shown in Fig. 1.
Fig. 1.
Distribution of focal lesions from the final analysis by maximum Gleason score
Tumour volume mean ± SD: 1.56 ± 3.86 ml. Tumour mean T2W values ± SD: 633.66 ± 263. ADCmap mean values ± SD: 1144.38 ± 1019.
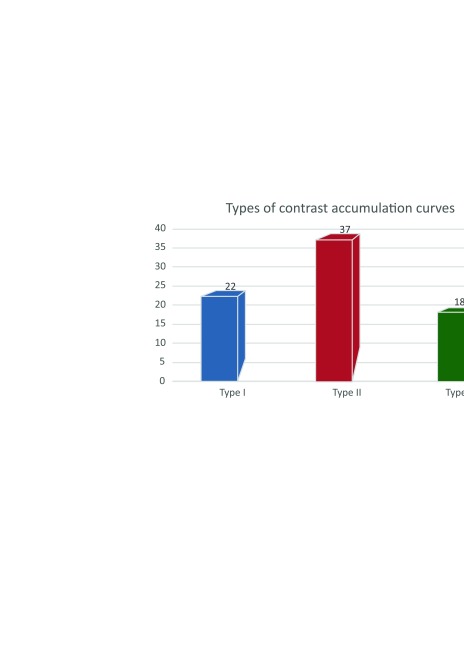
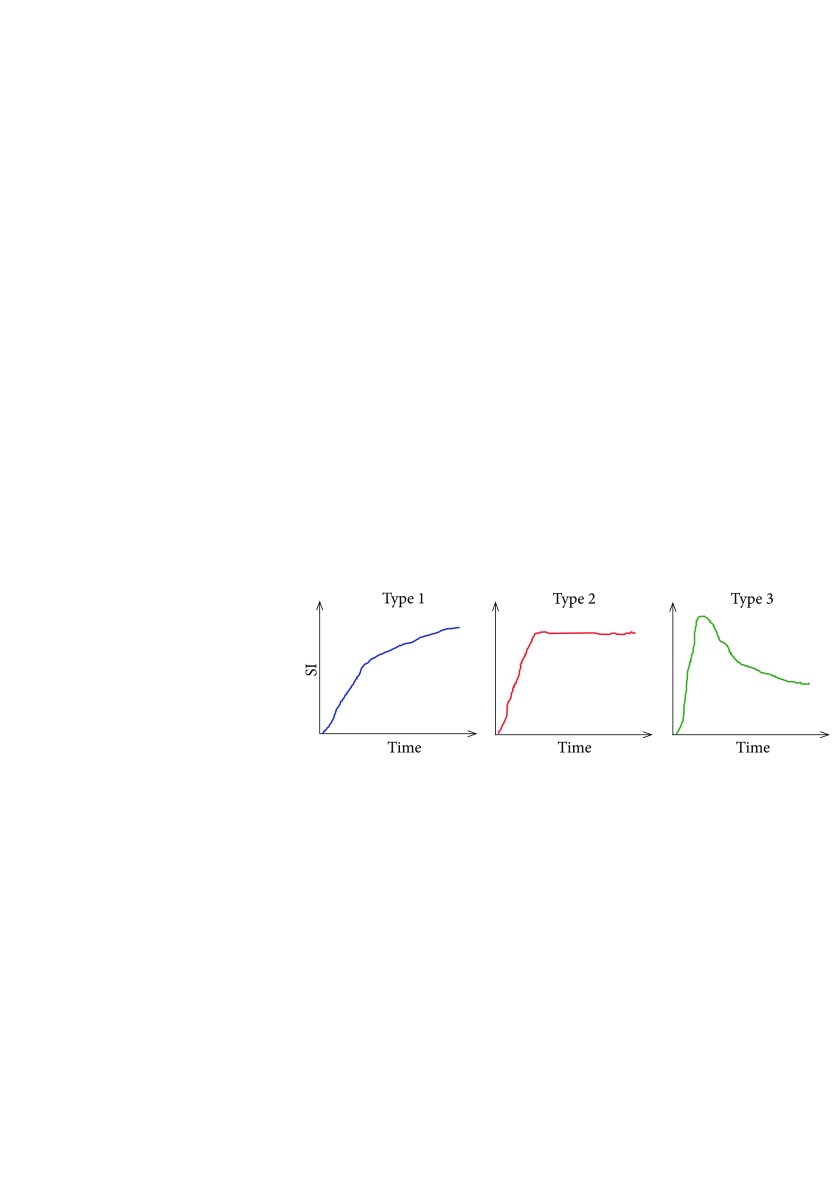
Contrast-enhanced kinetic curve types were determined: 22 cases of type I (more typical of benign lesions), 37 cases of type II, and 18 cases of type III (more typical of malignant lesions). The distribution and illustration of the curves are shown in Fig. 2 and Fig. 3.
The correlation between the Gleason score and the tumour volume, the T2W value, the ADCmap value, and contrast-enhanced curve type was assessed. These parameters were compared in two groups by the tumour volume: <0.5 cm3 and ≥0.5 cm3.
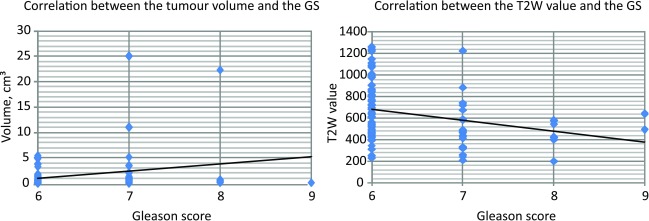
A positive correlation was detected between the tumour volume and the Gleason score (N = 91, p = 0.032), and inverse correlation between the Gleason score and the T2W value (N = 83, p = 0.007). These results are shown in Fig. 4.
No statistically significant correlations were detected between the Gleason score and the ADCmap (N = 84, p = 0.25). The type of the contrast accumulation curve did not correlate with tumour malignancy.
Fig. 2.
Distribution of contrast enhancement curves
Fig. 3.
Types of contrast enhancement curves according to Johnson et al. 2014 (10)
Prostate carcinomas usually show reduced ADC values and a high signal intensity in the high-b-value image from DWI. In addition, the ADC values had negative correlation with the Gleason score of peripheral zone carcinomas. In the study by Rotdke et al. (12), a significant difference was observed in tumours with a Gleason score of 6 compared to those with a score of 7 or 8. There was no significant difference between tumours with a Gleason score >7 (13). Other authors also demonstrated a linear reduction of the ADC of the peripheral zone prostate carcinoma with increasing Gleason score and significant differences between low-grade, intermediate, and high-grade PCA.
Fig. 4.
Correlations between the tumour volume and the Gleason score (N = 91 p = 0.032) and between the T2W value and the Gleason score (N = 83, p = 0.007)
Even though there is no exact correspondence between ADC thresholds and Gleason scores, the DWI is still the most important tool in the detection of the most aggressive lesion (index lesion). In the group of clinically-relevant tumour, where the tumour volume was ≥0.5 cm3, statistically significant correlation was detected between tumour volume and the Gleason score (N = 36, p = 0.019) and between tumour T2W value and the Gleason score (N = 36, p = 0.000). Other parameters did not correlate with the Gleason score.
Determining focal lesions by PI-RADS v1 (ESUR, 2012), the distribution by score was: PI-RADS 3 – 41%; PI-RADS 4 – 23%; PI-RADS 5 – 17%. According to the ACR 2015 PI-RADS version (PI-RADS v2), scores were: PI-RADS 3 – 26%; PI-RAD S4 – 29.5%; PI-RADS 5 – 17%. The detailed distribution by PIRADS scores is shown in Table 1 (PI-RADS v1) and Table 2 (PI-RADS v2). Statistically significant correlation between the PI-RADS score and the Gleason score was detected only in PI-RADS v1 (PI-RADS v1 p = 0.033; PI-RADS v2 p = 0.076).
Table 1.
Prostate cancer distribution according to the Gleason score and the PI-RADS v1 score (based on 2012 ESUR recommendations)
| Gleason score 6 (3+3) |
Gleason score 7 (3+4) |
Gleason score 7 (4+3) |
Gleason score 8 (4+4) |
Gleason score 9 (4+5) |
Gleason 9 (5+4) |
|
|---|---|---|---|---|---|---|
| PI-RADS 1 | 8 (8.79%) <0.5 cm3 – 8 ≥0.5 cm3 – 0 |
1 (1.10%) <0.5 cm3 – 1 ≥0.5 cm3 – 0 |
– | – | – | – |
| PI-RADS 2 | 8 (8.79%) <0.5 cm3 – 6 ≥0.5 cm3 – 2 |
3 (3.30%) <0.5 cm3 – 2 ≥0.5 cm3 – 1 |
– | – | – | – |
| PI-RADS 3 | 27 (29.67%) <0.5 cm3 – 16 ≥0.5 cm3 – 11 |
3 (3.30%) <0.5 cm3 – 1 ≥0.5 cm3 – 2 |
2 (2.20%) <0.5 cm3 – 2 ≥0.5 cm3 – 0 |
4 (4.40%) <0.5 cm3 – 3 ≥0.5 cm3 – 1 |
1 (1.10%) <0.5 cm3 – 1 ≥0.5 cm3 – 0 |
– |
| PI-RADS 4 | 13 (14.29%) <0.5 cm3 – 9 ≥0.5 cm3 – 4 |
4 (4.40%) <0.5 cm3 – 0 ≥0.5 cm3 – 4 |
1 (1.10%) <0.5 cm3 – 0 ≥0.5 cm3 – 1 |
1 (1.10%) <0.5 cm3 – 0 ≥0.5 cm3 – 1 |
1 (1.10%) <0.5 cm3 – 1 ≥0.5 cm3 – 0 |
1 (1.10%) <0.5 cm3 – 1 ≥0.5 cm3 – 0 |
| PI-RADS 5 | 4 (4.40%) <0.5 cm3 – 2 ≥0.5 cm3 – 2 |
4 (4.40%) <0.5 cm3 – 0 ≥0.5 cm3 – 4 |
4 (4.40%) <0.5 cm3 – 1 ≥0.5 cm3 – 3 |
1 (1.10%) <0.5 cm3 – 0 ≥0.5 cm3 – 1 |
– | – |
Table 2.
Prostate cancer distribution according to the Gleason score and the PI-RADS v2 score (based on 2015 ACR)
| Gleason score 6 (3+3) |
Gleason 7 (3+4) |
Gleason score 7 (4+3) |
Gleason score 8 (4+4) |
Gleason score 9 (4+5) |
Gleason score 9 (5+4) |
|
|---|---|---|---|---|---|---|
| PI-RADS 1 | 14 (15.38%) <0.5 cm3 – 11 ≥0.5 cm3 – 3 |
4 (4.40%) <0.5 cm3 – 3 ≥0.5 cm3 – 1 |
– | – | – | – |
| PI-RADS 2 | 5 (5.49%) <0.5 cm3 – 4 ≥0.5 cm3 – 1 |
– | 1 (1.10%) <0.5 cm3 – 1 ≥0.5 cm3 – 0 |
– | 1 (1.10%) <0.5 cm3 – 1 ≥0.5 cm3 – 0 |
– |
| PI-RADS 3 | 19 (20.89%) <0.5 cm3 – 10 ≥0.5 cm3 – 9 |
2 (2.20%) <0.5 cm3 – 0 ≥0.5 cm3 – 2 |
1 (1.10%) <0.5 cm3 – 1 ≥0.5 cm3 – 0 |
2 (2.20%) <0.5 cm3 – 1 ≥0.5 cm3 – 1 |
– | – |
| PI-RADS 4 | 18 (19.78%) <0.5 cm3 – 14 ≥0.5 cm3 – 4 |
3 (3.30%) <0.5 cm3 – 1 ≥0.5 cm3 – 2 |
1 (1.10%) <0.5 cm3 – 0 ≥0.5 cm3 – 1 |
3 (3.30%) <0.5 cm3 – 1 ≥0.5 cm3 – 2 |
1 (1.10%) <0.5 cm3 – 1 ≥0.5 cm3 – 0 |
1 (1.10%) <0.5 cm3 – 1 ≥0.5 cm3 – 0 |
| PI-RADS 5 | 5 (5.49%) <0.5 cm3 – 3 ≥0.5 cm3 – 2 |
5 (5.49%) <0.5 cm3 – 0 ≥0.5 cm3 – 5 |
4 (4.40%) <0.5 cm3 – 1 ≥0.5 cm3 – 3 |
1 (1.10%) <0.5 cm3 – 0 ≥0.5 cm3 – 1 |
– | – |
Predictive values of different PI-RADS versions were calculated. Positive predictive values of both PI-RADS versions were ~75%, negative predictive value of PI-RADS v1 was ~46%, and PI-RADS v2 ~43%.
DISCUSSION AND CONCLUSIONS
The study has shown a direct dependence between tumour malignancy (Gleason score) and the tumour volume in the clinically significant tumour group (≥0.5 cm3) and an inverse dependence between the Gleason score and tumour T2 value (the more malignant the tumour the smaller the T2 value). Many studies analyzing the morphology and visualization of the tumour noted that the probability of detection decreases with the decreasing size of the lesions (11).
Other parameters did not correlate with the Gleason score. While assessing focal lesions by PI-RADS system, benign (PI-RADS 1, PIRADS 2), and intermediate (PI-RADS 3) lesions concluded the relevant percentage part in all focal lesions and it is recommended to take these changes into account. In this study, the evaluation of focal lesions malignancy was more statistically reliable in 2012 ESUR PI-RADS version, however prediction values of both versions of PI-RADS were similar.
Richenberg (14) discusses the problem with PI-RADS v2 – that it has the tendency to end up scoring a lesion “3”, or intermediate, especially in the transitional zone. The need to not report indeterminate lesions is clinically important as ultimately a five-point scale has to be translated into a binary decision, biopsy, or do not biopsy. A grade 3 lesion straddles this boundary.
The study showed negative predictive value of 46% according to PI-RADS v1 and 43% according to PI-RADS v2. According to other studies, the false-negative rate for prostate mpMRI is, based on several recent credible publications (and anticipating PROMIS trial results), approximately 10–15%, i. e., 1 in 10 “normal” mpMRI studies may have Gleason 3+4 cancers or extensive volume Gleason 6 cancer. The limitations of PI-RADS v2 are fully appreciated being a centre point of discussions as the third iteration of the guidelines is beginning to be formulated. The next iteration will explore how Class 3 lesions can be stratified into “deserves biopsy” from “safe to watch”. Some of the parameters will be functional measurement, others are likely to be geometric, which would be a new path for the PI-RADS [14].
References
- Smailytė G, Aleknavičienė B. Vėžys Lietuvoje 2012 m. [Cancer in Lithuania in 2012]. National Cancer Institute, Department of Cancer Control and Prevention, 2015. Lithuanian. [Google Scholar]
- Mottet N, Bellmunt J, Briers E, Bergh RCN, Bolla M, Casteren NJ, et al. Guidelines on prostate cancer. European Association of Urology; 2015. [Google Scholar]
- Bjurlin MA, Meng X, Nobin JL, Wysock JS, Lepor H, Rosenkrantz AB, et al. Optimisation of prostate biopsy: the role of magnetic resonance imaging targeted biopsy in detection, localisation and risk assessment. J Urol. 2014. September; 192(3): 648–58. [DOI] [PMC free article] [PubMed] [Google Scholar]
- Kobus T, Vos PC, Hamrock T, Rooij M, Hulsbergen-Van de Kaa CA, Barentsz JO, et al. Prostate cancer aggressiveness: in vivo assessment of MR spectroscopy and diffusion-weighted imaging at 3T. Radiology. 2012; 265(2): 457–67. [DOI] [PubMed] [Google Scholar]
- Radtke JP, Teber D, Hohenfellner M, Hadaschik BA. The current and future role of magnetic resonance imaging in prostate cancer detection and management. Transl Androl Urol. 2015; 4(3): 326–341. [DOI] [PMC free article] [PubMed] [Google Scholar]
- American College of Radiology. PI-RADSTM Prostate Imaging – Reporting and Data System, version 2. 2015. [Google Scholar]
- Junker D, Schafer G, Edlinger M, Kremser C, Bektic J, Horninger W, et al. Evaluation of the PI-RADS scoring system for classifying mpMRT findings in men with suspicion of prostate cancer. BioMed Reasearch International. 2013; 2013: 1–9. [DOI] [PMC free article] [PubMed] [Google Scholar]
- Steiger P, Thoeny HC. Prostate MRI based on PI-RADS version 2: how we review and report. Cancer Imaging 2016; 16: 9. [DOI] [PMC free article] [PubMed] [Google Scholar]
- Barentsz JO, Richenberg J, Clements R, Choyke P, Verma S, Villeirs G, et al. ESUR prostate MR guidelines 2012. Eur Radiol 2012; 22: 746–57. [DOI] [PMC free article] [PubMed] [Google Scholar]
- Johnson LM Turkbey B Figg WD et al.. Multiparametric MRI in prostate cancer management. Nature Reviews Clinical Oncology 2014: [DOI] [PMC free article] [PubMed] [Google Scholar]
- Roethke MC, Lichy MP, Jurgschat L, et al. Tumorsize dependent detection rate of endorectal MRI of prostate cancer – a histopathologic correlation with whole-mount sections in 70 patients with prostate cancer. Eur J Radiol. 2011; 79: 189–95. [DOI] [PubMed] [Google Scholar]
- Röthke M, Blondin D, Schlemmer HP, Franiel T. PI-RADS classification: structured reporting for MRI of the prostate. Magnetom Flash (https://geiselmed.dartmouth.edu/radiology/pdf/PI-Rads%20structured%20reporting%20of%20the%20prostate.pdf) [DOI] [PubMed] [Google Scholar]
- Woodfield CA, Tung GA, Grand DJ, et al. Diffusion-weighted MRI of peripheral zone prostate cancer: comparison of tumor apparent diffusion coefficient with Gleason score and percentage of tumor on core biopsy. Am J Roentgenol. 2010; 194: 316–22. [DOI] [PubMed] [Google Scholar]
- Richenberg JL.. PI-RADS: past, present and future. Clinical Radiology. 2016; 71 23–4. [DOI] [PubMed] [Google Scholar]


