

Abstract
Background
In 2011, the median age of survival in cystic fibrosis (CF) reported in the United States (US) was 36.8 years compared to 48.5 years in Canada; however direct comparison of survival estimates between national registries is challenging because of inherent differences in methodologies used, data processing techniques, and ascertainment bias.
Objectives
To use a standardized approach to calculate CF survival estimates and to explore differences between Canada and the United States (US).
Design
Population-based study.
Setting
42 Canadian CF clinics and 110 CF care centers in the US.
Patients
Patients followed in the Canadian CF Registry (CCFR) and the US Cystic Fibrosis Foundation (CFF) Patient Registry (CFFPR) between 1990 and 2013.
Measurement
Cox proportional hazards models were used to compare survival between patients followed in the CCFR (n=5,941) and CFFPR (n=45,448). Multivariable models were used to adjust for factors known to be associated with survival.
Results
Median age of survival in patients with CF increased in both countries between 1990 and 2013; however in 1995 and 2005, survival in Canada increased at a faster rate relative to the US (p<0.001). Using contemporary data from 2009-2013, the median age of survival in Canada was ten years greater than the US (50.9 vs. 40.6 years, respectively). The adjusted risk of death was 34% lower in Canada compared to the US (hazard ratio 0.66, 95% CI 0.54-0.81). A greater proportion of patients had transplants in Canada (10.3% vs. 6.5% respectively, SD 13.7). Differences in survival between US and Canadian patients varied according to the US patients' insurance status.
Limitations
Ascertainment bias as a result of missing data or non-random lost to follow-up could impact the results.
Conclusions
Differences in CF survival between Canada and the US persisted after adjusting for risk factors associated with survival. Differential access to transplantation, improved post-transplant survival and differences in the healthcare systems may, in part, explain the Canadian survival advantage.
Introduction
A comprehensive, multidisciplinary approach to medical care, early treatment of pulmonary disease and aggressive management of malnutrition has translated into longer lives for individuals with cystic fibrosis (CF).(1-3) Life expectancy depends on a patient's characteristics, as well as their access to medical care and medications, which may vary both within and between countries.(4;5) Comparisons of national CF registry data have led to important discoveries in CF disease progression and increased our understanding of epidemiologic trends in CF mortality and clinical care.(6-12) Recently, Goss et al. showed that pulmonary function among patients ages 6-25 years was higher in CF patients in the United States (US) compared to the United Kingdom (UK), which was associated with differential prescribing of inhaled mucolytic therapies between the two countries.(7)
In 2011, the median age of survival for CF in the US Annual Registry report was 36.8 years whereas it was 48.5 years in the Canadian CF Registry report.(13;14) Direct comparison of median age of survival estimates between national registry reports is problematic due to the inherent differences in methodologies used, data processing techniques, and ascertainment bias.(15;16) We recently showed that survival estimates may be over- or underestimated depending on how data are captured and processed, and the proportion of missing data.(15) Using a standardized approach to data processing and survival calculations would provide greater confidence in international comparisons and in the identification of factors that may contribute to the observed differences.
The objectives of this study were (1) to determine whether using a standardized approach to data processing and survival calculations confirmed the observed difference between Canada and the US, and (2) if a survival gap persisted, to explore potential contributing factors. We hypothesized that differences in survival between the countries could be explained by variations in clinical characteristics of the patient populations, differential rates of transplantation and variations between the health care systems.
Methods
This population-based cohort study used prospectively collected Canadian CF Registry (CCFR) and US CF Foundation (CFF) Patient Registry (US CFFPR) data from 1990 to 2013 inclusive. Each CF center that submits data to the registry obtains patient consent for data to be collected. This study was approved by the Research Ethics Board at St. Michael's Hospital, Toronto, Ontario (Research Ethics Board # 14-148) and at Seattle Children's Hospital (Institutional Research Board # 15294).
A detailed description of both registries as well as information on how individuals are accrued and monitored within each registry is outlined in the online supplement. The CCFR and the US CFFPR contain detailed demographic and clinical information on patients with a confirmed diagnosis of CF(17) receiving clinical care at accredited CF centers across Canada and the US. Data including age, sex, age of diagnosis, race, symptoms at presentation, whether or not the patient was diagnosed through newborn screening, date of transplantation, date of death and cause of death, as well as anthropometric measurements, lung function, bacteriology, CF-related complications, and pancreatic status are collected.
Each variable within the Canadian and US registries was evaluated by the research team and comparisons were made regarding data definitions and how data are collected so that a unified approach to each variable was established. Because the CCFR records the first stable clinical measurement per person per year, we selected the first stable measurement of the year for each subject within the US CFFPR in order to mirror the method of data collection. A stable measurement was defined as one that is taken from a routine outpatient clinic visit when the patient was not being treated for a pulmonary exacerbation. Missing date of diagnosis was imputed using date of birth plus 30 days whereas age at diagnosis was categorized as < 2 or ≥ 2 years of age.(18) Genotype was classified as homozygous delta F508, heterozygous delta F508, other, or missing. Race was categorized as Caucasian, other, or missing. Forced expiratory volume in one second (FEV1) was expressed as a percentage of the predicted values for healthy age and gender matched controls using GLI reference equations.(19) Body mass index percentiles (BMI%ile) were calculated for children between two and 19 years of age using the Centers for Disease Control and Prevention growth charts.(20) Children were then classified as: underweight (BMI%ile ≤ 12%), adequate weight (BMI%ile 13-84% or overweight (BMI%ile ≥ 85%).(21) For individuals 19 years of age and older, subjects were classified into BMI categories based on World Health Organization guidelines(22) as underweight (<18.5 kg/m2), adequate weight (18.5-24.9 kg/m2), or overweight (≥ 25.0 kg/m2). Based on the literature, respiratory bacteria can have a differential effect on survival. For those individuals who grew multiple organisms from respiratory tract specimens in a given year, we categorized patients based on the organism that had the worst prognosis in terms of survival. This categorization allowed us to create mutually exclusive groups to avoid combining less virulent organisms with ones associated with a worse prognosis. Using this hierarchical classification, patients with multiple types of bacteria cultured in a given year were categorized as follows: Burkholderia cepacia complex took precedence over any other type of infection, methicillin resistant Staphylococcus aureus (MRSA) took precedence over Pseudomonas aeruginosa. P. aeruginosa took precedence over all remaining organisms. CF-related diabetes (CFRD) was defined by the clinic based on published consensus guidelines.(23) Pancreatic status was determined by pancreatic enzyme replacement therapy usage. Pancreatic status was used as a surrogate for disease severity in the multivariable analysis since CFTR genotype and pancreatic status are highly correlated(24) and fewer patients had missing data for pancreatic enzyme replacement therapy. Previous literature suggests that the majority of patients who were reported as lost to follow-up at some point during the follow-up period will return to the CF center within 2 years of non-attendance.(5) Thus, subjects were considered lost to follow-up if they had no death date recorded and their last reporting year was more than two years from the end of the study. The single-payer universal health insurance program in Canada provides comprehensive medical care to all Canadian citizens whereas the US employs a multi-payer approach to healthcare. Patients in the US were grouped into mutually exclusive categories according to their health insurance coverage as follows: chronic Medicaid or Medicare (receiving Medicaid and/or Medicare in all five years), intermittent Medicaid and/or Medicare (receiving Medicaid or Medicare in at least one but not all five years), other (any other insurance outside of Medicaid or Medicare, which is predominantly employee-provided private insurance), none/unknown insurance (none or unknown insurance unknown or in all five years) for the US patient population and universal healthcare for the Canadian population.
Statistical Analyses
Demographic and clinical variables were summarized by country, with categorical variables expressed as frequency and proportion, and continuous variables summarized as median and range. Differences between countries were compared using the Mann-Whitney test for continuous variables and the Chi-square test for categorical variables. P-values are heavily influenced by sample size, and thus the large sample sizes herein will render very small differences statistically significant. As such, the standardized difference (SD) was utilized to determine statistical significance. A SD of greater than ten was used to determine significant differences between the countries.(25)
We used period survival analysis to calculate median age of survival estimates over time. Median age of survival for each year was calculated for each five-year window beginning with 1986-1990, and ending with the 2009-2013 time period. Differences in median age of survival between the two countries over time were evaluated from 1990 to 2013 using segmented regression analysis to determine whether there were significant change points when the differences in median age of survival diverged.(26)
We further explored differences in survival by adjusting for patient and clinical characteristics using a multivariable Cox proportional hazards (PH) model using data from the most recent five years (2009-2013), which reflects a contemporary cohort of CF patients. The multivariable Cox PH analysis was first conducted on data from all patients, including those who were transplanted, and adjusted for time-independent characteristics (sex, race, age at diagnosis, pancreatic status) and transplant status. Subsequently, we conducted additional multivariable analyses which included time-varying clinical characteristics known to be prognostic for patient survival, such as FEV1, BMI, CFRD, and microbiology. We excluded individuals under the age of 6 years because lung function measurements are not reliably measured until subjects are 6 years old. Since clinical outcomes post-transplant, particularly FEV1, do not represent CF lung disease, this analysis censored patients at the time of transplant. Country, sex, age at diagnosis, race, genotype, pancreatic status, and insurance status were modeled as time-independent covariates. Missing lung function and BMI measurements were imputed using multiple imputation(27) (see online supplement for additional details on survival calculations and imputation methodology).
Patients with milder clinical phenotypes have better survival therefore, a differential proportion of patients with milder CF disease in the two countries would bias the survival estimates. In order to address this potential ascertainment bias, we conducted several sub-group analyses. The multivariable Cox PH models were repeated limiting the sample to patients with a severe clinical phenotype as defined by 1) pancreatic status (i.e., pancreatic insufficient subjects); 2) homozygous delta F508 subjects; and 3) subjects diagnosed before the age of two years.(17;28) To address the differences in healthcare systems between the two countries we further classified the US subjects by insurance status and compared the risk of death in these subgroups to Canada as a whole, which has universal healthcare. The insurance status classification has been used in previous studies as Medicaid and Medicare have been associated with worse outcomes in CF.(29;30) Because the hierarchical approach to microbiology used in our study has not been commonly used in registry studies, we conducted a sensitivity analysis whereby we classified pertinent subjects as having co-infections with multiple bacteria.
Role of Funding Source
This study was funded by a US Cystic Fibrosis Foundation Grant (# STEPHE14A0). The funding source provided access to the US CFF registry data and contributed to the design, analysis, and interpretation of the findings as well as critical review of the manuscript.
Results
Longitudinal Trends in Survival over Time (1990-2013)
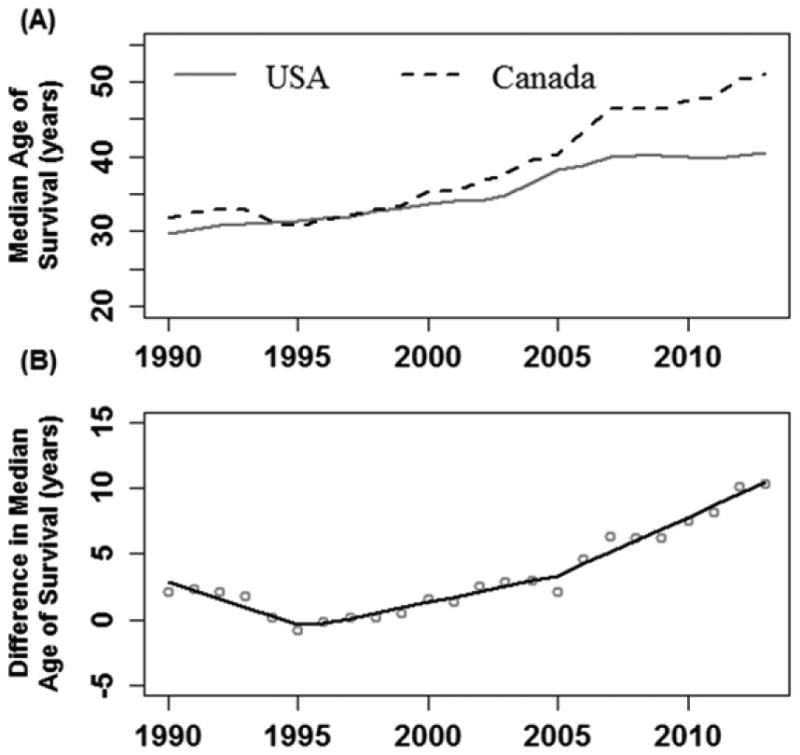
There were 45,448 and 5,941 patients followed in the US and Canadian registries respectively between 1990 and 2013, with 9,654 (21.2%) and 1,288 (21.7%) deaths respectively. Demographic and clinical characteristics of the CF patients followed between 1990 and 2013 are included in the online supplement (Table S1). Median age of survival in both countries increased over the study period (Figure 1a). However, the rate of improvement in median age of survival over time between the two countries diverged in 1995 and 2005 (Davies Test p<0.001) (Figure 1b); most notably in 2005 when the improvements in the Canadian population were greater. The rate of change in survival between males and females differed by country (p<0.001). Canadian male survival grew at a significantly faster rate compared to US males (p<0.001) from 2005 onwards whereas there was no statistically significant difference in survival improvement over time between the two countries for females (p=0.19). Changes in the median age of death over time and the difference in median age of death between the two countries are summarized in the online supplement in Figure S1.
Figure 1. (A) Median Survival Age using a 5-year rolling window, Canada vs. USA, 1990 to 2013; (B) Difference in Median Age of Survival between Canada and the USA, 1990-2013.
Contemporary CF Population (2009-2013)
The demographic and clinical characteristics of the contemporary CF cohort are summarized in Table 1. A higher proportion of subjects were asymptomatic at the time of diagnosis in the US compared to Canada (19.9% vs. 10.9%, SD 22.4), which corresponds to a higher prevalence of newborn-screened subjects in the US (17.3% vs. 6.2%, SD 34.4). A greater proportion of patients had transplants (any organ) in Canada (10.3% vs. 6.5% respectively, SD 13.7). Seventy-eight percent of all patient deaths in the US occurred among individuals never transplanted compared to 61% of deaths in the Canada (SD 38.0). Overall, fewer Canadian patients were lost to follow-up in the registry (2.5% vs. 5.5%) and a higher proportion of the lost to follow-up patients in the US were post-transplant compared to Canada (12.2% vs. 8.0% respectively, SD 13.9). The characteristics of the patients lost to follow-up in both countries is shown in the online supplement (Table S8).
Table 1. Characteristics of contemporary CF patients in Canada and United States followed between 2009-2013.
| Variable | Canada | % | United States | % | p-valuea | Std. Differenceb |
|---|---|---|---|---|---|---|
| N | 4,662 | 32,699 | ||||
| Vital status | ||||||
| Censored at follow-up | 4,421 | 94.8 | 30,525 | 93.4 | ||
| Dead | 241 | 5.2 | 2,174 | 6.6 | <0.001 | 6.3 |
| Death without transplant | 147 | 61.0 | 1,699 | 78.2 | <0.001 | 38.0 |
| Age at death | ||||||
| Median (range) | 31.9 | (0.3-79.3) | 26.9 | (0.3-76.9) | <0.001 | 29.5 |
| Cause of death | ||||||
| Cardio-respiratory | 164 | 68.0 | 1,462 | 67.2 | 0.18 | 10.5 |
| Other | 51 | 21.2 | 578 | 26.6 | ||
| Unknown | 26 | 10.8 | 134 | 6.2 | ||
| Transplantc | ||||||
| No | 4,182 | 89.7 | 30,572 | 93.5 | ||
| Yes | 480 | 10.3 | 2,127 | 6.5 | <0.001 | 13.7 |
| Lost to follow-upd | ||||||
| Overall | 112 | 2.5 | 1,679 | 5.5 | <0.001 | 14.4 |
| Males | 70 | 62.5 | 956 | 56.9 | ||
| Females | 42 | 37.5 | 723 | 43.1 | ||
| Post-Transplant | 9 | 8.0 | 205 | 12.2 | 0.24 | 13.7 |
| Age at diagnosis | ||||||
| Median (range) | 0.523 | (0-71.7) | 0.386 | (0-81.7) | <0.001 | 4.7 |
| <2 years | 3,108 | 66.7 | 23,191 | 70.9 | <0.001 | 9.2 |
| ≥2 years | 1,554 | 33.3 | 9,508 | 29.1 | ||
| Sex | ||||||
| Female | 2,167 | 46.5 | 15,738 | 48.1 | 0.037 | 3.3 |
| Male | 2,495 | 53.5 | 16,961 | 51.9 | ||
| Race | ||||||
| Caucasian | 4,305 | 92.3 | 30,184 | 92.3 | <0.001 | 0.1 |
| Other | 213 | 4.6 | 2,515 | 7.7 | ||
| Missing | 144 | 3.1 | 0 | 0 | ||
| Genotype | ||||||
| Homozygous ΔF508 | 2,193 | 47.0 | 14,272 | 43.6 | <0.001 | 6.8 |
| Heterozygous ΔF508 | 1,831 | 39.3 | 12,517 | 38.3 | 0.20 | 2.0 |
| Other | 531 | 11.4 | 4,427 | 13.5 | <0.001 | 6.5 |
| Missing | 107 | 2.3 | 1,483 | 4.5 | <0.001 | 12.4 |
| Use of pancreatic enzymes | ||||||
| PS (did not use enzymes in most recent yr) | 688 | 14.8 | 4,585 | 14.0 | 0.22 | 1.9 |
| PI (used enzymes most recent yr) | 3,974 | 85.2 | 27,977 | 85.6 | ||
| Unknown | 0 | 0 | 137 | 0.4 | ||
| Neonatal bowel obstruction | ||||||
| No | 3,826 | 82.1 | 26,712 | 81.7 | <0.001 | 9.7 |
| Yes | 660 | 14.2 | 5,987 | 18.3 | ||
| Unknown | 176 | 3.8 | 0 | 0 | ||
| Symptoms at diagnosis | ||||||
| Asymptomatic | 507 | 10.9 | 6,507 | 19.9 | <0.001 | 22.4 |
| Symptomatic | 3,671 | 78.7 | 25,489 | 78.0 | ||
| Unknown | 484 | 10.4 | 703 | 2.1 | ||
| Newborn screening | ||||||
| No | 4,291 | 92.0 | 27,044 | 82.7 | <0.001 | 34.4 |
| Yes | 291 | 6.2 | 5,655 | 17.3 | ||
| Unknown | 80 | 1.7 | 0 | 0 | ||
| Insurance status | ||||||
| Chronic Medicaid/Medicare | 0 | 0 | 7,971 | 24.4 | N/A | N/A |
| Intermittent Medicaid/Medicare Use | 0 | 0 | 10,814 | 33.1 | ||
| Other Insurance | 0 | 0 | 13,131 | 40.2 | ||
| Unspecified Insurance | 0 | 0 | 783 | 2.4 | ||
| Canadian Healthcare | 4,662 | 100 | 0 | 0 | ||
| CF-related diabetes | ||||||
| Yes | 1,174 | 25.2 | 8,806 | 26.9 | <0.001 | 4.0 |
| No | 3,488 | 74.8 | 23,893 | 73.1 | ||
| FEV1 % predictede | ||||||
| Median (range) | 74.03 | (11.9-136.7) | 74·99 | (6.8-148.8) | 0.35 | 1.4 |
| Missing | 864 | 18.5 | 6,870 | 21.0 | <0.001 | 6.2 |
| <40% | 610 | 13.1 | 4,405 | 13.5 | 0.13 | 2.7 |
| 40-69% | 1,108 | 23.8 | 7,048 | 21.6 | 0.02 | 4.2 |
| ≥70% | 2,080 | 44.6 | 14,376 | 44.0 | 0.31 | 1.8 |
| BMIf | ||||||
| Underweight | 449 | 9.6 | 2,862 | 8.8 | 0.25 | 2.1 |
| Normal Weight | 2,527 | 54.2 | 16,855 | 51.5 | 0.36 | 1.7 |
| Overweight | 629 | 13.5 | 4,597 | 14.1 | 0.04 | 3.8 |
| Missing | 1,057 | 22.7 | 8,385 | 25.6 | 0.55 | 1.0 |
| Microbiology | ||||||
| S. aureus | 3,165 | 70.2 | 22,267 | 72.6 | <0.001 | 5.3 |
| MRSA | 416 | 9.2 | 11,729 | 38.2 | <0.001 | 72.5 |
| P. aeruginosa | 2,945 | 65.3 | 21,006 | 68.5 | <0.001 | 6.7 |
| B. cepacia complex | 323 | 7.2 | 1,387 | 4.5 | <0.001 | 11.3 |
| S. maltophilia | 1,316 | 29.2 | 8,996 | 29.3 | 0.87 | 0.3 |
| Aspergillus | 1,705 | 37.8 | 8,720 | 28.4 | <0.001 | 20.1 |
| Atypical mycobacterium | 213 | 4.7 | 3,025 | 9.9 | <0.001 | 19.9 |
| Treatmentg | ||||||
| Mucolyticsh | ||||||
| Hypertonic Saline | 1,141 | 32.3 | 15,540 | 65.1 | <0.001 | 69.5 |
| Dornase alfa | 1,604 | 45.4 | 20,219 | 84.8 | <0.001 | 90.5 |
| Other mucolytics | 31 | 0.9 | 786 | 3.3 | <0.001 | 17.0 |
| Inhaled antibioticsi | ||||||
| Tobi | 837 | 38.3 | 10,603 | 68.9 | <0.001 | 64.4 |
| Tobi Podhaler | 731 | 33.4 | 142 | 0.9 | <0.001 | 95.5 |
| Tobramycin | 621 | 28.4 | 735 | 4.8 | <0.001 | 67.0 |
| Colistin | 436 | 19.9 | 2,234 | 14.5 | <0.001 | 14.4 |
| Cayston | 263 | 12.0 | 6,565 | 42.6 | <0.001 | 73.1 |
| Other | ||||||
| Azithromycin | 1,153 | 52.7 | 10,877 | 70.6 | <0.001 | 37.4 |
| Number of clinic visitsj | ||||||
| Median (range) | 3.8 | 0 – 33 | 4.2 | 0 – 26 | <0.001 | 24.9 |
| Missing | 79 | 1.7% | 629 | 1.9% |
Abbreviations: B. cepacia complex, Burkholderia cepacia complex; BMI, body mass index; CF, cystic fibrosis; CFRD, cystic fibrosis-related diabetes; FEV1 % predicted, forced expiratory volume in 1 second percent predicted; MRSA, methicillin-resistant Staphylococcus aureus; P. aeruginosa, Pseudomonas aeruginosa; S. aureus, Staphylococcus aureus; S. maltophilia, Stenotrophomonas maltophilia; Std Difference, standardized difference
All values are summarized based on the last recorded measurement in the time period.
Differences between countries were compared using the Mann-Whitney test for continuous variables and the chi-square test for categorical variables. P-values are heavily influenced by sample size, and thus the large sample sizes herein will render very small differences statistically significant. As such, the standardized difference was utilized to determine statistical significance.
The standardized difference is the mean difference as a percentage of the average standard deviations. A standardized difference greater than 10 is generally used to determine those variables that remain sufficiently different between the two countries.
The patient's first transplant of any type is considered only
Lost to follow-up is defined as patients who are alive but whose last available year of data occurs more than 2 years before the cohort end year. That is, a patient would be considered lost to follow-up if their last available reporting year is 2011 or earlier.
Percent predicted FEV1 was calculated using the GLI reference values using the subject's FEV1 value from the most recent year of follow-up.
BMI categories are defined using the WHO classification. The patient's BMI in the most recent year of follow-up was used.
As treatment data are only available in the Canadian registry beginning in 2011, these estimates are calculated for the 2011-2013 window.
Out of a total of 3,530 Canadians and 23,855 Americans over the age of 6 and with no prior transplant.
Out of a total of 2,186 Canadians and 15,398 Americans over the age of 6, with no prior transplant and infected with Pseudomonas aeruginosa at some point in the 2011-2013 window.
The average number of clinic visits per patient during the interval 2009 to 2013.
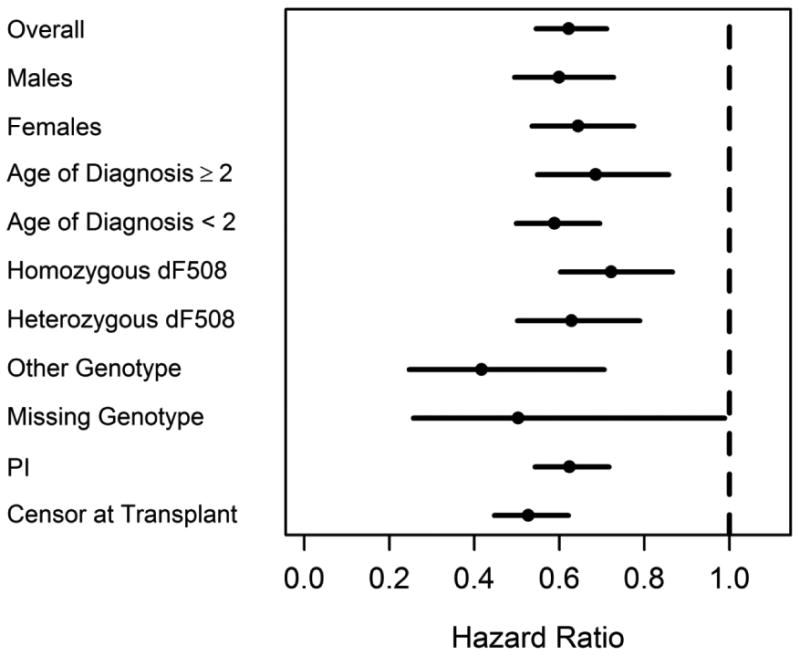
The median age of survival in Canada was ten years higher than the US (50.9 years (95% CI: 50.5-52.2) vs. 40.6 (95% CI: 39.1-41.8) years respectively). The median age at death was 26.9 years in the US compared to 31.9 years in Canada (SD 29.5). The risk of death between the countries was consistently lower in Canada compared to the US in multiple sub-groups of the population (Figure 3). In order to account for the differential lost to follow-up post-transplant between the two countries, we re-calculated median survival age censoring patients on the date of transplant, which effectively excluded post-transplant survival time as well as deaths after transplant in both countries. This analysis caused the survival gap between the two countries to widen further (57.1 years vs. 44.0 years in Canada and US respectively).
Figure 3. Unadjusted univariate sub-group analysis comparing the risk of death in the Canada vs. US (2009-2013).
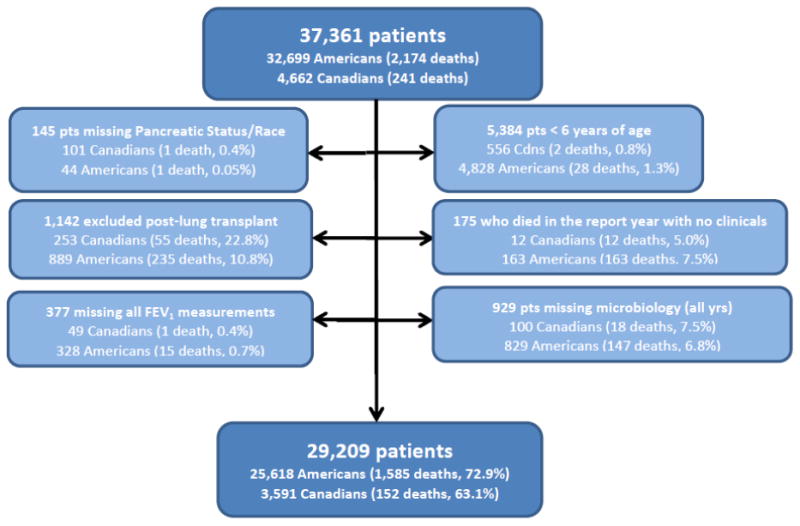
Details regarding the creation of the study cohort used for the multivariable analysis are presented in Figure 2 and a summary of the demographic and clinical characteristics of the included patients can be found in the online supplement (Table S2).
Figure 2. Creation of Study Cohort for Multivariable Analysis (2009-2013).
In the multivariable model which adjusted for patient characteristics only, the risk of death was 41% lower in Canada compared to the US (HR 0.59, 95% CI: 0.52-0.68, p<0.001, n=37,080). (Table 2). In the model which adjusted for both patient characteristics and clinical factors, the risk of death remained significantly lower in Canada compared to the US (HR 0.66, 95% CI 0.54-0.81; p=0.002).(Table 3) There was no evidence of a statistically significant interaction between country and any of the clinical factors. When US patients were categorized according to their insurance status, Canadians had a 44% lower risk of death compared to those in the US receiving continuous Medicaid/Medicare (n=6,230, 24.3%) (HR 0.56, 95% CI: 0.45-0.71, p<0.001), a 36% lower risk compared to US patients on intermittent Medicaid/Medicare (n=8,429, 32.9%) (HR 0.64, 95% CI: 0.51-0.80, p=0.002) and a 77% lower risk of death compared to US patients with unknown or no health insurance (n=205, 0.8%) (HR 0.23, 95% CI: 0.14-0.37, p<0.001). There was no difference in risk of death between Canadians and individuals in the US with “other” insurance (n=10,754, 42.0%), including private insurance (HR 0.85, 95% CI 0.67-1.07, p=0.15). (see online supplement, Table S3) To address potential ascertainment bias, the analyses were limited to severe patient phenotypes. Canadian CF patients consistently had a statistically significant lower risk of death in all sub-groups (see online supplement, Tables S4-S6). Further, results were unchanged regardless of the method used to classify patients into microbiologic categories (See online supplement, Table S7).
Table 2. Multivariable model adjusting for patient characteristics 2009-2013 (N=37,080)*.
| Variable | HR | 95% CI | p-value |
|---|---|---|---|
| Country | |||
| Canada | 0.59 | 0.52-0.68 | <0·001 |
| United States | 1·00 | -- | -- |
| Race | |||
| Caucasian | 1·00 | -- | -- |
| Other | 1·25 | 1·05-1·49 | 0·011 |
| Sex | |||
| Males | 1·00 | -- | -- |
| Females | 1·29 | 1·19-1·39 | <0·001 |
| Age at diagnosis | |||
| <2 years | 1·25 | 1·14-1·37 | <0·001 |
| ≥2 years | 1·00 | -- | -- |
| Pancreatic Status | |||
| Insufficient | 2·12 | 1.79-2.50 | <0.001 |
| Sufficient | 1·00 | -- | -- |
| Transplant | |||
| Yes | 3·21 | 2·89-3·56 | <0·001 |
| No | 1·00 | -- | -- |
Abbreviations: HR, hazard ratio; CI, confidence interval
281 patients were missing either race (n=144) or pancreatic status (n=137)
Table 3. Multivariable analysis adjusted for patient and clinical characteristics (2009-2013) (N=29,209).
| Multivariable | |||
|---|---|---|---|
| Variable | Hazard Ratio | 95% CI | p-value |
| Country | |||
| Canada | 0.66 | (0.54-0.81) | 0.002 |
| United States | 1.00 | -- | -- |
| Sex | |||
| Males | 1.00 | -- | -- |
| Females | 1.40 | (1.25-1.58) | <0.001 |
| Age at diagnosis | |||
| <2 yrs | 1.02 | (0.90-1.17) | 0.70 |
| ≥2 yrs | 1.00 | -- | -- |
| Pancreatic Status | |||
| Insufficient | 1.18 | (0.93-1.49) | 0.15 |
| Sufficient | 1.00 | -- | -- |
| BMI | |||
| Underweight | 1.48 | (1.29-1.69) | <0.001 |
| Normal | 1.00 | -- | -- |
| Overweight | 0.92 | (0.74-1.15) | 0.43 |
| CF-related diabetes | |||
| Yes | 1.67 | (1.47-1.88) | <0.001 |
| No | 1.00 | -- | -- |
| FEV1 % predicted Microbiology | 0.939 | (0.935-0.943) | <0.001 |
| B. cepacia complex | 1.64 | (1.25-2.14) | 0.002 |
| MRSA | 1.35 | (1.09-1.66) | 0.011 |
| P. aeruginosa | 1.17 | (0.96-1.42) | 0.11 |
| None of the Above | 1.00 | -- | -- |
Abbreviations: B. cepacia complex, Burkholderia cepacia complex; BMI, body mass index; CI, confidence interval; FEV1 % predicted, forced expiratory volume in 1 second percent predicted; HR, hazard ratio; MRSA, methicillin-resistant Staphylococcus aureus; P. aeruginosa, Pseudomonas aeruginosa
Data were limited to patients ≥ 6 years of age with a valid FEV1 measurement. Reference values for percent predicted FEV1 were calculated using the GLI reference values. Patients were censored at transplant.
Discussion
Our study confirms a significant survival gap between Canada and the US in individuals living with CF. In the most recent time period (2009-2013), a ten-year survival advantage was identified for patients living in Canada which cannot be attributed to methodology or data processing techniques. The risk of death was consistently lower in Canada after accounting for multiple patient demographic and clinical factors, and persisted in patients with severe clinical phenotypes. The systematic approach used to compare data from these two countries demonstrates that national disease registries can be meaningfully compared and can elucidate factors associated with differences in survival. While we cannot draw definitive causal inferences from these analyses, the observed differences raise the question of differences in access to therapeutic approaches or health care delivery, such that hypotheses can be generated for further investigation.
Although our study was not designed to specifically evaluate the impact of transplant on survival, few therapeutic interventions have the ability to impact survival in a short time period, and several of our findings supported the hypothesis that transplantation may be contributing to the observed survival gap. Firstly, we found that more Canadians with CF received a transplant in the contemporary study period compared to US CF patients despite having similar proportion of patients with severe lung disease based on FEV1. Secondly, a higher proportion of deaths in the US occurred in patients who had not received a transplant compared to the Canada. Thirdly, when we censored patients at transplant, the median age of survival increased from 10 years to 13 years suggesting transplant contributes to the survival gap. And lastly, we observed a significant widening of the survival gap between the countries since 2005, a year that corresponds to a marked change in how US CF patients were prioritized for lung transplant with the implementation of the lung allocation score (LAS) in May 2005, which is not used in Canada.(31)
Existing literature further supports the possible role that transplant plays in the Canada-US survival gap. For instance, median survival post-lung transplant is longer in Canadian CF patients compared to published studies of US CF patients.(32) (33) Although the LAS has been associated with shorter waiting times and improved transplant survival(35), and the number of patients with CF listed for lung transplantation has increased since its implementation, the proportion who have received a transplant has decreased.(36) In addition, Merlo et al showed that CF patients transplanted since the LAS was implemented had a higher risk of death compared to CF patients transplanted in the pre-LAS period.(35) These studies suggest that differential access to lung transplant and survival post-transplant between Canada and the US may contribute to the survival gap although this hypothesis requires further study.
Although transplant may play a role, there are likely other factors that are contributing to the survival gap seen. One such factor may be the substantial difference in healthcare delivery between Canada and the US. In Canada, universal healthcare provides all individuals with the opportunity to access medical services across the country; in the US, differing health insurance coverage impacts access to medical care and costs of care and is related to socioeconomic status (SES).(30;33) Indeed we observed health insurance status in the US had a differential effect on the risk of death for individuals living with CF compared to Canada. Interestingly, there was no statistically significant difference in risk of death among Canadians and those in the US with “other” insurance (which was comprised primarily of individuals with private coverage). We were unable to draw firm conclusions on the impact of SES on the survival gap since the Canadian registry did not capture SES data. While all Canadians have access to healthcare regardless of SES, this does not imply that SES does not impact survival in Canada. There are hidden financial factors that may limit the ability of patients to seek medical attention in Canada, for example, the costs associated with taking time off work, driving long distances to be seen at a CF center, or having to relocate to a CF transplant center. The fact that the risk of death in the US varied by the type of health insurance raises the possibility that differences in the health care systems may explain part of the survival gap documented; however, further study is needed to formally evaluate this question.
Previous comparisons between Canada and the US in the 1980's suggested that implementation of aggressive nutritional support in the early 1970s in Toronto led to improved survival compared with Boston.(6) As a result, the high-fat diet was adopted worldwide for individuals with CF. Those born in Canada in the 1970s would have been exposed to aggressive nutritional supplementation from birth and the impact of early nutrition would have reduced their risk of death in their later teen and early adult years. As such, one would expect that US survival would catch up to Canada since CF centers in the US also implemented the high calorie diet, albeit 5-10 years later.
The strengths of our study include the large sample size, the longitudinal data within both CF registries, the consistency of our results across multiple sub-groups and the unified approach to the analysis. There is a high participation rate in both registries and CF clinics receive financial incentives for data submission which results in a comprehensive national picture of the CF population. However, missing vital statistics could result in biased survival estimates, particularly if there was a disproportionate number of missing events in one country compared with the other.(15) Prior literature suggests death dates are missing in the US CFFPR, particularly in those over the age of 45 years, when compared to national vital statistics;(37) whereas the number of deaths in the CCFR is similar to Canadian vital statistics.(5) If the US data were preferentially missing deaths, this would result in an overestimation of the true US CF survival. Our data also show that there were more US patients lost to follow-up compared to Canada, which would have the opposite effect on survival estimates (typically having more patients lost to follow-up results in an underestimation of median survival).(15) It is also worth noting that more of the US lost to follow-up patients had characteristics associated with a worse prognosis for example, female sex, non-Caucasian race, pancreatic insufficiency, CFRD etc. (Table S8) compared to Canada. By preferentially excluding US patients with a worse prognosis from the survival analysis, the survival gap may actually be wider than reported in our study. Differential inclusion of patients with a mild clinical phenotype in the registry may result in a survival gap simply because one country captures patients with mild disease compared to another country. The fact that our findings were consistent across multiple subgroups, including those that have a severe clinical phenotype, suggests that higher survival in Canada relative to the US is not due to following milder patients in the Canadian cohort. Differences in medication use may play a role in the survival gap; interestingly, between 2011 and 2013 medication use was higher in the US, however we were unable to examine medication for the full study period due to lack of medication data prior to 2011 in Canada. While environmental factors such as air pollution or climate may impact lung health in CF, these data were not equally available within the registries (air pollution data have only been linked to the US CFFPR). Newborn screening (NBS) programs have been in place longer in the US compared to Canada however this is unlikely to significantly affect the current survival estimates as there are relatively few pediatric deaths in both countries. Furthermore, having more extensive NBS programs in the US would bias the results towards the null as these individuals would presumably be healthier. Regional or center-specific death rates between the countries were not conducted due to relatively few deaths within any given center which would produce unreliable survival estimates.
In conclusion, we show a difference in survival between Canada and the US even after adjusting for patient characteristics and clinical factors known to be associated with survival. The survival differences appear to diverge at two distinct time points, most notably in 2005, when the gap between the two countries widens. Differential access to transplantation related to the referral or donor lung allocation process, variable post-transplant survival and differences in the healthcare systems may, in part, explain the Canadian survival advantage. Further studies are necessary in order to specifically test these hypotheses.
Supplementary Material
Acknowledgments
We would like to acknowledge the support of the US CFF and Cystic Fibrosis Canada which made this study possible. In addition, we would like to acknowledge and thank all of the CF patients and families in the USA and Canada who consent to be part of their respective national CF patient registries as well as the CF clinic staff who spend many hours inputting the data.
Funding: CHG receives funding from the Cystic Fibrosis Foundation, the NIH (R01HL103965, R01HL113382, R01AI101307, U M1HL119073, P30DK089507) and the FDA (R01FD003704)
Primary funding source: US Cystic Fibrosis Foundation
Footnotes
Author Contributions: Dr. Stephenson had full access to all of the data in the study and takes responsibility for the integrity of the data, the accuracy of the data analysis, and had final responsibility for the decision to submit for publication.
Study concept and design: Stephenson, Stanojevic, Goss, Marshall, Quon, Marshall, Petren, Ostrenga, Fink, Elbert.
Acquisition and merging of data: Stephenson, Sykes, Stanojevic, Petren, Ostrenga, Elbert.
Analysis and interpretation of data: Stephenson, Sykes, Stanojevic, Goss, Quon, Marshall, Petren, Ostrenga, Fink, Elbert.
Drafting of the manuscript: Stephenson.
Critical revision of the manuscript for important intellectual content: Stephenson, Sykes, Stanojevic, Goss, Quon, Marshall, Marshall, Petren, Ostrenga, Fink, Elbert.
Statistical analysis: Stephenson, Sykes, Stanojevic, Ostrenga, Fink.
Obtained funding: Stephenson, Stanojevic, Goss, Quon.
Study supervision: Stephenson.
Reproducible Research Statement: Study protocol: not available. Statistical code: available from Dr. Stephenson (e-mail, stephensona@smh.ca). Data set: available upon request from the US CFF Foundation and Cystic Fibrosis Canada.
Reference List
- 1.George PM, Banya W, Pareek N, Bilton D, Cullinan P, Hodson ME, et al. Improved survival at low lung funciton in cystic fibrosis: cohort study from 1990 to 2007. BMJ. 2011;342:d1008. doi: 10.1136/bmj.d1008. [DOI] [PMC free article] [PubMed] [Google Scholar]
- 2.Yen EH, Quinton HB, Borowitz DS. Better nutritional status in early childhood is associated with improved clinical outcomes and survival in patients with cystic fibrosis. J Pediatr. 2013;162(3):530–535. doi: 10.1016/j.jpeds.2012.08.040. [DOI] [PubMed] [Google Scholar]
- 3.MacKenzie T, Gifford AH, Sabadosa KA, Quinton HB, Knapp EA, Goss CH, et al. Longevity of patients with cystic fibrosis in 2000 to 2010 and beyond: survival analysis of the Cystic Fibrosis Foundation patient registry. Ann Intern Med. 2014;161(4):233–241. doi: 10.7326/M13-0636. [DOI] [PMC free article] [PubMed] [Google Scholar]
- 4.Liou TG, Adler FR, FitzSimmons SC, Cahill BC, Hibbs JR, Marshall BC. Predictive 5-year survivorship model of cystic fibrosis. Am J Epidemiol. 2001;153(4):345–352. doi: 10.1093/aje/153.4.345. [DOI] [PMC free article] [PubMed] [Google Scholar]
- 5.Corey M, Farewell V. Determinants of mortality from cystic fibrosis in Canada, 1970-1989. Am J Epidemiol. 1996;143(10):1007–1017. doi: 10.1093/oxfordjournals.aje.a008664. [DOI] [PubMed] [Google Scholar]
- 6.Corey M, McLaughlin FJ, Williams M, Levison H. A comparison of survival, growth, and pulmonary function in patients with cystic fibrosis in Boston and Toronto. J Clin Epidemiol. 1988;41(6):583–591. doi: 10.1016/0895-4356(88)90063-7. [DOI] [PubMed] [Google Scholar]
- 7.Goss CH, MacNeill SJ, Quinton HB, Marshall BC, Elbert A, Knapp EA, et al. Children and young adults with CF in the USA have better lung function compared with the UK. Thorax. 2015;70:229–236. doi: 10.1136/thoraxjnl-2014-205718. [DOI] [PMC free article] [PubMed] [Google Scholar]
- 8.Fogarty A, Hubbard R, Britton J. International comparison of median age at death from cystic fibrosis. Chest. 2000;117(6):1656–1660. doi: 10.1378/chest.117.6.1656. [DOI] [PubMed] [Google Scholar]
- 9.Kollberg H. Incidence and survival curves of cystic fibrosis in Sweden. Acta Paediatr Scand. 1982;71:197–202. doi: 10.1111/j.1651-2227.1982.tb09399.x. [DOI] [PubMed] [Google Scholar]
- 10.Jackson AD, Daly L, Kelleher C, Marshall BC, Quinton HB, Foley L, et al. The application of current lifetable methods to compare cystic fibrosis median survival internationally is limited. J Cyst Fibros. 2011;10:62–65. doi: 10.1016/j.jcf.2010.08.021. [DOI] [PubMed] [Google Scholar]
- 11.McCormick J, Mehta G, Olesen HV, Viviani L, Macek Jr M, Mehta A. Comparative demographics of the European cystic fibrosis population: a cross-sectional database analysis. Lancet. 2010;375:1007–1013. doi: 10.1016/S0140-6736(09)62161-9. [DOI] [PubMed] [Google Scholar]
- 12.Martin B, Schechter MS, Jaffe A, Cooper P, Bell SC, Ranganathan S. Comparison of the US and Australian cystic fibrosis registries: the impact of newborn screening. Pediatrics. 2012;129(2):e348–e355. doi: 10.1542/peds.2011-0567. [DOI] [PubMed] [Google Scholar]
- 13.Cystic Fibrosis Canada. Annual Registry Report. 2011 Ref Type: Report. [Google Scholar]
- 14.Cystic Fibrosis Foundation. Cystic Fibrosis Foundation National Patient Registry Annual Data Report. 2011 Ref Type: Report. [Google Scholar]
- 15.Sykes J, Stanojevic S, Goss CH, Quon BS, Marshall BC, Petren K, et al. A standardized approach to estimating survival statistics for population based cystic fibrosis registry cohorts. J Clin Epidemiol. 2015 doi: 10.1016/j.jclinepi.2015.08.026. [DOI] [PMC free article] [PubMed] [Google Scholar]
- 16.McCormick J, Sims EJ, Green MW, Mehta G, Culross F, Mehta A. Comparative analysis of Cystic Fibrosis Registry data from the UK with USA, France and Australasia. J Cyst Fibros. 2005;4:115–122. doi: 10.1016/j.jcf.2005.01.001. [DOI] [PubMed] [Google Scholar]
- 17.Farrell PM, Rosenstein BJ, White TB, Accurso FJ, Castellani C, Cutting GR, et al. Guidelines for Diagnosis of Cystic Fibrosis in Newborns through Older Adults: Cystic Fibrosis Foundation Consensus Report. J Pediatr. 2008;153:S4–S14. doi: 10.1016/j.jpeds.2008.05.005. [DOI] [PMC free article] [PubMed] [Google Scholar]
- 18.Aaron SD, Stephenson AL, Cameron DW, Whitmore GA. A statistical model to predict one-year risk of death in patients with cystic fibrosis. J Clin Epidemiol. 2014;S0895-4356(14):00542–3. doi: 10.1016/j.jclinepi.2014.12.010. pii. [DOI] [PubMed] [Google Scholar]
- 19.Stanojevic S, Wade A, Stocks J, Hankinson J, Coates AL, Pan H, et al. Reference ranges for spirometry across all ages: a new approach. Am J Respir Crit Care Med. 2008;177(3):253–260. doi: 10.1164/rccm.200708-1248OC. [DOI] [PMC free article] [PubMed] [Google Scholar]
- 20.Kuczmarski RJ, Ogden CL, Grummer-Strawn LM, Flegal KM, Guo SS, Wei R, et al. CDC growth charts: United States. Adv Data. 2000;(314):1–27. [PubMed] [Google Scholar]
- 21.Cole TJ, Bellizzi MC, Flegal KM, Dietz WH. Establishing a standard definition for child overweight and obeisty worldwide: international survey. BMJ. 2000;320(7244):1240–1243. doi: 10.1136/bmj.320.7244.1240. [DOI] [PMC free article] [PubMed] [Google Scholar]
- 22.World Health Organization. BMI Classification. Geneva, Switzerland: 2013. p. 2012. Ref Type: Online Source. [Google Scholar]
- 23.Moran A, Hardin D, Rodman D, llen AF, eall RJ, orowitz D, et al. Diagnosis, screening and management of cystic fibrosis related diabetes mellitus: a consensus conference report. Diabetes Res Clin Pract. 1999;45:61–73. doi: 10.1016/s0168-8227(99)00058-3. [DOI] [PubMed] [Google Scholar]
- 24.Kerem E, Kerem B. Genotype-phenotype correlations in cystic fibrosis. Pediatr Pulmonol. 1996;22:387–395. doi: 10.1002/(SICI)1099-0496(199612)22:6<387::AID-PPUL7>3.0.CO;2-G. [DOI] [PubMed] [Google Scholar]
- 25.Normand SLT, Landrum MB, Guadagnoli E, Ayanian JZ, Ryan TJ, Cleary PD, et al. Validating recommendations for coronary angiography following acute myocardial infarction in the elderly: A matched analysis using propensity scores. J Clin Epidemiol. 2001;54:387–398. doi: 10.1016/s0895-4356(00)00321-8. [DOI] [PubMed] [Google Scholar]
- 26.Muggeo V. Estimating regression models with unknown break-points. Stat Med. 2003;22:3055–3071. doi: 10.1002/sim.1545. [DOI] [PubMed] [Google Scholar]
- 27.van Buuren S, Groothuis-Oudshoorn K. MICE: Multivariate imputation by chained equations in R. J Statistical Software. 2011;45(3):1–67. [Google Scholar]
- 28.Lai HJ, Cheng Y, Cho H, Kosorok MR, Farrell PM. Association between initial disease presentation, lung disease outcomes, and survival in patients with cystic fibrosis. Am J Epidemiol. 2004;159(6):537–546. doi: 10.1093/aje/kwh083. [DOI] [PubMed] [Google Scholar]
- 29.Quon BS, Psoter K, Mayer-Hamblett N, Aitken ML, Li CI, Goss CH. Disparities in access to lung transplantation for patients with cystic fibrosis by socioeconomic status. Am J Respir Crit Care Med. 2012;186(10):1008–1013. doi: 10.1164/rccm.201205-0949OC. [DOI] [PMC free article] [PubMed] [Google Scholar]
- 30.Schechter MS, Shelton BJ, Margolis PA, FitzSimmons SC. The association of socioeconomic status with outcomes in cystic fibrosis patients in the United States. Am J Respir Crit Care Med. 2001;163(6):1331–1337. doi: 10.1164/ajrccm.163.6.9912100. [DOI] [PubMed] [Google Scholar]
- 31.Egan TM, Murray S, Bustami RT, Shearon TH, McCullough KP, Edwards LB, et al. Development of the new lung allocation system in the United States. Am J Transplant. 2006;6:1212–1227. doi: 10.1111/j.1600-6143.2006.01276.x. [DOI] [PubMed] [Google Scholar]
- 32.Stephenson AL, Sykes J, Berthiaume Y, Singer LG, Aaron SD, Whitmore GA, et al. Clinical and demographic factors associated with post-lung transplantation survival in individuals with cystic fibrosis. J Heart Lung Transplant. 2015 doi: 10.1016/j.healun.2015.05.003. [DOI] [PubMed] [Google Scholar]
- 33.Merlo CA, Clark SC, Arnaoutakis GJ, Yonan N, Thomas D, Simon A, et al. National Healthcare Delivery Systems Influence Lung Transplant Outcomes for Cystic Fibrosis. Am J Transplant. 2015:1–10. doi: 10.1111/ajt.13226. Ref Type: Abstract. [DOI] [PubMed] [Google Scholar]
- 34.Ramos KJ, Quon BS, Psoter K, Lease ED, Mayer-Hamblett N, Aitken ML, et al. Predictors of non-referral of patients with cystic fibrosis for lung transplant evaluation in the United States. J Cyst Fibros. 2015 doi: 10.1016/j.jcf.2015.11.005. [DOI] [PMC free article] [PubMed] [Google Scholar]
- 35.Merlo CA, Weiss ES, Orens J, Borja MC, Diener-West M, Conte JV, et al. Impact of U.S. lung allocation score on survival after lung transplantation. J Heart Lung Transplant. 2009;28:769–775. doi: 10.1016/j.healun.2009.04.024. [DOI] [PubMed] [Google Scholar]
- 36.Gries CJ, Mulligan MS, Edelman JD, Raghu G, Curtis JR, Goss CH. Lung allocation score for lung transplantation. Chest. 2007;132:1954–1961. doi: 10.1378/chest.07-1160. [DOI] [PubMed] [Google Scholar]
- 37.Nick JA, Chacon CS, Brayshaw SJ, Jones MC, Barboa CM, Clair CG, et al. Effects of gender and age at diagnosis on disease progression in long-term survivors of cystic fibrosis. Am J Respir Crit Care Med. 2010;182(5):614–626. doi: 10.1164/rccm.201001-0092OC. Ref Type: Abstract. [DOI] [PMC free article] [PubMed] [Google Scholar]
Associated Data
This section collects any data citations, data availability statements, or supplementary materials included in this article.