Abstract
The distinction between viable and dead cells is a major issue in many aspects of biological research. The current technologies for determining viable versus dead cells cannot readily be used for quantitative differentiation of specific cells in mixed populations. This is a serious limitation. We have solved this problem by developing a new concept with the viable/dead stain ethidium monoazide (EMA) in combination with real-time PCR (EMA-PCR). A dynamic range of approximately 4 log10 was obtained for the EMA-PCR viable/dead assay. Viable/dead differentiation is obtained by covalent binding of EMA to DNA in dead cells by photoactivation. EMA penetrates only dead cells with compromised membrane/cell wall systems. DNA covalently bound to EMA cannot be PCR amplified. Thus, only DNA from viable cells can be detected. We evaluated EMA-PCR with the major food-borne bacterium Campylobacter jejuni as an example. Traditional diagnosis of this bacterium is very difficult due to its specific growth requirements and because it may enter a state where it is viable but not cultivable. The conditions analyzed included detection in mixed and natural samples, survival in food, and survival after disinfection or antibiotic treatment. We obtained reliable viable/dead quantifications for all conditions tested. Comparison with standard fluorescence-based viable/dead techniques showed that the EMA-PCR has a broader dynamic range and enables quantification in mixed and complex samples. In conclusion, EMA-PCR offers a novel real-time PCR method for quantitative distinction between viable and dead cells with potentially very wide application.
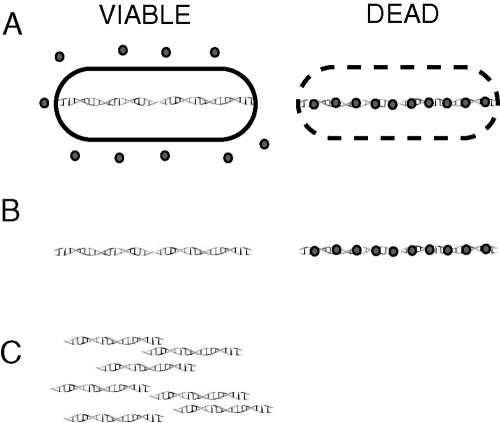
We have developed a novel concept for quantification of viable and dead cells in complex samples. The viable/dead stain ethidium monoazide (EMA) is used in combination with real-time PCR to inhibit amplification of DNA from dead cells that have taken up EMA (Fig. 1). Viable/dead determinations are key issues in many aspects of biological research. The current technologies addressing this important issue have severely limited application ranges (4, 5, 14, 18, 19). There are for instance no approaches enabling accurate viable/dead quantifications in mixed cell populations (2, 13).
FIG. 1.
Schematic representation of EMA-PCR. (A) EMA is added to the test sample containing both viable and dead cells. EMA penetrates the dead cells and binds to the DNA. Light exposure for 1 min leads to covalent binding and inactivation of free EMA. EMA does not enter viable cells. (B) There are two populations of DNA after purification. The DNA population from viable cells is unstained, while the DNA from the dead cells is covalently bound to EMA. (C). The unstained DNA from viable cells is PCR amplified, while the DNA from dead cells with bound EMA cannot be amplified.
Real-time PCR is the most widely applied technology for direct quantification of cells in mixed samples. Real-time PCR is increasingly being used for direct detection and quantification of pathogens in foods and environmental or clinical samples. Still, a major obstacle with PCR diagnostics is how to distinguish between DNA from viable and dead cells. Intact DNA can be present although the organisms are dead. This is particularly relevant for pathogens subjected to killing treatments such as disinfections or antibiotics. Even greater challenges are encountered with organisms such as Campylobacter jejuni that have specific growth requirements and may enter a state where it is viable and infectious but not cultivable. The lack of viable/dead differentiation has been a serious limitation for the implementation of DNA diagnostics in routine applications (15, 19, 22).
We have recently used ethidium monoazide (EMA)-PCR for qualitative DNA-based viable/dead differentiation of bacteria in pure monoculture models (21). Viable/dead analyses of pure monocultures are not new or novel. A wide range of different approaches exist (2, 5, 10, 12, 25, 26). Methods for direct quantitative analyses of complex samples, however, are still lacking. Solving these analytical problems would be a major technological breakthrough. We discovered during the work with the monoculture models that EMA-PCR has this potential. Thus, the aim of the present work was to use EMA-PCR to show that it is possible to develop quantitative assays for specific viable and dead bacteria in complex samples with mixed bacterial populations. We developed the assay for the major food-borne pathogenic bacterium C. jejuni due to the apparent need for new viable/dead diagnostics of this bacterium. The conditions analyzed include detection in mixed and natural samples, survival in foods, and after disinfection and antibiotic treatments. This knowledge is crucial both for diagnostics and in the control of C. jejuni.
A dynamic range of more than 4 log10 was obtained for the EMA-PCR viable/dead assay. We were able to reliably quantify the fraction of viable C. jejuni under all conditions tested, including complex samples with mixed populations. This is to our knowledge the first time that quantitative viable/dead information has been obtained from specific bacteria in mixed populations. C. jejuni was used as an example of the wide application range for EMA-PCR on other bacteria and eukaryotes.
MATERIALS AND METHODS
Strains and culture conditions.
C. jejuni stain NCTC 11168 (National Collection of Type Cultures, Colindale, London, United Kingdom) was used for the main experimental series in this study. The following Matforsk strains were also applied: C-523 (from poultry feces), C-526 (from sheep feces), C-484 (from a poultry leg), C-534 (from poultry feces), and C-285 (from poultry meat).
C. jejuni was grown on selective blood agar plates (Oxoid Ltd., Basingstoke, England) in a microaerobic atmosphere for 48 h at 42°C. One colony was used to inoculate 50 ml of Mueller-Hinton (MH) broth (Oxoid Ltd.) and incubated microaerobically for 48 h at 42°C to a cell density of approximately 5 × 10⁸ CFU/ml (determined by plating). Cultures were then subjected to different treatments. Escherichia coli O157 MF 667 (Matforsk), Salmonella sp. ATCC 13311 (American Type Culture Collection, Rockville, Md.), and Listeria monocytogenes DSMZ 20600 (Deutsche Sammlung von Mikroorganismen und Zellkulturen GmbH, Braunschweig, Germany) were used for the experiments where the effect of the background microflora was tested. The strains were grown overnight at 37°C to a cell density of approximately 109 CFU/ml in 50 ml of MH broth.
BacLight live/dead fluorescence microscopy.
We centrifuged 1 ml of bacterial culture at 10 000 × g at 4°C in a microcentrifuge for 10 min. The supernatant was removed and the cells were resuspended in 1 ml of filter-sterilized peptone water. This suspension was diluted to give approximately 107 CFU/ml. The two-color fluorescence assay BacLight bacterial viability kit (Molecular Probes Europe BV, Leiden, The Netherlands) was used to stain the organisms for microscopy. Syto 9 stain generally labels all bacteria in a population green, while propidium iodide penetrates only bacteria with damaged membranes and labels them red, i.e., reducing the Syto 9 stain fluorescence when both dyes are present. The samples were stained with BacLight following the manufacturer's instructions, incubated for 15 min, and filtered through Osmonic 25-mm polycarbonate filters (Osmonic Inc., Minnetonka, Minn.), washed with peptone-water, and mounted on slides.
EMA-PCR.
Ethidium monoazide bromide (EMA) was purchased from Molecular Probes Europe BV (Leiden, The Netherlands). EMA was added to samples at a final concentration of 100 μg/ml. The samples were then incubated in the dark for 5 min and subsequently exposed to light for 1 min. The light source was an Osram SLG 1000 with a 650-W halogen lightbulb, which was placed 20 cm from the sample tubes. The microcentrifuge tubes were placed on ice prior to light exposure to minimize elevated temperature in the samples.
DNA was isolated with PrepMan sample preparation reagent from Applied Biosystems (Foster City, Calif.) as described by the manufacturer (PrepMan Protocol 1998, Applied Biosystems). The samples (0.10 to 0.15 ml) were added to 0.2 ml of PrepMan extraction reagent and incubated at 56°C for 30 min. The samples were then vortexed for 10 s, boiled for 8 min, and centrifuged at 16,000 × g for 5 min. All EMA reactions were done in triplicate. The supernatants were diluted and subjected to 5′-nuclease PCR.
Real-time quantitative PCR amplification was carried out as described by Nogva et al. (10). The 50-μl reaction mixture contained 1× TaqMan buffer, 5 mM MgCl2, 200 μM each dATP, dCTP, and dGTP, 400 μM dUTP, 0.02 μM C. jejuni-specific probe (5′-TCT CCT TGC TCA TCT TTA GGA TAA ATT CTT TCA CA-3′) with 6-FAM as the reporter (5′) and TAMRA as the quencher (3′) and 0.3 μM C. jejuni-specific primers AB-F (5′-CTG AAT TTG ATA CCT TAA GTG CAG C-3′) and AB-R (5′-CTG AAT TTG ATA CCT TAA GTG CAG C-3′), 1 U of AmpErase uracil N-glycosylase, and 2.5 U of AmpliTaq Gold DNA polymerase (Applied Biosystems). The enzyme was heat activated at 95°C for 10 min prior to amplification. The amplification profile used was 40 cycles of 95°C for 20 s and 60°C for 1 min. The reactions were performed with the ABI Prism 7700 sequence detection system (Applied Biosystems). An 86-bp fragment including positions 381121 to 381206 of the published C. jejuni strain NCTC 11168 genome sequence (http://www.sanger.ac.uk/Projects/C_jejuni/) with a GC content of 37.5% was amplified.
EMA signal reduction (EMASR) represents the DNA fraction that can be PCR amplified in the EMA-treated samples. EMASR = (1 + EU)CTuntr/(1 + ET)CTtreat, where CTtreat is the CT value for the EMA-treated sample and CTuntr is the CT for the corresponding untreated sample. EU and ET are the amplification efficiencies of the untreated and the EMA-treated samples, respectively. Since the same primer/probe pairs are used under identical reaction conditions, EU = ET and the above equation reduces to EMASR = (1 + E)(CTuntr − CTtreat), where E is the amplification efficiency. The EU = ET assumption has also been experimentally confirmed (21).
To make correlations between viable cells determined by EMA-PCR against viable cells determinations in known standard mixtures, 10-fold serial dilutions of viable bacteria in the corresponding heat-killed bacteria were made and subjected to EMA-PCR. If all the DNA in dead cells is inactivated and all the DNA in viable cells can be PCR amplified after EMA treatment, then one expects a linear relationship between the log10 fraction of viable cells and log10 EMASR. For the empirical data, however, deviations from linearity were observed, particularly when approaching the detection limit of the assay. We used the best-fit polynomial regression formula y = 0.926x3 + 3.369x2 + 4.533x, R2 = 0.98 (−2.5 ≤ x ≤0) to correct for linear deviations and to estimate the log10 viable cell fraction (y) from the log10 of the EMASR (x).
Spiking experiments.
Chicken breast and leg muscle were spiked with 0.1 to 0.5 ml (approximately 108 CFU/ml) of viable or heat-killed bacteria spread on the surface of the samples. For the storage experiments, the chicken breasts and legs were packed in a high-CO2/low-O2 or normal atmosphere. The samples were then inoculated through a self-sealing adhesion tape. The bacteria were isolated by swabbing with Q-Tip swabs (Cheseborough-Ponds Inc.). We swabbed 25 cm2, and the material was resuspended in 3 ml of MH broth. The DNA purification was then done as described for EMA-PCR.
Heat and disinfection treatments.
The bacteria were either heat treated for 30 min (25, 72, or 100°C) or pelleted at 5 to 6,000 × g for 7 min at 4°C and resuspended in the killing agents 70% ethanol or 500 ppm benzalkonium chloride and incubated at 20°C for 30 min. Finally, the samples were pelleted and resuspended in the original volumes of BHI medium before being subjected to EMA-PCR.
Antibiotic treatments.
The following antibiotics were used: nalidixic acid (16 μg/ml), trimethoprim and sulfamethoxazole (320 μg/ml), erythromycin (16 μg/ml), gentamicin (32 μg/ml), and tetracycline (16 μg/ml). The antibiotic treatments were done by adding antibiotics to bacteria in logarithmic growth. The effects were then followed in time courses by plating.
Uptake and efflux of EMA in viable cells.
The uptake and efflux of EMA in viable cells were investigated by the addition of 20 μM carbonyl cyanide m-chlorophenylhydrazone (CCCP), 20 μM N,N-dicyclohexylcarbidoimide (DCCD), and 200 μM tetraphenylarsonium (TPA). The reagents were added to the medium prior to the 5-min incubation in the dark (see the EMA protocol above).
Statistical analyses.
Polynomial regression (Microsoft Excel 2000) was used to determine the correlation between log10 EMASR and the predicted fraction of live and dead cells, dead cells being those which the EMA had entered. Statistical tools provided in the Minitab software package (version 13.3) were used for the standard statistical analyses. Principal component analyses (The Unscrambler; Camo Inc., Corvallis, Oreg.) were used to investigate the survival patterns of C. jejuni in spiked, stored samples. Basically, principal component analysis is a tool to visualize the major patterns in complex data sets. The principal component analyses were done with full cross validation with centered and normalized data. The variables were weighted according to their standard deviations. Principal component analysis is a bilinear modeling method which gives an interpretable overview of the main information in a multidimensional data table. The information carried by the original variables is projected onto a smaller number of underlying (“latent”) variables called principal components. The first principal component covers as much of the variation in the data as possible. The second principal component is orthogonal to the first and covers as much of the remaining variation as possible, and so on. By plotting the principal components, one can view interrelationships between different variables and detect and interpret sample patterns, groupings, similarities, or differences.
RESULTS AND DISCUSSION
Correlation between EMA-PCR and viable cell fraction.
EMASR represents the DNA fraction that can be PCR amplified in the EMA-treated samples. We determined the relationship between EMASR and the viable cell fraction by diluting viable bacteria in a background of heat-killed bacteria. From the EMASR, the fraction of viable cells was calculated as described in Materials and Methods. We defined a 100% viable cell fraction as the fraction giving no response to EMA treatment (log10 EMASR = 0). Our empirical data indicated that there were some variations in the fraction of dead cells or free DNA in different fresh cultures (log10 EMASR in the range 0 to −0.5).
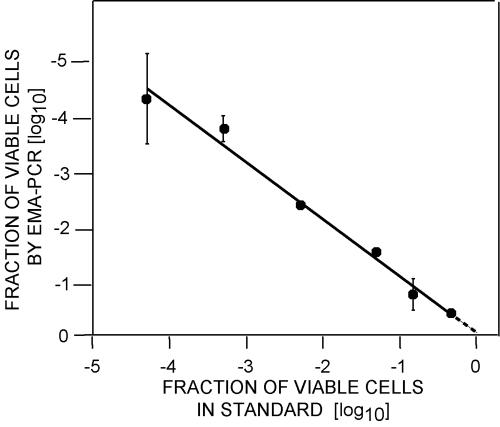
EMA-PCR gave a good quantitative prediction of the fraction of viable cells over a range of 0 to −4 log10 compared to known standards (R2 = 0.98) (Fig. 2). The detection limit of the assay corresponded to a viable cell fraction of approximately −4.5 log10. The standard curves obtained from these experiments were used for quantifications throughout this work.
FIG. 2.
Determination of viable cell fraction by EMA-PCR. An overnight culture containing approximately 5.0 × 10⁸ CFU/ml was diluted in a background of corresponding heat-killed bacteria (boiled for 10 min). The fraction of viable cells as determined by EMA-PCR was plotted against that of cultures with known fractions of viable cells. The broken line depends on the fraction of dead cells in fresh cultures (see text for explanations). The error bars represent standard deviations from three independent replicates.
Effect of background microflora on the EMA-PCR results.
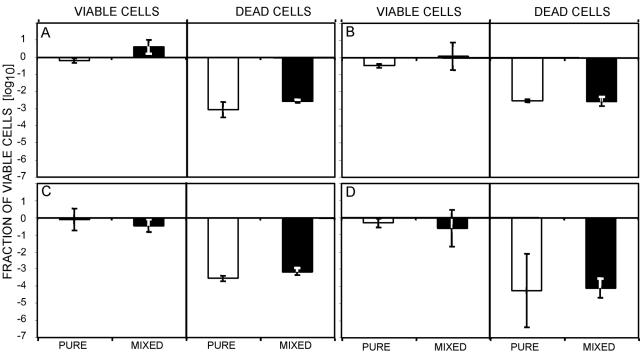
The main potential of the EMA-PCR is viable/dead analyses of specific cells in mixed samples containing several different bacteria. We evaluated the EMA-PCR with four different viable or heat-killed C. jejuni strains in both the presence and absence of background microflora (Fig. 3). The background microflora did not influence the EMA-PCR viable/dead assay for either viable or dead C. jejuni. The signals and amplification efficiencies obtained seemed unaffected by the presence of other bacteria. This shows that EMA-PCR can be used for viable/dead quantifications in mixed bacterial populations. The relatively large standard deviation for the killed bacteria in pure culture for strain C-534 was probably due to the small amounts of DNA that could be amplified. Viable/dead quantifications in mixed populations have not been readily possible with other methods.
FIG. 3.
Effect of background microflora on the EMA-PCR. Four different viable or heat-killed C. jejuni strains (approximately 107 CFU/ml), (A) NTNC 11168, (B) C-484, (C) C-526, and (D) C-534, were analyzed by EMA-PCR either alone or in a background of approximately 108 CFU/ml each of viable Escherichia coli O157, Salmonella spp., and Listeria monocytogenes. The white and black columns show the EMA-PCR results for pure cultures and cultures with background microflora, respectively. The error bars represent standard deviations from three independent replicates.
Viable/dead analyses of spiked poultry samples.
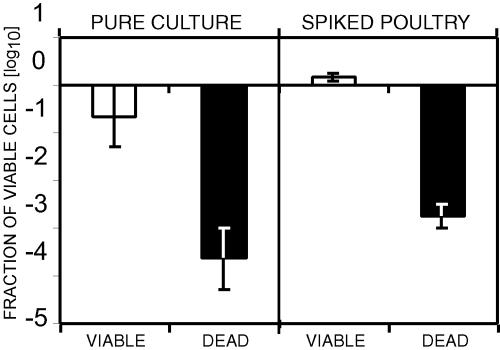
Surface contamination of poultry products is one of the major contamination routes for C. jejuni (7). We used spiked poultry breast muscle as a model in evaluating the EMA-PCR. The samples were spiked with viable or dead C. jejuni cells. The bacteria were then isolated from the spiked samples, and viability was determined by EMA-PCR (Fig. 4). Good agreements were obtained for both viable and dead bacteria when the results from the spiked samples were compared to the results for the original cultures used for spiking. The only difference observed was that the original viable culture contained a fraction staining as dead (either free DNA or dead cells). This fraction was apparently removed during sample preparation. The conclusion from this experiment was that it is possible to do viable/dead quantifications directly from poultry products with EMA-PCR.
FIG. 4.
Analyses of poultry samples spiked with viable or dead bacteria. Chicken breasts were spiked with a pure culture of viable or heat-killed (boiled for 10 min) C. jejuni NTNC 11168, treated as described in Materials and Methods. The error bars represent standard deviations from three independent replicates.
Use of EMA-PCR to study survival on poultry products.
Traditional methods cannot be used reliably to investigate survival of C. jejuni on poultry products (3, 17, 27, 28, 30) because C. jejuni is very difficult to grow and the background microflora influence the results. It is, however, of principal importance to the control of this bacterium to know how C. jejuni survives on poultry products.
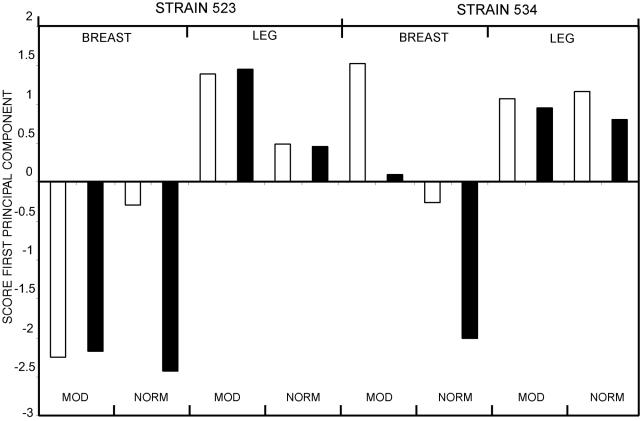
Chicken breasts and legs were spiked with viable C. jejuni and stored at 5 and 12°C in both a modified and a normal atmosphere for up to 19 days. Survival of C. jejuni was determined by EMA-PCR before storage and after 10 and 19 days. Principal component analysis was used to analyze survival patterns in the samples and give a visualization of the main trends for all the storage experiments. The scores of the first principal component for the different sets of samples are given in Fig. 5. The first principal component explained 79% of the variance of the data set. This indicated that the EMA signal was consistent with a single latent factor. This factor was highly correlated with survival. Thus, the variance in the data could be directly attributed to survival.
FIG. 5.
Principal component analysis of EMA-PCR data to study the survival of C. jejuni on chicken breasts and legs. The samples spiked with C. jejuni C-523 or C-524 were stored in a modified or normal atmosphere as described in Materials and Methods. White and black columns represent storage at 5 and 12°C, respectively. Principal component analysis was performed on the EMA-PCR data after 1 h, 7 days, and 19 days of storage for each condition tested. The first principal component explained 79% of the variance in the data. The input was the average signal for four measurements for each of 48 independently packed and spiked samples. NORM, normal atmosphere; MOD, modified atmosphere. The averages for three independent replicates for each condition tested were used for principal component analysis.
We found that C. jejuni survived better on leg than on breast samples. The samples with best survival were strain C-523 on leg samples stored in a modified atmosphere (at both 5 and 12°C) and strain C-534 on breast samples stored in a modified atmosphere at 5°C. The fraction of viable cells was in these cases −0.1 ± 0.1 log10 (P = 0.05) after 19 days of storage. Bacteria spiked on breast samples gave the lowest survival: strain C-523 in a modified atmosphere at 5 and 12°C and in a normal atmosphere at 12°C and strain C-534 in a normal atmosphere at 12°C. The fraction of viable cells was approximately −2.8 ± 0.2 log10 (P = 0.05) in these samples after 19 days of storage.
The knowledge gained exemplifies possible use of EMA-PCR in practice. The information may be used by the poultry industry in the development of strategies for reducing the amount of viable C. jejuni on poultry products.
Use of EMA-PCR to study survival under decontamination and antibiotic treatments.
It is important to develop alternative techniques to monitor the effects of decontamination. Rapid methods such as microscope-based viable/dead methods do not provide sufficient specificity or sensitivity, while culture-based techniques are slow and rely on the technical skills of the operator. The potential benefits of EMA-PCR are speed, specificity, and accuracy.
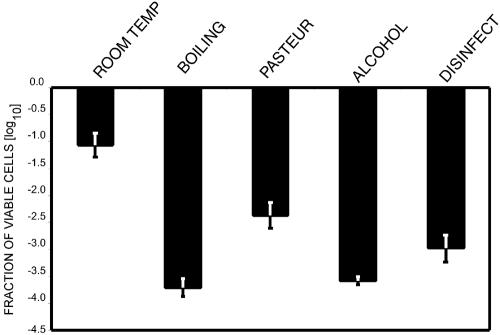
We evaluated the EMA-PCR with different common decontamination treatments (Fig. 6). The highest killing rates were obtained for the boiled and ethanol-treated samples, with between 3.5 and 4 log10 killing. Pasteurization and disinfectant treatment gave intermediate killing (2.5 and 3 log10, respectively), while exposure to a normal atmosphere at room temperature gave the lowest response, with a 1 log10 reduction in the viable cell fraction.
FIG. 6.
Use of EMA-PCR to determine the effect of different decontamination procedures. C. jejuni NTNC 11168 was stored at room temperature (25°C) in a normal atmosphere (room temp), boiled, heated to 72°C (Pasteur), or exposed to 70% ethanol (alcohol) or 500 ppm benzalkonium chloride (disinfect).The error bars represent standard deviations from three independent replicates.
Rapid assessments of antibiotic treatments are important for both surveillance and clinical diagnostics. The potential use of EMA-PCR to investigate killing of C. jejuni by antibiotics was evaluated. The effects of nalidixic acid, trimethoprim-sulfamethoxazole, erythromycin, gentamicin, and tetracycline were tested in a preliminary screen (not shown). C. jejuni seemed most sensitive to gentamicin. Gentamicin was thus chosen as a model for the evaluation of EMA-PCR in the investigation of killing kinetics by antibiotics. Gentamicin is an aminoglycoside antibiotic, acting by binding to multiple sites on the ribosome, inhibiting translation (8, 9). We investigated bacteria by EMA-PCR after 5, 24, and 120 h of exposure to gentamicin. Most of the cells had lost their ability to resume growth after just 5 h (5 log10 reduction in CFU), while no viable cells could be recovered after 24 and 120 h (>7 log10 reduction in CFU). There was also a detectable difference (log10 EMASR = −0.27, P = 0.06) between the control and the EMA-treated sample after 5 h, while the difference was highly significant after 24 h (log10 EMASR = −1.4, P < 0.0005). Most of the cells in the viable control were dead after 120 h (1 log10CFU reduction), making the EMASR difference between the treated and untreated sample lower for this time point (log10 EMASR = −0.70, P = 0.002).
Mechanisms for exclusion of EMA from viable cells.
The mechanisms of exclusion of EMA in viable C. jejuni cells were investigated by monitoring the effects of compounds that affect active efflux systems. We tested CCCP, which is an uncoupler of oxidative phosphorylation, and DCCD, which is an inhibitor of the F0F1 ATPase (16). Finally, TPA, which is a competitor in multidrug efflux systems, was tested (20). These drugs are commonly used to study efflux systems in bacteria (1).
There were no significant differences between the samples treated with CCCP (log10 EMASR = −0.069, P = 0.45) or TPA (log10 EMASR = −0.12, P = 0.45) and the corresponding controls with a two-tailed t test. The difference was larger, although not significant (log10 EMASR = −0.36, P = 0.17), for the sample treated with DCCD. Taken together, these experiments indicate that the exclusion of EMA from viable cells appears to be a passive process through diffusion barriers and not an active pumping process.
Comparison of the EMA-PCR with standard viable/dead methods.
Viability is a gradient from actively growing cells to completely dead cells with disruption of vital functions (5). The different viable/dead methods applied use different criteria for viable/dead measurements (Table 1) (5, 6, 11, 24, 29). The currently most widely applied viable/dead methods are based on Syto 9 and propidium iodide (BacLight) staining or on the ability of the bacteria to grow.
TABLE 1.
Comparison of EMA-PCR with commonly used viable/dead methodsa
| Method | Viable/dead criteria | Detection method | Absolute detection limit (log10 cells/g) | Viable/dead differentiation ratio (log10) | Time (h) | Specificity | Analyses of mixed cultures | Flexibleb | Considerations |
|---|---|---|---|---|---|---|---|---|---|
| EMA-PCR | Membrane integrity | PCR | 2 | 4 | ∼3 | Very high | Yes | Yes | Sensitive to high concentrations of material that quench light such as particle contamination |
| RT-PCR | RNA stability | RT-PCR | 3c | Not quantitative | ∼5 | High | No | No | RNA is very heterogeneous and degradation is dependent on the environment and conditions of the cells |
| Growth | Ability to divide | Plate counts, limiting dilution, conductance | >1 | Does not detect dead cells | >24 | Relatively low | Yesd | No | Recovery of viable cells is dependent on the medium used; growth may not be linked to viability |
| BacLight | Membrane integrity | Fluorescence microscopy and flow cytometry | 3 | 4 | ∼2 | Nonspecific | Noe | No | Low sensitivity and sensitive to particle contamination |
| CTC | Metabolic activity | Fluorescence microscopy and flow cytometry | 5 | 2 | ∼5 | Nonspecific | No | No | Lack of metabolic activity is not a good indicator of death |
Approximate values are extracted from references 5, 4, 6, 24, and 29. RT, reverse transcription; CTC, 5-cyano-2,3-ditotyltetrazolium chloride.
Flexible means that the approach is easily adaptable to different organisms.
Based on our own experience.
If reliable selective media are present for the organisms of interest.
Can potentially be adapted to analyses of mixed cultures by combining flow cytometry and cell sorting.
BacLight staining and plate counts were done in parallel for the experiments described in this work. Generally, the BacLight and the EMA-PCR gave corresponding results for the conditions evaluated. The main difference was that we observed a wider detection range for EMA-PCR (≈4 log10) than for the microscopy-based BacLight assay (≈2 log10). Microscopy counts are difficult for C. jejuni, however, due to the small size of these bacteria. BacLight was not used for the analyses of mixed samples since it is not possible to readily analyze mixed samples with this approach.
A lower level of viable cells was generally obtained for growth-based techniques than for BacLight and EMA-PCR. However, lack of growth is often not a good indicator of death. Viable but nonculturable C. jejuni could for instance be a state where the cells are viable but arrested so that they cannot divide under conditions that normally promote growth. There can also be a delay from the time the cells lose the ability to resume growth until cell integrity is disrupted. This is probably the case for the antibiotic treatment experiments described in this work. Most of the cells lost their ability to resume growth after 5 h of gentamicin treatment (5 log10 reduction in CFU), while BacLight staining and EMA-PCR both indicated that a large fraction of these cells had an intact membrane system (0.3 log10 reduction in cells staining as viable). In general, regardless of the method, when studying bacterial survival it is always important to consider conditions that might inactivate bacteria without affecting membrane integrity (e.g., low doses of UV).
The growth-based techniques gave less consistent results than EMA-PCR for the storage experiments with the spiked poultry samples (not shown). The reason could be the highly selective conditions used to suppress the growth of the background microflora. Stressed or damaged cells may irreproducibly resume growth under such conditions. Furthermore, the selection may not be complete, enabling the growth of the background microflora. The balance between inhibiting the background microflora and promoting the growth of target organisms may be difficult.
Future applications of EMA-PCR.
We have here demonstrated the application of the EMA-PCR for the viable/dead quantification of a major food-borne bacterium. Previously, we have shown that EMA-PCR can be used for qualitative viable/dead differentiation in pure cultures of Listeria monocytogenes, Salmonella spp., and E. coli O157 (21). It should, however, be possible to adapt these assays for quantitative viable/dead differentiation in mixed samples as described here for C. jejuni. The application range of EMA-PCR also goes far beyond pathogen detection. EMA-PCR is a method with general implications. For instance, EMA is already widely used as a viable/dead dye for eukaryotes in flow cytometry applications (23). The EMA-PCR can potentially be used in all aspects of biological research where the aim is distinction between viable and dead cells. Finally, EMA-PCR may promote new applications in viable/dead diagnostics since it is a novel concept.
Acknowledgments
This work was supported by a Norwegian research levy on foods, grant 04008 from the Nordic Innovations Center, and research grants (139782/130, 153088/110, and 14656/140) from the Norwegian Research Council.
REFERENCES
- 1.Aase, B., G. Sundheim, S. Langsrud, and L. M. Rorvik. 2000. Occurrence of and a possible mechanism for resistance to a quaternary ammonium compound in Listeria monocytogenes. Int. J. Food Microbiol. 62:57-63. [DOI] [PubMed] [Google Scholar]
- 2.Barer, M. R., and C. R. Harwood 1999. Bacterial viability and culturability. Adv. Microb. Physiol. 41:93-137. [DOI] [PubMed] [Google Scholar]
- 3.Besnard, V., M. Federighi, and J. M. Cappelier. 2000. Development of a direct viable count procedure for the investigation of VBNC state in Listeria monocytogenes. Lett. Appl. Microbiol. 31:77-81. [DOI] [PubMed] [Google Scholar]
- 4.Bunthof, C. J., van Schalkwijk, S., W. Meijer, T. Abee, and J. Hugenholtz. 2001. Fluorescent method for monitoring cheese starter permeabilization and lysis. Appl. Environ. Microbiol. 67:4264-4271. [DOI] [PMC free article] [PubMed] [Google Scholar]
- 5.Caron, G. N., P. Stephens, and R. A. Badley, 1998. Assessment of bacterial viability status by flow cytometry and single cell sorting. J. Appl. Microbiol. 84:988-998. [DOI] [PubMed] [Google Scholar]
- 6.Chaveerach, P., ter A. A. Huurne, L. J. Lipman, and van F. Knapen. 2003. Survival and resuscitation of ten strains of Campylobacter jejuni and Campylobacter coli under acid conditions. Appl. Environ. Microbiol. 69:711-714. [DOI] [PMC free article] [PubMed] [Google Scholar]
- 7.Corry, J. E., and H. I. Atabay. 2001. Poultry as a source of Campylobacter and related organisms. Symp. Ser. Soc. Appl. Microbiol. 96:114S. [DOI] [PubMed] [Google Scholar]
- 8.Hancock, R. E. 1981. Aminoglycoside uptake and mode of action-with special reference to streptomycin and gentamicin. J. Antimicrob. Chemother. 8:429-445. [DOI] [PubMed] [Google Scholar]
- 9.Hancock, R. E. 1981. Aminoglycoside uptake and mode of action-with special reference to streptomycin and gentamicin. II. Effects of aminoglycosides on cells. J. Antimicrob. Chemother. 8:249-276. [DOI] [PubMed] [Google Scholar]
- 10.Hewitt, C. J., Nebe-Von Caron, G., A. W. Nienow, and C. M. McFarlane. 1999. Use of multi-staining flow cytometry to characterise the physiological state of Escherichia coli W3110 in high cell density fed-batch cultures. Biotechnol. Bioeng. 63:705-711. [DOI] [PubMed] [Google Scholar]
- 11.Hoefel, D., W. L. Grooby, P. T. Monis, S. Andrews, and P. T. Saint. 2003. Enumeration of water-borne bacteria using viability assays and flow cytometry: a comparison to culture-based techniques. J. Microbiol. Methods 55:585-597. [DOI] [PubMed] [Google Scholar]
- 12.Kato, F. 1995. Method for determining viable cell count. European Patent Application EP 0 881 489 A1.
- 13.Keer, J. T., and L. Birch. 2003. Molecular methods for the assessment of bacterial viability. J. Microbiol. Methods 53:175-183. [DOI] [PubMed] [Google Scholar]
- 14.Kell, D. B., A. S. Kaprelyants, D. H. Weichart, C. R. Harwood, and M. R. Barer. 1998. Viability and activity in readily culturable bacteria: a review and discussion of the practical issues. Antonie Van Leeuwenhoek 73:169-187. [DOI] [PubMed] [Google Scholar]
- 15.Klein, P. G., and V. K. Juneja. 1997. Sensitive detection of viable Listeria monocytogenes by reverse transcription-PCR. Appl. Environ. Microbiol. 63:4441-4448. [DOI] [PMC free article] [PubMed] [Google Scholar]
- 16.Lambert, B., and J. B. Pecq. 1984. Effect of mutation, electric membrane potential, and metabolic inhibitors on the accessibility of nucleic acids to ethidium bromide in Escherichia coli cells. Biochemistry 23:166-176. [DOI] [PubMed] [Google Scholar]
- 17.Lee, A., S. C Smith, and P. J. Coloe. 1998. Survival and growth of Campylobacter jejuni after artificial inoculation onto chicken skin as a function of temperature and packaging conditions. Food Prot. 61:1609-1614. [DOI] [PubMed] [Google Scholar]
- 18.McKillip, J. L., L. A. Jaykus, and M. Drake. 1998. rRNA stability in heat-killed and UV-irradiated enterotoxigenic Staphylococcus aureus and Escherichia coli O157:H7. Appl. Environ. Microbiol. 64:4264-4268. [DOI] [PMC free article] [PubMed] [Google Scholar]
- 19.McKillip, J. L., L. A. Jaykus, and M. Drake. 1999. Nucleic acid persistence in heat-killed Escherichia coli O157:H7 from contaminated skim milk. J. Food Prot. 62:839-844. [DOI] [PubMed] [Google Scholar]
- 20.Midgley, M. 1994. Characteristics of an ethidium efflux system in Enterococcus hirae. FEMS Microbiol. Lett. 120:119-123. [DOI] [PubMed] [Google Scholar]
- 21.Nogva, H. K., S. M. Dromtorp, H. Nissen, and K. Rudi. 2003. Ethidium monoazide for DNA-based differentiation of viable and dead bacteria by 5′-nuclease. PCR BioTechniques 810:812-813. [DOI] [PubMed] [Google Scholar]
- 22.Norton, D. M., and C. A. Batt. 1999. Detection of viable Listeria monocytogenes with a 5′ nuclease PCR assay. Appl. Environ. Microbiol. 65:2122-2127. [DOI] [PMC free article] [PubMed] [Google Scholar]
- 23.O'Brien, M. C., and W. E. Bolton. 1995. Comparison of cell viability probes compatible with fixation and permeabilization for combined surface and intracellular staining in flow cytometry. Cytometry 19:243-255. [DOI] [PubMed] [Google Scholar]
- 24.Ramalho, R., J. Cunha, P. Teixeira, and P. A. Gibbs. 2001. Improved methods for the enumeration of heterotrophic bacteria in bottled mineral waters. J. Microbiol. Methods 44:97-103. [DOI] [PubMed] [Google Scholar]
- 25.Riedy, M. C., K. A. Muirhead, C. P. Jensen, and C. C. Stewart. 1991. Use of a photolabeling technique to identify nonviable cells in fixed homologous or heterologous cell populations. Cytometry 12:133-139. [DOI] [PubMed] [Google Scholar]
- 26.Shahamat, M., U. Mai, Paszko- C. Kolva, M. Kessel, and R. R. Colwell. 1993. Use of autoradiography to assess viability of Helicobacter pylori in water. Appl. Environ. Microbiol. 59:1231-1235. [DOI] [PMC free article] [PubMed] [Google Scholar]
- 27.Talibart, R., M. Denis, A. Castillo, J. M. Cappelier, and G. Ermel. 2000. Survival and recovery of viable but noncultivable forms of Campylobacter in aqueous microcosm. Int. J. Food Microbiol. 55:263-267. [DOI] [PubMed] [Google Scholar]
- 28.Tholozan, J. L., J. M. Cappelier, J. P. Tissier, G. Delattre, and M. Federighi. 1999. Physiological characterization of viable-but-nonculturable Campylobacter jejuni cells. Appl. Environ. Microbiol. 65:1110-1116. [DOI] [PMC free article] [PubMed] [Google Scholar]
- 29.Uyttendaele, M., A. Bastiaansen, and J. Debevere. 1997. Evaluation of the NASBA nucleic acid amplification system for assessment of the viability of Campylobacter jejuni. Int. J. Food Microbiol. 37:13-20. [DOI] [PubMed] [Google Scholar]
- 30.Whyte, P., J. D. Collins, K. McGill, C. Monahan, and H. O'Mahony. 2001. Quantitative investigation of the effects of chemical decontamination procedures on the microbiological status of broiler carcasses during processing. J. Food Prot. 64:179-183. [DOI] [PubMed] [Google Scholar]


