

Abstract
Viruses can control the structure of bacterial communities in aquatic environments. The aim of this project was to determine if cyanophages (viruses specific to cyanobacteria) could exert a controlling influence on the abundance of the potentially toxic cyanobacterium Microcystis aeruginosa (host). M. aeruginosa was isolated, cultured, and characterized from a subtropical monomictic lake—Lake Baroon, Sunshine Coast, Queensland, Australia. The viral communities in the lake were separated from cyanobacterial grazers by filtration and chloroform washing. The natural lake viral cocktail was incubated with the M. aeruginosa host growing under optimal light and nutrient conditions. The specific growth rate of the host was 0.023 h−1; generation time, 30.2 h. Within 6 days, the host abundance decreased by 95%. The density of the cyanophage was positively correlated with the rate of M. aeruginosa cell lysis (r2 = 0.95). The cyanophage replication time was 11.2 h, with an average burst size of 28 viral particles per host cell. However, in 3 weeks, the cultured host community recovered, possibly because the host developed resistance (immunity) to the cyanophage. The multiplicity of infection was determined to be 2,890 virus-like particles/cultured host cell, using an undiluted lake viral population. Transmission electron microscopy showed that two types of virus were likely controlling the host cyanobacterial abundance. Both viruses displayed T7-like morphology and belonged to the Podoviridiae group (short tails) of viruses that we called cyanophage Ma-LBP. In Lake Baroon, the number of the cyanophage Ma-LBP was 5.6 × 10⁴ cyanophage · ml−1, representing 0.23% of the natural viral population of 2.46 × 10⁷ · ml−1. Our results showed that this cyanophage could be a major natural control mechanism of M. aeruginosa abundance in aquatic ecosystems like Lake Baroon. Future studies of potentially toxic cyanobacterial blooms need to consider factors that influence cyanophage attachment, infectivity, and lysis of their host alongside the physical and chemical parameters that drive cyanobacterial growth and production.
Viruses are simple nonliving obligate parasites that can determine bacterial species diversity (30). While they are only small agents of infection (many are between 25 and 100 nm in diameter), their numbers and ubiquity give them the potential to control the structure and function of bacterial communities in freshwater ecosystems (4, 13, 29). Cyanobacteria (blue-green bacterial “algae”) are an essential part of a balanced aquatic ecosystem. However, cyanobacteria can hijack a lake's ecological processes. They can turn a lake into an unappealing foul-smelling environment (2), with some species, such as Microcystis aeruginosa, potentially producing toxins (19).
Viruses are dependent on their host for replication. They are also often host specific. Viruses have been implicated as underlying controls of cyanobacterial populations and production in other aquatic ecosystems (25, 26, 33).
Toxic cyanobacteria are common seasonal inhabitants of subtropical lakes in Queensland, Australia (11). They tend to bloom in late autumn and early spring, but there is no obvious single ecological pathway that regulates the frequency and severity of these blooms (2). One contributing factor could be an underlying natural control by cyanophages (viruses that infect cyanobacteria) that prevents blooms from forming on a regular basis. Environmental factors that influence the ability of the virus to attach to, infect, and lyse the host might drive the blooms of toxic cyanobacteria.
During the 1990s, due largely to developments in technique, viruses in aquatic ecosystems were shown to be a significant and dynamic component of microbial communities (28). The number of viruses in aquatic ecosystems often exceeds the number of bacteria by 10 to 100 times or more (9). Fuhrman and Suttle (6) and Suttle (24) showed that up to 20% of heterotrophic bacteria and up to 51% of cyanobacteria are destroyed daily via viral lysis. By 1995, the idea that viruses were rare and insignificant in natural waters had to be radically reconsidered.
Viruses play important roles in nutrient cycling and microbial-community structuring (4, 5). Most environmental viral research has been carried out in marine systems and at a community level. While the host organisms were often known, the infectious bacteriophage was an anonymous virus from the filterable viral fraction (<0.22-μm pore size). The mechanisms of virus-host interactions are missing from our present understanding of lake ecosystem processes.
The management of toxic cyanobacterial blooms in freshwater lakes, rivers, and streams places a great deal of emphasis on physical and chemical factors that influence host growth in the aquatic environment. Much research has focused on the changes in physical and chemical factors in the environment that favor cyanobacterial blooms (32). However, little is known about how viruses might change the abundance of cyanobacteria in freshwater. Our aim here was to determine if cyanophage from the mixed population of viruses taken from an aquatic environment could infect and lyse the potentially toxic cyanobacterium M. aeruginosa isolated from the same environment—Lake Baroon.
MATERIALS AND METHODS
Sampling site.
Lake Baroon is located ∼25 km west of Maroochydore in South East Queensland, Australia (26°42′50"S, 152°52′30"E) (Fig. 1). The lake lies in the Blackall Ranges near Montville at an elevation of 223 m above sea level with a surface area of 3.8 km2. This subtropical monomictic lake has a maximum capacity of 61 Gl, with a maximum depth of 47 m and an average depth of 27 m. The lake is the major supplier of raw potable water for Caloundra City and Maroochy Shire Councils in Queensland (1).
FIG. 1.

Sampling sites in Lake Baroon, ∼25 km west of Maroochydore in southeast Queensland, Australia (26°42′50"S, 152°52′30"E).
Field samples.
Water samples (500 ml) were collected from Lake Baroon in March, April, June, and July 2001. Samples were collected from the water intake tower, at the surface, and at 3, 6, and 9 m depths with a Niskin-like sampling tube and poured into new opaque plastic bottles. A Niskin bottle has stoppers, held in place by springs, on both ends. The bottle is prepared by cocking open both ends. At sampling depth a weight is loosely attached to the line and released to close the two stoppers and capture water at the desired depth. Samples were also taken from the north and south swimming areas (Fig. 1). The samples were transported unpreserved, on ice, back to the laboratory and processed within 24 h. Samples taken at different depths were pooled for a site and mixed before further subsampling.
Host growth medium.
B-12 medium was used to isolate and grow M. aeruginosa as described by Shirai et al. (22). The B-12 medium was prepared with the following ingredients dissolved in deionized water (in milligrams liter−1): NaNO3, 100; MgSO4 · 7H2O, 75; CaCl2 · 2H2O, 40; Na2CO3, 20; ferric citrate, 6 (autoclaved separately); disodium EDTA · 2H2O, 1; and vitamin B12, 0.1. The pH was adjusted to 9.0 with 0.1 M HCl or NaOH. For solid medium, agarose was added to the liquid medium (0.4% [wt/vol]).
Isolating M. aeruginosa from Lake Baroon.
Laboratory cultures of M. aeruginosa were isolated from Lake Baroon. This isolate was used to calculate the growth and replication rates of the host and the phage burst size and to determine the viral impact on host abundance over time. Transmission electron microscopy (TEM) studies were used to characterize the cyanophage in the lake that infected the cultured M. aeruginosa.
A subsample (200 ml) of the water taken from each site was centrifuged for 10 min at 3,000 × g in a Sigma 4-15 centrifuge. The viruses in the supernatant were isolated as described below. The pellets were combined and suspended in 500 ml of B-12 medium, which was placed in a light cabinet (cool white fluorescent tubes producing photosynthetically active radiation at 18 μmol quanta · s−1 · m−2 at 30°C according to the isolation method developed by Shirai et al.) (22) with a 16-h light-8-h dark cycle. Light was measured with a Li-Cor 1400 light meter outside the bottles, using a flat sensor.
Floating cells were collected over 3 to 6 days and inoculated onto solid B-12 medium in petri plates. The plates were placed under the same light conditions for 6 days. The plates were examined with a light microscope (magnification, ×400 to 1,000), and uncontaminated colonies of M. aeruginosa were picked up with a microcapillary tube (∼40-μm diameter). These cells were reinoculated into liquid B-12 medium and placed back into the same light cabinet. This process was repeated three times to obtain single-species cultures of M. aeruginosa. The cells were identified as M. aeruginosa based on cell and colony morphology using the guide to Australian freshwater planktonic Chroococcales (15).
Queensland Health and Scientific Services (Brisbane Australia) maintains M. aeruginosa in a culture collection. It was used to further confirm the identity of the isolate used in our research. Cultures were stored at room temperature (22 ± 2°C) under cool white fluorescent light (18 μmol quanta · s−1 · m−2) in 1-liter Schott bottles. An improved Neubauer hemocytometer was used to count the cyanobacterial cells after gentle sonication with a Microson sonicator set at 30 W for 2 min.
Collecting viruses from Lake Baroon.
Viruses were collected from the supernatant of the centrifuged water samples used to isolate the host as described above. The supernatants were combined, and a 1.2-liter aliquot was progressively filtered through a 1-μm- and then a 0.22-μm-pore-size (47-mm diameter) cellulose nitrate membrane filter (Whatman). The final filtrate was washed in chloroform to ensure that only phage remained in the filtrate. The method was based on that described by Phlips et al. (20).
The 1.2-liter filtered sample was dispensed (five 200-ml aliquots) into glass Schott bottles to which 4 ml of chloroform was added. The Schott bottles were shaken vigorously for 30 s and then decanted into separating funnels. The chloroform-water sample was allowed to separate for 30 min, and the lower (chloroform) phase was discarded. The aqueous phase was allowed to degas for 10 min before being transferred to sterile containers. To ensure that chloroform residues were not responsible for host cell losses, extra B-12 medium was prepared, filtered, and washed with chloroform as described above and used as a control in each incubation assay. The natural viral populations isolated from Lake Baroon were stored at room temperature (22 ± 2°C) in the dark.
M. aeruginosa growth and generation time assays.
The growth rate of M. aeruginosa in culture was determined under the isolation conditions described above. M. aeruginosa cells (1 ml at 2 × 10⁶ cells · ml−1) were added to test tubes (10-ml capacity) containing 4 ml of B-12 medium; the final cell number was 4 × 10⁵ · ml−1. This number of M. aeruginosa cells is typical of that in Lake Baroon (1). Each assay was conducted in triplicate over 6 days in the light cabinet used to isolate M. aeruginosa from lake water.
The time taken for the M. aeruginosa cells to double (generation time [g]) was determined from the titer of the cyanobacteria at time zero and at 144 h. The specific growth rate (μ) was calculated using the exponential-growth equation below, as described elsewhere (21):
 |
(1) |
Determining viral numbers.
Virus-like particles (VLPs) were counted using SYBR Green 1, a fluorescent nucleic acid stain purchased from Molecular Probes (Eugene, Oreg.), by the method of Noble and Fuhrman (18). The stock solution of SYBR Green 1 was diluted 1:2.5 × 10⁻³ with 0.02-μm-pore-size-filtered Milli Q deionized water (working solution). A 5-ml sample was filtered through a 0.22-μm-pore-size, 47-mm diameter cellulose nitrate membrane filter (Whatman). The filtrate was collected, and 30 μl of the SYBR Green 1 working solution was added to 1 ml of the filtrate. This was incubated in the dark for 15 min. The stained sample was then filtered through a 0.02-μm-pore-size Whatman Al2O3 Anodisk 25 filter (Crown Scientific, Melbourne, Australia) on a Millipore manifold at 15 kPa.
The damp membranes were then transferred to glass slides, covered with a drop of mountant (18) containing 50% glycerol, 49.9% phosphate-buffered saline (0.05 M Na2HPO4, 0.85% NaCl; pH 7.5), and 0.1% p-phenylenediamine (Sigma) or a nonfluorescent oil (Cargile B) and a 25-mm-diameter coverslip. The VLPs were counted with an Olympus epifluorescent microscope (model CH30) equipped with an AE 100/1.25 objective lens and a blue filter set (excitation, <490 nm; dichroic filter, 500 nm; barrier filter, >515 nm). Viral numbers (VLPs per milliliter) were calculated from equation 2:
 |
(2) |
where P is the number of VLPs counted, A is the filtration area of the filter (in square micrometers), F is the area of the microscope field the VLPs were counted in (in square micrometers), and V is the volume of the original sample (in microliters).
Stained cyanophage used to assess infection.
SYBR Green-stained cyanophage was washed and added back to log-phase cultures of M. aeruginosa. The method for using fluorescently labeled viral particles to examine susceptibility to viral infection has been described by Hennes et al. (9). We were able to observe both viral attachment to and infection of the host by simultaneously using epifluorescence and phase-contrast microscopy on the same sample.
Cyanophage replication rate and lysis assay.
The purpose of the lysis assay was to show that a subset of the viruses from Lake Baroon could infect and lyse M. aeruginosa. The basis of the lysis assay was the addition of the natural viral populations to the cultured host population. The in situ natural number of the VLPs in the lake was not changed during the virus isolation steps; hence, the viral titer mimicked that found naturally in Lake Baroon.
The probability of a cyanophage coming into contact with its host cyanobacterium, M. aeruginosa, is related to the number of both the host and virus; thus, we aimed to also determine the number of virus that had the most impact. The viral populations collected and isolated from the lake were incubated with the host isolates starting with no dilution. The natural viral titer (no host present) was then diluted in a 10-fold series (1/10, 1/100, and 1/1,000). Each was added to the cultures of the host M. aeruginosa in the log phase of growth.
The lysis assay was based on that described by Suttle and Chan (27). The assays were carried out in test tubes containing 1 ml of viral populations, 1 ml of M. aeruginosa cells (4 × 10⁶ cells · ml−1), and 3 ml of B-12 medium, with a final volume of 5 ml. The cultures were vortexed for 1 min and then incubated for 6 days in the light cabinet. There were 10 replicates for each dilution and the chloroform-washed controls (no phage added).
Determining cyanophage burst size.
Jiang et al. (10) described a one-step growth assay for determining burst size. They quantified the cyanophage released based on the first wave of viruses released from cultured host cells. We approximated the one-step growth assay by using the increase in phage numbers with the corresponding decrease in host numbers to give us an estimate of the average burst size over several viral replicative cycles. The equation used to calculate the burst size was as follows:
 |
(3) |
where B is the burst size, dV is the first significant change in viral numbers during the assay, and dH is the first significant change in host cell numbers during the assay (magnitude only). This assay was conducted over 2 days. The M. aeruginosa cells and the VLPs were counted using the SYBR Green technique described above. Cyanobacteria and VLPs were counted at the beginning and end of the trial, and differences in the abundance of each were substituted into equation 3 to determine the cyanophage burst size.
Isolation of M. aeruginosa phage for TEM.
The pooled water sample from Lake Baroon was subsampled (1 liter) and filtered through 47-mm-diameter Millipore polycarbonate filters with pore sizes of 0.45 and 0.2 μm to remove bacteria and phytoplankton. The VLPs were concentrated 100 to 1,000 times using 30,000-MW-cutoff ultrafiltration tubes from Amicon. The viral concentrate (2 ml) was added to 18 ml of exponentially growing culture of M. aeruginosa. The cultures were monitored for growth using a spectrophotometer (optical density at 600 nm) and screened for viral replication using the SYBR Green fluorescent stain and a direct counting technique until the host growth ceased.
Cultures that showed viral replication were further amplified by reinoculating the concentrated VLP fraction into new exponentially growing host cultures. This process was repeated 13 times to dilute the nonreplicating phage and to increase the cyanophage titer to 1012 VLP · ml−1. The technique used was based on that described by Suttle (23).
TEM.
The phage of M. aeruginosa was viewed with a Joel 1010 transmission electron microscope. The best images were obtained using 80 keV and ×80,000 magnification. The M. aeruginosa cyanophage concentrate (100 μl) was ultracentrifuged in a Beckman airfuge at 109,000 × g for 30 min. The grids used were 200-mesh copper, Formvar coated, carbon coated, and glow discharged for 20 s. Uranyl acetate solution (2% [wt/vol]) was used as a negative stain, with the phage particles exposed to the stain for 2 min before the stain was wicked off with filter paper (17, 23).
Data analysis.
Statistical comparisons of multiple samples were carried out with one-way analysis of variance, and two-sample comparisons were carried out with a t test. If the data were used for parametric tests, they were square root transformed (3). Regression analysis was used to compare the growth assays conducted on the cultures. Chocoran and Bartlett tests were performed to determine the variation in the standard deviations of the samples, and residual probability plots were used to ensure normal distribution in the data. Statistical tests were performed with the statistical software package Statlets and Microsoft Excel 98. The primary statistical reference used was Fowler et al. (3). The statistical significance level for all analysis was set at 0.05.
RESULTS
Figure 2 shows the growth curve for M. aeruginosa isolated from Lake Baroon. The cyanobacteria reached a maximum density of 1.09 × 10⁷ cells · ml−1 after 6 days of growth. The population doubling time (generation time) was 30.2 h, and the specific growth rate was 0.023 h−1.
FIG. 2.

Growth of M. aeruginosa in the absence of cyanophage. The abundance of cyanobacteria is plotted as a function of time. The specific growth rate and generation times were calculated by the equations μ = 0.023 h−1 and g = 30.2 h, respectively.
The water samples collected from Lake Baroon were washed in chloroform to ensure that no nonviral pathogens of M. aeruginosa were able to lyse M. aeruginosa cells in the lysis assays. Host cell counts in all of the control tubes using the chloroform-washed B-12 medium showed no significant difference (t Stat = 0.20; df = 18; P = 0.84) from the nonwashed controls, so any residual chloroform had no impact on M. aeruginosa growth.
Lysis assays.
Figure 3 shows the growth of M. aeruginosa in the absence and presence of cyanophage. Each bar represents a different titer of the mixed lake viral populations incubated with the host for 6 days in a series of 10-fold dilutions—1/1,000, 1/100, 1/10, and 1/1 (unchanged mixed lake viral populations). The cultures started with an M. aeruginosa host cell number of 4 × 10⁵ · ml−1. Cell numbers in the control (no cyanophage) reached 107 · ml−1 after 6 days. The cultures with cyanophage added had significantly fewer (F3,36 = 832; P < 0.0001) cells per milliliter than the controls (Fig. 3). When undiluted viral populations of Lake Baroon were incubated with the host, the cyanophage achieved a net increase of 9.2 × 10⁵ with a concomitant 95% reduction in the host population.
FIG. 3.

Viral lysis of M. aeruginosa cells. For the first bar, no viral particles were added to the M. aeruginosa culture. The bars on the right represent a series of 10-fold dilutions of the natural viral titer in Lake Baroon. For the final bar, undiluted lake virus was added. The net change in host cell numbers was a result of new cell growth minus the cells lysed. As the cyanophage density increased, the rate of host cell loss increased. Shown are means plus standard errors of the mean; n = 10.
As the initial number of VLPs from Lake Baroon was increased from 104 to 107 VLPs · ml−1, the abundance of the host, M. aeruginosa, decreased (Fig. 3). The more VLPs that were present at the start of the incubation, the more and faster the host population decreased. M. aeruginosa cell removal was due to viral lysis and was inversely related to the natural titer of the viral populations.
Observing viral infection and lysis.
Visual confirmation of the host lysis was obtained using bright-field light microscopy (Fig. 4). The isolated natural viral populations (1 ml) from Lake Baroon were tagged with a general DNA fluorescent probe, SYBR Green, as described in Materials and Methods. These labeled viruses were then added back to the log-phase M. aeruginosa. The labeled cyanophage was observed over 12 h infecting susceptible host cells. The labeled viruses were observed to pass to the host. Figure 5 shows an epifluorescent micrograph of infected (bright-green) host cells. As the SYBR Green-labeled cyanophage infected the host, the host also became labeled. Uninfected cells did not fluoresce; however, the SYBR Green-labeled cyanophage can be seen attached to the outside of some host cells (Fig. 5).
FIG. 4.

Bright-field light micrograph (magnification, ×1,250) shows M. aeruginosa cells stained with toluidine blue at different stages of viral lysis. Cell wall rupture (A) and cytoplasm leakage (B) are evident, and some whole cells are still present (C).
FIG. 5.

Epifluorescent micrograph of infected (bright-green) host cells (×1,000 magnification; scale bar = 10 μm). Cyanophage carried the SYBR Green label into the host, M. aeruginosa. The host DNA also became labeled as the virus replicated.
Hennes et al., (9) also showed that SYBR Green-stained viral particles were still able to attach to their hosts. This showed the hosts that were potentially susceptible to infection. However, they were unable to show the stained phage entering the host, as we have shown here (Fig. 5). Further development of this technique could allow simple quantification of viral infectivity using fluorimetry without culturing the host cells. The method could then be used for field studies to follow the dynamics of virus attachment, infectivity, and replication in situ.
Burst size and virus replication time.
We approximated the one-step growth curve using the increase in phage numbers with the corresponding decrease in host numbers to give us an estimate of the average burst size over several replicative cycles. The increase in the number of cyanophage during the growth assay (48 h) was 6.69 × 10⁶, which corresponded to a decrease in host numbers of 2.4 × 10⁵. When these values were substituted into equation 3, the viral burst size was calculated as 28 cyanophage per cell of M. aeruginosa.
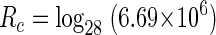
The number of viral replicative cycles (Rc) was calculated by taking the log to the base of the burst size (28) of the change in phage numbers from the start to the finish of the assay (6.69 × 10⁶). Solving equation 4 below gives a value for Rc of ∼4.3.
 |
(4) |
This number of replicating cycles in 48 h means that each cycle took ∼11.2 h. Knowing the viral burst size of the host, we calculated the original number of viruses specific to M. aeruginosa in Lake Baroon at the time of sampling. Equation 5 was used to calculate the number of cyanophage (CPMa) specific to M. aeruginosa in the original 1 ml of Lake Baroon water, where δVLPinc represents the increase in cyanophage numbers and B is the burst size of 28:
 |
(5) |
Thus, the CPMa titer was 5.56 × 10⁴ cyanophage · ml−1 and represented 0.23% of the natural viral population of 2.46 × 10⁷ · ml−1 in Lake Baroon at the time of sampling.
For the lysis assay (Fig. 3), the multiplicity of infection (MOI) was calculated. With the undiluted lake viral population and a burst size of 28 and using simple arithmetic, the MOI was determined to be 2,890 VLPs/host cell. Given the burst size, MOI, and decline in the Microcystis cell counts, the data in Fig. 3 should support a ca. 11-h replication cycle in the lysis assay. However, the data suggest a 25-h replicative cycle for the lysis assay. The difference may be due to the host cells moving into stationary growth or death phase at 6 days (Fig. 2).
TEM studies to characterize the cyanophage.
TEM photomicrographs of a previously undescribed M. aeruginosa cyanophage are shown in Fig. 6. These phage showed a T7-like morphology, with short geometric tails; hence, they belonged to the Podoviridiae family of viruses as described by Suttle (26). Close examination and measurement of the micrographs revealed two M. aeruginosa cyanophage, one with a head diameter of 42 nm and the other with a head diameter of 52 nm.
FIG. 6.

Electron micrographs of M. aeruginosa phage (×80,000 magnification; scale bars = 50 [A] and 100 [B] nm). Both phage have a short, stubby tail and are in the family Podoviridiae, but the head diameters differ by 10 nm (42 [A] and 52 [B] nm).
A number of viral head diameters were measured. The ratio of the two was ∼1:2 for the 42-nm (n = 66) and 52-nm (n = 138) viral head diameters, respectively. In Fig. 6B, the larger of the two cyanophage is viewed from above. The charge on the virus tail tended to adsorb the cyanophage tail-first to the grids. Figure 6A is a side view of the smaller of the two viruses. The presence of the small, stubby tail and the dimensions of the head identified both viruses.
DISCUSSION
Perhaps the most important finding in this study is the quantitative demonstration of cyanophage (cyanophage Ma-LBP) that are infective for Microcystis, something that has eluded several other research groups. The availability of such phage to the scientific community at large will open the door for many future studies aimed at understanding the factors that promote or prevent infection and lysis.
Taxonomy and morphology of the cyanophage.
Suttle (26) summarizes the taxonomy and morphology of cyanophage. They can be placed into three families of double-stranded DNA viruses: Myoviridae (contractile tail), Siphoviridae (long noncontractile tail), and Podoviridae (short tail). The TEM pictures shown here (Fig. 6) are the first of the cyanophage of M. aeruginosa. We have described them as cyanophage Ma-LBPa and b (a is the smaller of the two) based on the nomenclature recommneded by Suttle (25). These viruses have a morphology and size that place them in the family Podoviridae alongside those of Anabaena, Lyngbya, Plectonema, and Phormidium. The TEM picture of Podoviridae published by Suttle (26) appeared the same morphologically as cyanophage Ma-LBP (Fig. 6).
The cyanophage collected from Lake Baroon significantly reduced M. aeruginosa cell numbers each time they were mixed together in the lysis assays. The rate of lysis varied significantly and depended on the density of the phage particles introduced to the cyanobacterial culture. There was a positive relationship between the phage density and the number of host cells that were lysed. A simple linear relationship produced an r2 of 0.87, while a power relationship had an r2 of 0.95.
Host and viral production.
Fuhrman and Suttle (6) estimated that the product of host and phage numbers per unit volume needs to be ∼1012 for lytic production to occur. Similarly, in this study, reduction of M. aeruginosa cell numbers was observed when the product of cyanobacterial and VLP densities ranged from 2.48 × 10¹⁰ to 4.12 × 10¹⁴. The lytic production 1010 below the estimated level of Fuhrnam and Suttle (6) in this study was most likely due to the optimal growth and mixing conditions of the cyanobacteria and cyanophage under laboratory conditions. The viral populations found in marine environments range from 105 to 107 VLPs · ml−1, often exceeding 108 VLPs · ml−1 (4). The natural populations found in Lake Baroon and the dilution range of viruses (Fig. 3) in our study fall within this range.
The burst size of 28 viruses for M. aeruginosa falls within the range described in other studies of freshwater phage, i.e., between 20 and 50 (33). The high number of VLPs per host cell released upon lysis facilitated rapid increases in phage densities. The replication time of 11.2 h is less than half of the generation time calculated for the host. These values support the observed rapid decline in M. aeruginosa cell numbers seen in the lysis assays (Fig. 3), i.e., the viral infection-replication rate was double the host growth rate.
Infection, lysis, and immunity (lysogeny).
The number of viruses that infect specific strains of marine Synechococcus spp. range from 103 to 105 · ml−1 (12). The number of cyanophage Ma-LBP was within the same range (5.56 × 10⁴ · ml−1) in the original Lake Baroon water sample that reduced the host cell number by 95% within 6 days. This number of cyanophage Ma-LBP in the original water sample represented 0.23% of the VLPs in Lake Baroon at the time of sampling. The natural titer of the cyanophage found in Lake Baroon was unchanged in the laboratory assay. This suggests that there is potential for cyanophage to significantly control blooms of the host cyanobacteria in Lake Baroon. If nothing interferes with the cyanophage's ability to attach to, infect, and lyse its host, no bloom can form. For the better part of the year, this is the case in Lake Baroon. However, lysis of the host may not always result from viral infection.
After the lysis assays, host cells (after 95% reduction) were grown to log phase in fresh medium, and cyanophage concentrate was added back as in the lysis assays. Interestingly, these acclimated host cells attained natural population densities in 3 weeks with a resistance to the cyanophage Ma-LBP. This could be explained by the homoimmunity described by McDaniel et al. (14) and suggests that natural cyanobacterial blooms may also result from a conferred immunity of the host to the prevalent cyanophage. Others have produced models of bacterial-viral dynamics and suggest that a steady state exists between specific viruses and sensitive and resistant strains of bacteria in natural environments (16). Alternatively, the host may have simply become resistant to the virus due to mutation or down-regulated expression of the receptor for the virus.
Control of bloom formation.
As it was so aptly put by Weinbauer and Roassoulzadegan (30), viruses can influence the prokaryotic community composition by “killing the winner,” thereby controlling competitive dominance. For a bacteriophage to infect its host, there must be contact between the two. Given equal quantities of viral types per unit volume, the most abundant host species should provide the most opportunity for contact with its specific phage. The dominant host species would then suffer the most viral lysis, and its population would be reduced, leaving an opportunity for another species to flourish, albeit for a short time (20). This simple feedback control process has been the basis of several studies and reviews (7, 8, 30, 31).
Similarly, we have shown quantitatively that cyanophage for M. aeruginosa exists in Lake Baroon. The viral burst size and replication time for the cyanophage of M. aeruginosa and its ability to infect and significantly reduce host cell numbers has been demonstrated and quantified. The density of the cyanophage was positively related to the rate of M. aeruginosa cell removal, and there was a density-dependent relationship between the host and its virus. Under ambient conditions in the lake, M. aeruginosa abundance was possibly suppressed by cyanophage presence. Cyanobacterial blooms may result from conditions in the lake that both favor host growth and prevent viral infection and lysis.
Environmental conditions and cyanophage infection.
In a seasonal study of M. aeruginosa in a hypereutrophic pond, Manage et al. (13) suggested that sharp decreases in the densities of M. aeruginosa might be associated with increases in infection by cyanophage and subsequent lysis of the host. Environmental factors related to blooms of the host are also underpinned by factors that reduce the ability of the cyanophage to infect and lyse M. aeruginosa. Viruses have a dual role in nature: they are a part of the organic material during their extracellular phase but are intimately linked to the life cycle and cellular metabolic processes of the host in the intracellular phase (29). Discovering the factors and mechanisms influencing bloom formation requires collecting data about specific hosts and their associated viruses, as we have done in this project.
Viral infection and lysis of the host are based on the assumption that the phage is infective, because regardless of the quantity of virus per unit volume, if the phage cannot infect its host it cannot exert pressure on the community structure. The ability of the virus to attach and transfer the viral genome to the host (infectivity) has become an important area of research for investigators studying the role of virus in community dynamics. Therefore, research that aims to understand physical and chemical factors that might control toxic cyanobacterial blooms should also consider how these factors might interfere with the binding, infection, and lysis of the host's cyanophage.
Acknowledgments
Rick Webb's (CMM University of Queensland) assistance with the transmission electron microscopy was much appreciated. Thanks are also due to Mariola Hoffman (Griffith University) for Fig. 1 graphics and the Caloundra City Council for the original lake map and to Aqua Gen Water and Renewable Energy, especially Phil Aldridge, for support and valuable discussions.
We are most grateful for the financial support of the Australian Research Council Linkage Grant (C00107716).
REFERENCES
- 1.Aldridge, P. J., J. S. Pulsford, and C. B. Traill (ed.). 1997. Lake Baroon catchment management strategy, vol. 3. Caloundra-Maroochy Water Supply Board, Palmwoods, Queensland, Australia.
- 2.Elser, J. J. 1999. The pathway to noxious cyanobacterial blooms in lake: the food web as the final turn. Freshw. Biol. 42:537-543. [Google Scholar]
- 3.Fowler, J., L. Cohen, and P. Jarvis. 1998. Practical statistics for field biology, 2nd ed. Wiley, New York, N.Y.
- 4.Fuhrman, J. 1999. Marine viruses and their biogeochemical and ecological effects. Nature 399:541-548. [DOI] [PubMed] [Google Scholar]
- 5.Fuhrman, J. 2000. Impact of viruses on bacterial processes, p. 327-350. In D. L. Kirchman (ed.), Microbial ecology of the oceans. John Wiley & Sons Inc., New York, N.Y.
- 6.Fuhrman, J. A., and C. A. Suttle. 1993. Viruses in marine planktonic systems. Oceanography 6:50-62. [Google Scholar]
- 7.Guixa-Boixereu, N., K. Lysnes, and C. Pedros-Alio. 1999. Viral lysis and bacterivory during a phytoplankton bloom in a coastal water microcosm. Appl. Environ. Microbiol. 65:1949-1958. [DOI] [PMC free article] [PubMed] [Google Scholar]
- 8.Hannen, E. J. V., G. Zwart, M. P von Agterveld, H. J. Gons, J. Ebert, and H. J. Laanbroek. 1999. Changes in bacterial and eukaryotic community structure after mass lysis of filamentous cyanobacteria associated with viruses. Appl. Environ. Microbiol. 65:795-801. [DOI] [PMC free article] [PubMed] [Google Scholar]
- 9.Hennes, K. P., C. A. Suttle, and A. M. Chan. 1995. Fluorescently labeled virus probes show that natural virus populations can control the structure of marine microbial communities. Appl. Environ. Microbiol. 61:3623-3627. [DOI] [PMC free article] [PubMed] [Google Scholar]
- 10.Jiang, S. C., C. A. Kellogg, and J. H. Paul. 1998. Characterization of marine temperate phage-host systems isolated from Mamala Bay, Oahu, Hawaii. Appl. Environ. Microbiol. 64:535-542. [DOI] [PMC free article] [PubMed] [Google Scholar]
- 11.Jones, G. J., and W. Poplawski. 1998. Understanding and management of cyanobacterial blooms in sub-tropical reservoirs of Queensland, Australia. Water Sci. Technol. 372:161-168. [Google Scholar]
- 12.Lu, J., F. Chen, and R. E. Hodson. 2001. Distribution, isolation, host specificity, and diversity of cyanophages infecting marine Synechococcus spp. in river estuaries. Appl. Environ. Microbiol. 67:3285-3290. [DOI] [PMC free article] [PubMed] [Google Scholar]
- 13.Manage, P. M., Z. Kawabata, and S. Nakano. 1999. Seasonal changes in densities of cyanophage infectious to Microcystis aeruginosa in a hyper eutrophic pond. Hydrobiologia 411:211-216. [Google Scholar]
- 14.McDaniel, L., L. A. Houchin, S. J. Williamson, and J. H. Paul. 2002. Lysogeny in marine Synechococcus. Nature 414:496. [DOI] [PubMed] [Google Scholar]
- 15.McGregor, G. B., and L. D. Fabbro. 2001. A guide to the identification of Australian freshwater planktonic chroococcales (cyanoprokaryota/cyanobacteria). Identification guide no. 39. Cooperative Research Centre for Freshwater Ecology, Canberra, Australia.
- 16.Middelboe, M. 2000. Bacterial growth rate and marine virus-host dynamics. Microb. Ecol. 40:114-124. [DOI] [PubMed] [Google Scholar]
- 17.Miller, R. V. 1998. Methods for enumeration and characterisation of bacteriophages from environmental samples, p. 218-235. In R. S. Burlage, R. Atlas, D. Stahl, G. Geesey, and G. Sayler (ed.), Techniques in microbial ecology. Oxford University Press, New York, N.Y.
- 18.Noble, R. T., and J. A. Fuhrman. 1998. Use of SYBR Green I for rapid epifluorescence counts of marine viruses and bacteria. Aquat. Microb. Ecol. 14:113-118. [Google Scholar]
- 19.Oberholster, P. J., A. M. Botha, and J. U. Grobbelaar. 2004. Microcystis aeruginosa: source of toxic microcystins in drinking water. Afr. J. Biotechnol. 3:159-168. [Google Scholar]
- 20.Phlips, E. J., R. L. Monegue, and F. J. Aldridge. 1990. Cyanophage which impact bloom-forming cyanobacteria. J. Aquat. Plant Manag. 28:92-97. [Google Scholar]
- 21.Pollard, P. C. 2002. Wastewater treatment microbiology, p 3337-3353. In G. Bitton (ed.), Encyclopaedia of environmental microbiology. John Wiley & Sons, London, United Kingdom.
- 22.Shirai, M., A. Ohtake, T. Sano, S. Matsumoto, T. Sakamoto, A. Sato, A. Aida, K.-I. Harada, T. Shimada, M. Suzuki, and M. Nakano. 1991. Toxicity and toxins of natural blooms and isolated strains of Microcystis spp. (cyanobacteria) and improved procedure for purification of cultures. Appl. Environ. Microbiol. 57:1241-1245. [DOI] [PMC free article] [PubMed] [Google Scholar]
- 23.Suttle, C. A. 1993. Enumeration and isolation of viruses, p. 121-134. In P. F. Kemp, B. R. Sherr, E. B. Sherr, and J. J. Cole (ed.), Aquatic microbial ecology. Lewis Publishers, Boca Raton, Fla.
- 24.Suttle, C. A. 1994. The significance of viruses to mortality in aquatic microbial communities. Microb. Ecol. 28:237-243. [DOI] [PubMed] [Google Scholar]
- 25.Suttle, C. A. 2000. Cyanophage and their role in the ecology of cyanobacteria, p. 563-589. In B. A.Whitton and M. Potts (ed.), The ecology of cyanobacteria: their diversity in time and space. Kluwer Academic Press, Dordrecht, The Netherlands.
- 26.Suttle, C. A. 2000. Ecological, evolutionary and geochemical consequences of viral infection of cyanobacteria and eukaryotic algae, p. 247-296. In C. J. Hurst (ed.), Viral ecology. Academic Press, London, England.
- 27.Suttle, C. A., and A. M. Chan. 1993. Marine cyanophage infecting oceanic and coastal strains of Synechococcus: abundance, morphology, cross-infecting and growth characteristics. Mar. Ecol. Prog. Ser. 92:99-109. [Google Scholar]
- 28.Suttle, C. A., A. M. Chan, and M. T. Cottrell. 1990. Infection of phytoplankton by viruses and reduction of primary productivity. Nature 347:467-469. [Google Scholar]
- 29.Weinbauer, M. G. 2004. Ecology of prokaryotic viruses. FEMS Microbiol. Rev. 28:127-181. [DOI] [PubMed] [Google Scholar]
- 30.Weinbauer, M. G., and F. Rassoulzadegan. 2004. Mini-review: are viruses driving microbial diversification and diversity. Environ. Microbiol. 6:1-11. [DOI] [PubMed] [Google Scholar]
- 31.Weinbauer, M. G., and M. G. Hofle. 1998. Significance of viral lysis and flagellate grazing as factors controlling bacterioplankton production in a eutrophic lake. Appl. Environ. Microbiol. 64:431-438. [DOI] [PMC free article] [PubMed] [Google Scholar]
- 32.Whitton, B. A., and M. Potts (ed.). 2000. The ecology of cyanobacteria: their diversity in time and space. Kluwer Academic Publishers, Dordrecht, The Netherlands.
- 33.Wommack, K. E., and R. R. Colwell. 2000. Virioplankton: viruses in aquatic ecosystems. Microbiol. Mol. Biol. Rev. 64:69-114. [DOI] [PMC free article] [PubMed] [Google Scholar]