Significance
It is well established that mechanical inputs, such as strain and elasticity, can be sensed by eukaryotic cells and can impact phenotype and behavior. In contrast, very little is known about how prokaryotes may respond to mechanical inputs. Here, we show that bacteria can sense shear and can respond by initiating biofilms. This is an important advance in fundamental microbiology and mechanobiology. Biofilms are difficult to prevent using extant approaches. Our knowledge points the way to a hitherto-undeveloped type of antibiofilm surface that thwarts mechanosensing by not sustaining sufficiently high shear. This would prevent bacteria from sensing surface attachment, activating cyclic-di-GMP signaling, and forming a biofilm.
Keywords: mechanosensing, biofilm, cyclic-di-GMP, Pseudomonas aeruginosa, mechanobiology
Abstract
Biofilms are communities of sessile microbes that are phenotypically distinct from their genetically identical, free-swimming counterparts. Biofilms initiate when bacteria attach to a solid surface. Attachment triggers intracellular signaling to change gene expression from the planktonic to the biofilm phenotype. For Pseudomonas aeruginosa, it has long been known that intracellular levels of the signal cyclic-di-GMP increase upon surface adhesion and that this is required to begin biofilm development. However, what cue is sensed to notify bacteria that they are attached to the surface has not been known. Here, we show that mechanical shear acts as a cue for surface adhesion and activates cyclic-di-GMP signaling. The magnitude of the shear force, and thereby the corresponding activation of cyclic-di-GMP signaling, can be adjusted both by varying the strength of the adhesion that binds bacteria to the surface and by varying the rate of fluid flow over surface-bound bacteria. We show that the envelope protein PilY1 and functional type IV pili are required mechanosensory elements. An analytic model that accounts for the feedback between mechanosensors, cyclic-di-GMP signaling, and production of adhesive polysaccharides describes our data well.
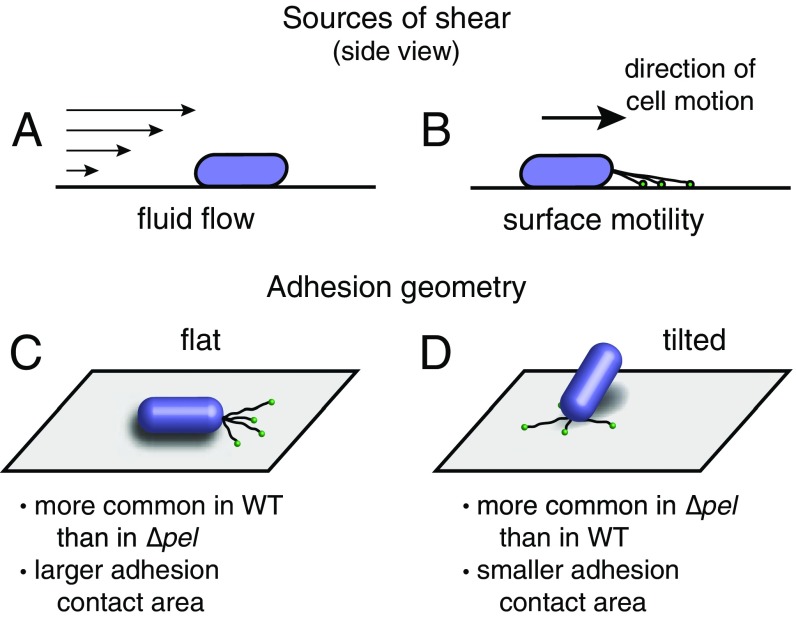
In higher eukaryotes, mechanosensing and mechanotransduction are well established to be of widespread importance (1, 2). In contrast, very little is known about how prokaryotes respond to mechanical inputs. However, bacteria adapt to a wide range of mechanically differentiated and changing environments (3). An important example is biofilm development, in which the transition from suspension in a fluid environment to adhesion to a solid substrate is associated with radical changes in intracellular signaling and gene expression. What cue is sensed to notify bacteria that they have become attached to a surface is not known. Notably, transitioning from fluid suspension to surface attachment can result in an abrupt increase in the shear experienced by bacteria. Increased shear can arise from fluid flow and from bacterial motility (Fig. S1 A and B). In both these cases, adhesive forces binding one side of a bacterium to the surface will resist displacement and thereby result in shear. It was recently found that surface-attached Escherichia coli can respond to shear by increasing virulence (4). In this work, we investigate the role of shear as a cue to activate signaling to trigger biofilm development.
Fig. S1.
Physical interactions between P. aeruginosa and surfaces. Sources of shear stress on adhered cells include (A) external fluid flow and (B) pili-driven twitching motility. Among surface motile cells, two distinct adhesion geometries emerge, with (C) cells lying flat on the surface have a larger area in contact with the substrate and (D) cells tilted up off of the surface have a smaller area in contact with the substrate.
Pseudomonas aeruginosa is a biofilm-forming, opportunistic human pathogen (5). When planktonic P. aeruginosa cells attach to a solid surface, intracellular levels of cyclic-di-GMP (c-di-GMP) increase (6–8). c-di-GMP is a second messenger used by P. aeruginosa and many other bacteria to regulate the expression of genes associated with biofilm initiation (9). What specific cue is sensed upon surface adhesion and leads to increased c-di-GMP signaling is not known. This is a significant gap in our understanding of a fundamental microbiological process.
Recent work has suggested that P. aeruginosa and other bacteria may be able to sense mechanical changes in their environment through mechanosensitive proteins in their cell envelopes (10–13). The envelope protein PilY1 has been identified as a key mediator of surface-associated behaviors and has been suggested as a possible mechanosensor (14). PilY1 has a region with weak similarity to the mechanoresponsive von Willebrand factor A domain (12), widely found in higher eukaryotes (15). In addition, type IV pili have recently been suggested as possible force sensors in a proposed mechanochemical model for virulence regulation in P. aeruginosa by a different intracellular signal, cyclic AMP (14, 16). Type IV pili extend, attach, and retract to exert forces that allow P. aeruginosa to move laterally across surfaces in a motility mode known as “twitching” (17, 18). Type IV pili have been associated with c-di-GMP signaling and biofilm development in Clostridium difficile (19) and P. aeruginosa (11).
Here, we show that shear cues P. aeruginosa that it is adhered to a surface and thereby results in increased c-di-GMP signaling. We demonstrate this in two ways: (i) modulating the shear force arising from bacterial motility on surfaces by modulating the polymer-mediated adhesion to the surface, and (ii) imposing variable external shear by varying fluid flow (Fig. S1 A and B). By using fluid flow to impose shear with a magnitude and time-dependence that we control, we can distinguish the effects of twitching motility from those of environmental forces, and we can distinguish the effects of mechanical coupling from those of mechanosensing. We propose an analytic model for bacterial surface sensing that incorporates inputs from both surface adhesion per se and external shear stress, as well as a biological feedback loop between c-di-GMP and adhesion.
Results
The Pel Polysaccharide Tightens Coupling to the Surface and Increases c-di-GMP Levels in Surface-Adhered Bacteria.
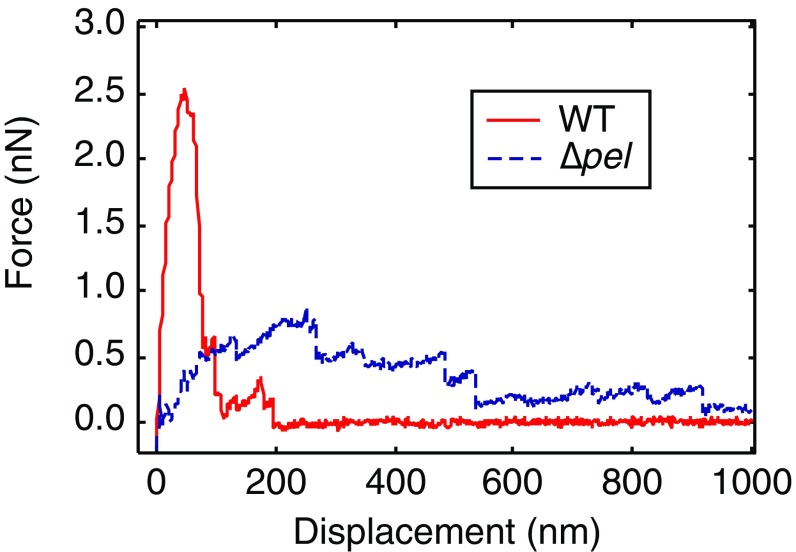
Planktonic P. aeruginosa are coated in sticky extracellular polysaccharides (EPSs) that promote surface adhesion (20–22). The P. aeruginosa wild-type (WT) laboratory strain PAO1 in vitro makes two EPS materials, Psl and Pel; the isogenic transposon mutant ∆pel does not produce Pel. We have previously shown that Pel modulates the geometry of surface attachment by making it more likely that cells will lie down flat, maximizing the area in contact with the surface (Fig. S1 C and D) (21). We have also used atomic force microscopy (AFM) to pull bacteria off a surface and found that, near the surface, force increases more steeply with displacement for WT than for Δpel (Fig. S2) (21). Thus, Pel production increases both geometric and mechanical coupling to the surface.
Fig. S2.
AFM measurements of force during retraction from a glass surface for WT and ∆pel. Individual force curves show representative features of each type. The ∆pel curve has a shallower slope near the surface than does the WT.
Here, we investigate how Pel production is linked to surface sensing and c-di-GMP production. Conventional c-di-GMP studies have relied on discrete measurements of c-di-GMP levels before and after some specific event, with measurements typically separated on the timescale of hours (8, 11, 12, 23, 24). Therefore, the dynamics of c-di-GMP activation have been largely unknown. We determine c-di-GMP dynamics by using time-lapse confocal fluorescence microscopy of bacteria containing the plasmid pCdrA::gfp, which is a verified reporter for c-di-GMP; cdrA, and thus green fluorescent protein (GFP), is up-regulated by c-di-GMP (25). We cycle between subpopulations on the surface, so that each subpopulation is imaged at 30-min intervals.
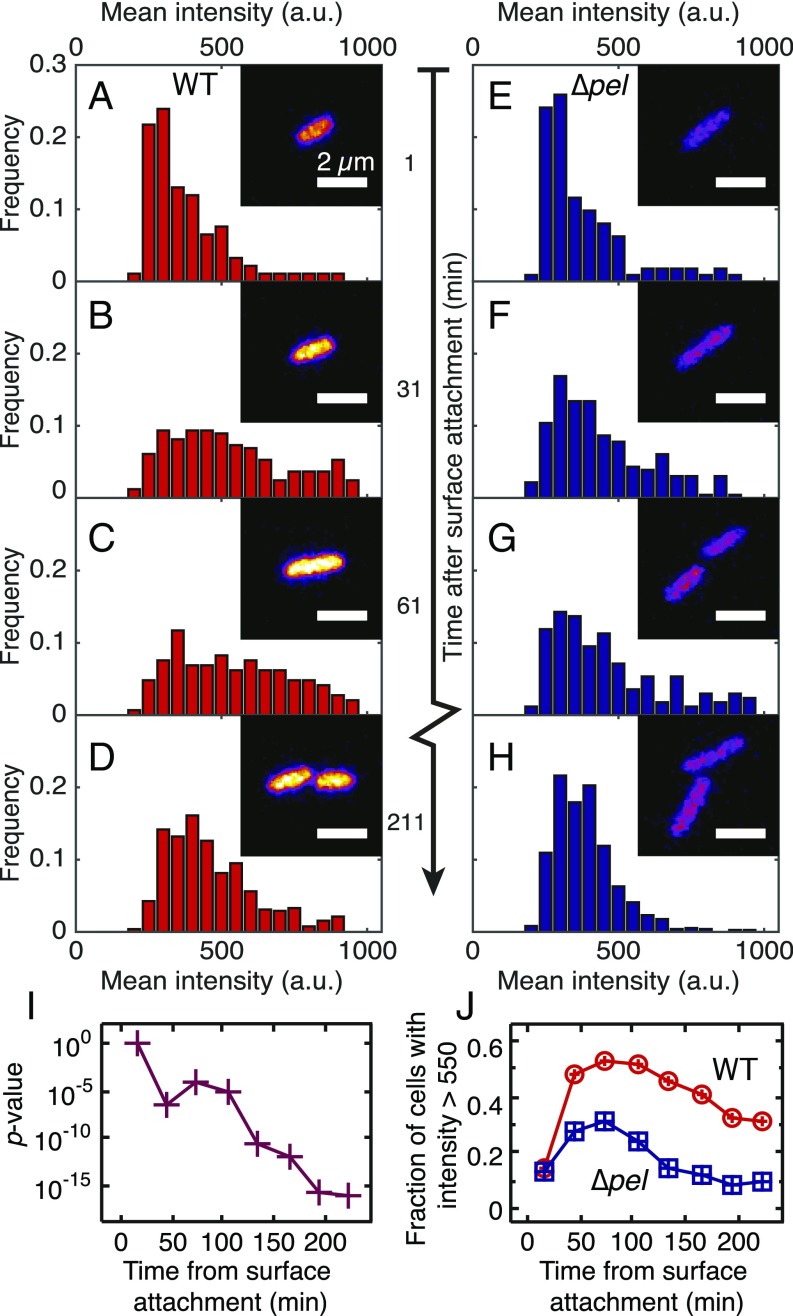
In the first 30 min following attachment to the surface, reporter populations of WT and ∆pel both have a sharply peaked GFP intensity distribution (Fig. 1 A and E). We interpret this as the footprint of residual c-di-GMP levels from planktonic culture. The finding that WT and ∆pel populations have the same reporter brightness distribution indicates that loss of pel functionality has not intrinsically disrupted the c-di-GMP production machinery.
Fig. 1.
Histograms of average fluorescence intensity per cell for WT (A–D) and ∆pel (E–H) populations during 30-min intervals that begin at the times indicated. For each histogram, n ≥ 100 cells from at least five independent experiments. Less than 30 min after surface attachment, WT (A) and ∆pel (E) histograms are indistinguishable (two-sample Kolmogorov–Smirnov test, P = 0.87). After 30 min, both WT and ∆pel populations have broadened toward higher intensities, with the WT showing a larger change. (Insets) Sample confocal micrographs taken during each time window. This time series of micrographs tracks the brightness of one WT bacterium and one Δpel bacterium and their daughter cells. Purple, lower intensity; yellow, higher intensity. (I) P values from comparing WT and ∆pel populations using a two-sample Kolmogorov–Smirnov test. (J) The percentage of cells in each population that have a mean intensity brighter than 550 a.u.
Beginning 30 min after attachment, the brightness distribution for WT populations broadens before slowly narrowing (Fig. 1 B–D); the broadening indicates that a large subpopulation of WT cells achieves high production of c-di-GMP compared with the planktonic state. The 30-min delay likely reflects the timescales necessary for adhesion-triggered increase in c-di-GMP plus the timescales for GFP production and folding (26). The brightness distribution for ∆pel populations broadens much less upon surface adhesion than does the brightness distribution for WT populations (Fig. 1 F–H). WT and ∆pel distributions remain significantly different for at least 240 min (Fig. 1I). For a threshold brightness of 550 a.u., for the first 30 min after attachment, less than 15% of either population is above threshold. After 90 min, the above-threshold fraction more than doubles for ∆pel and more than triples for WT (Fig. 1J). After 2 h, the above-threshold fraction of the ∆pel population falls back to its initial level (below 15%). The above-threshold fraction of the WT population is still about 30% even after 4 h.
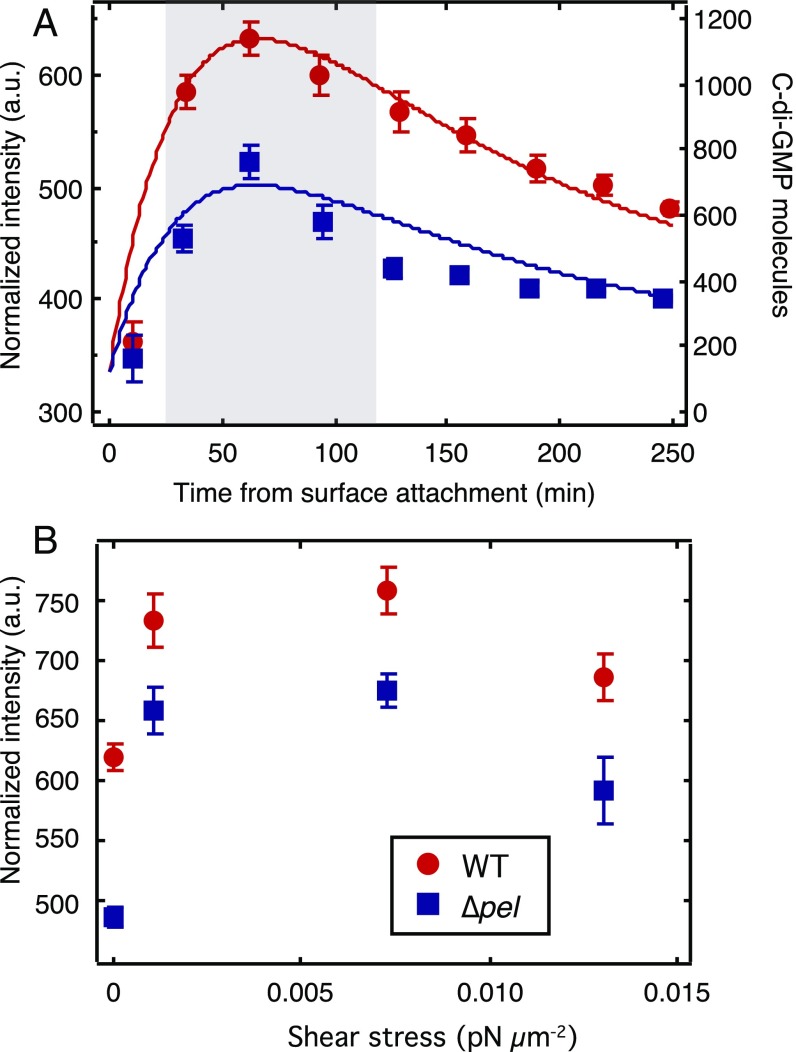
c-di-GMP levels averaged over the entire population peak at about 60 min after surface attachment and then decrease toward a base level (Fig. 2A). Thirty minutes after adhesion, the average intensity of WT reporters has increased by 61%, whereas the average intensity of ∆pel reporters has increased by only 30%. Moreover, WT achieve a peak increase in brightness of 74% compared with 50% for ∆pel, and subsequently the WT drop toward a baseline level approximately three times more slowly than do the ∆pel.
Fig. 2.
Pel production and mechanical shear both increase intracellular c-di-GMP levels. (A) Average intensity vs. time for the first 250 min after surface attachment. Both WT and ∆pel (data points, left axis) start at the same level, sharply increase during the first hour, and then decrease. Corresponding curves are from our model (solid lines, right axis). (B) Peak intensity vs. applied shear stress. Each data point is the average of all cells imaged in the interval 30–120 min after surface attachment, corresponding to the peaks in A (gray shaded region). n ≥ 100 cells, from at least two independent experiments. Error bars are SEM.
Our results show that Pel production enhances the magnitude and lifetime of the response to the surface without intrinsically changing c-di-GMP production for bacteria that are not attached to a surface. Moreover, our results show that the time course of c-di-GMP signaling is nonmonotonic.
Slower Surface Motility, Indicative of Greater Friction, Is Associated with Stronger Surface Sensing.
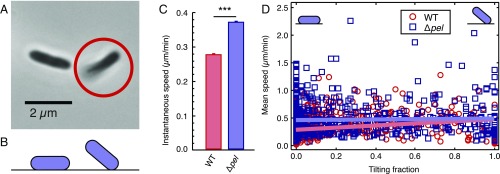
The pili-driven twitching motility of P. aeruginosa can take on two distinct modes: flat “crawling,” where the cell is lying flat on the surface, and upright “walking,” where the cell is in contact with the surface at only one pole (Fig. S1 C and D, and Fig. 3 A and B) (27). We see that both WT and ∆pel retain surface motility, demonstrating that pilus function is not lost with the loss of pel. Because the force-generating capabilities of pili are intrinsic to the proteins that they are made of, we expect WT and ∆pel to have the same pilus machinery and function. We further note that WT, on average, move about 25% more slowly on the surface than do ∆pel (Fig. 3C). This discrepancy is even greater for cells that spend most of their lifetime lying flat. In contrast, for cells that spend most of their lifetime attached by only one end, WT and ∆pel do not have a significant difference in speed (Fig. 3D). From these findings, we conclude that there is a friction-like force between the cells and the surface that originates from the polymers coating the cell body. The magnitude of this dissipative force increases with the adhesion area, which also increases the number of polymer contacts involved. We expected a priori that disruption of pel function should have no impact on the force generated by the pilus motor. This is supported by our finding that WT and ∆pel have indistinguishable motility when average adhesion area, and therefore polymer-mediated friction, is low. Therefore, we infer that WT experience greater dissipative interactions with the surface, and therefore greater shear stress, than do ∆pel.
Fig. 3.
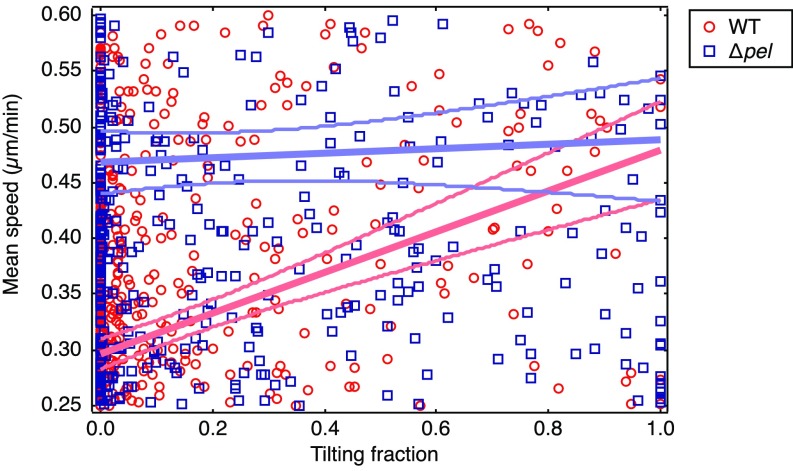
Without Pel, cells move more quickly on surfaces. (A) Phase-contrast micrograph of PAO1 ∆pel cells. The cell on the Left is fully in focus, lying flat on the surface. The circled cell on the Right is partially out of focus, tilting up off of the surface. (B) Schematic showing a side view of flat-lying and tilting cells. (C) Average instantaneous speed of WT and ∆pel cells. n ≥ 80,000 data points, from three experiments. ***P < 0.001 from two-sample t test; error bars are SEM. (D) Scatter plot showing the mean speed of cells during an entire trajectory as a function of the fraction of the cell’s tracked lifetime that was spent tilting. Linear fits are shown. Below a lifetime tilting fraction of 0.67, the fits lie outside of the 95% confidence intervals of each other, and ∆pel are faster than WT. Detail for fit lines is shown in Fig. S3.
Fig. S3.
Zoomed-in view of the fit lines in Fig. 3D. The 95% confidence intervals do not overlap for tilting fractions lower than 0.68. Linear fits (y = m*x + b) to each dataset yield: for WT, m = 0.1825 ± 0.025, b = 0.2963 ± 0.0068; for ∆pel, m = 0.020 ± 0.034, b = 0.468 ± 0.014.
Individual type IV pili exert forces of ∼100 pN (28); the collective activity of several pili, plus the polymer-mediated force opposing motion, plus hydrodynamic resistance, sum to give the net motility-associated force on a bacterium (29, 30). The net force is a shear force because the polymer-mediated force acts only where the bacterium is attached to the surface.
Mechanical Shear Increases c-di-GMP Levels.
The association between loss of Pel, reduced c-di-GMP response to surface attachment, and reduced motility-associated shear, leads to the hypothesis that P. aeruginosa may be sensing mechanical shear as a cue that it is attached to the surface. Therefore, we apply external shear by varying the flow rate of liquid media over surface-attached bacteria. We measure c-di-GMP levels over the time window from 30 to 120 min after surface attachment, because this corresponds to the peak of the c-di-GMP time course for both WT and Δpel (Fig. 2A). We find that externally applied shear increases the peak intracellular levels of c-di-GMP for both WT and ∆pel, in lockstep with each other (Fig. 2B). This serves as further evidence that the cellular machineries for surface sensing and for c-di-GMP production are not intrinsically perturbed by loss of pel function. This experiment also allows us to distinguish mechanical coupling, which is impacted by loss of Pel, from mechanosensing, which is not.
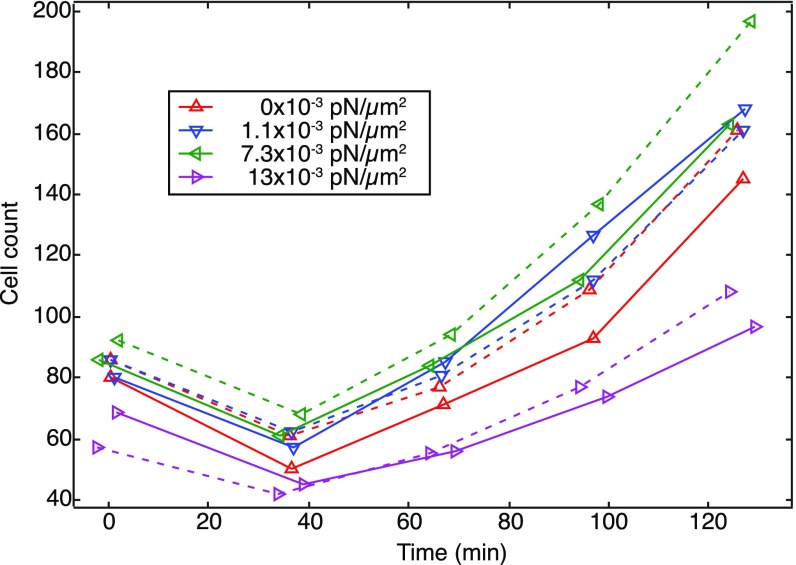
The maximum shear force on cells for which we measure c-di-GMP reporter intensity is only 0.002 pN, and we have seen cells adhered strongly at shear forces up to 0.02 pN. This is four orders of magnitude lower than pilus-generated forces. Thus, it is not surprising that we find that flow rarely removes cells from the surface (Fig. S4) and that bacteria translate freely even at high flow rates. The finding that even our highest flow rates do not remove bacteria from the surface also shows that the surface responses we measure do not arise from selective removal of weakly adhering or low-signaling subpopulations. However, other factors, such as rapid turnover of the medium and removal of bacterial products, may become important at high flow rates. This may be the cause of the decrease in reporter intensity at very high flow rates (Fig. 3B).
Fig. S4.
Shear flow does not disproportionately remove ∆pel cells from the surface. Cell counts for WT (solid lines) and ∆pel (dashed lines) populations in time. For a given shear stress, WT and ∆pel populations follow the same trend. Initial downturns correspond to an initial decrease of surface cells, with comparable decreases for both WT and ∆pel.
Shear Further Elevates c-di-GMP Levels in Populations Already Responding to Surface Adhesion.
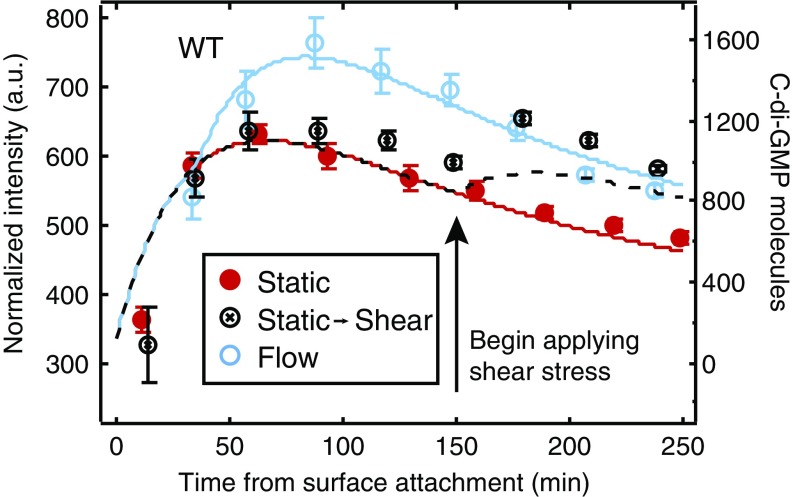
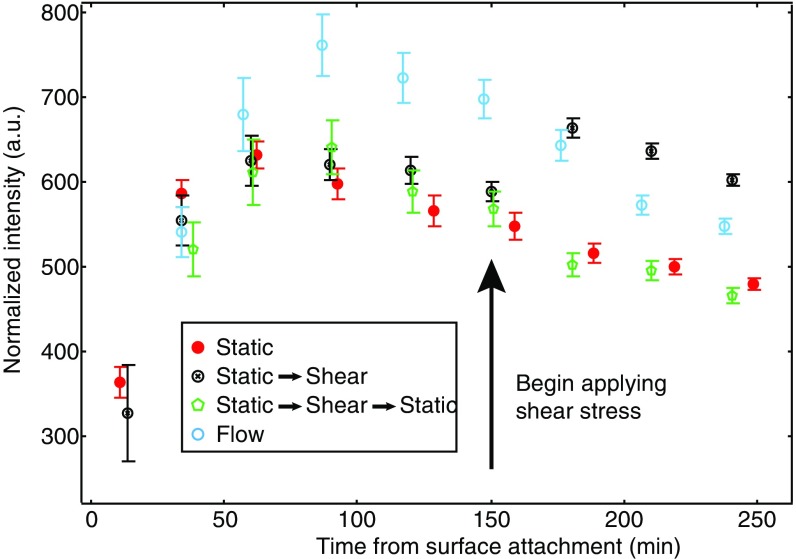
The finding that shear acts as a cue for surface adhesion raises the possibility that bacteria may be able to respond differentially to surface adhesion and to changes in external shear. To disentangle the effects of surface adhesion alone from surface adhesion coupled with externally applied shear stress, we allow WT cells to attach to a surface in the absence of flow. These bacteria experience an initial c-di-GMP response that peaks ∼60 min after surface attachment. Then, 150 min after surface attachment, we turn on flow to apply a shear stress of 0.013 pN/μm2. This begins a second increase in c-di-GMP that we attribute directly to the mechanical input provided by shear flow (Fig. 4, hollow black circles). The second increase does not exactly reproduce the response profile seen when constant flow is applied from the beginning. Rather, the second increase has an intensity that is close to that of the response under constant flow at the observed time (hollow blue circles). This suggests that a time-dependent response function may be activated upon initial adhesion that acts as an envelope to limit the magnitude of the response to external shear. Thus, the response under time-varying flow is fundamentally different from the response curves for no flow (filled red circles) and constant flow.
Fig. 4.
Shear stress can “restart” c-di-GMP response in surface-sensitive cells. c-di-GMP response for WT PAO1 as a function of time. Cells in static (filled red) and constant shear stress (hollow blue) conditions show a characteristic rise and monotonic decrease in time. Cells in semifilled black circles were grown in static culture for 150 min, after which point a constant shear stress was applied and fluorescence sharply increases. n ≥ 300 cells, from at least three independent experiments. Error bars are SEM. Corresponding curves are from our model (solid and dashed lines, right axis). The c-di-GMP increase is not due to the influx of fresh media, as refreshment of media without a sustained shear stress does not elicit a response (Fig. S5).
Fig. S5.
Normalized intensity for WT PAO1 cells under static (filled red circles), step-up (partially filled black circles), spike (green hexagons), and constant-flow (hollow blue circles) conditions. For the spike case, flow was turned on after 150 min and turned back off 10 min later (160 min after surface attachment). These cells do not show a response at this time. This indicates that the secondary increase in fluorescence (c-di-GMP level) from applied shear stress at 150 min (partially filled black circles) is not an artifact of media refreshment.
Functional Type IV Pili and PilY1 Are Required Mechanosensory Elements.
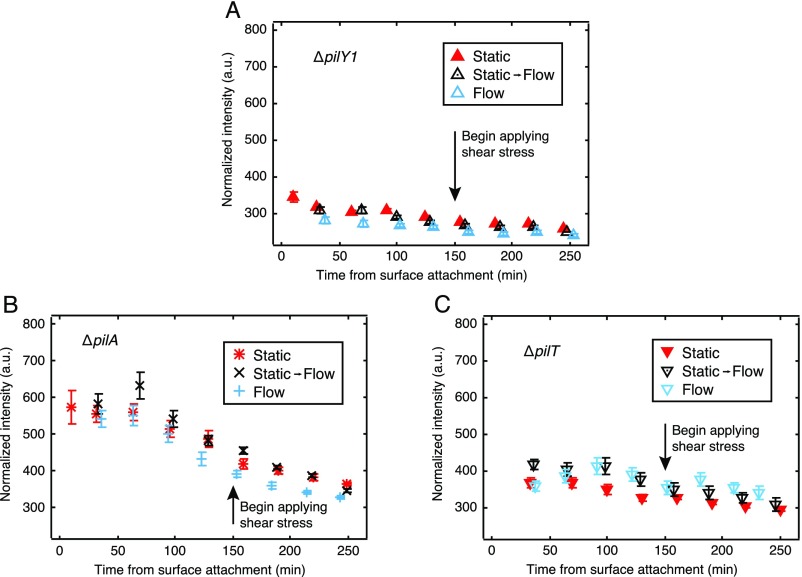
We find that ∆pilY1 bacteria are nonmotile on surfaces and do not increase c-di-GMP in response to surface attachment in the absence of external shear (Fig. S6A). We also find that ∆pilY1 bacteria do not respond to external shear with any increase in c-di-GMP. Thus, we find that PilY1 is a required component for the mechanosensing system that is required for the c-di-GMP response to surface adhesion and shear.
Fig. S6.
Companion plots of PAO1 knockouts for (A) pilY1, (B) pilA, and (C) pilT, showing the lack of a c-di-GMP response to both surface adhesion and shear stress for cells either lacking pili (B) or missing key pilus-associated proteins (A and C).
∆pilA is deficient in production of PilA, the major subunit for type IV pili (31), and thus cannot form type IV pili. Therefore, ∆pilA bacteria are nonmotile on surfaces. We found that ∆pilA cells adhere to the surface, in line with our previous findings (21). However, ∆pilA do not show a significant increase in c-di-GMP levels upon surface adhesion and also do not increase c-di-GMP in response to external shear (Fig. S6B).
Type IV pili are involved in the transport of PilY1 to the outer cell envelope (11). Therefore, our data showing that ΔpilA do not respond to surface adhesion with increased c-di-GMP are not an unambiguous indication that type IV pili are a requisite mechanosensor. Therefore, we repeated these experiments with ∆pilT bacteria, which are hyperpiliated but cannot produce the pilus retraction motor PilT and therefore are also nonmotile on the surface. If pilus functionality were necessary for force generation but not for force sensing, then ∆pilT cells would be unable to respond to surface adhesion per se, but would show a response to external force. However, PAO1 ∆pilT also failed to respond both to surface adhesion and to externally applied shear (Fig. S6C). This suggests that mechanosensing requires either pilus retraction functionality, or a structural feature disrupted in ∆pilT such as that required for surface deposition of PilY1.
Therefore, we conclude that both PilY1 and fully functional pili are necessary for a c-di-GMP surface-sensing response.
Modeling.
Thus far, we have found that mechanical shear is a cue that increases c-di-GMP production and that the magnitude of the shear will depend on the EPS coating the bacteria. This implies a feedback loop, because increased c-di-GMP levels increase EPS production (23). To assess the degree to which a few-parameter model incorporating such a feedback loop can describe our experimental results, we model c-di-GMP time course using coupled differential equations for force on activated mechanosensors increasing c-di-GMP production (Eq. 1), EPS increasing sensor activation (by increasing coupling to the surface) (Eq. 2), and c-di-GMP increasing EPS production (Eq. 3):
| [1] |
| [2] |
| [3] |
The model incorporates three biological factors: c-di-GMP (), EPS (), and force sensors () (Table 1). Parameters describe the coupling between biological factors (α values) and the constitutive rates of production and degradation (γ values) (Table S1).
Table 1.
Biological factors in our model for mechano-activation of c-di-GMP
| Biological factor | Initial value | Description |
| C | 120 | No. of c-di-GMP molecules |
| Y1 | 1,939 (WT) | No. of activated surface sensors |
| 1,060 (∆pel) | ||
| E | 12 | Amount of EPS |
Table S1.
Coupling and decay parameters in our model for mechanoactivation of c-di-GMP
| Parameter | Value | Description |
| α1 | 0.025–0.041 min−1 | Surface sensor-triggered production of c-di-GMP—depends on force |
| α3 | 0.01 min−1 | More EPS translates into more force sensors in contact with the surface |
| α4 | 0.001 min−1 (WT) | c-di-GMP promotes EPS production |
| 0 min−1 (∆pel) | ||
| α5 | 3.6 molecules/min | Constitutive production of c-di-GMP |
| γ1 | 0.03 min−1 | Decay rate for c-di-GMP |
| γ2 | 0.006 min−1 | Decay rate for Y1 |
| γ3 | 0.003 min−1 | Decay rate for EPS |
The initial number of c-di-GMP molecules was estimated from ref. 32, and the number of force sensors and EPS were estimated using geometrical considerations. Initial parameter values were an ansatz to achieve qualitatively similar curves to our experimental data. Due to the simplified, black-box nature of our model, it is difficult to ascribe the actions of a particular protein or gene to a given parameter. Rather, each parameter is likely a combination of the actions of multiple, possibly interconnected, genes and their products. The model posits that WT cells will activate more force sensors than ∆pel cells upon adhesion to the surface because WT have stronger coupling to the surface than do ∆pel. The parameter α1 describes the rate at which an activated force sensor triggers production of c-di-GMP. In our model, this includes the effects of variable force, so that α1 is lower for cells in static culture and increases with increasing shear.
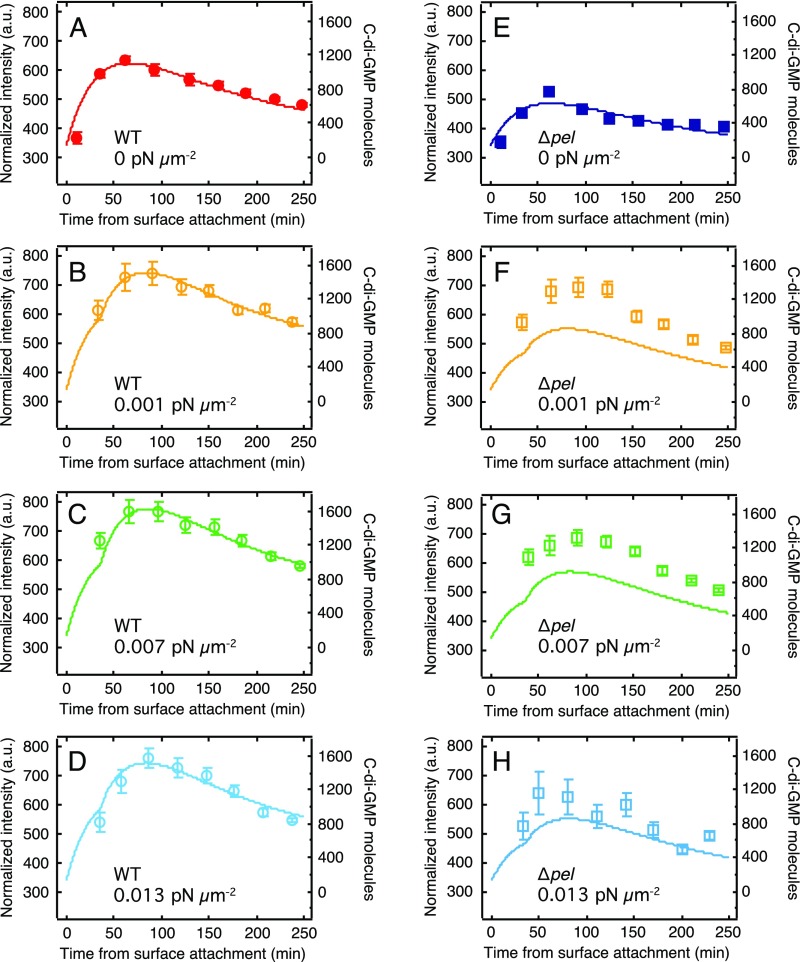
This model has a large number of free parameters, but it is not underdetermined because we can vary EPS production and the magnitude and time-dependence of shear to generate an arbitrarily large number of distinct c-di-GMP time courses. Keeping initial values for C and E constant, we fit Y1 for both WT and ∆pel. WT data from constant-flow experiments (Fig. S7) was then used to fit new α1 values for each flow rate (Table S2). These values were used to plot curves for both WT and ∆pel (Fig. S7). For WT at all external-shear values and for ∆pel at zero external shear and high external shear, the model curves are in excellent agreement with the data (Fig. 2 and Fig. S7). For ∆pel at intermediate-shear values, the agreement is less exact, but the trends are correct and the models in this case are pure predictions, using no free parameters. Furthermore, our model also describes the shape of the curve when external shear flow is activated 150 min after attachment to the surface (Fig. 4).
Fig. S7.
c-di-GMP levels increase in response to a range of magnitudes of external shear stress. Curves for WT (A–D) and ∆pel (E–H) knockout strains in response to varying amounts of external shear stress. Data points are experimental results (left axis), and solid curves are from our model (right axis). Model stress levels ( parameter) were fitted to the WT data and then applied to the ∆pel model.
Table S2.
Flow rates, associated shear stresses, and fit α1 parameters
| Volumetric flow rate Q*3D, mL/min | Shear stress, pN/μm2 | α1 value, min−1 |
| 0 | 0 | 0.0250 |
| 0.065 | 0.001 | 0.0377 |
| 0.43 | 0.007 | 0.0411 |
| 0.77 | 0.013 | 0.0378 |
Thus, this basic model predictively describes the most salient features of our experimental results.
Discussion
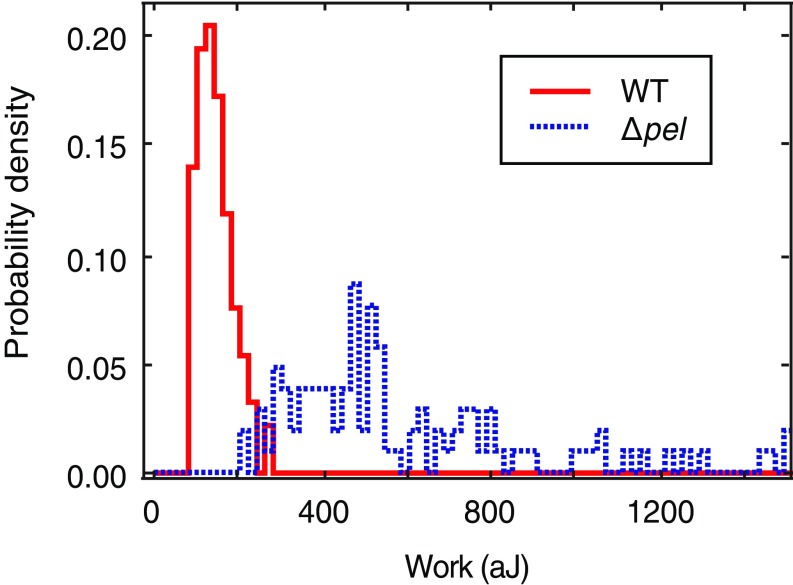
Our primary finding is that P. aeruginosa uses mechanosensing to respond to surface attachment by increasing the production of c-di-GMP, an intracellular signal that initiates the transition from the planktonic to the biofilm phenotype. The EPS Pel enhances surface sensing by increasing friction-like interaction with the surface, and thereby increasing the shear resulting from twitching motility driven by type IV pili. Pel decreases the net mechanical work required to detach individual bacteria from a surface (Fig. S8) (21). Strengthening the surface-sensing response of newly adhered cells might overcome any disadvantage of easier detachment, because strong c-di-GMP signaling should enhance transition to the biofilm phenotype. The difference in c-di-GMP signaling between WT and ∆pel may cause the reported difference in WT and ∆pel biofilm phenotype (33). We have shown that PAO1 can respond to shear stresses on the order of millipascals. The shear stresses and rates we apply are 2–100 times smaller than stresses commonly studied for biofilm formation or found in host physiology (34–36). This suggests that PAO1 and other bacteria may be remarkably sensitive to mechanical stresses in their environment.
Fig. S8.
The EPS Pel decreases the work of detachment. Bacteria were attached to the tip of an AFM cantilever, brought into contact with a surface, and then pulled off. Measuring the deflection of the cantilever tip yielded the force of retraction as a function of distance from the surface. Integration of force over distance gives the mechanical work needed to detach the bacterium from the surface.
Our results also show that the time course of the c-di-GMP signaling response to surface adhesion is nonmonotonic (Fig. 2A). This suggests that c-di-GMP may act as a toggle switch, wherein transient high signal levels set gene expression patterns to the biofilm state, which is then maintained at lower signal levels (37). Higher eukaryotes have mechanoresponsive toggle switches (38). Genetic toggle switches have been analyzed theoretically in systems biology, with models verified using switches constructed in E. coli and Bacillus subtilis (39–41). These switches settle into one of two bistable states, with a single spike in chemical or thermal cues serving to flip from one state to the other. Unlike a toggle switch, a pressure switch would require sustained high levels of c-di-GMP throughout the lifetime of the biofilm. Thus, use of a toggle switch instead of a pressure switch would reduce the metabolic burden of continually producing c-di-GMP, freeing biofilm cells to expend energy in other pursuits.
We find that PilY1 is a required mechanosensory element for c-di-GMP response to surface adhesion and shear. This agrees with Luo et al. (11) who found that PilY1 provides a signal to the diguanylate cyclase SadC to activate c-di-GMP production in surface-attached cells, but apparently contradicts Kuchma et al. (12), who found that deleting pilY1 had no effect on c-di-GMP pools within bacteria. However, Kuchma et al. conducted their experiment on planktonic cells; we also see no difference in c-di-GMP levels for just-attached populations of WT and ΔpilY1. Cell wall deformation has been suggested as a means of sensing surface adhesion. However, this deformation and subsequent triggering of mechanosensitive channels takes longer than an hour (42), too long to be responsible for the fast responses we see. This further implicates PilY1 as a surface-sensing element, not intrinsic to the c-di-GMP production machinery.
We see that ΔpilT mutants, lacking pilus retraction, are deficient in a c-di-GMP response. Luo et al. find that knocking out pilus retraction via a ΔpilU mutant does not completely block surface sensing (11). However, they use cAMP for their measure of surface response. They further propose a signaling cascade where cAMP is produced upstream of PilY1 and c-di-GMP. It is consistent with our findings that pilus retraction is not required for cAMP production, but may be necessary for downstream c-di-GMP production. In addition, our results also show that ΔpilA, which altogether lack type IV pili, have constitutively higher levels of c-di-GMP production than do WT (Fig. S6A). This hints at another potential purpose for the PilA protein and/or the pilus structure in c-di-GMP production.
Identification of mechanical stress as the cue leading to biofilm development points to the possibility of a new type of approach for engineering antibiofilm surfaces. Extant approaches to preventing biofilms focus on developing surfaces that resist bacterial attachment or are bactericidal (43–45). Without c-di-GMP, P. aeruginosa that otherwise form robust biofilms within 12 h instead form no biofilm whatsoever over at least 72 h (24). Our work here suggests that surfaces that do not sustain mechanical stress (that behave as 2D fluids or very soft solids) should hinder transition to the biofilm phenotype, and should do so by targeting highly conserved mechanisms for which evolutionary escape is likely to be difficult.
Our work also suggests that the mechanical stresses from the environment, such as shear stress by external flow, to which bacteria are subjected in early biofilm initiation, may impact properties of the mature biofilm. For several bacterial species, biofilms that are grown under high shear are more elastic and denser in matrix proteins and EPS than biofilms grown under low shear (34, 35, 46). Thus, early enhancement in c-di-GMP time course might allow biofilm-forming bacteria to adapt the strength and resilience of the biofilms formed to better resist mechanical removal.
Materials and Methods
Bacteria and Media.
We used WT P. aeruginosa strain PAO1 and four single-gene transposon mutants in the PAO1 background, ∆pel, ∆pilA, ∆pilT, and ∆pilY1 (47). To be able to measure c-di-GMP levels, we transformed strains with the reporter plasmid pCdrA::gfp (25). This plasmid causes production of GFP to be increased when transcription of the cdrA gene increases in response to high intracellular levels of c-di-GMP. Strains transformed with a promotorless control plasmid pMH487 were used to measure background GFP expression. Bacteria were grown as described earlier, and time-lapse phase-contrast microscopy data acquired earlier were analyzed in this work to determine the relationship between EPS expression, tilting, and cell motility (21). See SI Materials and Methods.
Laser-Scanning Confocal Fluorescence Microscopy.
For measurements of c-di-GMP signaling, we volumetrically diluted the culture by either 500× or 50,000×. Samples for static experiments were prepared in the same way as for phase-contrast microscopy. For flow experiments, 500× diluted cultures were inoculated into flow cells (2 × 4 × 40 mm) and allowed to adhere to the surface of an untreated glass coverslip for 30–40 min, after which a peristaltic pump (Watson Marlow) began flow. Volumetric flow rates varied from 0.065 to 7.7 mL/min. Bacteria were imaged using an Olympus FV1000 motorized inverted IX81 microscope suite; the stage was enclosed by an incubation chamber heated to 37 °C. We use a 100× oil-immersion objective and bacteria were illuminated with a 488-nm laser using standard GFP filter sets. Image capture was controlled by FV10-ASW, version 3.1, software. Confocal Z stacks were taken with a depth of ∼4 µm and a spacing of 340 nm. For 50,000× dilutions and flow experiments, Z stacks were taken every 30 min for 4 h. The 500× dilutions were used to increase the ease with which cells could be found and imaged, so for static experiments Z stacks were taken every minute for the first 90 min, and for flow experiments, Z stacks were taken every 30 min for 4 h.
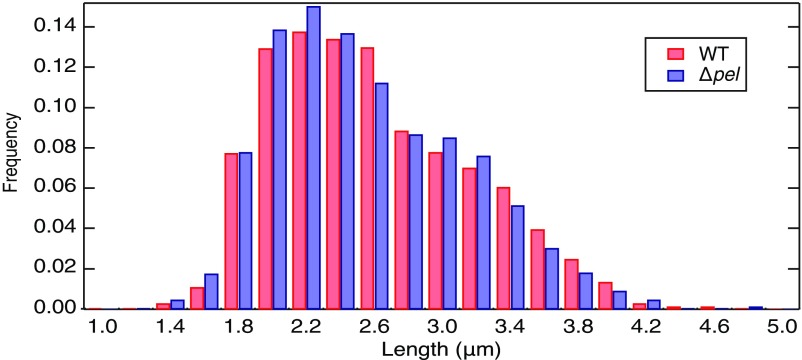
Confocal Z stacks were projected in the vertical direction to create images in the x–y plane. The projected length and the mean intensity of each bacterium were measured using the Fiji distribution of ImageJ software (48). The WT and ∆pel populations have very similar distributions of projected lengths, which verifies that images of dimmer ∆pel cells are not being artifactually truncated by brightness thresholding in a way that would magnify differences between the two populations (Fig. S9). The average intensity of each individual cell was computed and recorded along with the time elapsed from initial surface adhesion. Intensities were normalized by subtracting the average per-cell intensity of an ensemble of cells carrying a control plasmid for producing GFP that lacks the cdrA promoter (pMH874) to correct for natural variations in fluorescence between strains.
Fig. S9.
Image processing faithfully measures intensity data. Histograms of cell length for WT and ∆pel data. We measure both populations to have identical length distributions with our image-processing techniques. This ensures that brighter cells are not artificially measured to be longer by setting an intensity threshold.
Calculation of Shear Stress in Flow Experiments.
Flow was controlled using a Watson Marlow peristaltic pump, allowing us to set the 3D volumetric flow rate (Q*3D). From this, we can calculate the pressure drop per unit length down our channel (49). See SI Materials and Methods.
Model.
The model for mechanoactivation of c-di-GMP signaling was implemented and fit in COPASI (50) and iterated deterministically for 250 min using the LSODA (51) method.
AFM Experiments and Analysis.
AFM data were taken as described in ref. 21; see SI Materials and Methods. To determine the work of detachment, we numerically integrated the force versus separation curves from zero separation to the separation at which the force first returned to zero.
SI Materials and Methods
SI Materials and Methods repeats descriptions given in our earlier publication (21).
Bacteria and Media.
Bacteria were streaked from frozen stock onto LB-Miller agar plates (5 g of yeast extract, 10 g of tryptone, 10 g of sodium chloride, and 15 g of agar per L of Millipore water) and incubated at room temperature. Strains with the pCdrA::gfp and pMH487 plasmids were grown with 60 µg/mL Gentamycin for plasmid selection. Single colonies were inoculated into 4 mL of FAB minimal medium (21) with 36 mM disodium succinate as the sole carbon source and incubated at 37 °C in 20-mm glass culture tubes on an orbital shaker (Labnet Orbit 1000) with a 19-mm circular orbit operating at 200–250 rpm. Disodium succinate is added by filter sterilization; medium with succinate is stored at 4 °C for no more than 2 wk before use.
Sample Growth.
We grew the cultures in culture tubes to an optical density at 600 nm (OD600) of 0.3, as measured by a Thermo Spectronic Genesys 20 spectrophotometer. From our growth curve measurements, this corresponds approximately to midexponential growth phase.
Phase-Contrast Microscopy.
We used sterile medium to volumetrically dilute the culture by a factor of either 50,000 or 500,000. We prepared samples for microscopy by placing an adhesive spacer (SecureSeal SS1X13) onto an uncoated glass slide, followed by addition of a few drops of the diluted culture, and covering with a glass coverslip to seal the chamber. Before use, we cleaned the coverslips by 5 min of sonication in a solution of 150 g of potassium hydroxide (KOH) dissolved in 450 mL of ethanol, followed by further sonication and rinsing in deionized water.
The bacteria were imaged using an Olympus IX71 inverted microscope in phase-contrast mode. The microscope stage is enclosed within an incubator chamber heated to 30 °C. This was chosen to slow down bacterial growth and allow for more imaging time at lower cell density than 37 °C. For better spatial resolution, monochromatic green light was used for illumination. We use a 60× oil-immersion objective in combination with an internal 1.6× multiplier that increases the effective magnification. Images were captured with a QImaging EXi Blue CCD camera controlled by a computer running QCapture Pro-6. An exposure time of 0.2 s and a frame rate of one frame per 30 s sufficed to capture most motion of the bacteria on the surface and avoid blurring. Rapidly spinning bacteria were excluded from the analysis. Images were assembled into time-lapse movies using the Fiji distribution of ImageJ software.
Eight time-lapse movies of WT and ∆pel are reported on here. Our experiments began with a single isolated bacterium or a just-divided pair in the field of view. With time, bacterial division and attachment of additional cells caused the number of bacteria in the field of view to increase. The total number of bacteria surveyed per experiment was ∼10–60 over 4–6 h.
Analysis—Phase Contrast.
We tracked and analyzed phase-contrast movies using a version of colloid-tracking software modified to account for elongated particles rather than spherical ones. Tracking output includes center position, velocity, orientation in the focal plane, and the aspect ratio, projected onto the focal plane, of each bacterium. To exclude poorly tracked bacteria, we only consider bacteria tracked for more than 5 min.
As a proxy readout for tilting, we look at the projected aspect ratio in each frame, as we did earlier (21). A newly divided cell lying flat on the surface has an aspect ratio of about 2.5. Therefore, a projected aspect ratio less than 2.5 indicates unambiguously that a cell is tilting. Interpretation of aspect ratios larger than 2.5 is ambiguous, because these cells may be either lying flat or longer cells tilted up. For each cell, we then compute the fraction of its lifetime spent unambiguously tilting, with 1 being unambiguously tilted up for the whole trajectory, and 0, lying flat for the whole trajectory. This computation gives a lower bound on the time a cells spends tilted up, so we likely underestimate the actual time.
Calculation of Shear Stress in Flow Experiments.
Flow was controlled using a Watson Marlow peristaltic pump, allowing us to set the 3D volumetric flow rate (Q*3D). From this, we can calculate the pressure drop per unit length down our channel (49) as follows:
Using our channel dimensions h = 2 mm and w = 4 mm, a 3D flow rate of Q*3D = 0.77 mL/min, and the dynamic viscosity of water μ = 6.9 × 10⁻⁴ Pa⋅s, this value is as follows:
The centerline (x = 0) flow velocity is then as follows:
Integrating y along the height of the channel yields the 2D centerline flow rate (Q*2D):
Gaver and Kute (49) derive an equation for the maximum shear stress as a function of channel dimension and 2D flow rate as follows:
AFM Experiments and Analysis.
We used a Veeco MultiMode Scanning Probe Microscope controlled by a NanoScope IV and PicoForce Control Module (Veeco). We used V-shaped Si3N4 cantilevers with oxide-sharpened tips (Olympus; spring constant of 0.17 N/m). The spring constants of the cantilevers were determined using the thermal-noise technique provided with the instrument software. The AFM cantilever was mounted in a fluid cell probe holder and was prepared as follows: first, the cantilever was immersed in 0.1% poly-l-lysine solution (Sigma) for 45 min; next, the excess liquid was carefully drawn off the probe by wicking with a Kimwipe, and the tip was allowed to dry for 10 min; third, a drop of bacterial culture was placed on the cantilever and allowed to sit for 30 min; finally, the probe was gently rinsed with PBS, leaving a small drop of PBS on the cantilever.
A glass coverslip, precleaned as for the optical microscopy, served as the substrate for force curve measurements, which were performed in PBS. The cantilever tip was repeatedly brought down into contact with the glass substrate, left in contact for some time, and then pulled off, ∼100 times for each experiment (between 74 and 112 usable curves in each experiment). The deflection of the cantilever during retraction was used to measure adhesion. For the data reported here, the AFM probe was moved over a vertical distance of 4 μm, the rate of approach and retraction was 10 μm/s, and the time on the surface was 1 s.
Acknowledgments
We thank Prof. Matthew Parsek (University of Washington) for the gift of the plasmids used in this work and Prof. Marvin Whiteley (The University of Texas at Austin) for the use of his electroporation equipment for plasmid insertion. We thank Prof. Marcelo Behar (The University of Texas at Austin) for discussions about the modeling. This work was supported by startup funds from The University of Texas at Austin and a gift from ExxonMobil (both to V.D.G.). C.A.R. was supported by a Downer–Focht Fellowship from the Department of Physics at The University of Texas at Austin.
Footnotes
The authors declare no conflict of interest.
This article is a PNAS Direct Submission.
This article contains supporting information online at www.pnas.org/lookup/suppl/doi:10.1073/pnas.1703255114/-/DCSupplemental.
References
- 1.Jaalouk DE, Lammerding J. Mechanotransduction gone awry. Nat Rev Mol Cell Biol. 2009;10:63–73. doi: 10.1038/nrm2597. [DOI] [PMC free article] [PubMed] [Google Scholar]
- 2.Iskratsch T, Wolfenson H, Sheetz MP. Appreciating force and shape—the rise of mechanotransduction in cell biology. Nat Rev Mol Cell Biol. 2014;15:825–833. doi: 10.1038/nrm3903. [DOI] [PMC free article] [PubMed] [Google Scholar]
- 3.Persat A, et al. The mechanical world of bacteria. Cell. 2015;161:988–997. doi: 10.1016/j.cell.2015.05.005. [DOI] [PMC free article] [PubMed] [Google Scholar]
- 4.Alsharif G, et al. Host attachment and fluid shear are integrated into a mechanical signal regulating virulence in Escherichia coli O157:H7. Proc Natl Acad Sci USA. 2015;112:5503–5508. doi: 10.1073/pnas.1422986112. [DOI] [PMC free article] [PubMed] [Google Scholar]
- 5.Wolcott R, Dowd S. The role of biofilms: Are we hitting the right target? Plast Reconstr Surg. 2011;127:28S–35S. doi: 10.1097/PRS.0b013e3181fca244. [DOI] [PubMed] [Google Scholar]
- 6.Cotter PA, Stibitz S. c-di-GMP-mediated regulation of virulence and biofilm formation. Curr Opin Microbiol. 2007;10:17–23. doi: 10.1016/j.mib.2006.12.006. [DOI] [PubMed] [Google Scholar]
- 7.Hengge R. Principles of c-di-GMP signalling in bacteria. Nat Rev Microbiol. 2009;7:263–273. doi: 10.1038/nrmicro2109. [DOI] [PubMed] [Google Scholar]
- 8.Gupta K, Liao J, Petrova OE, Cherny KE, Sauer K. Elevated levels of the second messenger c-di-GMP contribute to antimicrobial resistance of Pseudomonas aeruginosa. Mol Microbiol. 2014;92:488–506. doi: 10.1111/mmi.12587. [DOI] [PMC free article] [PubMed] [Google Scholar]
- 9.Valentini M, Filloux A. Biofilms and cyclic di-GMP (c-di-GMP) signaling: Lessons from Pseudomonas aeruginosa and other bacteria. J Biol Chem. 2016;291:12547–12555. doi: 10.1074/jbc.R115.711507. [DOI] [PMC free article] [PubMed] [Google Scholar]
- 10.Otto K, Silhavy TJ. Surface sensing and adhesion of Escherichia coli controlled by the Cpx-signaling pathway. Proc Natl Acad Sci USA. 2002;99:2287–2292. doi: 10.1073/pnas.042521699. [DOI] [PMC free article] [PubMed] [Google Scholar]
- 11.Luo Y, et al. A hierarchical cascade of second messengers regulates Pseudomonas aeruginosa surface behaviors. mBio. 2015;6:e02456-14. doi: 10.1128/mBio.02456-14. [DOI] [PMC free article] [PubMed] [Google Scholar]
- 12.Kuchma SL, et al. cyclic di-GMP-mediated repression of swarming motility by Pseudomonas aeruginosa: The pilY1 gene and its impact on surface-associated behaviors. J Bacteriol. 192:2950–2964. doi: 10.1128/JB.01642-09. [DOI] [PMC free article] [PubMed] [Google Scholar]
- 13.Blanka A, et al. Constitutive production of c-di-GMP is associated with mutations in a variant of Pseudomonas aeruginosa with altered membrane composition. Sci Signal. 2015;8:ra36. doi: 10.1126/scisignal.2005943. [DOI] [PubMed] [Google Scholar]
- 14.Siryaporn A, Kuchma SL, O’Toole GA, Gitai Z. Surface attachment induces Pseudomonas aeruginosa virulence. Proc Natl Acad Sci USA. 2014;111:16860–16865. doi: 10.1073/pnas.1415712111. [DOI] [PMC free article] [PubMed] [Google Scholar]
- 15.Whittaker CA, Hynes RO. Distribution and evolution of von Willebrand/integrin A domains: Widely dispersed domains with roles in cell adhesion and elsewhere. Mol Biol Cell. 2002;13:3369–3387. doi: 10.1091/mbc.E02-05-0259. [DOI] [PMC free article] [PubMed] [Google Scholar]
- 16.Persat A, Inclan YF, Engel JN, Stone HA, Gitai Z. Type IV pili mechanochemically regulate virulence factors in Pseudomonas aeruginosa. Proc Natl Acad Sci USA. 2015;112:7563–7568. doi: 10.1073/pnas.1502025112. [DOI] [PMC free article] [PubMed] [Google Scholar]
- 17.Jin F, Conrad JC, Gibiansky ML, Wong GCL. Bacteria use type-IV pili to slingshot on surfaces. Proc Natl Acad Sci USA. 2011;108:12617–12622. doi: 10.1073/pnas.1105073108. [DOI] [PMC free article] [PubMed] [Google Scholar]
- 18.Skerker JM, Berg HC. Direct observation of extension and retraction of type IV pili. Proc Natl Acad Sci USA. 2001;98:6901–6904. doi: 10.1073/pnas.121171698. [DOI] [PMC free article] [PubMed] [Google Scholar]
- 19.Purcell EB, McKee RW, Bordeleau E, Burrus V, Tamayo R. Regulation of type IV pili contributes to surface behaviors of historical and epidemic strains of Clostridium difficile. J Bacteriol. 2016;198:565–577. doi: 10.1128/JB.00816-15. [DOI] [PMC free article] [PubMed] [Google Scholar]
- 20.Cooley B, et al. Asymmetry and inequity in the inheritance of a bacterial adhesive. New J Phys. 2016;18:045019. [Google Scholar]
- 21.Cooley BJ, et al. The extracellular polysaccharide Pel makes the attachment of P. aeruginosa to surfaces symmetric and short-ranged. Soft Matter. 2013;9:3871–3876. doi: 10.1039/C3SM27638D. [DOI] [PMC free article] [PubMed] [Google Scholar]
- 22.Ma L, et al. Assembly and development of the Pseudomonas aeruginosa biofilm matrix. PLoS Pathog. 2009;5:e1000354. doi: 10.1371/journal.ppat.1000354. [DOI] [PMC free article] [PubMed] [Google Scholar]
- 23.Irie Y, et al. Self-produced exopolysaccharide is a signal that stimulates biofilm formation in Pseudomonas aeruginosa. Proc Natl Acad Sci USA. 2012;109:20632–20636. doi: 10.1073/pnas.1217993109. [DOI] [PMC free article] [PubMed] [Google Scholar]
- 24.Hickman JW, Tifrea DF, Harwood CS. A chemosensory system that regulates biofilm formation through modulation of cyclic diguanylate levels. Proc Natl Acad Sci USA. 2005;102:14422–14427. doi: 10.1073/pnas.0507170102. [DOI] [PMC free article] [PubMed] [Google Scholar]
- 25.Rybtke MT, et al. Fluorescence-based reporter for gauging cyclic di-GMP levels in Pseudomonas aeruginosa. Appl Environ Microbiol. 2012;78:5060–5069. doi: 10.1128/AEM.00414-12. [DOI] [PMC free article] [PubMed] [Google Scholar]
- 26.Golding I, Paulsson J, Zawilski SM, Cox EC. Real-time kinetics of gene activity in individual bacteria. Cell. 2005;123:1025–1036. doi: 10.1016/j.cell.2005.09.031. [DOI] [PubMed] [Google Scholar]
- 27.Gibiansky ML, et al. Bacteria use type IV pili to walk upright and detach from surfaces. Science. 2010;330:197. doi: 10.1126/science.1194238. [DOI] [PubMed] [Google Scholar]
- 28.Maier B, et al. Single pilus motor forces exceed 100 pN. Proc Natl Acad Sci USA. 2002;99:16012–16017. doi: 10.1073/pnas.242523299. [DOI] [PMC free article] [PubMed] [Google Scholar]
- 29.Touhami A, Jericho MH, Boyd JM, Beveridge TJ. Nanoscale characterization and determination of adhesion forces of Pseudomonas aeruginosa pili by using atomic force microscopy. J Bacteriol. 2006;188:370–377. doi: 10.1128/JB.188.2.370-377.2006. [DOI] [PMC free article] [PubMed] [Google Scholar]
- 30.Sabass B, Stone HA, Shaevitz JW. 2017. Collective force generation by groups of migrating bacteria. arXiv:1701.00524.
- 31.Chang Y-W, et al. Architecture of the type IVa pilus machine. Science. 2016;351:aad2001. doi: 10.1126/science.aad2001. [DOI] [PMC free article] [PubMed] [Google Scholar]
- 32.Christen M, et al. Asymmetrical distribution of the second messenger c-di-GMP upon bacterial cell division. Science. 2010;328:1295–1297. doi: 10.1126/science.1188658. [DOI] [PMC free article] [PubMed] [Google Scholar]
- 33.Yang L, et al. Distinct roles of extracellular polymeric substances in Pseudomonas aeruginosa biofilm development. Environ Microbiol. 2011;13:1705–1717. doi: 10.1111/j.1462-2920.2011.02503.x. [DOI] [PubMed] [Google Scholar]
- 34.Araujo P, et al. Influence of flow velocity on the characteristics of Pseudomonas fluorescens biofilms. J Environ Eng. 2016;142:04016031. [Google Scholar]
- 35.Lemos M, Mergulhao F, Melo L, Simoes M. The effect of shear stress on the formation and removal of Bacillus cereus biofilms. Food Bioprod Process. 2015;93:242–248. [Google Scholar]
- 36.Stewart PS, Franklin MJ. Physiological heterogeneity in biofilms. Nat Rev Microbiol. 2008;6:199–210. doi: 10.1038/nrmicro1838. [DOI] [PubMed] [Google Scholar]
- 37.Smits WK, Kuipers OP, Veening J-W. Phenotypic variation in bacteria: The role of feedback regulation. Nat Rev Microbiol. 2006;4:259–271. doi: 10.1038/nrmicro1381. [DOI] [PubMed] [Google Scholar]
- 38.Whitfield JF. The solitary (primary) cilium—a mechanosensory toggle switch in bone and cartilage cells. Cell Signal. 2008;20:1019–1024. doi: 10.1016/j.cellsig.2007.12.001. [DOI] [PubMed] [Google Scholar]
- 39.Gardner TS, Cantor CR, Collins JJ. Construction of a genetic toggle switch in Escherichia coli. Nature. 2000;403:339–342. doi: 10.1038/35002131. [DOI] [PubMed] [Google Scholar]
- 40.Espinar L, Dies M, Çağatay T, Süel GM, Garcia-Ojalvo J. Circuit-level input integration in bacterial gene regulation. Proc Natl Acad Sci USA. 2013;110:7091–7096. doi: 10.1073/pnas.1216091110. [DOI] [PMC free article] [PubMed] [Google Scholar]
- 41.Tian T, Burrage K. Stochastic models for regulatory networks of the genetic toggle switch. Proc Natl Acad Sci USA. 2006;103:8372–8377. doi: 10.1073/pnas.0507818103. [DOI] [PMC free article] [PubMed] [Google Scholar]
- 42.Li J, et al. Residence-time dependent cell wall deformation of different Staphylococcus aureus strains on gold measured using surface-enhanced-fluorescence. Soft Matter. 2014;10:7638–7646. doi: 10.1039/c4sm00584h. [DOI] [PubMed] [Google Scholar]
- 43.Salwiczek M, et al. Emerging rules for effective antimicrobial coatings. Trends Biotechnol. 2014;32:82–90. doi: 10.1016/j.tibtech.2013.09.008. [DOI] [PubMed] [Google Scholar]
- 44.Graham M, Cady N. Nano and microscale topographies for the prevention of bacterial surface fouling. Coatings. 2014;4:37–59. [Google Scholar]
- 45.MacCallum N, et al. Liquid-infused silicone as a biofouling-free medical material. ACS Biomater Sci Eng. 2015;1:43–51. doi: 10.1021/ab5000578. [DOI] [PubMed] [Google Scholar]
- 46.Herbert-Guillou D, Tribollet B, Festy D. Influence of the hydrodynamics on the biofilm formation by mass transport analysis. Bioelectrochemistry. 2001;53:119–125. doi: 10.1016/s0302-4598(00)00121-5. [DOI] [PubMed] [Google Scholar]
- 47.Jacobs MA, et al. Comprehensive transposon mutant library of Pseudomonas aeruginosa. Proc Natl Acad Sci USA. 2003;100:14339–14344. doi: 10.1073/pnas.2036282100. [DOI] [PMC free article] [PubMed] [Google Scholar]
- 48.Schindelin J, et al. Fiji: An open-source platform for biological-image analysis. Nat Methods. 2012;9:676–682. doi: 10.1038/nmeth.2019. [DOI] [PMC free article] [PubMed] [Google Scholar]
- 49.Gaver DP, III, Kute SM. A theoretical model study of the influence of fluid stresses on a cell adhering to a microchannel wall. Biophys J. 1998;75:721–733. doi: 10.1016/S0006-3495(98)77562-9. [DOI] [PMC free article] [PubMed] [Google Scholar]
- 50.Hoops S, et al. COPASI—a COmplex PAthway SImulator. Bioinformatics. 2006;22:3067–3074. doi: 10.1093/bioinformatics/btl485. [DOI] [PubMed] [Google Scholar]
- 51.Petzold L. Automatic selection of methods for solving stiff and nonstiff systems of ordinary differential equations. SIAM J Sci Statist Comput. 1983;4:136–148. [Google Scholar]


