Significance
How bacteria propagate and colonize new environments is of paramount importance, e.g., to food processing, transport, and storage. In this article, we show that Bacillus subtilis can turn millimetric water droplets into vehicles to quickly cover large distances. To this end, they overcome the enormous capillary forces that prevent the sliding of water droplets even on vertical surfaces such as refrigerator walls. B. subtilis does so by actively unpinning the surrounding liquid to cause the collective surfing of the entire community on slopes as small as 0.1°. We show this depinning to rely on a variety of mechanisms, which could each be relevant to the motility of microorganisms in partially humid environments such as unsaturated soils.
Keywords: wetting, bacterial motility, collective motion
Abstract
How systems are endowed with migration capacity is a fascinating question with implications ranging from the design of novel active systems to the control of microbial populations. Bacteria, which can be found in a variety of environments, have developed among the richest set of locomotion mechanisms both at the microscopic and collective levels. Here, we uncover, experimentally, a mode of collective bacterial motility in humid environment through the depinning of bacterial droplets. Although capillary forces are notoriously enormous at the bacterial scale, even capable of pinning water droplets of millimetric size on inclined surfaces, we show that bacteria are able to harness a variety of mechanisms to unpin contact lines, hence inducing a collective slipping of the colony across the surface. Contrary to flagella-dependent migration modes like swarming, we show that this much faster “colony surfing” still occurs in mutant strains of Bacillus subtilis lacking flagella. The active unpinning seen in our experiments relies on a variety of microscopic mechanisms, which could each play an important role in the migration of microorganisms in humid environment.
Collective behaviors in bacterial colonies, from swarming and bacterial turbulence (1) to biofilm (2, 3) and pattern formation (4–7), are among the most fascinating problems at the crossroads of biology, chemistry, and physics. They raise fundamental questions, such as concerning the emergence of complex behaviors from simple microscopic dynamics, and are of practical importance due to their medical impact (8). Thanks to studies carried out in simplified, controlled environments, much is known about the swimming of bacteria in 3D fluids (9). A lot of effort has thus been devoted over the past few years to the study of bacterial motion in more complex environments, in particular, near interfaces (10–12).
A prototypical case study is the spreading of Bacillus subtilis colonies on the surface of agar gels (13, 14). By changing the nutrient and agar concentrations, very diverse colony morphologies are observed, ranging from simple diffusive spreading to the formation of fractal dendritic structures. The motion of bacteria on hard gel substrates vividly differs from the unconstrained swimming in liquid: Isolated bacteria, indeed, cannot move on agar gels, because their propulsion forces are much weaker than the capillary forces they experience from the surrounding liquid film. Colony migration remains possible but relies on cooperativity to overcome pinning, as in the dense mass swarming that many bacteria exhibit (15, 16).
The importance of capillary forces at small scales is familiar to us all from the observation of glass windows after the rain, or the walls of a fridge or cold storage facility, on which small drops remain stuck. A drop can, indeed, only slide when the driving gravitational force overcomes the capillary pinning force. Similarly, small water drops of, say, 2 L remain stuck at the surface of an agar gel, at any tilt angle. Here we show that bacteria are able to unpin such droplets, leading, in practice, to the collective “surfing” of the entire colony. Surprisingly, this happens on slopes as small as 0.1°, commonly encountered on any generic surface, and leads to migration speeds well above that of mass swarming.
Results
Active Depinning of Bacterial Droplets.
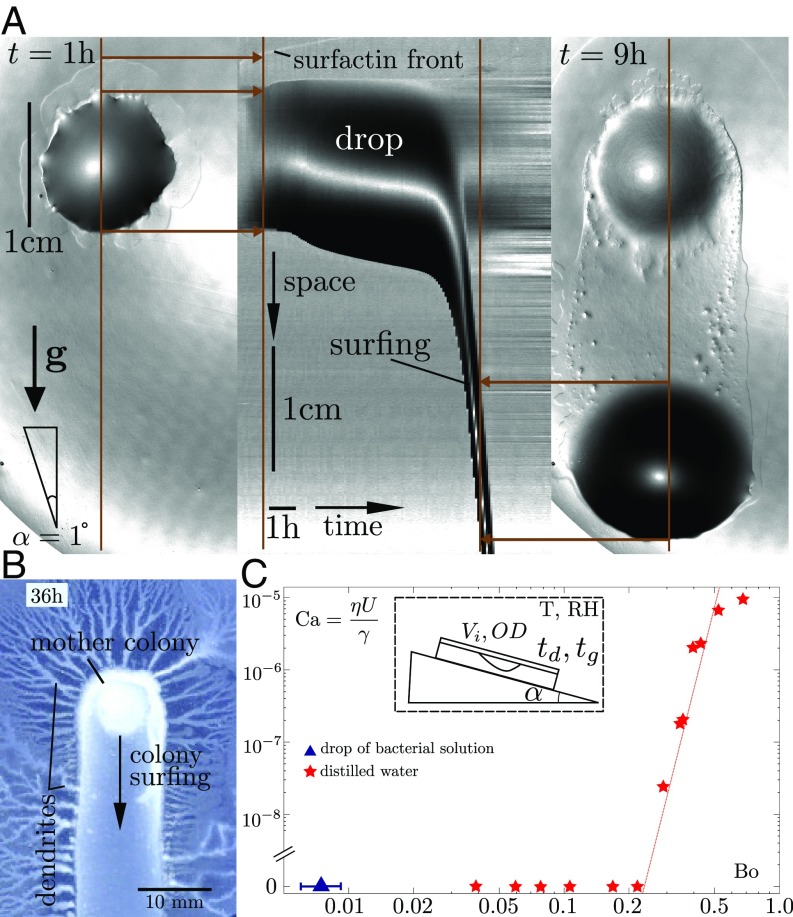
A 2 L drop of a suspension of B. subtilis grown to an optical density is deposited on top of a 0.7% agar gel substrate with nutrients and incubated in a climate chamber at fixed temperature and relative humidity (RH) (T = 30 °C, RH = 70%; see Materials and Methods). Fig. 1A and Movie S1 show the typical evolution of the drop for a gel surface inclination of . During the first hour, the drop exhibits a slight isotropic spreading, typical of aqueous surfactant solutions on hydrogels (17, 18) and expected because our B. subtilis strain is known to produce surfactin, a cyclic lipopeptide that strongly reduces surface tension (19, 20). The surfactant also causes some swelling of the gel as it spreads outward, producing a visible “surfactant ring” (SR) (21) that grows radially. Around 7 h after deposition, however, the drop starts sliding in the direction of inclination. Bacteria move along with the drop as it slides, hence the name “colony surfing.” The drop velocity rapidly increases to reach 1.5 cm h−1, almost an order of magnitude larger than the speed of swarming of our B. subtilis strain on flat gels. This surfing motion persists at roughly constant drop diameter and velocity until the drop reaches the rim of the Petri dish. Interestingly, bacteria continuously exit from the drop as it slides, so that they rapidly colonize the whole drop trajectory and its surroundings (Fig. 1B).
Fig. 1.
(A) Top view of colony surfing, where gray levels indicate the local slope. (Left) A drop is still immobile at after its deposition. (Middle) The onset of slipping motion at is visible on the kymograph, which represents the time evolution of a cut through the drop along the direction of motion (brown line). (Right) The gel remains swollen around the point of deposition (upper dark region). (B) Thirty-six hours after deposition, the bacteria that have been carried by the sliding drop have invaded the whole drop trajectory and its surroundings. (C) Dimensionless velocity vs gravitational pull of water drops, measured by their Capillary and Bond numbers (red stars). The initial Bond number of the bacteria-laden drop shown in A (0.003, blue triangle) is orders of magnitude below the critical Bond number at which water drops start sliding.
The mobility of the bacteria-laden drops is striking compared with droplets of water or pure nutrient solution. Water droplets, indeed, only start sliding on slopes 2 orders of magnitude larger than bacterial droplets of the same volume. This discrepancy is best quantified using the ratio of gravitational to capillary forces, using the so-called Bond number
| [1] |
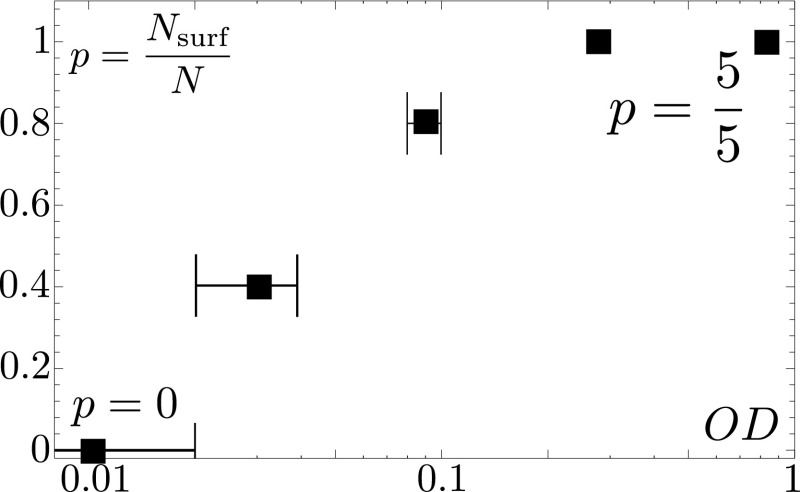
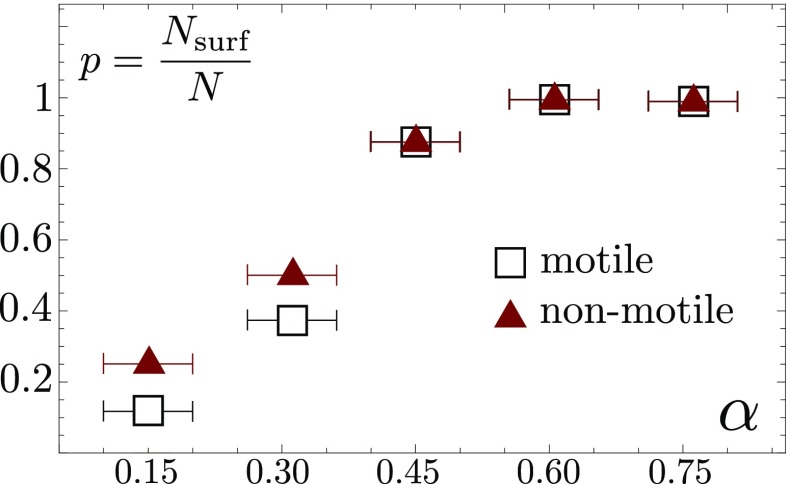
where and are the drop mass and typical width, is the effective gravity, and is the surface tension. We always observe the sliding of bacteria-laden droplets with an initial Bond number of , whereas water drops only start sliding for Bond numbers larger than (Fig. 1C). The transition from an immobile water drop to a sliding bacteria-laden one occurs continuously as the initial concentration of bacteria is varied (Fig. 2). We never observe colony surfing for bacterial densities below a threshold of within the first 12 h of recording. The surfactin ring is still observable, but its formation is delayed by several hours. For higher concentrations, the probability of colony surfing increases, and was observed in five out of five runs for ODs above .
Fig. 2.
Fraction of colony surfing events for different bacterial concentrations in the deposited drop. Out of five experiments, none show surfing for initial optical densities below , whereas surfing always occurs at and above.
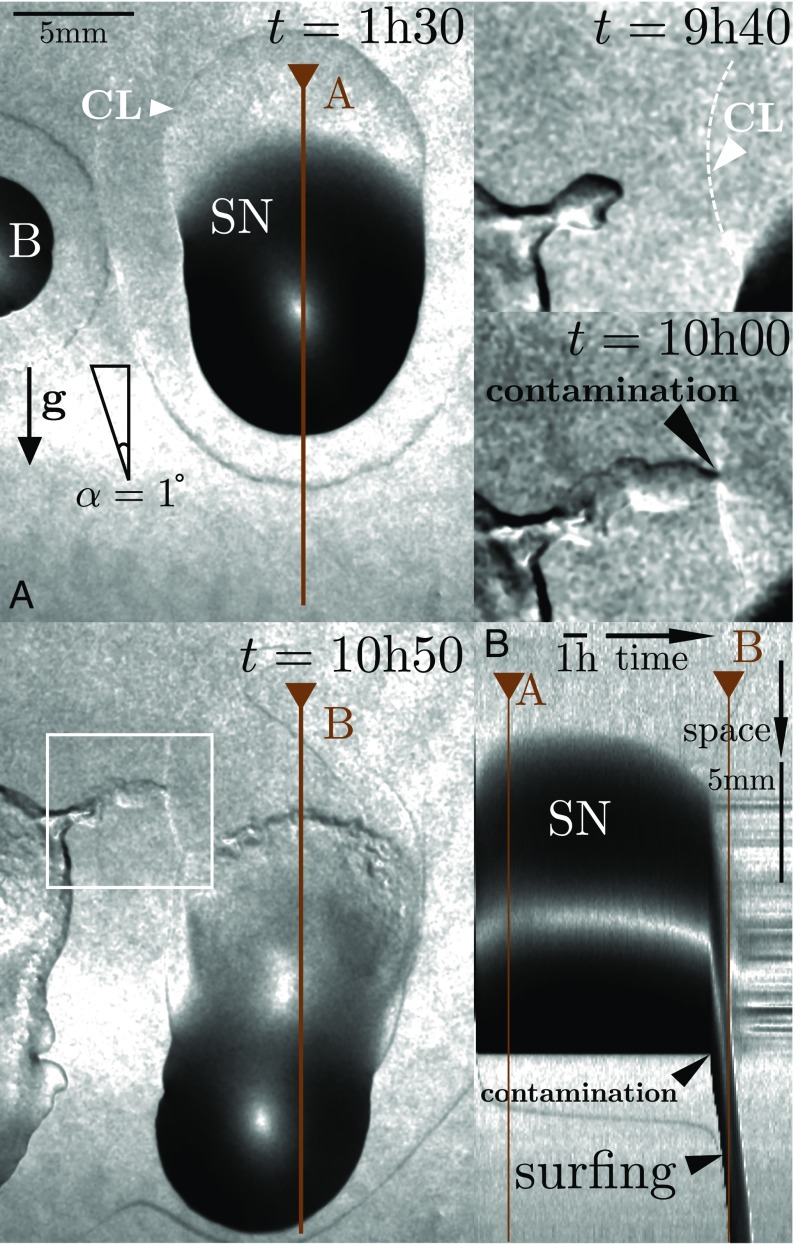
The bacterial medium does not contain solely bacteria but also nutrients and bacterial products, including in particular surfactin and exopolysaccharides. To test whether the colony surfing is really due to bacteria, we remove them from an suspension by centrifugation and filtration, and start experiments where two drops, with and without bacteria, are deposited side by side (Fig. 3 and Movie S2). Although the drop containing bacteria starts sliding after 8 h, the bacteria-free drop initially remains immobile. After 10 h, a small dendrite of bacteria contaminates the second drop, which starts sliding almost immediately (the time resolution is given by the 5-min interval at which images are taken). The contamination experiment highlights the role played by bacteria in our setup. Note that contamination can also induce slipping of pure water droplets (Fig. S1 and Movie S3).
Fig. 3.
(A) Snapshots of induced colony surfing, where the gray level indicates the local slope. Two drops are deposited side by side. From the right drop, the bacteria were removed by centrifugation and filtration. The bacteria-laden drop (B, 1 L) starts sliding after 8 h, whereas the drop containing only supernatant (SN, 10 L) remains immobile despite its much larger volume. The magnified details at the top right (white rectangle) show how, at , a dendrite of swarming bacteria contaminates the immobile drop (white arrow marks contact line CL), which starts sliding almost instantaneously. (B) Kymograph of a longitudinal cut through the SN drop, showing the very sudden onset of motion of the drop of supernatant after its contamination; see Movie S2.
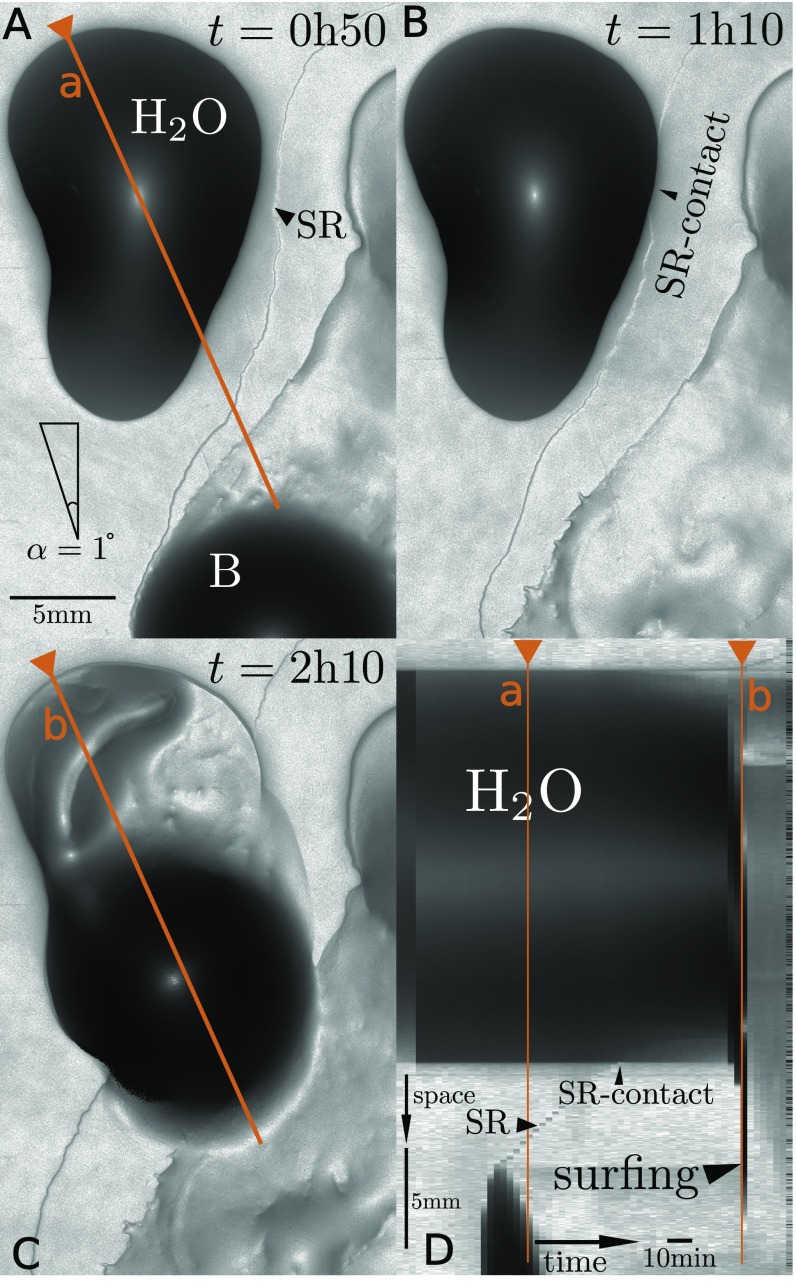
Fig. S1.
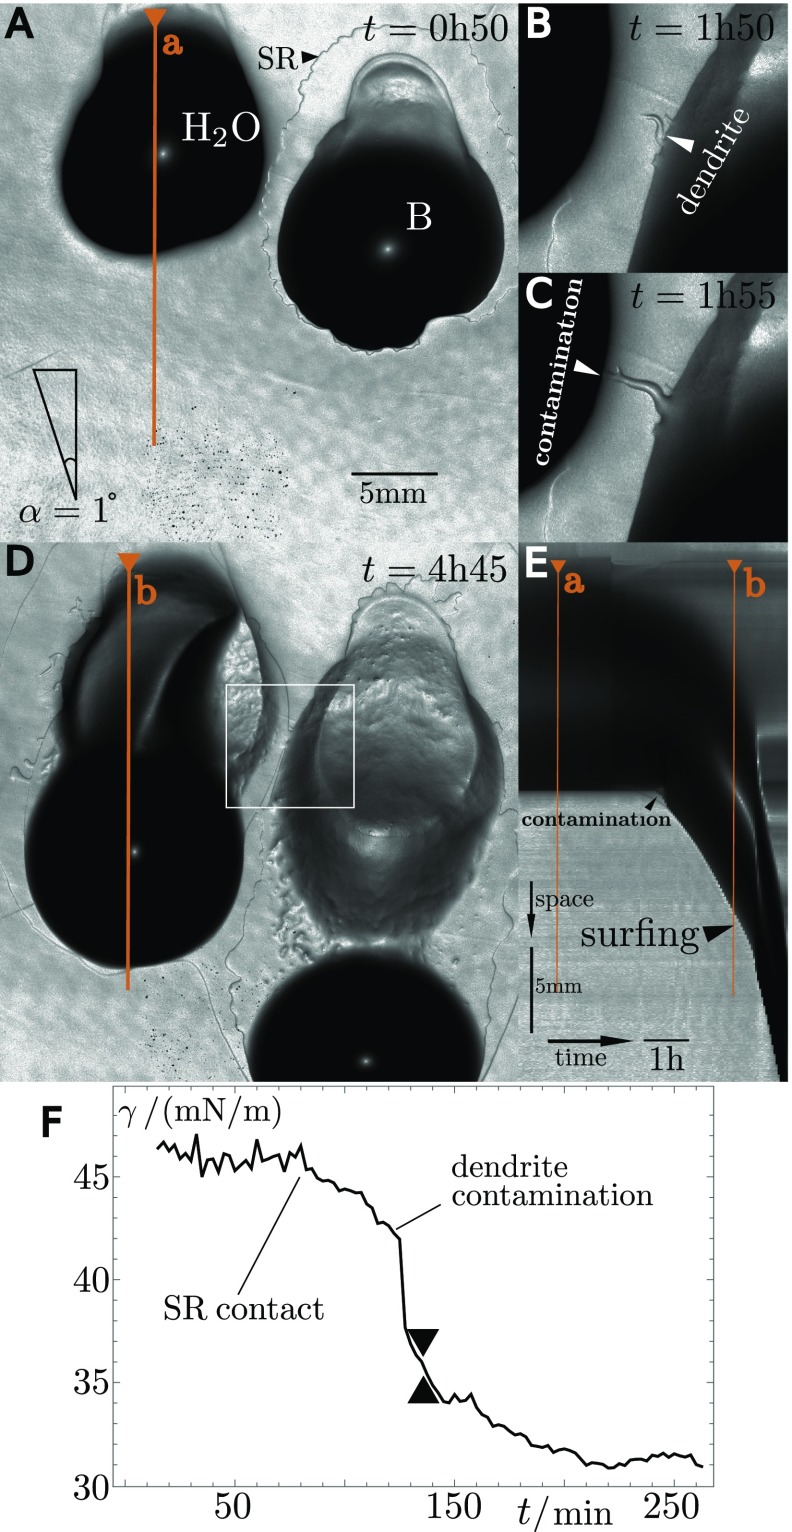
(A–D) Snapshots of induced colony surfing, where the gray level indicates the local slope. The right drop is a 30-L drop of bacterial suspension (), and the left drop is 50 L of distilled water. The water drop starts to slide upon being contaminated by a dendrite of swarming bacteria (detail at min, white rectangle region). (E) Kymograph of a cut through the water drop along the direction of motion showing the onset of sliding immediately after the contamination (black triangle). (F) Surface tension of the water drop. The surface tension starts decreasing from the moment the drop is reached by the surfactin ring, indicative of surfactant molecules populating the interface. A much sharper decrease is associated with the contamination of the drop by a dendrite of migrating bacteria.
The Role of Bacterial Propelling Forces.
The depinning of the contact line (drop perimeter) arises when driving forces exceed the capillary forces. A natural explanation of the depinning of the contact line could thus be an extra contribution to the driving force due to bacterial motion (22): The self-propelling forces combined with gravity could, together, overcome the pinning force. Active forces are also known to accelerate the relaxation of polymer networks (23), which could affect the bulk rheology of the droplet itself, modify the dynamics of gel polymer desorption near the contact line, or accelerate the viscoplastic stress relaxation in its vicinity, hence affecting the contact line mobility (24, 25). Finally, active swimming strongly enhances transport and mixing within the droplet, notably of nutrients and oxygen (26), which could facilitate the collective surfing of motile colonies in comparison with nonmotile ones. To determine whether bacterial motility has an impact on colony sliding, we compared the surfing likelihood of a motile and a nonmotile strain. The strains differ only in the deletion of the hag gene coding for flagellin, the protein subunit required for the assembly of the flagella. As shown in Fig. 4, the fraction of surfing events is similar for both strains, showing that the collective colony surfing does not require individual motility. The sole alternatives are thus a decrease of capillary forces or an increase of the gravitational pull.
Fig. 4.
Fraction of colony surfing events , out of runs for each data point, for drops (initial ) of a motile (SSB 1071) and nonmotile (OMG 954) strain at different gel inclinations. The two strains show no statistically significant difference. The uncertainty of the tilt angle measurement is estimated to .
Volume Increase of Bacterial Droplet.
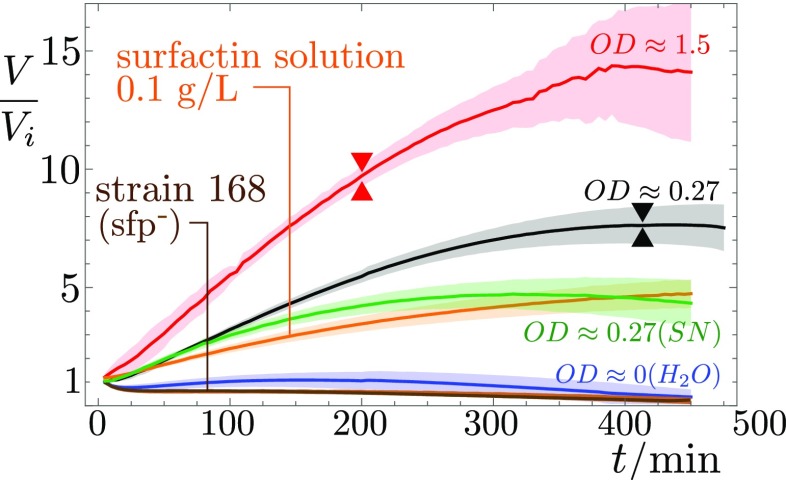
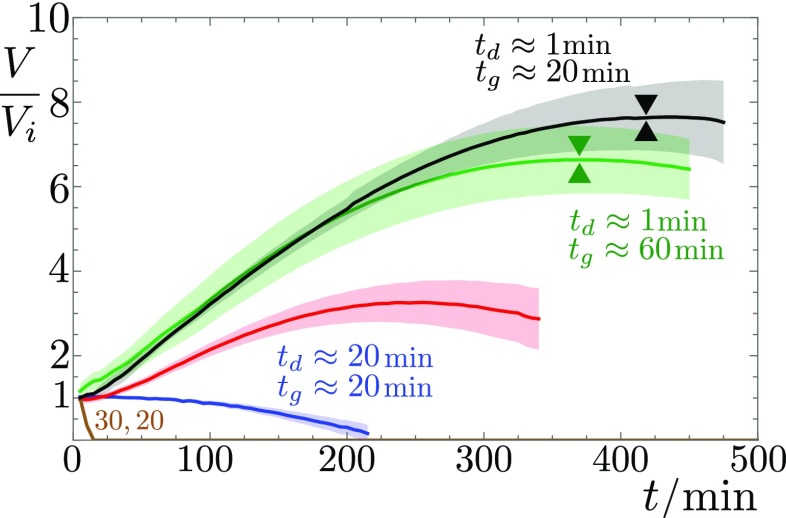
As surprising as it may sound, bacteria are indeed able to increase the gravitational pull exerted on the surrounding droplet, by pumping water out of the environment. We show, in Fig. 5, the evolution of the drop volume, measured by means of a Moiré fringe deformation method (Materials and Methods). Drops with a high density of bacteria show a strong volume increase before colony surfing. For the 2-L drop of described above, the volume grows monotonically for the first 5 h to 6 h to reach around 8 times its initial value, at which point the drop starts sliding. For a higher initial concentration, , the drop shows a quicker volume increase, reaching a volume 15 times its initial value and starts sliding much earlier (3.5 h after deposition).
Fig. 5.
Relative volume change of deposited drops of bacteria, SN, solutions of commercial surfactin, and pure water, with respect to their deposited volume . Higher bacterial optical densities at deposition result in stronger volume increase, likely because the surfactant production rate is higher. Removing the bacteria through centrifugation from an suspension and filtration just before deposition (SN) does not affect the initial volume growth rate, but the subsequent evolution differs from the bacterial suspension (green vs. black curves). Pure surfactin–water drops also cause a volume increase, whereas no volume increase is measured for drops of pure water, nor for the non-surfactin-producing strain 168. The onset of surfing—if it occurs—is marked by double triangles. Solid lines stem from averaging over several experiments; the corresponding SD is indicated by shaded areas.
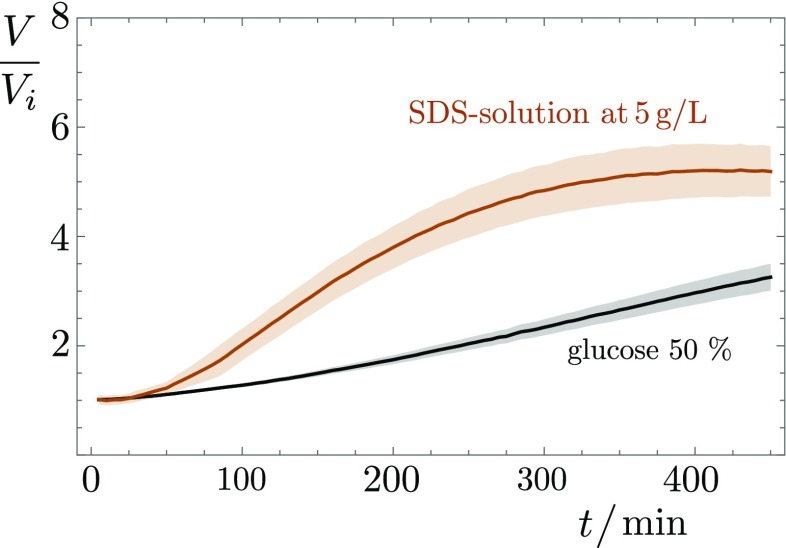
The volume increase of pure water drops without bacteria in the same conditions is nil or negligible. On the other hand, droplets of an suspension from which bacteria are removed through centrifugation and filtration still show a significant volume increase. At this stage, the supernatant solution already contains large amounts of surfactin (Fig. S2 and Table S1), along with other products, including exopolysaccharides and, of course, nutrients. A possible explanation is that the concentration gradients of chemicals produced by bacteria generate inward osmotic flows. This hypothesis is validated by the fact that drops of aqueous solution containing either pure surfactin or the anionic surfactant SDS (Fig. S3) grow to 4 to 8 times their initial volume within a 4- to 7-h period. We believe surfactin to be the main cause of these osmotic flows because the strain 168 lacking surfactin synthesis, because of a frameshift mutation in the sfp gene, is never seen to produce colony surfing at any OD, and the corresponding deposited drops do not significantly inflate (brown line in Fig. 5). This absence of volume increase also highlights the negligible role of cell division in this process. The density of bacteria indeed remains very low throughout the experiment, as we confirmed by direct measurement (Fig. S4). Note, however, that this osmotic growth is not limited to surfactants: A drop containing simply 50% glucose also undergoes a similar volume increase (Fig. S3), suggesting that this active pumping of water from the environment could be seen beyond the sole case of surfactant-producing bacteria reported here.
Fig. S2.
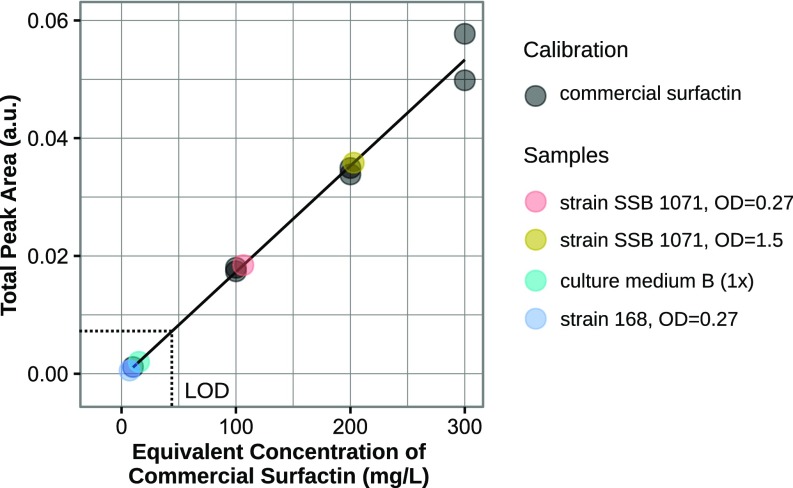
Total surfactin-correlated peak intensity vs. commercial surfactin concentration calibration plot (Materials and Methods).
Table S1.
Surfactin concentration estimation from HPLC measurements
| Equivalent commercial concentration | |
| Sample | (90% confidence limits), mg/L |
| Strain SSB 1071, OD = 0.27 | 106(32) |
| Strain SSB 1071, OD = 1.5 | 202(32) |
| B(1×), culture medium | 44 ppm (below LOD) |
| Strain 168, OD = 0.27 | 44 ppm (below LOD) |
Fig. S3.
Evolution of the volume of a glucose (50% vol/vol) and an SDS (5 g/L) drop at the gel surface after deposition at . The middle line in saturated color is the mean over several runs, with the SD being shown as shaded bands around the mean.
Fig. S4.
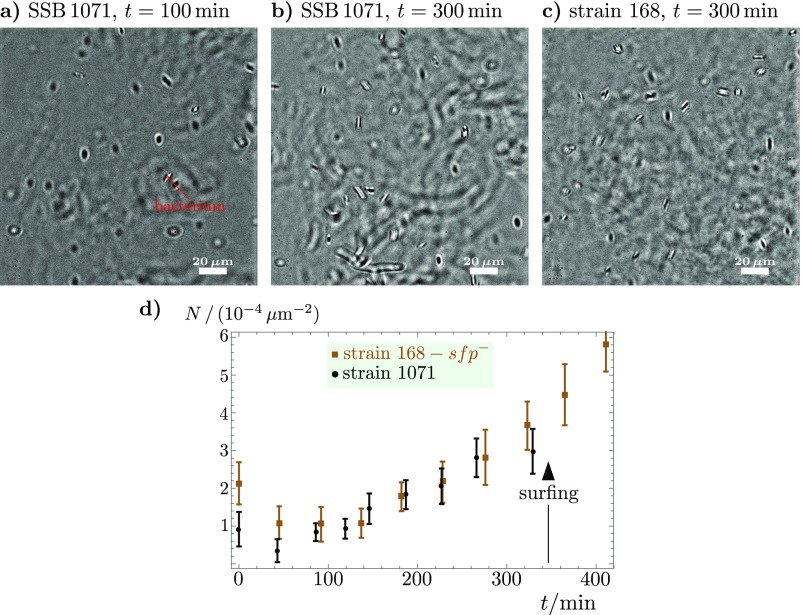
Monitoring the bacterial concentration in sessile droplets (initially: , ) on agar (0.7%, B medium, , RH = 90%) before colony surfing shows that the suspension remains dilute over the course of the experiment. (A–C) Microscope images at 40× magnification, focused at midheight in the drop (). The depth of field is of the order of 1 m. The bacterial concentration within the droplet remains very dilute even at for both strains 168 and SSB 1071. (D) Mean density of bacteria in a slab such as shown in A–C, averaged across the droplet’s height, i.e., over ≃15 to ≃20 slabs—depending on the droplet growth—recorded every 14 m, from top to bottom. The thickness of a slab is set by the depth of field, . No major increase in bacterial density is observed. Note that only strain SSB 1071 undergoes colony surfing (at ).
Finally, note that evaporation limits the time window for colony surfing in our setup. Indeed, under the 70% relative humidity in the climate chamber commonly used in swarming experiments, the gel slowly evaporates at a rate of about Lhcm−2, as measured by weighing over a duration of 72 h. As time goes on, concentration gradients decrease as the surfactin molecules diffuse in the gel, so that the inward osmotic flow decreases. Evaporation will eventually dominate, so that a drop only reaches a high enough Bond number and slides if its volume increase occurs within the first few hours of the experiment. Similarly, letting the gel dry in open air before the experiment makes it more difficult for bacteria to extract water out of the gel, hence limiting the overall volume increase of deposited drops (Fig. S5). This limitation probably explains why the active unpinning of bacterial droplets has never been reported before. On the contrary, no time limit should apply to colony surfing in saturated atmosphere, e.g., in the presence of a nearby water reservoir or in partially soaked porous media.
Fig. S5.
Impact of gelling and drying time on the inflation of deposited drops (, ) measured by the relative volume increase . On gels dried for 10 min, the volume gain remains well below 4, half of the maximum volume gain for the shortest drying times. For drying times larger than about 20 min, the volume of deposited drops monotonically decreases. A longer gelling time (tripled from 20 min to 60 min), in turn, has no significant effect on the evolution of deposited drops. Centerlines in saturated colors represent the mean value of a series of measurements, with the shaded regions around the curves indicating the SD. Triangles mark the onset of colony surfing.
The volume increase of the droplet generates a proportional increase of gravitational pull, whereas capillary pinning forces increase only with the contact line length, which scales as . The overall effect of the volume increase is thus to facilitate colony surfing by increasing the Bond number.
Lowering of the Surface Tension.
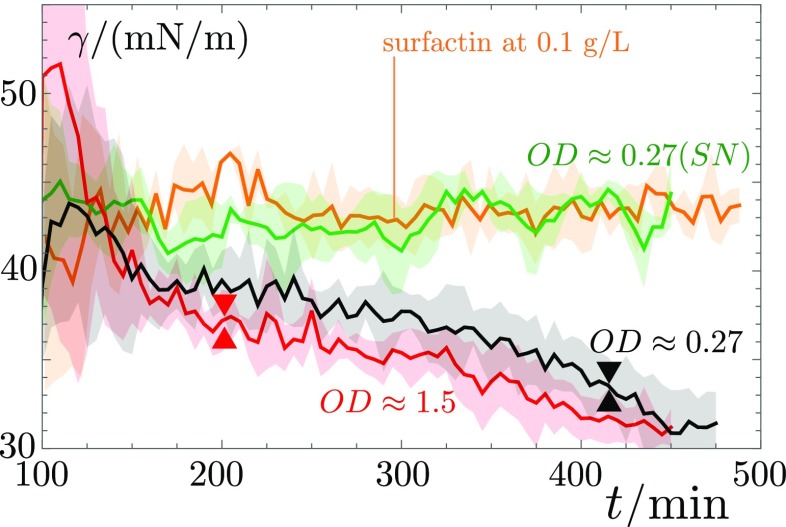
The second mechanism that B. subtilis is able to harness directly impacts the capillary forces through a surfactant-induced reduction of surface tension. Thanks to the precision of our profilometric data, we can extract the curvature of the drops at different heights and infer the drop’s surface tension in situ during the experiment. Measurements performed on the 2 L drop on a 1° slope show that the constantly produced surfactin molecules lower the drop’s surface tension by almost a factor of 2 (Fig. 6). This decrease of surface tension generates a further increase of the Bond number (Eq. 1) by a similar factor.
Fig. 6.
The surface tension decreases monotonically over the whole duration of the experiment for drops containing surfactin-producing bacteria. This decrease is not affected by the onset of colony surfing at for the drop of initial , for (triangles). By contrast, if the bacterial suspension is centrifuged and only the supernatant is deposited on the gel, the surface tension quickly becomes constant after the initial decrease due to the surfactin produced before the removal of the bacteria. A similar trend is observed for drops containing only commercial surfactin.
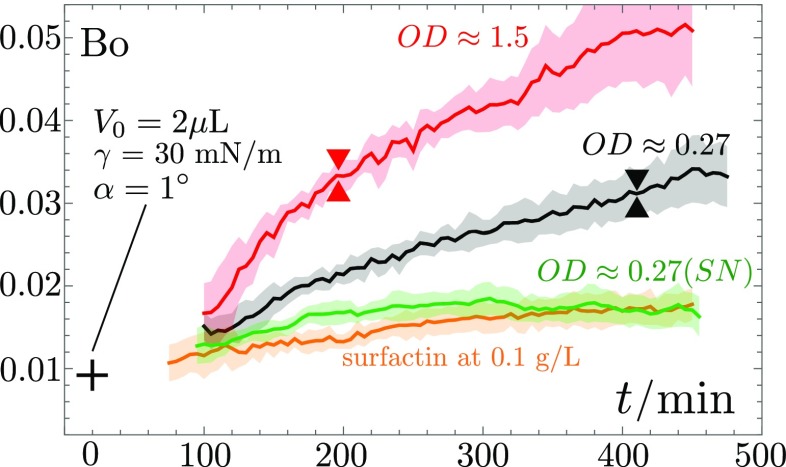
We show, in Fig. 7, the overall variation of the Bond number of 2-L drops with different initial concentrations of bacteria. The Bond number increases significantly over time for high initial optical densities, or higher, reaching about 10 times its initial value. Colony surfing (onset marked by triangle symbols in Fig. 7) is observed for a threshold value of , a value that is never reached by the supernatant solution or drops showing even less volume increase. This establishes a relation between the surfactin production, volume increase, and the possibility of gravitationally driven onset of motion. Note, however, that the Bond number at which colony surfing is seen remains 1 order of magnitude below the critical Bond number of water, which shows that the volume increase and the reduction of surface tension are only part of the toolkit available to B. subtilis for depinning its containing drop.
Fig. 7.
The Bond number calculated using the measured volume and surface tension (Figs. 5 and 6) exhibits a monotonically increase for surfactin-producing strains, with a critical value for the onset of surfing (triangles) at . The SN solution, from an suspension, and the commercial surfactin droplets (0.1 g L−1) do not reach this value, and no surfing is observed.
Enhancing the Substrate Wettability.
Indeed, the production of surfactin also strongly enhances the wettability of the agar gel. The SR extending around drops containing surfactants marks the outer limit of the region of enhanced wettability (Figs. 1 and 3). Within the SR, contact angles of deposited water drops are dramatically lowered (27). Indeed, when we place a large drop of water (30 L), whose Bond number is below , next to a colony of nonmotile, surfactin-producing bacteria (strain OMG 954), the water drop first remains immobile. When reached by the SR, however, it starts sliding in the region of larger wettability (Fig. S6 and Movie S4).
Fig. S6.
(A–C) Snapshots of induced colony surfing, where the gray level indicates the local slope. The right drop is a 30-L drop of bacterial suspension (), and the left drop is 30 L of distilled water. The water drops starts to slide some time after the SR issued by the bacteria-laden drop reaches it, min. (D) Kymograph of a cut through the water drop along the direction of motion showing the sudden onset of sliding around 40 min after contact with the SR.
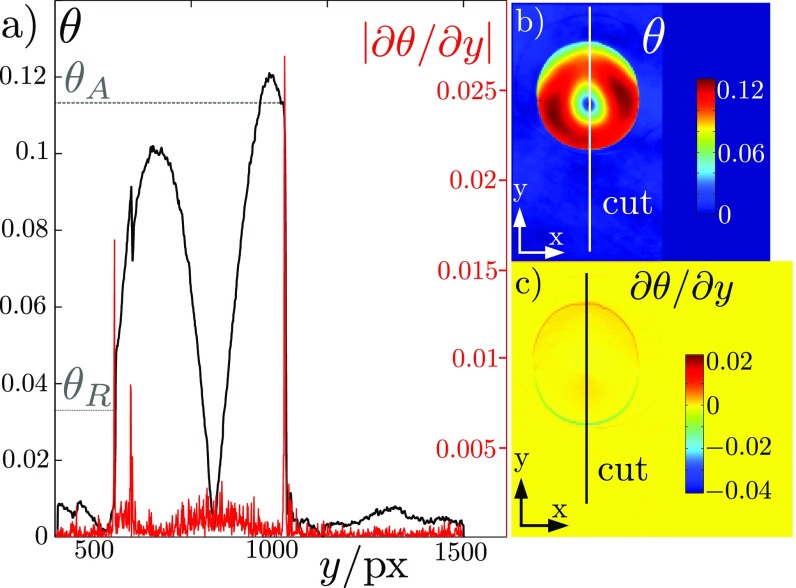
To quantify the capacity of the agar gel surface to pin drops, we extracted the advancing and receding contact angles of sliding bacterial drops from our profilometric data. For a drop, of width , we obtain and , corresponding to a slope of 0.114 and 0.033, respectively (Fig. S7). The capillary pinning force that opposes the gravitational pull is directly proportional to . Drop sliding is thus only possible when the gravitational pull overcomes a critical value (28),
| [2] |
Eq. 2 is equivalent to saying that the critical Bond number is , which is very close to the measured Bond number at which colony surfing is observed in our experiments (Fig. 7). This third mechanism thus concludes our discussion on the depinning of B. subtilis droplets seen in our experiments, by providing a quantitative match with the corresponding critical Bond number.
Fig. S7.
Local contact line position and angles for a drop at the onset of colony surfing (corresponding to Fig. 1). (A) The advancing and receding contact angles are determined as the intersection of the linear extrapolation of the free surface slope with the position of the contact line given by the local maxima of the red curve. Here . (B and C) Snapshot of the local angle of (B) the free drop surface and (C) its derivative (top view).
Surfactin Drops.
To test more quantitatively the role of surfactin, we quantified its concentration in the supernatant of bacterial suspensions through High Performance Liquid Chromatography (HPLC; see Materials and Methods, Fig. S2, and Table S1). For a liquid culture of the SSB 1071 strain at , we measured a surfactin concentration of 106(32) mgL−1. We then compared the behavior of a droplet of the supernatant of this bacterial suspension with a drop of commercial surfactin in water at a concentration of 100 mgL−1. We show, in Figs. 5–7, that their evolutions are very similar. Together with the experiments on the surfactin-deficient strain 168, these control experiments show surfactin to be the main tool used by B. subtilis to depin the droplets. Note that even higher concentrations of surfactin can even induce a depinning of the contact line; this, however, does not lead to a sustained motion of the droplet, due to the finite extent of the surfactin ring in the absence of continuous production of surfactin by bacteria inside the droplet (Movie S5).
Discussion
In this article, we have shown how B. subtilis colonies can modify their environment, creating a mobile drop that propels them across solid substrates at high velocities (3.1 cmh−1 on a 1° slope in Movie S3, and potentially much more on steeper slopes), faster than any other surface-bound translocation mechanism described so far. Our measurements reveal that the bacteria have at least three distinct physicochemical mechanisms they can use to this end: Liquid is extracted from the environment, inflating the drop and increasing the gravitational pull; the surface tension is lowered; and the wettability of the environment is significantly increased. The combined action of the three mechanisms leads to a situation where the bacterial drop starts to run downhill on very shallow slopes, as low as 0.1°, under a gravitational pull that is 2 orders of magnitude too weak to depin a similar drop of water. Although the influence of surfactant production on bacterial translocation has been observed in the context of flagellated swarming (15, 27, 29–32), or on biofilm spreading in liquid culture (33), we observe a surfactant-induced translocation mode where individual motility is not required. Its efficiency, making colony surfing the fastest surface translocation mode, is therefore even more remarkable, and arguably relevant in nature. Indeed, colony surfing can also occur if only part of the various mechanisms we uncovered are at play: A small bacteria-laden drop suspended on the upper plate of a sealed plastic box containing a water reservoir can undergo sliding, whereas water droplets of similar sizes would remain stuck by capillary forces (Fig. S8). Osmotic-induced surfing should thus be a rather generic phenomenon in a humid environment. Furthermore, the exploitation of the physicochemistry of surfactants to facilitate wetting and translocation will also be relevant in habitats with strongly varying humidity, such as soils (34), where surfactant-producing bacteria are rather common (35). Capillary forces are, indeed, known to control the water flow in porous media (36), so collective surfing could strongly enhance migration speeds and distances of bacterial colonies through the soil pore network.
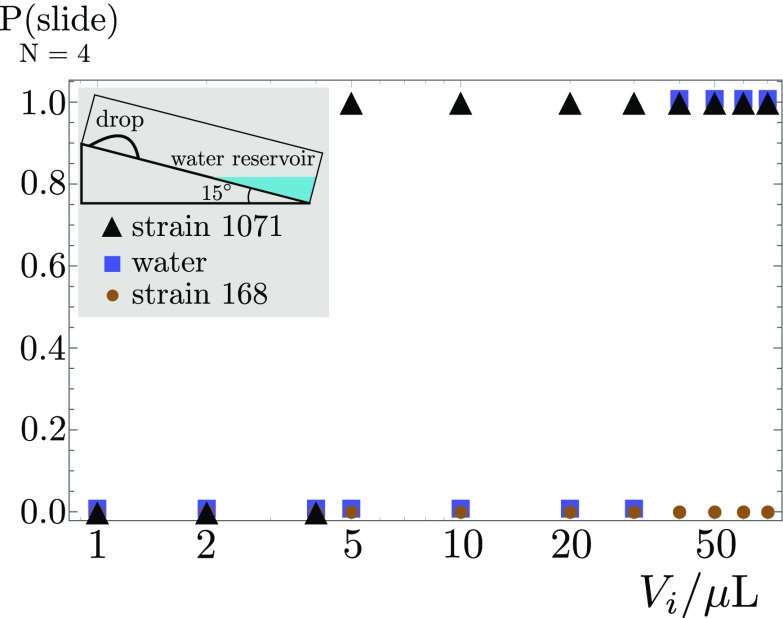
Fig. S8.
Probability to observe colony surfing in a bare polystyrene Petri dish at 15° tilt, closed, and with a water reservoir at the bottom, as a function of the initial deposited volume. The surfactin-producing strain SSB 1071 starts to slide at much smaller volumes () compared with water and the surfactin-deficient 168 strain. The experimental protocol closely follows that of the experiments on gel. The bacterial suspension is prepared using the same protocol (Materials and Methods). Drops of different volume at an initial optical density of are deposited in an inclined clean polystyrene Petri dish placed inside a climate chamber (T = 30 °C, RH = 70%); (Inset) 10 mL of distilled water is added at the bottom of the dish as a source of humidity. Finally, the Petri dish cover lid is put in place and the chamber is closed. Four drops were measured for each condition.
Materials and Methods
Volume and Surface Tension Measurement.
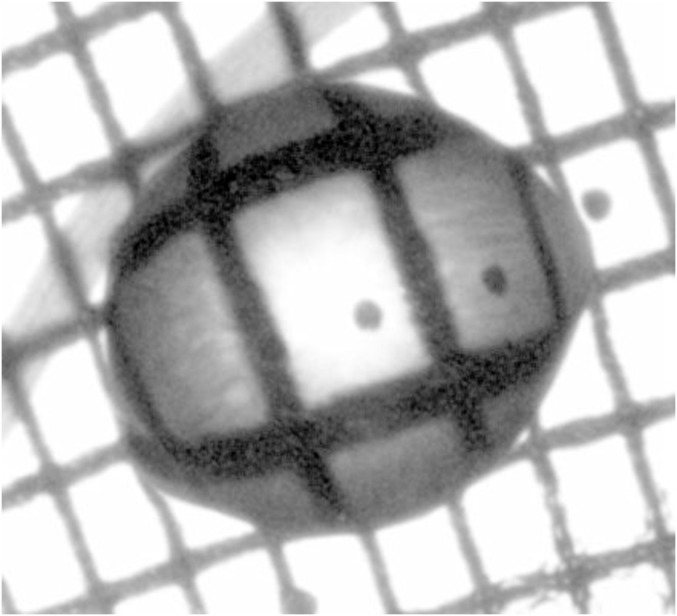
In situ volume and surface tension measurements are performed via a Moiré grid method where we calculate the free surface deformation from the distortion of the image of a grid modulating light intensity, as seen through the drop (18) (Fig. 8). In our setup, the grid translates uniformly, so that the intensity at every pixel varies periodically in time. A tilt in the air–drop or air–gel interface causes an apparent shift of the grid, because of light refraction, producing a phase shift in the intensity signal. This shift can be precisely measured and related to the local interface slope through Snell’s law. We use two perpendicular grids to measure two orthogonal slopes and simultaneously. The full surface profile is obtained by a Fourier transform integration (Frankot–Chellappa), and further integration gives the drop volume. Conversely, the derivatives , , and yield the mean interface curvature
This curvature gives rise to a pressure jump across the air–drop interface, which, in our very slow drops (), depends only on height, because hydrostatic pressure gradients inside and outside of the drop are different (37),
With a constant, essentially the density of water, and the gravitational acceleration known, the surface tension is immediately obtained from the slope of a linear fit of our measured interface height vs. curvature data. Calibration of the setup and subsequent algorithms is achieved by comparing the determined values for volume , apex height , and curvature of various spherical cap lenses with the manufacturer’s specifications. Deviations are found to be within a 1% margin. Furthermore, surface tension measurements on water, glycerol, and surfactin solution were found to agree with measurements through the pendent drop method (38) to within 2%.
Fig. 8.
Two orthogonal slopes of the drop interface can be determined by analyzing the distortion of a rectangular grid translating beneath the drop.
Contact Angle Determination.
The contact line position is determined by noting that the second derivatives and of the height profile must have a local maximum there, corresponding to the discontinuity at the triple liquid–solid–air interface (Fig. S7). The slope discontinuity yields the closed contact line around the drop with a precision of a few pixels, or about 1% of a drop diameter of 5 mm to 15 mm at an image scale of 41.1 pixels per millimeter. The determined contact angle measurements are again calibrated by comparison with the known border gradients of spherical cap lenses and show good agreement within a 5% range.
Agar Gel Preparation.
A 1.4% (mass) stock solution is prepared from granular Agar (Difco). Just before an experiment, this solution is heated by microwave radiation until reaching the boiling point of water. The molten gel is weighted, and solvent loss due to evaporation is compensated for. We mix it with a liquid synthetic nutrient B medium (39) (prepared at twice the final concentration) at a 1:1 ratio to obtain a 0.7% gel solution with nutrients, from which 25 mL are poured in a Petri dish whose lid is closed immediately afterward. Subsequent gelling takes place at constant temperature (30 °C) and on a flat surface for 20 min. The lid is then removed for a duration (1 min unless specified otherwise) to dry the solidified gel surface in ambient air (RH = 35%). The process of drop deposition and transfer may add up to 1 min to this open-lid drying time.
Bacterial Strains and Preparation.
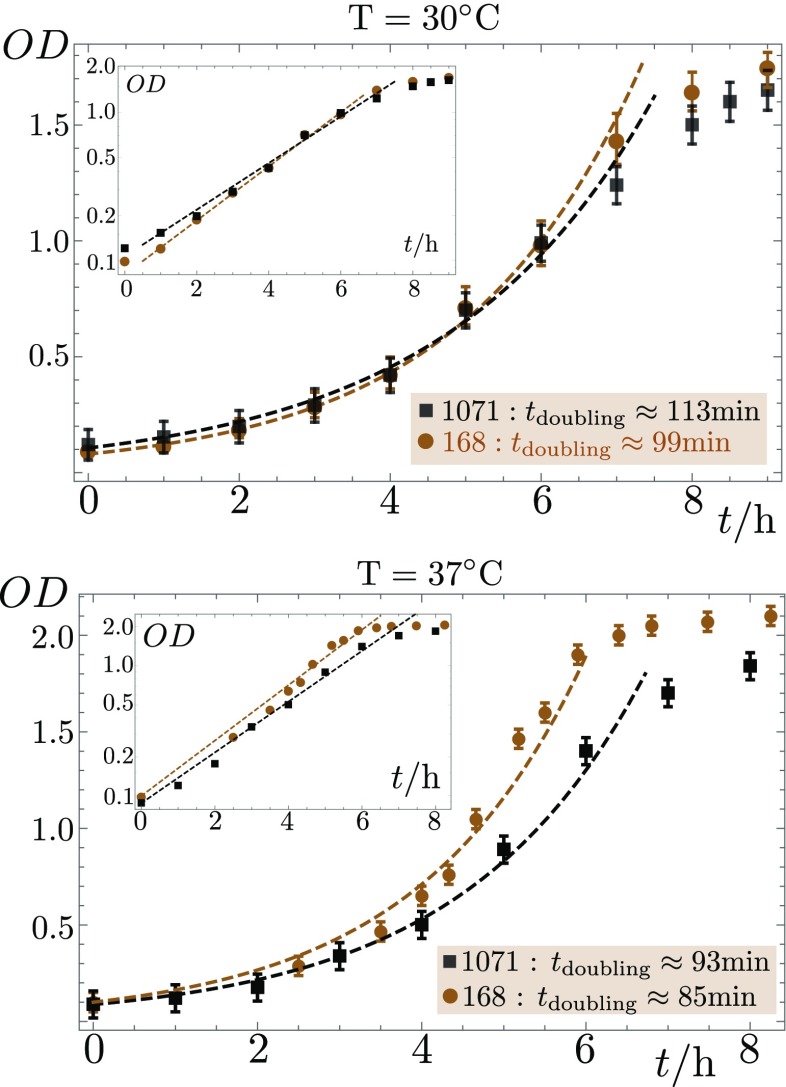
The B. subtilis strains [Laboratory strain 168, genotype trpC2 swrA sfp-; SSB 1071, which is strain 168 restored to sfp+ on the thrC locus, also known as OMG 930 (40); OMG 954, nonflagellated by deletion of the hag gene from SSB 1071 (40)] are taken from a −80 °C storage, spread out on a solid 0.7% Agar medium with LB broth and antibiotics (SSB 1071: erythromycine 0.5 gmL−1, lincomycin 12.5 gmL−1; in the case of OMG 954, additionally, chloramphenicol 5 gmL−1), and incubated at 30 °C and 70% RH for 24 h. Microcolonies are taken from this gel and grown overnight in liquid B antibiotics culture at 37 °C. The suspension is then diluted to an optical density (OD at 600 nm) of 0.1, and, after 1 h, a second time to . It is left in the shaker until bacterial growth saturates. The doubling time in B medium at 30 °C (37 °C) is around 100 min (85 min) for strain 168, and 110 min (90 min) for SSB 1071 (Fig. S9). At 2 h to 4 h after departing from exponential growth, 2-L drops of suspension (diluted to the desired OD) are deposited on the previously prepared agar gel and transferred into a constant climate chamber (Memmert HPP 110) at controlled humidity and at a temperature of 30 °C. An optical density of corresponds to 108 cells per milliliter, i.e., a volume fraction .
Fig. S9.
The doubling time for bacteria grown with aeration in an agitated liquid B medium is estimated from OD measurements at a wavelength of 600 nm. At a temperature of 30 °C (37 °C), we find around 100 min (85 min) for strain 168, and 110 min (90 min) for SSB 1071.
Determination of Surfactin Concentration by HPLC.
Concentrations of surfactin in surfactin-producing bacteria suspensions sampled from bulk and droplets deposited on gel were determined by reverse-phase HPLC on a Varian Prostar equipped with a UV 320 detector by reference to a commercial surfactin standard (Surfactin from B. subtilis, 98% pure, batch n° 086K4109; Sigma-Aldrich). The culture medium as well as supernatant from a liquid culture of strain 168 that does not produce surfactin were also analyzed as controls.
Acquisition of calibration data.
A 1.3 gL−1 mother solution of commercial surfactin was prepared by dissolving 1.3 mg of surfactin in 1 mL of ethanol (95%). The mother solution was then diluted in MilliQ water to prepare calibration standards with 10, 100, 200, and 300 mgL−1 concentrations. The 100-L samples were injected and eluted for 30 min using a mobile phase made of 80:20 (vol/vol) supplemented with 0.1% (v) of trifluoroacetic acid, at a flow rate of 1 mLmin−1. Detection was performed by measuring the absorbance at 205 nm.
Acquisition of sample data.
Samples were filtrated on 0.2-m cellulose acetate syringe filters, injected as 20-L aliquots, and eluted using the settings described for calibration standards.
Building of the calibration model and estimation of concentration in samples.
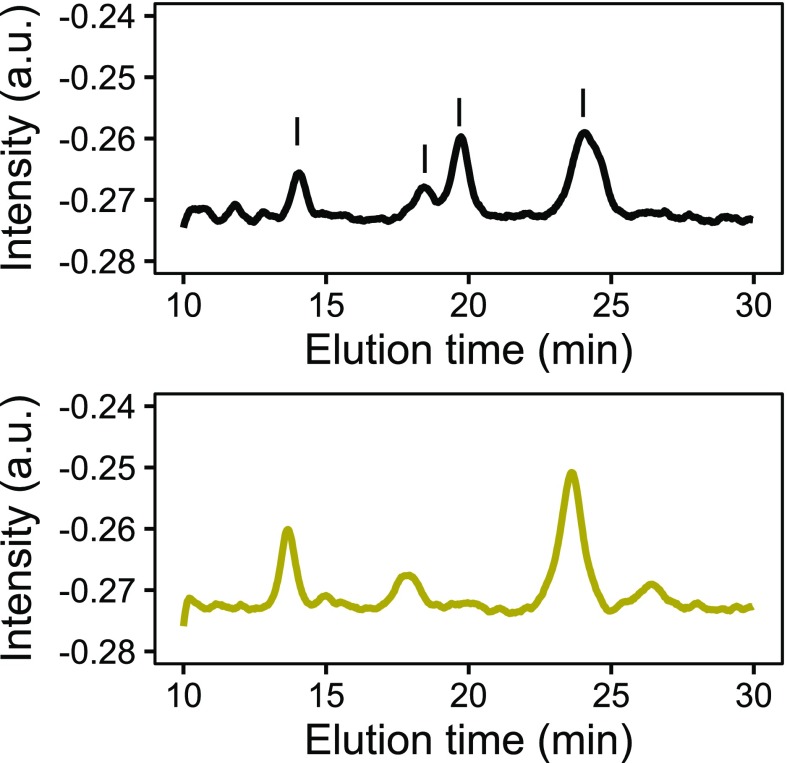
Surfactin exists in several isomeric forms that usually coexist in the same extract. The proportions of the various isomers vary from one bacterial species to another (Fig. S10). Hence, for calibration, a global surfactin-correlated signal was built by summing the contributions of several isomers to the chromatogram. The peaks at 14, 18, 19, and 23.5 min were fitted to Gaussian curves, integrated, and summed to give rise to a total surfactin signal that was plotted against the concentrations of the surfactin standards (Fig. S2). A linear calibration model was built using the standards up to 300 mgL−1. It had a multiple R-squared correlation coefficient of 0.985 with a residual SE of 0.0026 on 5 degrees of freedom. The limit of detection (LOD) was calculated with the usual definition of the concentration corresponding to the signal of the blank sample plus 3 SD of the blank. The LOD was 44 mgL−1. Next, the equivalent concentrations of surfactin in the samples and controls were determined from the total surfactin-correlated peak areas of the corresponding chromatograms.
Fig. S10.
Typical HPLC chromatograms of (Top) commercial surfactin and (Bottom) surfactin produced by our B. subtilis strain SSB 1071. The peaks highlighted in the commercial surfactin chromatogram were exploited for the construction of the calibration plot.
Supplementary Material
Acknowledgments
We thank J.-F. Berret, M. Costalonga, C. Cottin-Bizonne, B. Desmazières, L. Hamouche, K. Hamze, I. B. Holland, S. Séror, and M. Zhao for fruitful discussions. We thank David Clainquart and Marie-Evelyne Pinart from the chemistry department of the University Paris Diderot for their assistance on the HPLC platform. This research was funded through Agence Nationale de Recherche (ANR) Grant Bactterns, Centre National de Recherche Scientifique (CNRS) Grant Projets Exploratoires Premier Soutien (PEPS) “Micromanipulation de particules actives,” and CNRS Grant Programme Interdisciplinaire de Recherche (PIR) “Mécanismes physiques et biologiques de la migration en masse de B. subtilis.”
Footnotes
The authors declare no conflict of interest.
This article is a PNAS Direct Submission.
This article contains supporting information online at www.pnas.org/lookup/suppl/doi:10.1073/pnas.1703997114/-/DCSupplemental.
References
- 1.Wensink HH, et al. Meso-scale turbulence in living fluids. Proc Natl Acad Sci USA. 2012;109:14308–14313. doi: 10.1073/pnas.1202032109. [DOI] [PMC free article] [PubMed] [Google Scholar]
- 2.López D, Vlamakis H, Kolter R. Biofilms. Cold Spring Harb Perspect Biol. 2010;2:a000398. doi: 10.1101/cshperspect.a000398. [DOI] [PMC free article] [PubMed] [Google Scholar]
- 3.Bridier A, Briandet R, Thomas V, Dubois-Brissonnet F. Resistance of bacterial biofilms to disinfectants: A review. Biofouling. 2011;27:1017–1032. doi: 10.1080/08927014.2011.626899. [DOI] [PubMed] [Google Scholar]
- 4.Budrene E, Berg H. Complex patterns formed by motile cells of Escherichia coli. Nature. 1991;349:630–633. doi: 10.1038/349630a0. [DOI] [PubMed] [Google Scholar]
- 5.Brenner MP, Levitov LS, Budrene EO. Physical mechanisms for chemotactic pattern formation by bacteria. Biophys J. 1998;74:1677–1693. doi: 10.1016/S0006-3495(98)77880-4. [DOI] [PMC free article] [PubMed] [Google Scholar]
- 6.Cates M, Marenduzzo D, Pagonabarraga I, Tailleur J. Arrested phase separation in reproducing bacteria creates a generic route to pattern formation. Proc Natl Acad Sci USA. 2010;107:11715–11720. doi: 10.1073/pnas.1001994107. [DOI] [PMC free article] [PubMed] [Google Scholar]
- 7.Liu C, et al. Sequential establishment of stripe patterns in an expanding cell population. Science. 2011;334:238–241. doi: 10.1126/science.1209042. [DOI] [PubMed] [Google Scholar]
- 8.Hall-Stoodley L, Costerton JW, Stoodley P. Bacterial biofilms: From the natural environment to infectious diseases. Nat Rev Microbiol. 2004;2:95–108. doi: 10.1038/nrmicro821. [DOI] [PubMed] [Google Scholar]
- 9.Berg HC. E. coli in Motion. Springer Sci; Berlin: 2008. [Google Scholar]
- 10.Drescher K, Dunkel J, Cisneros LH, Ganguly S, Goldstein RE. Fluid dynamics and noise in bacterial cell–cell and cell–surface scattering. Proc Natl Acad Sci USA. 2011;108:10940–10945. doi: 10.1073/pnas.1019079108. [DOI] [PMC free article] [PubMed] [Google Scholar]
- 11.Tuval I, et al. Bacterial swimming and oxygen transport near contact lines. Proc Natl Acad Sci USA. 2005;102:2277–2282. doi: 10.1073/pnas.0406724102. [DOI] [PMC free article] [PubMed] [Google Scholar]
- 12.Zhang R, Turner L, Berg HC. The upper surface of an Escherichia coli swarm is stationary. Proc Natl Acad Sci USA. 2010;107:288–290. doi: 10.1073/pnas.0912804107. [DOI] [PMC free article] [PubMed] [Google Scholar]
- 13.Fujikawa H, Matsushita M. Fractal growth of Bacillus subtilis on agar plates. J Phys Soc Jpn. 1989;58:3875–3878. [Google Scholar]
- 14.Ben-Jacob E, et al. Generic modelling of cooperative growth patterns in bacterial colonies. Nature. 1994;368:46–49. doi: 10.1038/368046a0. [DOI] [PubMed] [Google Scholar]
- 15.Harshey RM. Bacterial motility on a surface: Many ways to a common goal. Annu Rev Microbiol. 2003;57:249–273. doi: 10.1146/annurev.micro.57.030502.091014. [DOI] [PubMed] [Google Scholar]
- 16.Julkowska D, Obuchowski M, Holland IB, Séror SJ. Branched swarming patterns on a synthetic medium formed by wild-type Bacillus subtilis strain 3610: Detection of different cellular morphologies and constellations of cells as the complex architecture develops. Microbiology. 2004;150:1839–1849. doi: 10.1099/mic.0.27061-0. [DOI] [PubMed] [Google Scholar]
- 17.Lee K, Ivanova N, Starov V, Hilal N, Dutschk V. Kinetics of wetting and spreading by aqueous surfactant solutions. Adv Colloid Interface Sci. 2008;144:54–65. doi: 10.1016/j.cis.2008.08.005. [DOI] [PubMed] [Google Scholar]
- 18.Banaha M, Daerr A, Limat L. Spreading of liquid drops on agar gels. Eur Phys J Spec Top. 2009;166:185–188. [Google Scholar]
- 19.Arima K, Kakinuma A, Tamura G. Surfactin, a crystalline peptidelipid surfactant produced by Bacillus subtilis: Isolation, characterization and its inhibition of fibrin clot formation. Biochem Biophys Res Commun. 1968;31:488–494. doi: 10.1016/0006-291x(68)90503-2. [DOI] [PubMed] [Google Scholar]
- 20.Peypoux F, Bonmatin J, Wallach J. Recent trends in the biochemistry of surfactin. Appl Microbiol Biotechnol. 1999;51:553–563. doi: 10.1007/s002530051432. [DOI] [PubMed] [Google Scholar]
- 21.Debois D, et al. In situ localisation and quantification of surfactins in a Bacillus subtilis swarming community by imaging mass spectrometry. Proteomics. 2008;8:3682–3691. doi: 10.1002/pmic.200701025. [DOI] [PubMed] [Google Scholar]
- 22.Nikola N, et al. Active particles with soft and curved walls: Equation of state, ratchets, and instabilities. Phys Rev Lett. 2016;117:098001. doi: 10.1103/PhysRevLett.117.098001. [DOI] [PubMed] [Google Scholar]
- 23.Humphrey D, Duggan C, Saha D, Smith D, Käs J. Active fluidization of polymer networks through molecular motors. Nature. 2002;416:413–416. doi: 10.1038/416413a. [DOI] [PubMed] [Google Scholar]
- 24.Kajiya T, et al. Advancing liquid contact line on visco-elastic gel substrates: Stick-slip vs continuous motions. Soft Matter. 2013;9:454–461. [Google Scholar]
- 25.Cohen Stuart MA, de Vos WM, Leermakers FAM. Why surfaces modified by flexible polymers often have a finite contact angle for good solvents. Langmuir. 2006;22:1722–1728. doi: 10.1021/la052720v. [DOI] [PubMed] [Google Scholar]
- 26.Sokolov A, Goldstein RE, Feldchtein FI, Aranson IS. Enhanced mixing and spatial instability in concentrated bacterial suspensions. Phys Rev E. 2009;80:031903. doi: 10.1103/PhysRevE.80.031903. [DOI] [PubMed] [Google Scholar]
- 27.Leclère V, Marti R, Béchet M, Fickers P, Jacques P. The lipopeptides mycosubtilin and surfactin enhance spreading of Bacillus subtilis strains by their surface-active properties. Arch Microbiol. 2006;186:475–483. doi: 10.1007/s00203-006-0163-z. [DOI] [PubMed] [Google Scholar]
- 28.Dussan VEB, Chow RTP. On the ability of drops or bubbles to stick to non-horizontal surfaces of solids. J Fluid Mech. 1983;137:1–29. [Google Scholar]
- 29.Julkowska D, Obuchowski M, Holland IB, Séror SJ. Comparative analysis of the development of swarming communities of Bacillus subtilis 168 and a natural wild type: Critical effects of surfactin and the composition of the medium. J Bacteriol. 2005;187:65–76. doi: 10.1128/JB.187.1.65-76.2005. [DOI] [PMC free article] [PubMed] [Google Scholar]
- 30.Partridge JD, Harshey RM. Swarming: Flexible roaming plans. J Bacteriol. 2013;195:909–918. doi: 10.1128/JB.02063-12. [DOI] [PMC free article] [PubMed] [Google Scholar]
- 31.Be’er A, et al. Paenibacillus dendritiformis bacterial colony growth depends on surfactant but not on bacterial motion. J Bacteriol. 2009;191:5758–5764. doi: 10.1128/JB.00660-09. [DOI] [PMC free article] [PubMed] [Google Scholar]
- 32.Henrichsen J. Bacterial surface translocation: A survey and a classification. Bacteriol Rev. 1972;36:478–503. doi: 10.1128/br.36.4.478-503.1972. [DOI] [PMC free article] [PubMed] [Google Scholar]
- 33.Angelini TE, Roper M, Kolter R, Weitz DA, Brenner MP. Bacillus subtilis spreads by surfing on waves of surfactant. Proc Natl Acad Sci USA. 2009;106:18109–18113. doi: 10.1073/pnas.0905890106. [DOI] [PMC free article] [PubMed] [Google Scholar]
- 34.Or D, Smets B, Wraith J, Dechesne A, Friedman S. Physical constraints affecting bacterial habitats and activity in unsaturated porous media—A review. Adv Water Resour. 2007;30:1505–1527. [Google Scholar]
- 35.Bodour AA, Drees KP, Maier RM. Distribution of biosurfactant-producing bacteria in undisturbed and contaminated arid southwestern soils. Appl Environ Microbiol. 2003;69:3280–3287. doi: 10.1128/AEM.69.6.3280-3287.2003. [DOI] [PMC free article] [PubMed] [Google Scholar]
- 36.Sadjadi Z, Rieger H. Scaling theory for spontaneous imbibition in random networks of elongated pores. Phys Rev Lett. 2013;110:144502. doi: 10.1103/PhysRevLett.110.144502. [DOI] [PubMed] [Google Scholar]
- 37.De Gennes PG, Brochard-Wyart F, Quéré D. Capillarity and Wetting Phenomena: Drops, Bubbles, Pearls, Waves. Springer Sci; Berlin: 2013. [Google Scholar]
- 38.Daerr A, Mogne A. Pendent drop: An ImageJ plugin to measure the surface tension from an image of a pendent drop. J Open Res Softw. 2016;4:e3. [Google Scholar]
- 39.Antelmann H, et al. Expression of a stress-and starvation-induced dps/pexB-homologous gene is controlled by the alternative sigma factor sigmaB in Bacillus subtilis. J Bacteriol. 1997;179:7251–7256. doi: 10.1128/jb.179.23.7251-7256.1997. [DOI] [PMC free article] [PubMed] [Google Scholar]
- 40.Hamze K, et al. Identification of genes required for different stages of dendritic swarming in Bacillus subtilis, with a novel role for phrc. Microbiology. 2009;155:398–412. doi: 10.1099/mic.0.021477-0. [DOI] [PubMed] [Google Scholar]
Associated Data
This section collects any data citations, data availability statements, or supplementary materials included in this article.


