Significance
Reconstructions of past environmental changes are important for placing recent climate change in context and testing climate models. Periods of past climates warmer than today provide insight on how components of the climate system might respond in the future. Here, we report on an Arctic climate record from the Agassiz ice cap. Our results show that early Holocene air temperatures exceed present values by a few degrees Celsius, and that industrial era rates of temperature change are unprecedented over the Holocene period (∼12,000 y). We also demonstrate that the enhanced warming leads to a large response of the Greenland ice sheet; providing information on the ice sheet's sensitivity to elevated temperatures and thus helping to better estimate its future evolution.
Keywords: ice core, temperature reconstruction, Holocene climate, Greenland ice sheet
Abstract
We present a revised and extended high Arctic air temperature reconstruction from a single proxy that spans the past ∼12,000 y (up to 2009 CE). Our reconstruction from the Agassiz ice cap (Ellesmere Island, Canada) indicates an earlier and warmer Holocene thermal maximum with early Holocene temperatures that are 4–5 °C warmer compared with a previous reconstruction, and regularly exceed contemporary values for a period of ∼3,000 y. Our results show that air temperatures in this region are now at their warmest in the past 6,800–7,800 y, and that the recent rate of temperature change is unprecedented over the entire Holocene. The warmer early Holocene inferred from the Agassiz ice core leads to an estimated ∼1 km of ice thinning in northwest Greenland during the early Holocene using the Camp Century ice core. Ice modeling results show that this large thinning is consistent with our air temperature reconstruction. The modeling results also demonstrate the broader significance of the enhanced warming, with a retreat of the northern ice margin behind its present position in the mid Holocene and a ∼25% increase in total Greenland ice sheet mass loss (∼1.4 m sea-level equivalent) during the last deglaciation, both of which have implications for interpreting geodetic measurements of land uplift and gravity changes in northern Greenland.
Instrumented records of temperature and environmental change extend for a few centuries at most. Although these records provide evidence of climate warming, the time span covered is relatively short compared with the centuries to millennia response times of some climate system components (1). In this respect, reconstructions of temperature and environmental changes obtained from climate proxies (e.g., sediment cores, ice cores) play a complementary role to the instrumented records by providing a longer temporal context within which to interpret the magnitude and rate of recent changes (2). Furthermore, the relatively large spatial and temporal variability captured in these reconstructions represents a useful dataset to test models of the climate system (3). Of particular interest are periods during Earth’s history when the climate was warmer than at present, as these provide information that is potentially more relevant to changes in the future.
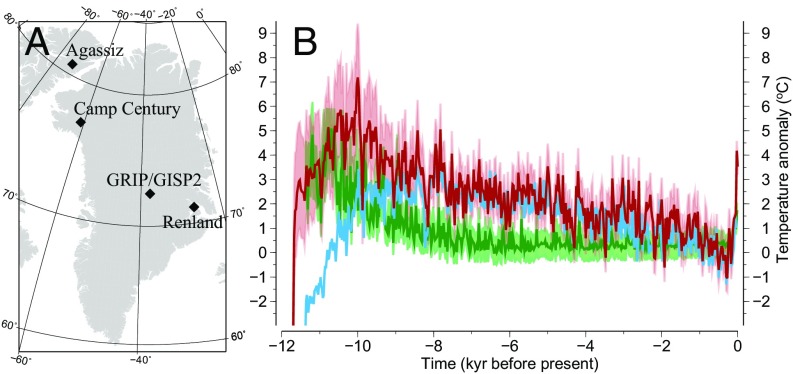
In this study, we focus on the reconstruction of past climate using ice cores from the Agassiz ice cap, located on Ellesmere Island in the Canadian Arctic Archipelago (Fig. 1A). This site is of particular interest as it is located in the high Arctic, and temperature reconstructions can be compared with those from more southerly locations to estimate polar amplification of climate in the past (4). Furthermore, it is located proximal to the Greenland ice sheet, and so can be used to better constrain the climate forcing used to model the past evolution of this ice sheet.
Fig. 1.
Location map and Agassiz proxy temperature records: (A) Map showing the study area with the names and locations of ice core borehole sites mentioned in the text. (B) The 25-y resolution, elevation-corrected Agassiz δ18O temperature reconstruction (dark red) with 2σ uncertainty (light red) and the elevation-corrected Agassiz melt record (green), both extended to 2009 CE. Ref. 5’s δ18O Agassiz–Renland temperature reconstruction is also shown (blue) for comparison. Each record is referenced to its preindustrial temperature value at 1750 CE.
In a recent study (5), δ18O measurements in ice from the Agassiz (81°N) and Renland (70°N) ice caps (Fig. 1A) were used to estimate temperature records for these locations throughout the Holocene. The two time series were remarkably similar, leading the authors to adopt a spatially homogeneous change in air temperature across the region spanned by these two ice caps. By removing the temperature signal from the δ18O record of other Greenland ice cores (Fig. 1A), the residual was used to estimate altitude changes of the ice surface through time. These so-called thinning curves provide a valuable constraint on model reconstructions of the Greenland ice sheet (5). A key conclusion of the study was that the current generation of 3D thermomechanical ice-sheet models fail to capture the large thinning inferred at sites located closer to the ice margin, particularly in northwest Greenland (Camp Century drill site; Fig. 1A). However, the veracity of the results in ref. 5 have been brought into question due to the possible influence of the Innuitian ice sheet across the Canadian Arctic on the altitude correction required to infer temperature from Agassiz ice during the early Holocene (6). A second issue is that the temperature record estimated from Agassiz ice using two different proxies [ice melt percent (7) and oxygen isotope content (5); see next section] gives inconsistent results in the early Holocene. Here, we address these issues by considering the influence of Innuitian ice sheet thinning on the δ18O temperature reconstruction from Agassiz ice, and applying the revised reconstruction to force a model of the Greenland ice sheet.
Results and Discussion
Reconstructing Holocene Air Temperatures.
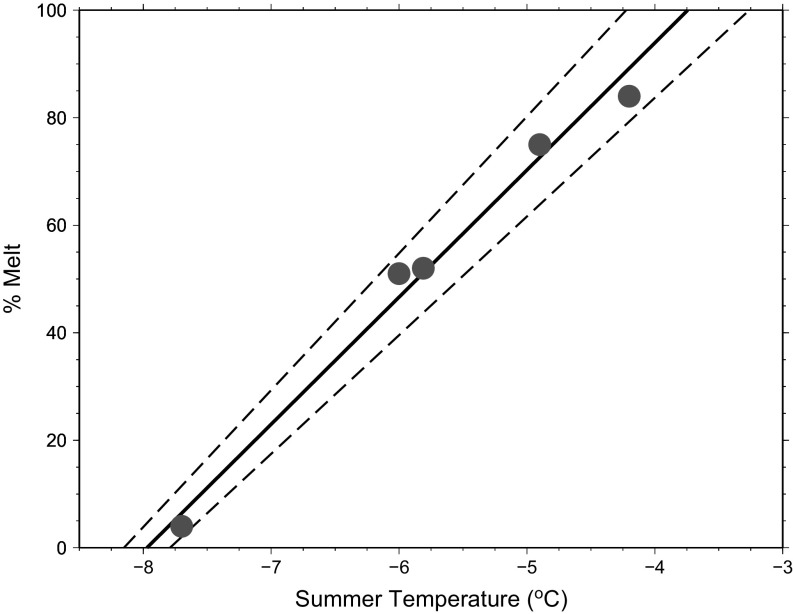
Previous air temperature reconstructions inferred from Agassiz ice using observations of the melt layers (7) and the δ18O record (5, 8) are inconsistent in the early Holocene (Fig. 1B). The melt record indicates temperatures peaking in the early Holocene (∼11 ky) with a steady decline until 8 ky (7, 9); whereas, the earlier reconstruction (5) shows air temperatures reaching a maximum between 8 and 9 ky. The melt-record reconstruction is a proxy for summer (June, July, August) temperatures, and is derived using a linear transfer function relating melt percent to summer air temperatures along with the present-day lapse rate correction at the surface of the ice cap (Methods and Fig. S1). This technique can only be used to quantify summer air temperatures in the range −8 °C (no melt below this temperature) to about −3 °C (100% melt above this temperature). In contrast, the δ18O record is a proxy for mean annual air temperature and spans a much larger temperature range. However, these differences between the two proxies do not reconcile the discrepancies between the earlier δ18O-based temperature reconstructions and the melt reconstruction shown in Fig. 1B.
Fig. S1.
Empirical melt percent transfer function: Summer temperatures and melt layers across a number of shallow Arctic ice cores (black circles; refs. 7, 30). Linear regression of these data yield a transfer function (black line; 2σ is the dashed black line), which demonstrates that summer temperatures below ∼−8 °C yield no melt fraction in the ice. Similarly, melt percent values of 100 signify summer temperatures above or equal to ∼−3 °C.
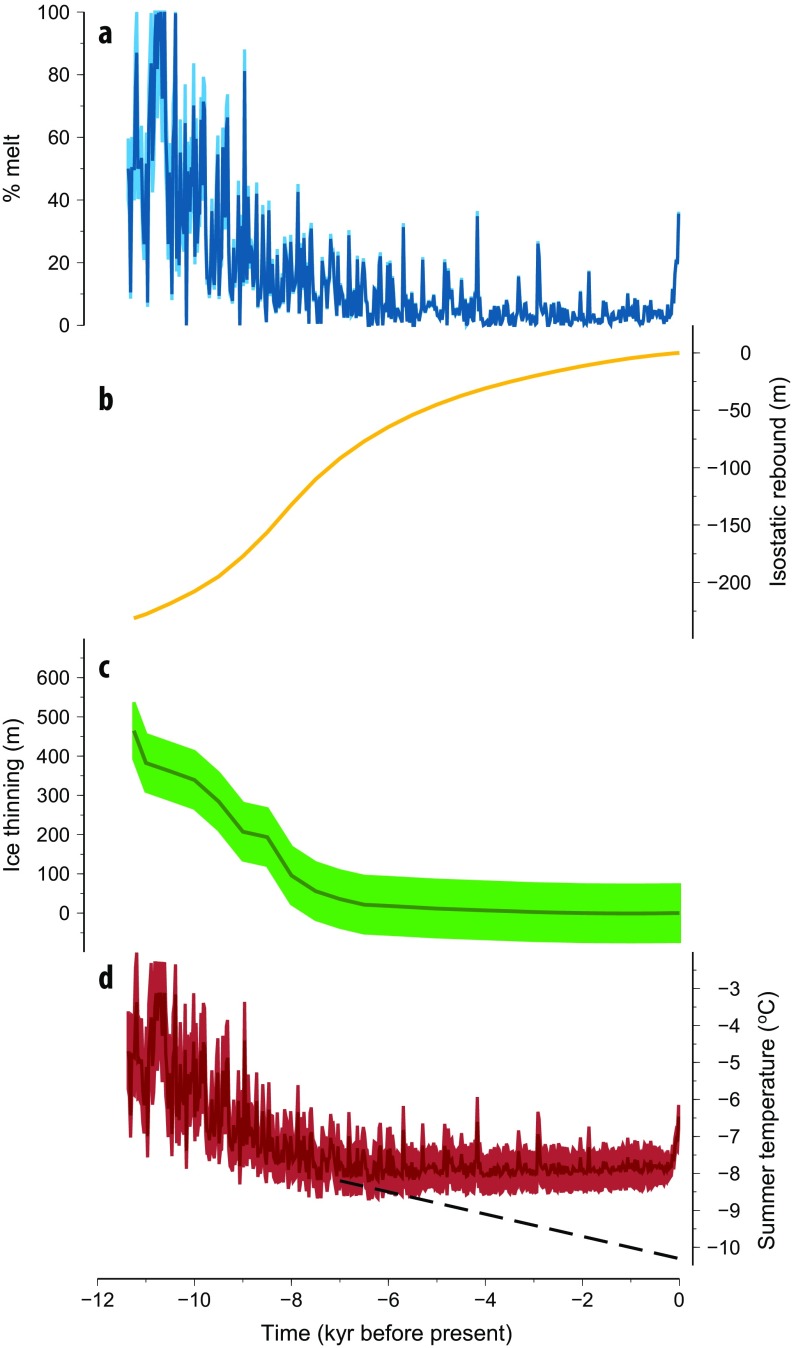
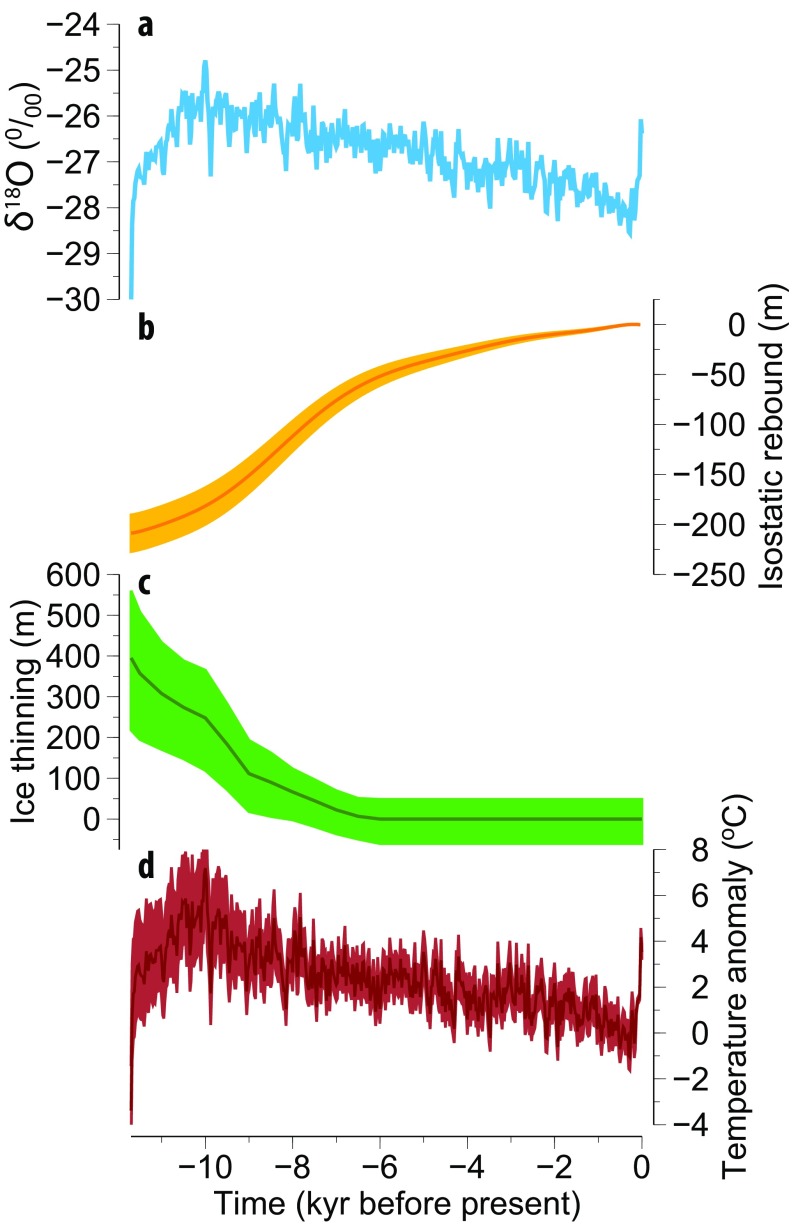
To accurately infer air temperature from ice melt and δ18O records, the effect of elevation changes must be quantified and removed (Methods). In the case of the melt record, this correction is applied at the location of the ice core to remove the contributions from vertical land motion and changes in ice thickness (Fig. S2). The elevation correction for the isotope records is more complex, as the correction for vertical land motion and thickness changes of the Innuitian ice sheet is applied at the location where the air moisture that precipitates over the ice cap reaches a fixed maximum elevation of condensation (5, 6, 10, 11) (Fig. S3). The original δ18O-based reconstruction (5) (Fig. 1B) does not account for this latter effect. When correcting for thickness changes of the Innuitian ice sheet using results from a recent study (12), the δ18O-based temperature reconstruction is significantly altered (Fig. 1B), with peak temperatures occurring earlier (ca.10.5 ky) and a gradual decline in temperature since this time until around 1700 CE. Our reconstruction gives warmer air temperatures during the early Holocene (11.7–8.5 ky) relative to the original (6), and is now more consistent with that determined from the melt record. The offset between maxima of the melt and δ18O proxy temperature reconstructions is likely a product of the noise levels in the melt record, particularly for earlier times. The A87 melt series has a double peak centered on 10 and 10.75 ky; whereas, the younger 10-ky peak in the A84 melt series is less pronounced. Therefore, the resulting stack has a diminished 10-ky peak, which emphasizes the role of noise in a two-series stack. Applying a Gaussian low pass filter (σ = 50 y) to the 25-y resolution temperature time series shows a rapid early Holocene warming with a peak of 6.1 °C at 10 ky (2σ uncertainty 4.3–8.3 °C) followed by a gradual cooling to 1700 CE (Fig. 2A; temperatures are defined relative to the value at 1750 CE). Together, the Agassiz δ18O and melt-layer records point to substantially higher temperatures during the early Holocene compared with preindustrial values. Although there are few quantitative reconstructions of high Arctic air temperatures for the early Holocene (13), the occurrence of endostromatolites on Devon Island dated to the early-mid Holocene indicates that temperatures were 5–8 °C warmer (14), providing evidence of an early Holocene thermal maximum in this area and supporting our revised δ18O temperature reconstruction.
Fig. S2.
Agassiz melt-record temperature reconstruction: (A) Agassiz melt record and estimated corrections for (B) isostatic adjustment and (C) thinning of the Innuitian ice sheet at the borehole site. (D) The resulting summer (JJA) temperature reconstruction (dark red) with its 2σ uncertainty (light red). The potential mid to late Holocene trend for temperatures below −8 °C (when there is absence of melt) is indicated by the dashed black line.
Fig. S3.
Agassiz δ18O temperature reconstruction: (A) Agassiz δ18O record with the addition of the 2010 shallow ice core and estimated elevation corrections for (B) isostatic adjustment and (C) thinning of the Innuitian ice sheet along the southeastern coast of Ellesmere Island. (D) Agassiz δ18O temperature reconstruction (dark red) with its 2σ uncertainty (light red).
Fig. 2.
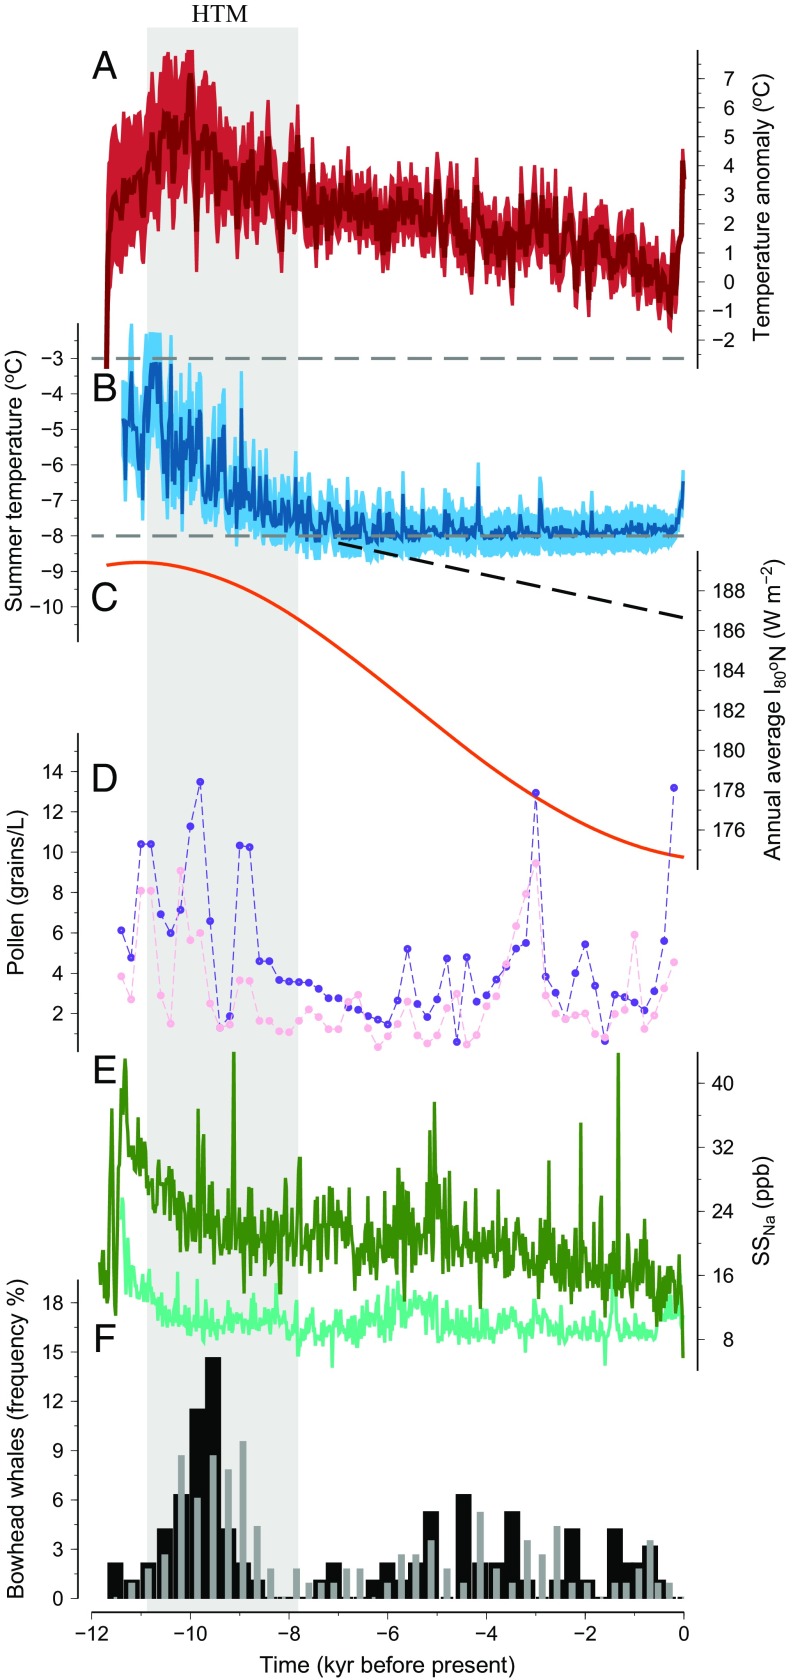
Various records related to high Arctic climate change: (A) Agassiz δ18O temperature reconstruction (dark red) with its 2σ uncertainty (light red). (B) Agassiz melt record summer (JJA) temperature reconstruction with the potential trend (dashed black) for temperatures below −8 °C and above −3 °C (horizontal gray dash; see main text and Methods). (C) Mean annual insolation at 80°N. (D) Agassiz tree (purple) and herb (pink) pollen record (15), (E) sea salt sodium in the GISP2 (doubled scaling; cyan; ref. 17) and Penny ice cores (green; ref. 16), and (F) numbers of bowhead whale bones from Eastern (gray; 74.3–76.1°N, 83.3–90.5°W; n = 116) and Central (black; 71.5–73.7°N, 89.4–99.0°W; n = 96) Queen Elizabeth Islands (18, 19). The gray area denotes the local Holocene thermal maximum, a period when Agassiz temperatures were regularly above peak contemporary values.
Orbital variations are considered to be the primary driver of a warm early Holocene in the high Arctic, and this is supported by the good correlation between peak annual average insolation at 80° latitude (Fig. 2C) and temperatures at the Agassiz ice cap. A maximum in pollen concentrations (Fig. 2D; ref. 15) indicates that, as the climate warmed, atmospheric moisture content increased alongside a strengthening of meridional heat and moisture transport to the Arctic. As a consequence of the warmer temperatures, sea-ice cover was likely at a minimum during the early Holocene as inferred from the higher concentration of sea-salt sodium found in the Greenland ice sheet and Penny ice cap (Fig. 2E; refs. 16, 17). Furthermore, inferences of sea-ice cover in the archipelago from whale bone remains in raised marine deposits suggest maximum breakup following peak annual insolation and temperatures at the Agassiz ice cap (Fig. 2F; refs. 18, 19).
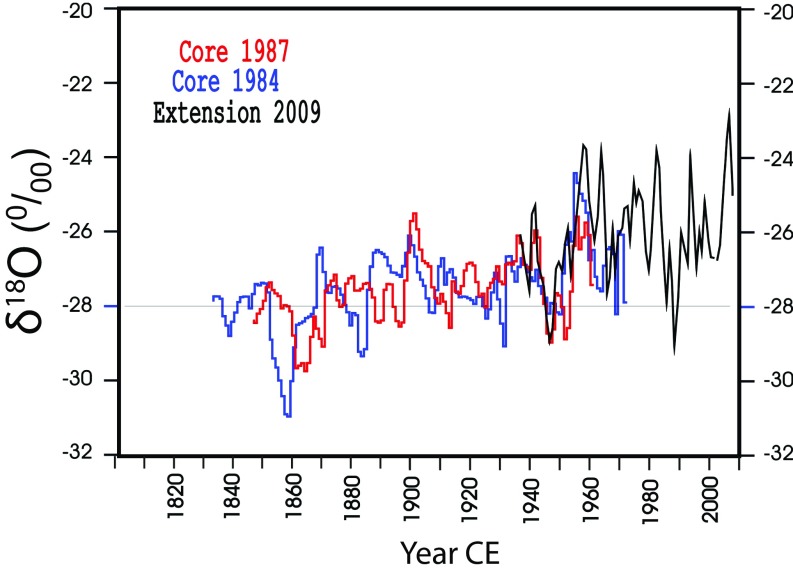
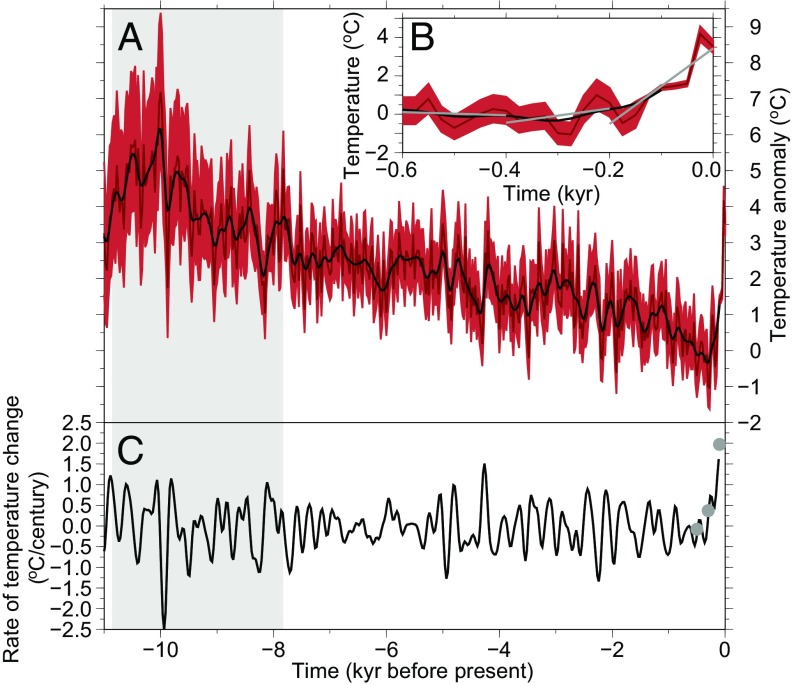
A shallow ice core was collected in the Agassiz ice cap in 2010, extending the δ18O time series and thus temperature reconstruction to 2009 (Fig. S4 and Methods). The extended record indicates that modern air temperatures are ∼4 °C warmer relative to preindustrial values and at their highest in the past ∼7000 y (2σ uncertainty 6.8–7.8 ky; Fig. 3A). We calculated rates of temperature change during the Holocene using a Gaussian filtered temperature reconstruction and linear regression (Fig. 3C). The latter approach was applied to provide a rate that is accurate for the past 200 y (a contemporary rate is not possible using the filtered data due to the edge effect associated with the end of the time series). Rates of temperature change have fluctuated throughout the Holocene, but have generally been less than ∼1 °C/century. However, the last few centuries have experienced the highest rates of temperature change in our record, exceeding 1.5 °C/century, which is consistent with data from nearby weather stations in the Canadian high Arctic where mean annual air temperatures have increased at a rate of ∼0.1 °C/decade since the 1970s (7). Therefore, although air temperatures were warmer than today in other parts of the Holocene, the rate of climate warming during the industrial era is unprecedented over the past ∼12,000 y.
Fig. S4.
Agassiz δ18O extension: A84, A87, and A09 high resolution δ(18O) series. In the overlap period approximately from 1940 to 1970 CE, there is reasonable correlation and good matching of levels. The differences between the three series are typical for such high-resolution series at this latitude (8).
Fig. 3.
Low-pass-filtered Agassiz δ18O temperature reconstruction: (A) Agassiz δ18O temperature reconstruction (dark red) with its 2σ uncertainty (light red) with the Gaussian filtered (σ = 50 y) reconstruction (black). (B) The Agassiz δ18O temperature reconstruction over the past 1,000 y. The gray lines denote the linear regression results for three periods: the cooling leading into the preindustrial period, the preindustrial era, and industrial era. (C) Rate of temperature change (black) based on the Gaussian filtered Agassiz temperature reconstruction. The gray circles represent the rates of change obtained from the linear regression segments shown in B. The vertical gray band denotes the local Holocene thermal maximum, a period when Agassiz temperatures were regularly above peak contemporary values.
The Agassiz ice cap provides the most northerly paleoclimate record (∼80°N) of the entire Holocene, and our δ18O temperature reconstruction provides important information for quantifying the strength and timing of polar warming. A variety of feedback mechanisms are responsible for this warming, and there have been significant advances in identifying the processes responsible for the modern polar amplification of climate warming (4, 20); however, there remains considerable uncertainty in projections of future Arctic climate change (21) and thus a need for improved observations of past and present climate conditions in the high Arctic. Although it is beyond the scope of this study to perform the regional-scale analysis required to rigorously examine polar amplification in the Holocene, it is of interest to compare the magnitude of early Holocene warming from the Agassiz and Renland ice caps. The corrected Agassiz early Holocene temperatures warmed by ∼4 °C more relative to those inferred at the Renland ice core (eastern Greenland; ref. 5) during the 11–9.5 ky interval. Furthermore, peak warmth at Agassiz and Renland differ by ∼2 ky, with Agassiz experiencing an earlier and more distinct Holocene thermal maximum indicating a pronounced reduction in temperature gradient between these two sites during the early Holocene.
Implications of Agassiz δ18O Temperature Reconstruction for Greenland Ice Sheet Evolution.
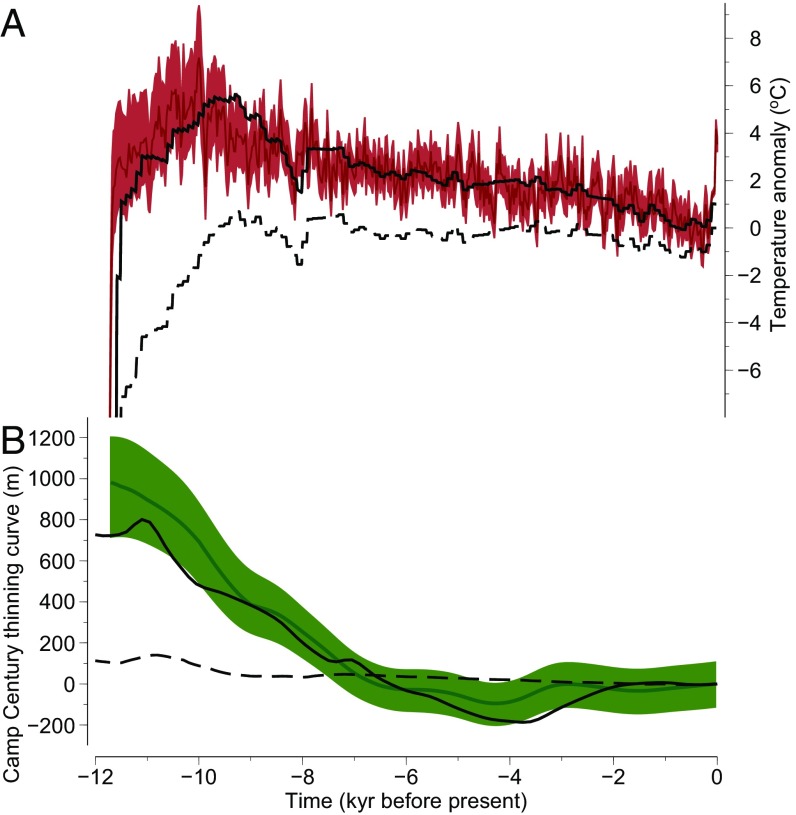
We apply our δ18O temperature record to consider its impact on the Holocene evolution of the Greenland ice sheet. As outlined above, elevation histories at Greenland ice core locations (Fig. 1A) were estimated based on the similarities between the Agassiz and Renland δ18O records (5). Our analysis reveals that these records are different during the early Holocene, and so the adoption of a spatially uniform temperature change across Greenland (5) is no longer supported. Using our δ18O temperature record from Agassiz, and assuming that it remains valid regionally, variations in ice elevation at Camp Century were isolated and subsequently corrected for upstream effects (6), yielding a Camp Century Holocene elevation curve (Fig. 4B; Methods). Our estimated thinning curve at Camp Century displays an elevation reduction during the early Holocene that is a factor of 1.6 larger than the original estimate (5) (Fig. S5). As a result, the model–data discrepancies noted previously (5, 6, 22) are enhanced (Fig. S5). The accuracy of the resulting elevation history relies on the accuracy of our assumption that the Agassiz climate history reflects climatic changes occurring at Camp Century. These locations are relatively proximal (∼500 km apart), although the possibility of significant climatic deviations at Camp Century from those on Ellesmere Island cannot be disregarded; particularly during the early Holocene when large changes in ice-surface elevation and sea-ice extent could have produced significant climate variability in the Nares Strait region via orographic changes and enhanced atmosphere–ocean interaction as this area became ice free.
Fig. 4.
Temperature and thinning curves for northwest Greenland: (A) Agassiz δ18O temperature reconstruction (dark red) with 2σ uncertainty (light red). The temperature time series at Camp Century inferred from the GRIP ice core using a δ18O–temperature relationship and lapse rate correction (dashed black) and the revised temperature time series based on the Agassiz reconstruction (solid black; Methods). (B) Camp Century thinning curve (green) and 2σ uncertainty (light green) compared with model output: Huy3 (dashed black) and our variant of this model reconstruction (solid black).
Fig. S5.
Camp Century thinning history: Camp Century ice-core-derived Holocene thinning curves from ref. 5 (blue) and this study (orange); light band represents the 2σ uncertainty range. Selected model predictions are shown in dashed gray (31), gray (32), dashed black (22), and black (this study).
The majority of Greenland ice sheet models are forced with a temperature history that is inferred from summit ice cores [e.g., Greenland Ice Core Project (GRIP), Greenland Ice Sheet Project 2 (GISP2)] and then extrapolated across the ice sheet based on δ18O–T relationships and lapse rates (e.g., ref. 22). As shown in Fig. 4A, this extrapolated curve greatly underestimates the amplitude of early Holocene warmth compared with that inferred here from the Agassiz ice δ18O record. To address this issue, we performed a model sensitivity analysis using a revised temperature history, based on the Agassiz ice δ18O temperature time series (Fig. 4A; Methods), to force the northern sector of a recent Greenland ice sheet reconstruction (ref. 22; referred to hereafter as Huy3). The revised climate forcing yields rapid thinning across North Greenland, particularly northwest Greenland as presented in Fig. 4B. As a consequence of this enhanced thinning, it was necessary to produce a considerably thicker ice sheet at the last glacial maximum to match present-day ice extent and thickness in this region. As indicated in Fig. 4B, it was possible to produce a good fit to the Camp Century thinning curve using our revised temperature forcing, suggesting that the failure of previous models to capture this signal (ref. 5; Fig. S5; Methods) reflects inaccuracy in the adopted climate forcing. As discussed in Methods, our simulations do not capture the full buttressing effect of the Innuitian ice sheet on the Greenland ice sheet across Nares Strait. Deglaciation of this area around 10 ky before present would also have contributed to the rapid ice thinning in the region during the early Holocene (23).
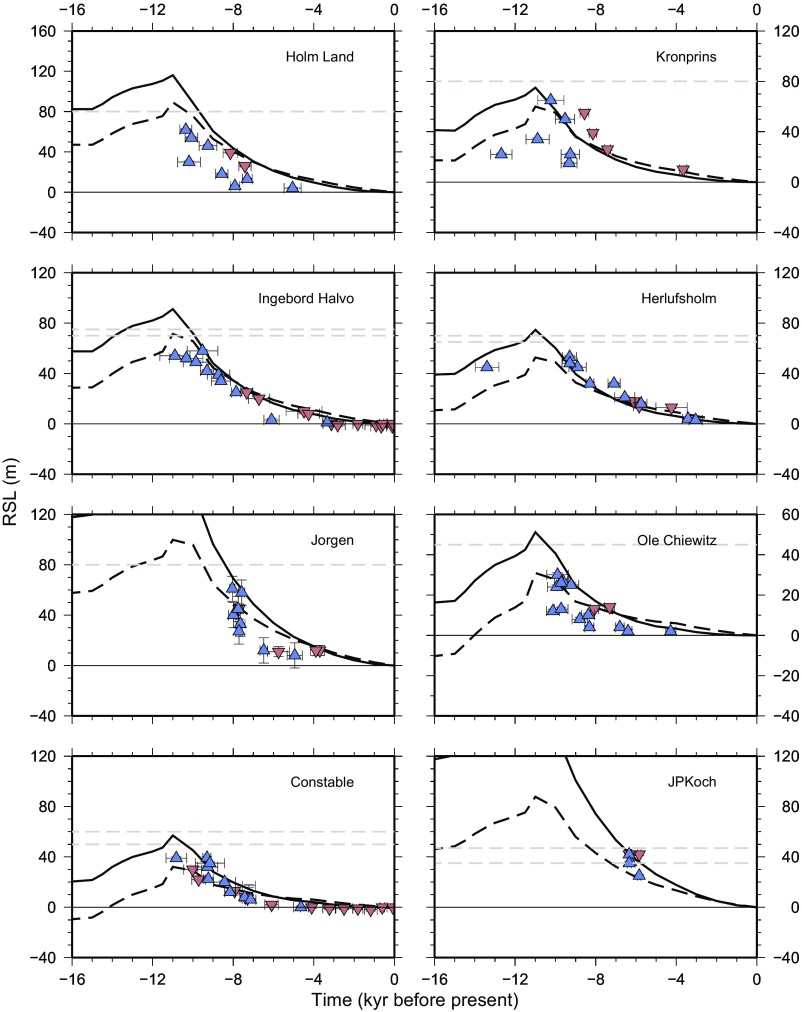
The larger deglaciation predicted for North Greenland will influence predictions of relative sea level in this region, so we input our revision of the Huy3 ice-sheet reconstruction to a glacial isostatic adjustment (GIA) model (Methods) and performed a data–model comparison to test whether the relative sea-level (RSL) observations support the large thinning suggested by the Camp Century ice core record. Comparison with observations in North and northeast Greenland suggest that the revised ice model is more compatible with the majority of the RSL reconstructions compared with the Huy3 reconstruction (Figs. S6 and S7; Methods), although we note that the quality of RSL data is low in North Greenland. In northwest Greenland, nearest to Camp Century, there are some data–model discrepancies with both the original and revised Huy3 reconstruction. At Qeqertat, the models fit the RSL observations only if one takes into consideration uncertainties in the North American ice complex (see figure S6 from ref. 22). At Saunders and Thule, the Huy3 model underpredicts the RSL observations with a mistimed fall in sea level, and the variant Huy3 model over predicts the observations significantly.
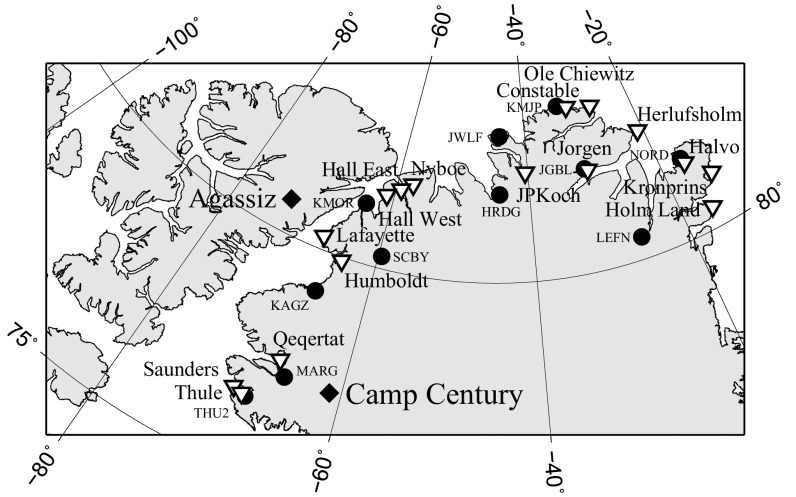
Fig. S6.
Relative sea level and GPS sites: The location of the relative sea level sites shown in Fig. S7 are indicated by downward-facing triangles. The diamonds represent the locations of the Agassiz and Camp Century ice cores. The circles represent the locations of the Greenland GPS Network (GNET) sites in North Greenland listed in Table S1.
Fig. S7.
Relative sea level data and predictions: RSL data and model predictions based on two ice models: Huy3 (dashed black) and the variant of Huy3 from this study (solid black). Lower relative sea-level limiting dates are denoted by blue upward-pointing triangles and upper limiting dates are shown by red downward-pointing triangles. The gray dashed horizontal line represents the marine limit, which marks the highest point reached by sea level during ice-free conditions at each location. Location map of sites is shown in Fig. S6.
The accuracy of our revised ice model can also be tested against Global Positioning System (GPS) estimates of vertical land motion. In a recent study (24), the component of this motion associated with past ice-sheet changes was isolated by estimating and removing the signal caused by ice-sheet changes and the corresponding elastic earth deformation during the GPS monitoring period. Table S1 provides a comparison of observed and modeled uplift rates that includes values for both Huy3 and the revised model. At sites in the northwest, the revised model produces an improved fit to the observed rates. However, we note that the model rates underpredict those observed. In particular, we note that the uplift rates at the two GPS sites nearest to Camp Century are considerably larger than those predicted by the two models, suggesting that a greater amount of regional thinning is required, in contrast to that suggested by the RSL reconstructions at Saunders and Thule.
Table S1.
GPS rates across North Greenland
| Site | Latitude (°N) | Longitude (°W) | Elastic-corrected GPS rates (mm/y) | Huy3 uplift rates (mm/y) | Revised Huy3 uplift rates (mm/y) |
| THU2 | 76.53705 | 68.82503 | 3.3 ± 0.1 | −1.58 | −0.01 |
| MARG | 77.18704 | 65.69462 | 4.5 ± 0.5 | −0.57 | 1.19 |
| KAGZ | 79.13196 | 65.85295 | 7.0 ± 0.3 | 1.68 | 3.80 |
| SCBY | 80.26013 | 59.59362 | 5.8 ± 0.4 | 2.19 | 4.85 |
| KMOR | 81.25271 | 63.52739 | 6.1 ± 0.1 | 2.19 | 4.11 |
| HRDG | 81.87983 | 44.51737 | 5.4 ± 0.3 | 2.02 | 2.86 |
| JWLF | 83.11165 | 45.11983 | 4.8 ± 0.3 | 1.11 | 1.47 |
| JGBL | 82.20876 | 31.00420 | 4.5 ± 0.3 | 2.28 | 1.32 |
| KMJP | 83.64324 | 33.37708 | 3.8 ± 0.2 | 0.81 | 0.36 |
| LEFN | 80.45668 | 26.29346 | 2.1 ± 0.3 | 2.71 | −0.12 |
| NORD | 81.60014 | 16.65545 | 2.8 ± 0.4 | 1.65 | 0.53 |
The above-noted data–model discrepancies with respect to the RSL and GPS observations have different possible interpretations. For example, the northwest region could have a different earth viscosity structure to that of the Greenland-wide optimum used here (22; determined using the Huy3 ice history). Alternatively, the magnitude and/or timing of ice unloading could be incorrect, indicating that extrapolating the Agassiz temperature curve to Camp Century is not applicable; or other processes such as changes in the moisture pathway are influencing the δ18O at Camp Century, thus complicating the inferences of elevation changes at this site. Determining which of these interpretations is correct, and whether all three data types (Camp Century thinning curve, RSL curves, GPS rates) can be reconciled with a single model parameter set, will require improved observational constraints and a more detailed model sensitivity analysis that explores parameter uncertainties more fully.
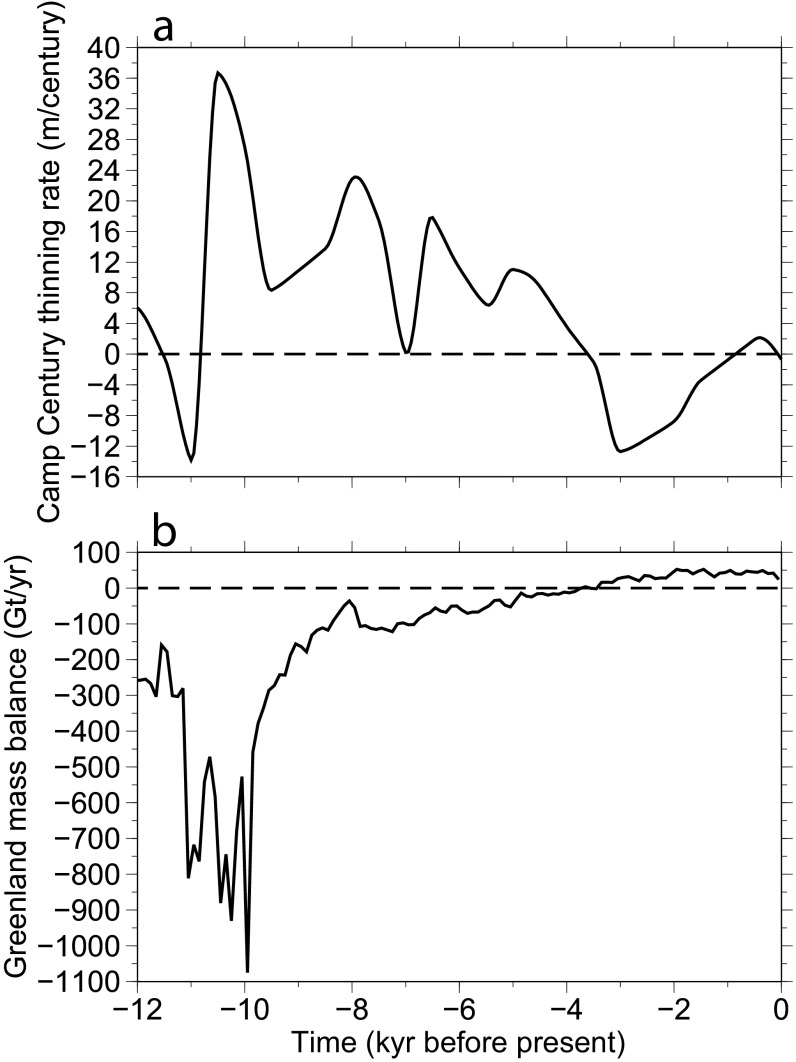
Even though we have focused on the north of Greenland in this analysis, the differences between the original Huy3 model and the revised version are large enough to be evident in their respective volume time series (Fig. S8). Compared with Huy3, the revised North Greenland reconstruction delivers an additional 1.38 m of ice-equivalent sea level to the global oceans during the most recent deglaciation. Although this is a relatively small amount compared with the global ice volume loss (∼130 m), it is 27% of the loss in the Huy3 Greenland model. The larger temperature forcing in the early Holocene also results in a modeled retreat of the ice margin interior of its current position by 20–80 km (as early as 8 ky before present in some places) followed by a regrowth to present. The regrowth in North Greenland represents a net drop of 0.18 m of ice-equivalent sea level, similar to that estimated for the southwest part of the ice sheet (22). Our revised model shows that rates of surface thinning reached values of 36.7 m/century at Camp Century and the Greenland ice sheet experienced a peak centennial rate of Holocene mass loss of 1,075 gigaton per year (Gt/y) during the period when reconstructed temperatures were greater than those at present (Fig. S9). This rate of model mass loss reflects the “memory” of the ice sheet to past air temperature changes, notably the large increase at the Pleistocene–Holocene transition shortly after 12 ky, as well as the contemporary response to the peak temperatures during the early Holocene. Before 10 ky, marine retreat of the ice model from rising sea levels (22) is a significant contributor to the rate of mass loss. After this time, the ice margin was largely land based and so the mass loss rates can be compared more directly to those estimated for the ice sheet at present using geodetic methods; for example 142 ± 49 Gt/y for the period 1992–2011 (25).
Fig. S8.
Modeled ice volume of the GrIS: Huy3 and variant reconstruction volume histories shown as dashed black and solid black curves, respectively. The differences between the two volume histories are due to changes in North Greenland associated with the revised climate forcing.
Fig. S9.
Modeled ice sheet rates of change during the Holocene: (A) Rate of elevation change at Camp Century in the Huy3 variant reconstruction and (B) Greenland-wide mass balance rates.
Concluding Remarks
As demonstrated in the previous section, the δ18O air temperature reconstruction resulting from this analysis has implications for model-derived regional ice-sheet reconstructions. As the ice history is a necessary input to arrive at the corrections applied to the Agassiz ice-core data, the ideal approach would involve iteration to ensure that the resulting temperature reconstruction and regional ice model reconstruction are consistent. Such an approach was not applied here because it would require a significantly more complex analysis to model the Greenland and Innuitian ice sheets simultaneously and capture the interactions between them. Of the two corrections applied to the δ18O temperature reconstruction—one associated with height changes of the Innuitian ice sheet and the other with isostatic land motion—the former is potentially the more important in terms of being a significant feedback on the estimated temperature reconstruction because it is not directly constrained via the results of this study. In contrast, the isostatic response was calibrated to RSL data from Ellesmere Island and so even if the regional ice loading history is significantly altered when using the revised temperature reconstruction, the earth viscosity parameters would be varied to maintain an isostatic response that best matches the RSL data. That is, the optimal viscosity model will be different but the isostatic response (and thus land uplift correction) will be similar. Regarding possible changes to the Innuitian ice sheet via revising the temperature reconstruction, the impact of this on the results presented here is difficult to determine without applying an iterative approach. However, we note that a high variance subset of Innuitian ice reconstructions was adopted to partially account for not applying an iterative approach.
The consistency between the proxy records (δ18O and melt records from Agassiz and those shown in Fig. 2), and the good fit between the modeled ice thinning and that inferred from the Camp Century ice core, indicate that the feedbacks noted above are relatively minor and our primary conclusions are accurate to first order. However, this is an aspect of the current analysis that could be improved upon in future studies.
Methods
Inferring Temperature Records from Ice Core Measurements.
The Agassiz δ18O and melt records have been influenced by a thinning ice sheet and isostatic rebound. Therefore, an altitude correction is required to obtain temperature reconstructions that are elevation independent. Although the δ18O is sensitive to elevation changes along the southeast coast of Ellesmere Island, the melt record is affected by elevation changes at the borehole site and so separate altitude corrections are required for each record (Figs. S2 and S3). Previous work has illustrated that local changes in the altitude and thickness of the Agassiz ice cap do not affect the δ18O composition of the ice (9, 11). The atmospheric moisture that precipitates onto the Agassiz ice cap primarily passes through (and partly originates in) Baffin Bay. It subsequently encounters the southeastern shores of Ellesmere Island where it is elevated, and given there are no further inland features capable of forcing the air masses significantly higher, the δ18O composition in the ice is predominantly sensitive to altitude changes along this shoreline (5, 6, 10). Thus, the elevation correction is not determined at the drill site, but rather at the location where the air mass initially encounters a major topographical feature along the eastern coastline of Ellesmere Island. Furthermore, the position where the correction is estimated changes through the Holocene due to topographical changes as the Innuitian ice sheet melted (6). The two processes that dominated altitude changes of southeastern Ellesmere were: (i) GIA and (ii) thinning of Innuitian ice (Figs. S2 and S3). Similar to previous studies (i.e., ref. 6), we assume negligible change in seasonal biases in the δ18O relationships, with snowfall across the Agassiz ice cap occurring throughout the year, although with increased precipitation starting in the spring and decreasing in the fall at present (8).
The Agassiz altitude correction was determined using the GIA model parameters from ref. 6 and Innuitian ice sheet thinning from the analysis of ref. 12. Regarding the latter, a high variance subensemble of the Bayesian calibration specifically weighted to the Innuitian ice sheet was adopted; the best scoring model was used to determine the altitude corrections and the variance from the subensemble represents the uncertainty. Over the early Holocene, Innuitian ice thinned by ∼400 m along southeast Ellesmere and so dominates the altitude correction. In contrast, the mid to late Holocene correction is dominated by GIA of ∼100 m (Figs. S2 and S3). Note that the δ18O measurements were also corrected to account for changes in δ18O content of sea water (26).
The altitude correction for the Agassiz δ18O record was applied through the δ18O altitude relation derived from shallow ice cores [−0.62 ± 0.03 ‰ per 100 m (27, 28)]. A forward modeling method was used to calibrate a temperature–δ18O relationship with the borehole temperature profiles from GRIP, North GRIP (NGRIP), DYE-3, and Camp Century by numerically solving the differential equation for energy conservation in moving ice, yielding a degrees Celsius/δ18O slope of 2.1 ± 0.2 (5, 6, 29). Upon deriving a corrected δ18O record, the temperature–δ18O slope conversion produces the annual air temperature reconstruction for a fixed elevation (present-day borehole elevation), as presented in Fig. S3D.
The Agassiz melt record was related to summer temperatures using a transfer function (7). Summer temperatures and melt layers across a number of shallow Arctic ice cores exhibit a robust linear relationship as shown in Fig. S1 (7, 30). This linear transfer function emphasizes that summer (June–August; JJA) temperatures below −8 °C yield no melt fraction in the ice, therefore, melt percent values of zero signify summer temperatures less than or equal to −8 °C. Similarly, melt percent values of 100 signify summer temperatures above or equal to −3 °C. The elevation changes for the melt record are converted to summer (JJA) temperature using the present-day lapse rate for Ellesmere Island of −0.43 °C per 100 m (7, 30).
The summer temperature to melt percent transfer function is based on present-day observations. This transfer function likely correlates with insolation among other time-varying environmental parameters through the Holocene. However, other processes and feedbacks in the climate system render the temporal calibration of the transfer function highly nontrivial, especially because there is a lack of constraints on key environmental parameters in the high Arctic during this period. Therefore, we assume that the present-day transfer function and its uncertainties adequately capture the temperature to melt percent relationship to first order during the Holocene.
The rate of temperature change from the Agassiz annual temperature reconstruction was determined by discretized differentiation of the Gaussian filtered record presented in Fig. 3A. This provided multicentennial-scale variations in the rate of temperature change (Fig. 3). The centennial trends highlight fluctuations in the rate of temperature change, which are not strongly influenced by noise within the high-resolution δ18O record. However, the low-pass Gaussian filter truncates the record to 100 y before present where edge effects are negligible. To supplement the truncation near present, linear regression was conducted on the raw temperature reconstruction on 200-y intervals starting at present and going back to 600 y before present. This yielded a rate of −0.08, 0.37, and 1.97 °C/century for the periods before present of 600–400 y, 400–200 y, 200 y to present, respectively (Fig. 3).
The error analysis for the Agassiz δ18O temperature reconstruction accounts for the uncertainties arising from: thinning of the Innuitian ice sheet (12); moisture pathway to the Agassiz ice cap (6); δ18O altitude relation (27); and the temperature–δ18O relationship (5, 6, 29). The uncertainties in the temperature reconstruction are nonparametric and for this reason conservative error estimates are presented in this study. When dealing with Gaussian uncertainties (e.g., δ18O altitude relation based on linear regression), traditional error analysis methods were applied. However, when dealing with nonparametric uncertainties, rather than conducting a Monte Carlo error analysis to estimate confidence intervals, the upper and lower bound error estimates were used to evaluate the uncertainties. The choice to present conservative uncertainty estimates in these cases was made to partly compensate for a likely underestimation of nontrivial uncertainties such as the temporal evolution of the δ18O–altitude and temperature–δ18O relationships.
The Agassiz 2009 Extension Core Series.
Starting in the late 1970s, ice-core drilling campaigns have been undertaken at the Agassiz Ice Cap. The studies resulted in Holocene records of stable water isotopes, melt layers, solid conductivity, and pollen (8, 9). The Agassiz A84 and A87 isotope records are based on cores (obtained in those years), which were 100 m apart. In 2010, a 16-m core (A09; 80°49'N, 72°53.74'W) was obtained, located between those earlier cores, to extend the melt and isotope records to 2009 CE. Eight hundred water samples were analyzed at University of Ottawa for 18O using an LGR liquid water isotope analyzer. The OA-ICOS liquid water analyzer was coupled to a CTC LC-PAL autosampler for simultaneous 18O/16O ratio measurements of H2O. Following analysis, all measured water samples were verified for spectral contaminants in the samples using the LGR spectral interference contamination identifier software. Analyses were calibrated and normalized to internal laboratory water standards that were previously calibrated relative to Vienna Standard Mean Ocean Water (VSMOW) using a conventional isotope ratio mass spectrometer. Consequently, the results are presented using the δ-notation (δ18O), which represents the parts per thousand differences for 18O/16O in a sample with respect to VSMOW. Analytical reproducibility for δ18O is ± 0.3‰.
The age–depth timescale for the A09 ice core is described in ref. 7. The A09 core includes a period of overlap (∼30 y) with the deep core melt (ref. 7, their figure 2) and δ18O records from Agassiz. The δ18O overlap shows that the A09 core is properly aligned with the old deep cores and that there is a smooth transition ensuring a homogeneous extended time series. Fig. S4 shows the high-resolution A84, A87, and A09 δ(18O) series.
Greenland Ice-Model Sensitivity Analysis.
The North Greenland sensitivity analysis was conducted using a glaciological model and GIA model of relative sea-level change (22). This previous study produced the Huy3 Greenland reconstruction, which was achieved by simultaneously tuning/calibrating a 3D thermomechanical ice-sheet model in series with a GIA model. Please see ref. 22 for further details on the models applied and methodology followed. We adopt the Huy3 reconstruction here and revise it by tuning the North Greenland climate forcing to reflect our Agassiz temperature reconstruction.
Given that the ice model does not include the adjacent Innuitian ice sheet nor the buttressing effect of potential ice shelves in the Baffin Sea (both of which would result in a thicker last glacial maximum ice sheet in the northwest sector), an alternative method was required to enhance past ice thickness in this region, as suggested by the Camp Century thinning curve. To this end, we decided to vary the input precipitation field because it is poorly constrained and the parameterization schemes previously adopted lacked the necessary degrees of freedom to account for these uncertainties. The temperature forcing across North Greenland was parameterized to coincide with the Agassiz temperature reconstruction. The parameterization of the climate forcing was conducted in a similar manner to that of the Holocene thermal maximum in ref. 22. A tuning of the climate forcing was achieved by adding linear and/or quadratic empirical equation estimates of the enhanced temperatures at Agassiz compared with the GRIP temperature derived climate fields (Fig. 4A shows an example for the Camp Century location). This revision to the GRIP inferred temperatures was extended prior the start of the Agassiz record given the large uncertainties in the climate forcing and thus maintains the necessary degrees of freedom.
Taking the variant model reconstruction, we computed RSL histories for data sites in North Greenland (Fig. S6) to further test the accuracy of the Huy3 model revision. Even though the quality of RSL data from this region is relatively poor (22), these observations are a primary constraint on model reconstructions of the ice history. RSL model predictions for the Huy3 model reconstruction and its variant produced here are compared with observations in Fig. S7. At a number of RSL sites—Holm Land, Ingeborg Halvo, Herlufsholm, Ole Chiewitz—both Huy3 and its variant reconstruction remain within error of the observations when considering uncertainties in the earth viscosity structure (see figures 12 and S6 from ref. 22). It should be noted that there is some ambiguity when interpreting the marine limits (i.e., maximum RSL at a given site) because this quantity represents the highest point reached by sea level when it is ice free, and so represents a dual proxy for ice extent and RSL. Given the sensitivity of this proxy to ice extent, the time at which maximum RSL occurred can be difficult to constrain and so introduces ambiguity into the model–data comparison. At the Kronprins site, the variant reconstruction of Huy3 achieves a perfect fit to the observational constraints by remaining below the upper-limiting and above the lower-limiting RSL dates, including the highest lower-limiting RSL date and marine limit, which the original Huy3 model does not reach. In contrast at Jorgen, no model prediction achieves a fit to the RSL observations. The model curves reach the uppermost lower-limiting dates but do not capture the rapid sea-level fall to reach the oldest upper-limiting date. However, the rapid sea-level fall observed at Jorgen is not observed at other neighboring sites, which might be indicative of local effects that are not captured in regional GIA models. At Constable, the variant reconstruction shows a marginally improved fit over the Huy3 chronology; it reaches the marine limit, remains above the uppermost lower-limiting dates, passes through the sea-level index point, and passes a few meters above the late Holocene upper-limiting RSL dates. However, there is some conflicting data during the early to mid Holocene where upper- and lower-limiting dates and sea-level index points suggest different sea level histories. The RSL predictions generated by the variant reconstruction achieve a significantly improved fit at a number of sites—JPKoch, Nyboe, Hall East, Hall West—compared with Huy3 by remaining within the bounds of the limiting dates. The RSL data at sites Lafayette and Humboldt poorly constrain sea level and therefore do not strongly discriminate between the two model reconstructions.
We applied the same isostatic model to compute vertical land motion at sites in northwest Greenland where GPS receivers have been installed. Because the observed rates of land motion have been corrected for elastic deformation associated with ice loading over the GPS monitoring period (24), the elastic contribution was removed from the model output. Comparing observed and modeled rates in Table S1 indicates that the revised model is an improvement at all sites except those in the northeast (JGBL, KMJP, LEFN, NORD).
Acknowledgments
This work was funded by the Natural Sciences and Engineering Research Council of Canada. This paper is a contribution to the PAGES/INQUA funded PALSEA2 working group.
Footnotes
The authors declare no conflict of interest.
This article is a PNAS Direct Submission.
This article contains supporting information online at www.pnas.org/lookup/suppl/doi:10.1073/pnas.1616287114/-/DCSupplemental.
References
- 1.Stocker TF, et al. IPCC, 2013: Climate Change 2013: The Physical Science Basis. Contribution of Working Group I to the Fifth Assessment Report of the Intergovernmental Panel on Climate Change. Cambridge Univ Press; Cambridge: 2013. [Google Scholar]
- 2.Marcott SA, Shakun JD, Clark PU, Mix AC. A reconstruction of regional and global temperature for the past 11,300 years. Science. 2013;339:1198–1201. doi: 10.1126/science.1228026. [DOI] [PubMed] [Google Scholar]
- 3.Masson-Delmotte V, et al. Climate Change 2013: The Physical Science Basis. Contribution of Working Group I to the Fifth Assessment Report of the Intergovernmental Panel on Climate Change. Cambridge Univ Press; Cambridge: 2013. Information from paleoclimate archives; pp. 383–464. [Google Scholar]
- 4.Bekryaev RV, Polyakov IV, Alexeev VA. Role of polar amplification in long-term surface air temperature variations and modern arctic warming. J Clim. 2010;23:3888–3906. [Google Scholar]
- 5.Vinther BM, et al. Holocene thinning of the Greenland ice sheet. Nature. 2009;461:385–388. doi: 10.1038/nature08355. [DOI] [PubMed] [Google Scholar]
- 6.Lecavalier BS, et al. Revised estimates of Greenland ice sheet thinning histories based on ice-core records. Quat Sci Rev. 2013;63:73–82. [Google Scholar]
- 7.Fisher D, et al. Recent melt rates of Canadian arctic ice caps are the highest in four millennia. Global Planet Change. 2012;84–85:3–7. [Google Scholar]
- 8.Fisher DA, Koerner RM, Reeh N. Holocene climatic records from Agassiz Ice Cap, Ellesmere Island, NWT, Canada. Holocene. 1995;5:19–24. [Google Scholar]
- 9.Koerner RM, Fisher DA. A record of Holocene summer climate from a Canadian high-Arctic ice core. Nature. 1990;343:630–631. [Google Scholar]
- 10.Fisher DA. A zonally-averaged stable-isotope model coupled to a regional variable-elevation stable-isotope model. Ann Glaciol. 1990;14:65–71. [Google Scholar]
- 11.Fisher DA. Stable isotope simulations using a regional stable isotope model coupled to a zonally averaged global model. Cold Reg Sci Technol. 1992;21:61–77. [Google Scholar]
- 12.Tarasov L, Dyke AS, Neal RM, Peltier WR. A data-calibrated distribution of deglacial chronologies for the North American ice complex from glaciological modeling. Earth Planet Sci Lett. 2012;315:30–40. [Google Scholar]
- 13.Renssen H, Seppä H, Crosta X, Goosse H, Roche DM. Global characterization of the Holocene Thermal Maximum. Quat Sci Rev. 2012;48:7–19. [Google Scholar]
- 14.Lacelle D, Pellerin A, Clark ID, Lauriol B, Fortin D. (Micro)morphological, inorganic-organic isotope geochemisty and microbial populations in endostromatolites (cf. fissure calcretes), Haughton impact structure, Devon Island, Canada: The influence of geochemical pathways on the preservation of isotope bioma. Earth Planet Sci Lett. 2009;281:202–214. [Google Scholar]
- 15.Bourgeois JC, Koerner RM, Gajewski K, Fisher DA. A Holocene ice-core pollen record from Ellesmere Island, Nunavut, Canada. Quat Res. 2000;54:275–283. [Google Scholar]
- 16.Fisher DA, et al. Penny ice cap cores, Baffin Island, Canada, and the Wisconsinan foxe dome connection: Two states of Hudson Bay ice cover. Science. 1998;279:692–695. doi: 10.1126/science.279.5351.692. [DOI] [PubMed] [Google Scholar]
- 17.Mayewski Pa, et al. Major features and forcing of high-latitude northern hemisphere atmospheric circulation using a 110,000-year-long glaciochemical series. J Geophys Res. 1997;102:26345–26366. [Google Scholar]
- 18.Dyke AS, Hooper J, Savelle JM. A history of sea ice in the Canadian Arctic archipelago based on postglacial remains of the bowhead whale (Balaena mysticetus) Arctic. 1996;49:235–255. [Google Scholar]
- 19.Dyke AS, Hooper J, Harington CR, Savelle JM. The late Wisconsinan and Holocene record of Walrus (Odobenus rosmarus) from North America: A review with new data from Arctic and Atlantic Canada. Arctic. 1999;52:160–181. [Google Scholar]
- 20.Pithan F, Mauritsen T. Arctic amplification dominated by temperature feedbacks in contemporary climate models. Nat Geosci. 2014;7:2–5. [Google Scholar]
- 21.Collins M, et al. Climate Change 2013: The Physical Science Basis. Contribution of Working Group I to the Fifth Assessment Report of the Intergovernmental Panel on Climate Change. Cambridge Univ Press; Cambridge: 2013. Long-term climate change: Projections, commitments and irreversibility; pp. 1029–1136. [Google Scholar]
- 22.Lecavalier BS, et al. A model of Greenland ice sheet deglaciation constrained by observations of relative sea level and ice extent. Quat Sci Rev. 2014;102:54–84. [Google Scholar]
- 23.MacGregor JA, et al. Holocene deceleration of the Greenland Ice Sheet. Science. 2016;351:590–593. doi: 10.1126/science.aab1702. [DOI] [PubMed] [Google Scholar]
- 24.Khan SA, et al. Geodetic measurements reveal similarities between post-Last Glacial Maximum and present-day mass loss from the Greenland ice sheet. Sci Adv. 2016;2:e1600931. doi: 10.1126/sciadv.1600931. [DOI] [PMC free article] [PubMed] [Google Scholar]
- 25.Shepherd A, et al. A reconciled estimate of ice-sheet mass balance. Science. 2012;338:1183–1189. doi: 10.1126/science.1228102. [DOI] [PubMed] [Google Scholar]
- 26.Waelbroeck C, et al. Sea-level and deep water temperature changes derived from benthic foraminifera isotopic records. Quat Sci Rev. 2002;21:295–305. [Google Scholar]
- 27.Dahl-Jensen D, et al. NEEM community members Eemian interglacial reconstructed from a Greenland folded ice core. Nature. 2013;493:489–494. doi: 10.1038/nature11789. [DOI] [PubMed] [Google Scholar]
- 28.Johnsen SJ, Dansgaard W, White JWC. The origin of Arctic precipitation under present and glacial conditions. Tellus B Chem Phys Meterol. 1989;41:452–468. [Google Scholar]
- 29.Dahl-Jensen D, et al. Past temperatures directly from the Greenland ice sheet. Science. 1998;282:268–271. doi: 10.1126/science.282.5387.268. [DOI] [PubMed] [Google Scholar]
- 30.Marshall SJ, Sharp MJ, Burgess DO, Anslow FS. Near-surface-temperature lapse rates on the Prince of Wales Icefield, Ellesmere Island, Canada: Implications for regional downscaling of temperature. Int J Climatol. 2007;27:385–398. [Google Scholar]
- 31.Tarasov L, Peltier WR. Greenland glacial history and local geodynamic consequences. Geophysical Journal International. 2002;150:198–229. [Google Scholar]
- 32.Simpson MJ, Milne GA, Huybrechts P, Long AJ. Calibrating a glaciological model of the Greenland ice sheet from the Last Glacial Maximum to present-day using field observations of relative sea level and ice extent. Quat Sci Rev. 2009;28:1631–1657. [Google Scholar]


