Significance
Multiple sclerosis is a brain and spinal cord disease. In the most common forms, the disease unfolds by switching between periods of relapses, during which symptoms rise, and remissions, during which symptoms decline. However, it is not yet possible to predict the occurrence of relapses and remissions. Today, the diagnosis of multiple sclerosis is based on clinical criteria and on the use of magnetic resonance imaging (MRI). Here, we developed an MRI method that helps predict relapses and remissions in a classical model of multiple sclerosis in the mouse.
Keywords: MPIO, spinal cord, contrast agent, blood–brain barrier, USPIO
Abstract
New strategies for detecting disease activity in multiple sclerosis are being investigated to ameliorate diagnosis and follow-up of patients. Today, although magnetic resonance imaging (MRI) is widely used to diagnose and monitor multiple sclerosis, no imaging tools exist to predict the evolution of disease and the efficacy of therapeutic strategies. Here, we show that molecular MRI targeting the endothelial adhesion molecule P-selectin unmasks the pathological events that take place in the spinal cord of mice subjected to chronic or relapsing experimental autoimmune encephalomyelitis. This approach provides a quantitative spatiotemporal follow-up of disease course in relation to clinical manifestations. Moreover, it predicts relapse in asymptomatic mice and remission in symptomatic animals. Future molecular MRI targeting P-selectin may be used to improve diagnosis, follow-up of treatment, and management of relapse/remission cycles in multiple sclerosis patients by providing information currently inaccessible through conventional MRI techniques.
Multiple sclerosis (MS) is a chronic inflammatory disease of the central nervous system (CNS) that leads to demyelination and diffuse neurodegeneration in the brain and spinal cord (1). The most frequent form (relapsing–remitting subtype) is characterized by unpredictable relapses followed by periods of months to years during which signs of disease activity are absent (2). The less frequent form (primary progressive subtype) is characterized by a constant progression of disability from the onset, with no, or only occasional and minor, remissions or improvements (2). Discovering biomarkers to predict disease evolution and/or therapeutic response in MS remains a major clinical challenge. Today, magnetic resonance imaging (MRI) is widely used to diagnose and monitor MS disease evolution (3), mostly by quantification of Gadolinium-chelate enhancing lesions, corresponding to active lesions with ruptured blood–brain barrier (BBB) or blood–spinal cord barrier (BSCB) (3). Although current MRI protocols allow quantifying lesion load, they remain poorly predictive of disease evolution and often fail to make early diagnosis of MS without follow-up imaging. This is an important limitation, because treatments could be started earlier if better diagnostic tools existed (4).
Leukocyte recruitment to CNS tissues plays a major role in MS. This process is mediated by adhesion molecules expressed on endothelial cells (5). We and others have described that antibodies against these endothelial adhesion molecules, coupled to microparticles of iron oxide (MPIOs), can monitor inflammation in animal models of brain diseases (6–8). Platelet-selectin (P-selectin), for example, can be targeted to monitor early vascular inflammation (9). P-selectin is rapidly expressed at the cell surface during endothelial activation in conditions of injury (10, 11), where it regulates myelin-specific T lymphocyte rolling on the endothelium (12, 13), a process important in the pathophysiology of MS models (13, 14). In fact, P-selectin has been detected in the brain and spinal cord of experimental autoimmune encephalomyelitis (EAE) mice (15). P-selectin is therefore an ideal target for early detection of vascular inflammation in MS and its animal models. Here, we developed the framework allowing in vivo molecular MRI of endothelial activation and prediction of disease activity in two peptide-induced models of MS: chronic and relapsing–remitting experimental autoimmune encephalomyelitis [respectively, myelin oligodendrocyte glycoprotein (MOG)-induced EAE in C57BL/6 mice or proteolipidic protein (PLP)-induced EAE in SJL/J mice], mimicking the primary progressive and relapsing–remitting forms of MS, respectively.
Results
Characterization of MPIOs-αP-Selectin Binding to Activated BSCB Endothelium in EAE Mice.
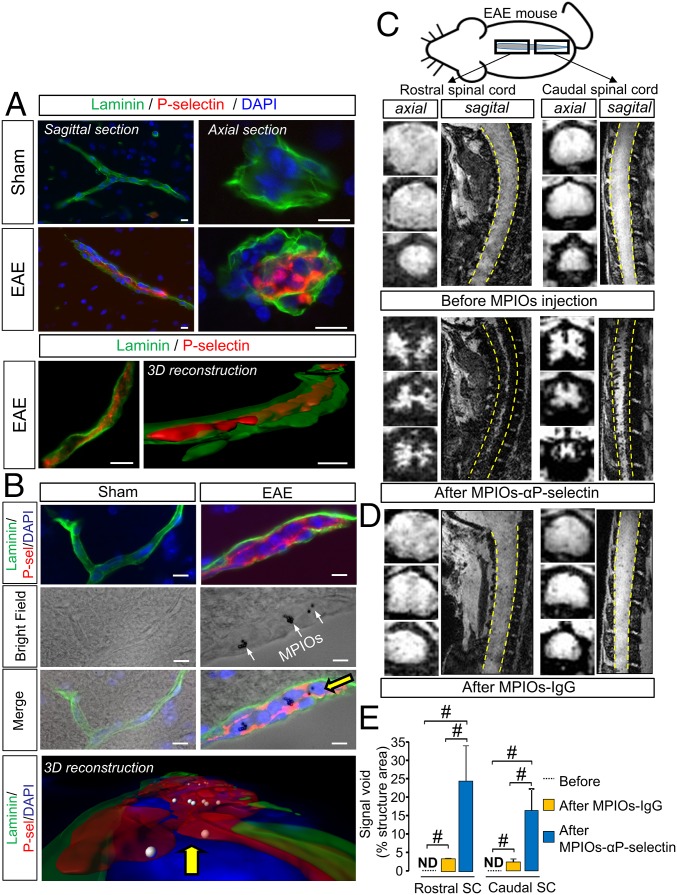
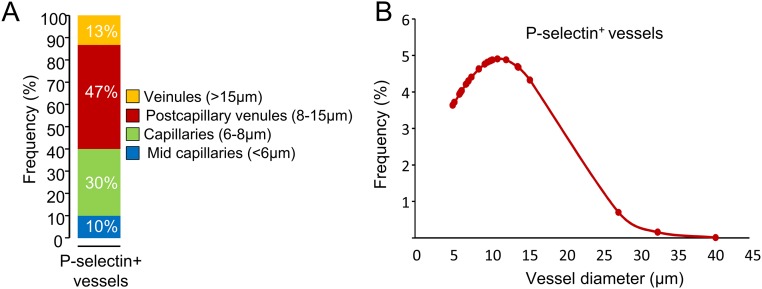
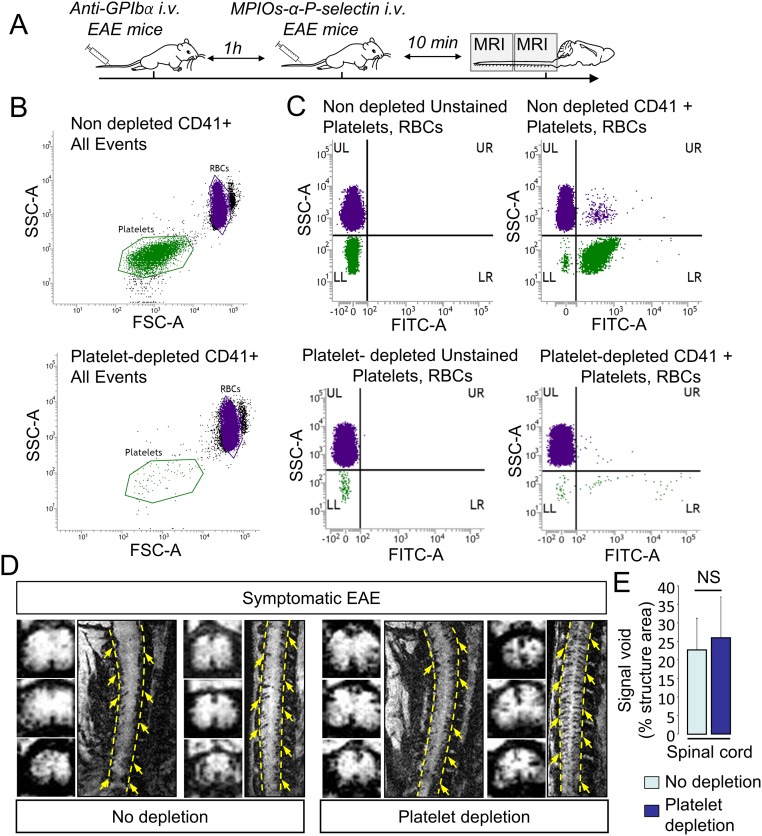
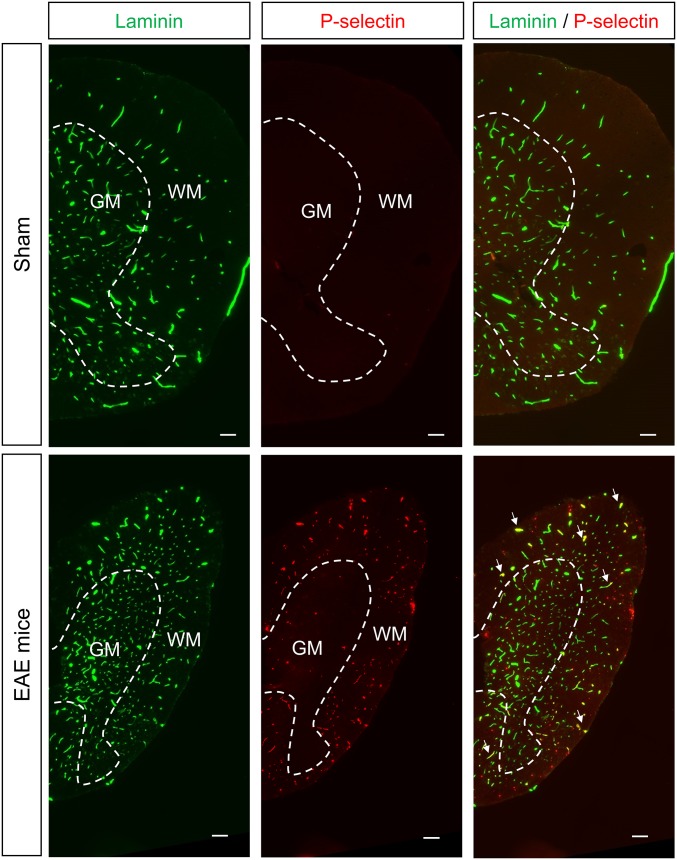
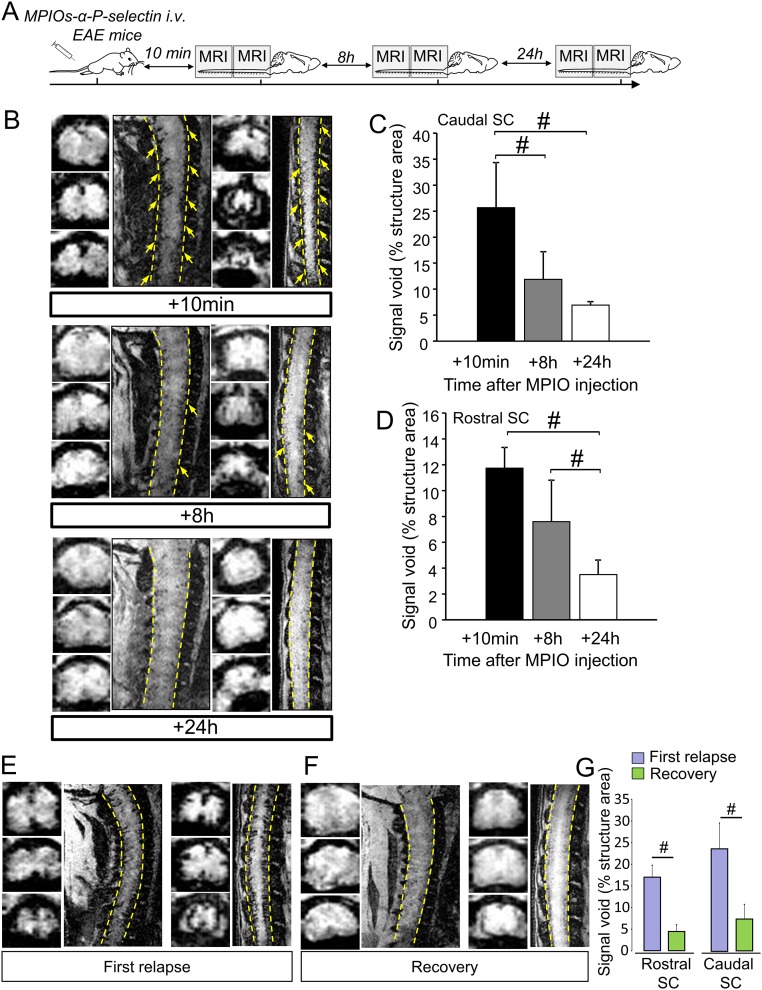
We first validated that P-selectin antibody binds the spinal cord endothelium of EAE, but not sham, animals (Fig. 1A) at the luminal surface (3D reconstruction, Fig. 1A) of small capillaries (preferentially postcapillary venules; Fig. S1). This antibody was then coupled to MPIOs to form MPIOs-αP-selectin, which bound the vascular endothelium after i.v. injection in EAE, but not in sham, animals (Fig. 1B). No signal void was observed in MRI (3D T2*-weighted imaging) without MPIO injection (Fig. 1C). In contrast, i.v injection of MPIOs-αP-selectin induced signal void within the whole spinal cord of PLP-induced EAE mice (Fig. 1C), whereas untargeted MPIOs (MPIOs-IgG) did not (Fig. 1D). Signal void was very similar when platelets were deleted (Fig. S2 A–C) than in nondepleted animals (Fig. S2E), indicating that MPIOs-αP-selectin–induced signal void is not influenced by P-selectin expression on platelets. Signal void was restricted to the white matter (Fig. 1 C and E and Fig. S3), the preferential localization of EAE lesions. The contrast agent was progressively cleared from the spinal cord in a time-dependent manner, resulting in minimal background contrast 24 h after MPIOs-αP-selectin injection (Fig. S4), which allows repetitive assessment of endothelial activation in the spinal cord with a minimal lapse of 24 h. Together, these results demonstrated the feasibility of sensitive and semiquantitative imaging of endothelial activation in the mouse spinal cord after i.v. injection of MPIOs-αP-selectin.
Fig. 1.
MPIOs-αP-selectin–enhanced MRI reveals endothelial activation in the spinal cord during EAE. (A and B) Immunohistological images (Upper) and 3D reconstruction (Lower) (red, P-selectin; green, laminin; blue, DAPI) of sagittal and axial sections of spinal cord vessel from PLP-induced EAE mice (first relapse) and sham mice without (A) or with (B) i.v. injection of MPIOs-αP-selectin. (Scale bars: 10 µm.) White arrows, MPIOs-αP-selectin; yellow arrow, point of view compared with the above image. (C and D) Representative axial and sagittal T2*-weighted images of the rostral (Left) and caudal (Right) spinal cord (dashed line) of PLP-induced EAE mice before and after MPIOs-αP-selectin or MPIOs-IgG injection. (E) Corresponding quantification. ND, nondetected. n = 3–4 per group. #P < 0.05. See Table S1 for detailed sample size.
Fig. S1.
P-selectin is mainly expressed in small vessels. (A) Proportion of sizes of P-selectin+ vessels. (B) Probability density curve of sizes of P-selectin+ vessels.
Fig. S2.
MPIOs-αP-selectin–induced hyposignal is not due to binding in platelets. (A) Schematic representation of experimental design. (B) Flow cytometry analyses of anticoagulated whole blood in nondepleted and depleted animals. Forward- and side-scatter density plots show that RBC (purple dots) and platelet (green dots) populations are clearly distinguishable based on their respective light scatter patterns. (C) Box plot analyses of blood samples upon staining with anti-CD41 show platelet-positive events (green dots). (D) Representative high-resolution T2*-weighted images after MPIOs-αP-selectin injection in depleted (Right) and nondepleted (Left) animals. (E) Corresponding signal void quantification (n = 4 per group). NS, not significant.
Fig. S3.
P-selectin is expressed preferentially in the white matter. Representative immunohistological images of half spinal cord from thoracic PLP-induced EAE mice (first relapse) and sham mice. Green, laminin; red, P-selectin (n = 3 per group). (Scale bar: 100 µm.) GM, gray matter; WM, white matter.
Fig. S4.
MPIOs-αP-selectin enhanced MRI is compatible with longitudinal follow up of disease activity. (A) Experimental design of the longitudinal study of the MPIO-αP-selectin stall after i.v. injection. (B) Representative high-resolution T2*-weighted images after MPIOs-αP-selectin injection at indicated times (Top, +10 min; Middle, +8 h; Bottom, +24 h). (C) Corresponding signal void quantification of the caudal spinal cord (n = 4 per group). #P < 0.05. (D) Corresponding signal void quantification of the rostral spinal cord (n = 4 per group). #P < 0.05. (E) Representative axial and sagittal T2*-weighted images of the spinal cord of PLP-induced EAE mice during first relapse. (F) Representative axial and sagittal T2*-weighted images after MPIOs-αP-selectin of the same PLP-induced EAE mice (during recovery). (G) Corresponding signal void quantification of the caudal and rostral spinal cord (n = 3 per group). #P < 0.05.
MPIOs-αP-Selectin Signal Increases with the Clinical Score in MOG-Induced EAE Mice.
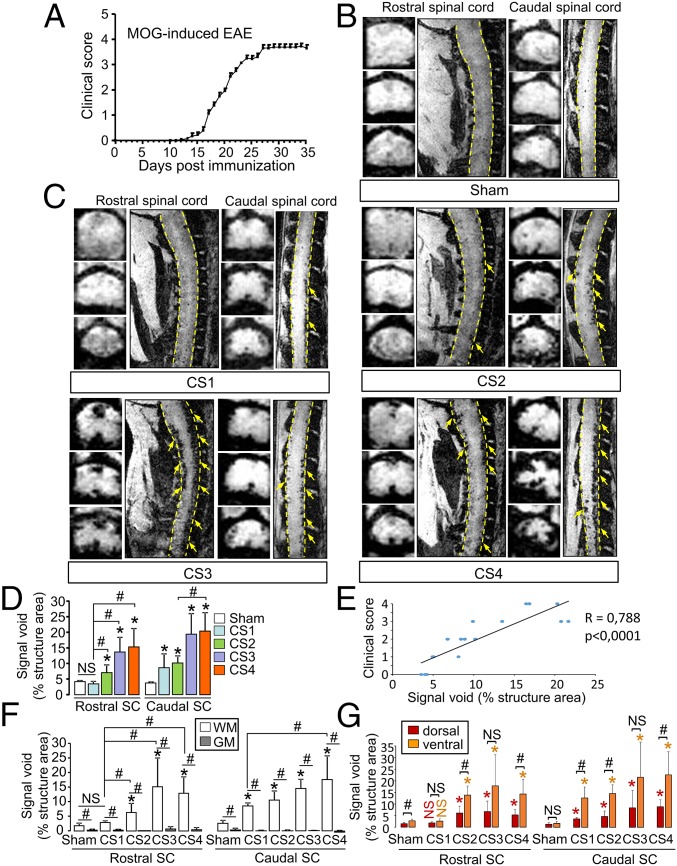
Then, we investigated whether MPIOs-αP-selectin could reveal the spatial and temporal dissemination of endothelial activation in chronic EAE mice (MOG-induced EAE; Fig. 2A). In sham animals, signal void was negligible (<5% of structure area) in rostral and caudal spinal cord (Fig. 2D). MOG-induced EAE animals showed a gradual caudo-rostral increase in MPIOs-αP-selectin–induced signal void correlated to increase in clinical score (Fig. 2C and corresponding quantification, Fig. 2 D and E). Signal void was detected both in the ventral and dorsal parts of the spinal cord and was restricted to the white matter (Fig. 2C and corresponding quantification, Fig. 2 F and G).
Fig. 2.
Spatiotemporal distribution of MPIOs-αP-selectin–induced hyposignal follows the clinical worsening in chronic EAE mice (MOG-induced EAE). (A) Clinical score (CS) evolution in MOG-induced EAE. (B and C) Representative axial and sagittal T2*-weighted images of rostral and caudal spinal cord (dashed line) after MPIOs-αP-selectin injection did not reveal induced signal void in sham (B) or EAE (C) mice. Yellow arrows, signal void. (D) Corresponding quantification. NS, not significant; *P < 0.05 vs. the same structure in sham animals; #P < 0.05. (E) Correlation between signal void and clinical score. (F and G) Quantification of the signal void distribution between white matter (WM; white bar) and gray matter (GM; gray bar) (F) and between dorsal (red bar) and ventral (orange bar) spinal cord (G) (quantified from coronal images). NS, not significant; *P < 0.05 vs. sham in the same structure; #P < 0.05 vs. indicated condition. See Table S1 for detailed sample size.
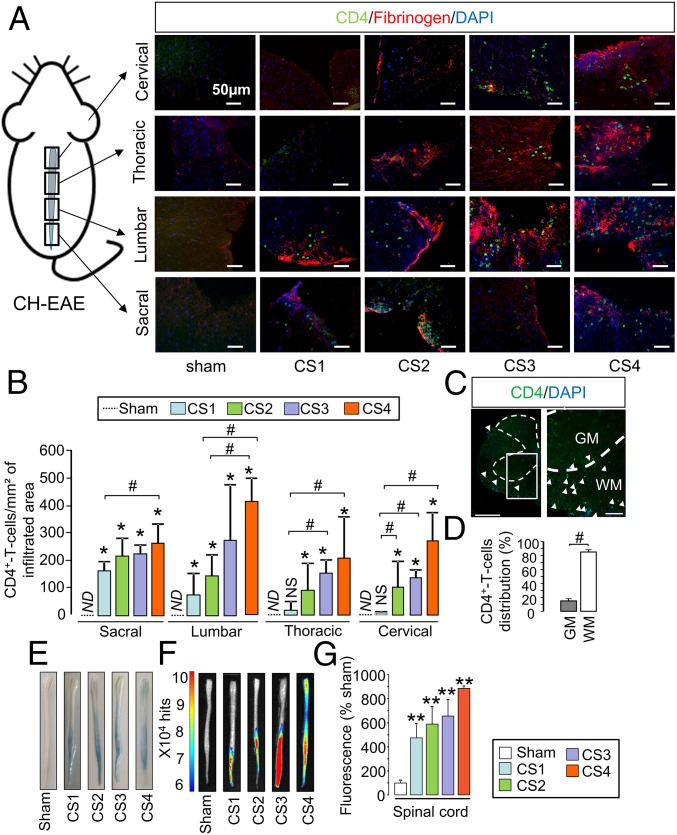
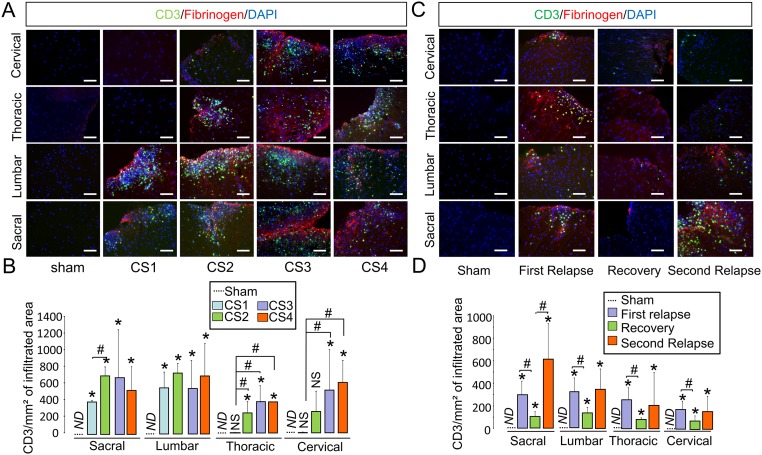
Because P-selectin is involved in T lymphocyte infiltration toward inflamed tissues, we assessed whether this infiltration matched the distribution of MPIOs-αP-selectin–induced signal. In fact, the infiltration of T4 lymphocytes (CD4+ cells) followed a caudo-rostral progression over time in relation to clinical score (CS1–CS4), equivalent to what we observed for MPIOs-αP-selectin (Fig. 3A and corresponding quantification, Fig. 3B). No infiltration was observed in sham mice (Fig. 3 A and B), whatever the spinal cord segment. Similar observations were made concerning CD3+ cells (Fig. S5 A and B). Matching MPIOs-αP-selectin signal, T4 lymphocytes infiltration was specific of the white matter (Fig. 3C and corresponding quantification; Fig. 3D). This infiltration occurred at sites of increased BSCB permeability, as shown by colocalization with fibrinogen (Fig. 3A and Fig. S5A). Increase in BSCB permeability followed a caudo-rostral progression over time in relation to clinical score (Fig. 3 E and F and corresponding quantification, Fig. 3G), which paralleled T4 lymphocyte infiltration (Fig. 3A) and P-selectin signal observed in MRI (Fig. 2).
Fig. 3.
Spatiotemporal dissemination of the immune cell infiltration and BSCB opening follow the pattern of P-selectin vascular activation in the spinal cord of MOG-induced EAE mice. (A) Immunohistological images of the infiltrated areas of the MOG-induced EAE spinal cord. CD4+ leukocyte (green), fibrinogen (red), and cell nuclei (blue) show the spatiotemporal dissemination of immune cell infiltration. Each line of images corresponds to a spinal cord section (in order from top to bottom: cervical, thoracic, lumbar, and sacral). Each column corresponds to a clinical score (CS; CS1 to CS4). (Scale bars: 50 µm.) (B) Corresponding quantification. ND, nondetected; *P < 0.05 vs. the same structure in sham animals; #P < 0.05 vs. indicated condition. n = 3 mice for each clinical group. (C) Immunohistological image of whole section of MOG-induced EAE spinal cord (peak of the disease) with a low (Left) and a high (Right) magnification. [Scale bars: 500 µm (Left) and 100 µm (Right).] GM, gray matter; WM, white matter. (D) Whole spinal cord quantification of the distribution of the CD4+ T-cell infiltration between white matter (white bar) and gray matter (gray bar). #P < 0.05. (E) Spinal cord photographs after i.v. Evans blue dye injection in MOG-induced EAE. (F) Ex vivo optical imaging of Evans blue fluorescence. (G) Quantification of fluorescence in spinal cord tissues. **P < 0.01 vs. the same structure in sham animals. See Table S1 for detailed sample size.
Fig. S5.
Spatiotemporal dissemination of the CD3+ cell infiltration in the spinal cord of MOG- and PLP-induced EAE models. (A) Immunohistological images of the infiltrated areas of the MOG-induced EAE spinal cord. CD3+ leukocyte (green), fibrinogen (red), and cell nuclei (blue) show the spatiotemporal dissemination of immune cell infiltration. Each line of images corresponds to a spinal cord section (in order from top to bottom: cervical, thoracic, lumbar, and sacral). Each column corresponds to a clinical score (CS; CS1–CS4; n = 3 per group). (Scale bar = 50 μm.) (B) Corresponding quantification of the number of CD3+ T cells per infiltrated area in MOG-induced EAE. ND, nondetected; *P < 0.05 vs. the same structure in sham animals; #P < 0.05 vs. indicated condition. n = 3 mice for each clinical group. (C) Immunohistological images of the infiltrated areas of the PLP-induced EAE spinal cord. CD3+ leukocyte (green), fibrinogen (red), and cell nuclei (blue) show the spatiotemporal dissemination of immune cell infiltration. Each line of images corresponds to a spinal cord section (in order from top to bottom: cervical, thoracic, lumbar, and sacral). Each column corresponds to a clinical score (CS; CS1–CS4; n = 3 per group). (Scale bar = 50 μm.) (D) Corresponding quantification of the number of CD3+ T-cells per infiltrated area in PLP-induced EAE. ND, nondetected; *P < 0.05 vs. the same structure in sham animals; #P < 0.05 vs. indicated condition. n = 3 mice for each clinical group.
MPIOs-αP-Selectin Signal Follows Disease Activity in PLP-Induced EAE Mice.
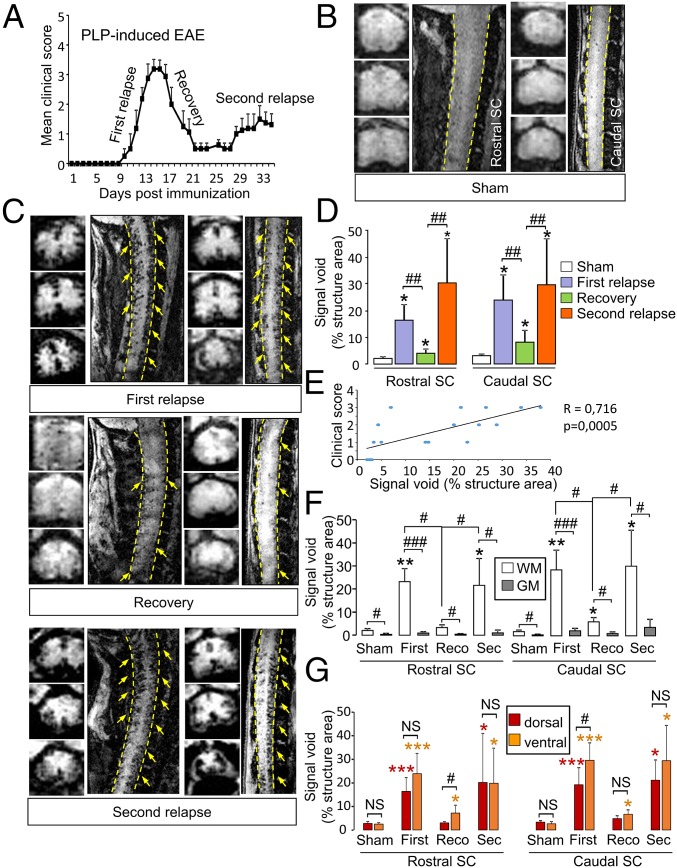
Our next step was to assess whether of MPIOs-αP-selectin can reveal the spatial and temporal dissemination of endothelial activation in a disease with a relapsing–remitting course (PLP-induced EAE; Fig. 4A). In sham animals, signal void was negligible (<5% of structure area) in caudal and rostral spinal cord (Fig. 4B and corresponding quantification, Fig. 4D). MPIOs-αP-selectin signals in the caudal and rostral spinal cord revealed endothelial activation in phases of active disease (first and second relapse; Fig. 4C). Accordingly, this signal was lower during phases of disease recovery (Fig. 4C). Corresponding quantification confirmed these MRI observations (Fig. 4D): Signal void increased during the first relapse in the caudal spinal cord (23.90% vs. 3.12% for sham mice at the same time, P < 0.05; Fig. 4D) and in the rostral cord (18.03% vs. 2.01% for sham mice at the same time, P < 0.05; Fig. 4D). During recovery, signal void decreased compared with the first relapse in the caudal spinal cord (8.11%; P < 0.01; Fig. 4D) and in the rostral spinal cord (3.99%; P < 0.01; Fig. 4D). Interestingly, signal void was higher in remitting animals (recovery) than in sham mice (3.12% vs. 8.11% and 2.01% vs. 3.99%; P < 0.05; Fig. 4D). This result was observed either when MRI sessions were performed after single injections in different animals (Fig. 4 C and D) or when the same animals were injected and scanned twice (Fig. S4 E–G), which shows that the remaining signal was not from previous injections. During the second relapse stage, signal void increased again compared with recovery (29.61% vs. 8.11% for caudal spinal cord and 30.29% vs. 3.99% for rostral spinal cord; P < 0.01; Fig. 4D) to reach levels comparable to what observed during the first relapse. Overall, MPIOs-αP-selectin–induced signal void in the spinal cord was positively correlated to clinical score (Fig. 4E). As observed for MOG-induced EAE (Fig. 2), signal void was detected in the dorsal and ventral parts of the spinal cord and restricted to white matter (Fig. 4C and corresponding quantification, Fig. 4 F and G).
Fig. 4.
Spatiotemporal distribution of MPIOs-αP-selectin–induced hyposignal follows the clinical worsening in relapsing–remitting EAE mice (PLP-induced EAE). (A) Clinical score evolution in PLP-induced EAE. (B and C) Representative axial and sagittal T2*-weighted images of rostral and caudal spinal cord (dashed line) after MPIOs-αP-selectin injection in sham (B) or EAE (C) mice. Yellow arrows, signal void. (D) Corresponding signal void quantification of MPIOs-αP-selectin–induced signal voids in the spinal cord (quantified from sagittal images). *P < 0.05 vs. sham animals in the same structure; #P < 0.05; ##P < 0.01 vs. indicated condition. (E) Correlation analysis between void and clinical score. (F and G) Quantification of the signal void distribution between white matter (WM; white bar) and gray matter (GM; gray bar) (F) and between dorsal (red bar) and ventral (orange bar) spinal cord (G) (quantified from coronal images). *P < 0.05; **P < 0.01 vs. sham animals in the same structure; #P < 0.05; ##P < 0.01; ###P < 0.001 vs. indicated condition. See Table S1 for detailed sample size.
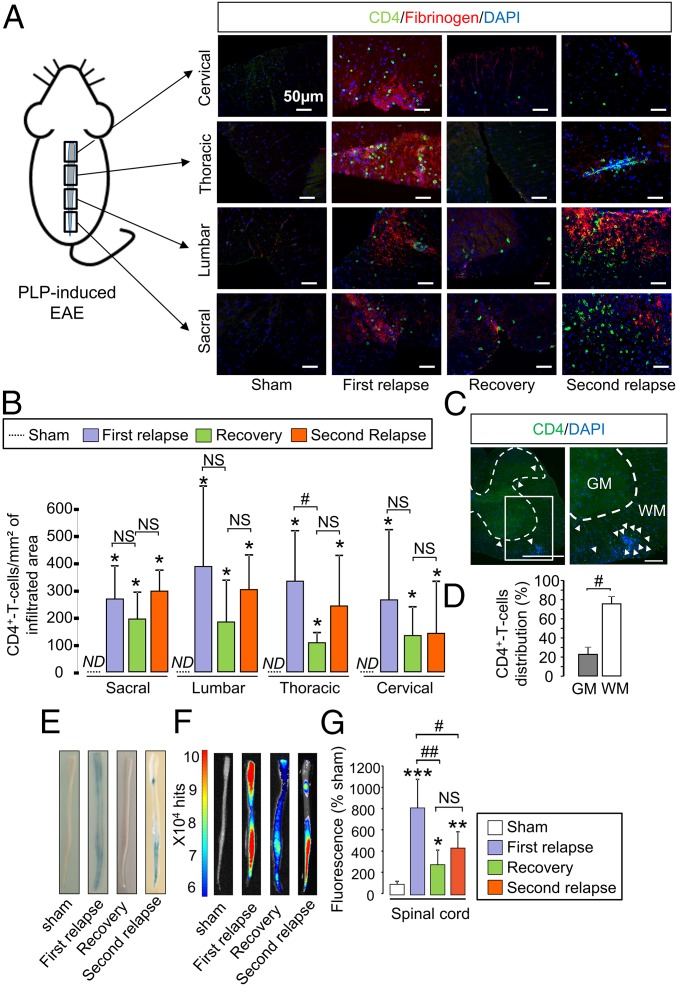
We then assessed whether, as observed above in MOG-induced EAE (Fig. 3), T4 lymphocyte infiltration matched the distribution of MPIOs-αP-selectin–induced signal (Fig. 5A). The simple quantification of the number of lymphocytes within affected tissues did not give a direct indication of disease activity. Although T4 lymphocyte infiltration was maximum in all spinal cord segments (sacral, lumbar, thoracic, and cervical) during the first relapse (Fig. 5B), the number of T4 lymphocytes was not substantially altered during recovery (Fig. 5B), despite a tendency to decrease. In line with this finding, the number of T4 lymphocytes also remained stable during the second relapse (Fig. 5B). As already shown above in the MOG-induced EAE model (Fig. 3A), lymphocyte infiltration occurred at sites of increased blood–spinal cord permeability (as shown by colocalization with fibrinogen, Fig. 5A and Fig. S5 C and D). Nevertheless, changes in BSCB permeability did not fully match disease activity (Fig. 5 E and F and corresponding quantification, Fig. 5G): Permeability increased in all spinal cord segments during the first relapse, decreased during recovery but remained above sham levels during the remission period, and did not increase substantially during the second relapse.
Fig. 5.
Spatiotemporal dissemination of the immune cell infiltration and BSCB opening do not follow the pattern of P-selectin vascular activation in the spinal cord of PLP-induced EAE mice. (A) Immunohistological images of the infiltrated areas of the PLP-induced EAE spinal cord. CD4+ leukocyte (green), fibrinogen (red), and cell nuclei (blue) show the spatiotemporal dissemination of the immune cell infiltration. Each line of images corresponds to a spinal cord section (in order from top to bottom: cervical, thoracic, lumbar, and sacral). Each column corresponds to a different stage of the disease (sham, first relapse, recovery, and second relapse; n = 3 per group). (B) Corresponding quantification. ND, nondetected; NS, not significant; *P < 0.05 vs. sham animals in the same structure; #P < 0.05 vs. indicated condition (n = 3 mice for each clinical group). (C) Immunohistological image of whole section of PLP-induced EAE spinal cord (peak of the first relapse) with a low magnification (Left) and a high magnification (Right). [Scale bars: 500 µm (Left) and 100 µm (Right).] GM, gray matter; WM, white matter. (D) Quantification of the distribution of the CD4+ T-cell infiltration between the white matter (white bar) and in the gray matter (gray bar). #P < 0.05. (E) Spinal cord photographs after i.v. Evans blue dye injection in PLP-induced EAE. (F) Ex vivo optical imaging of Evans blue fluorescence. (G) Quantification of fluorescence in spinal cord tissues. *P < 0.05; **P < 0.01; ***P < 0.001 vs. the same structure in sham animals; #P < 0.05, ##P < 0.01 vs. indicated condition. See Table S1 for detailed sample size.
In the same manner as described above for MOG-induced EAE, in PLP-induced EAE, the distribution of T4 lymphocytes between spinal gray and white matter matched that of MPIOs-α P-selectin: T4 lymphocyte infiltration occurred preferentially in the white matter compared with the gray matter (Fig. 5C and corresponding quantification, Fig. 5D).
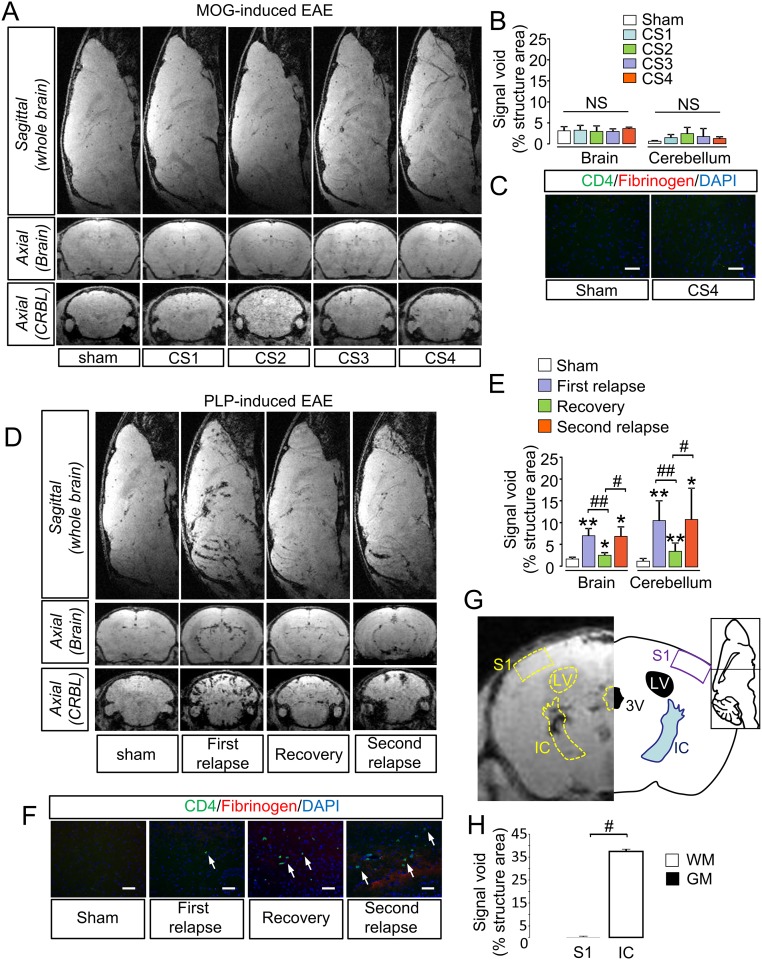
MRI using MPIOs-αP-selectin was also performed in the brain and cerebellum (Fig. S6). In MOG-induced EAE, no change in signal void was observed in the brain or cerebellum at any of the clinical stages compared with sham animals (Fig. S6A and corresponding quantification, Fig. S6B), which was consistent with the absence of lymphocyte infiltration (Fig. S6C). In contrast, in PLP-induced EAE, MRI using MPIOs-αP-selectin showed a profile comparable to the spinal cord (Fig. S6 D–F), preferentially in the white matter (Fig. 6 G and H). Overall, these results support the use of MPIOs-αP-selectin–enhanced MRI to detect the severity and the spatiotemporal dissemination of endothelial activation in EAE.
Fig. S6.
MPIOs-αP-selectin–enhanced MRI allows measurement of endothelial activation in brain and cerebellum. (A) Representative axial and sagittal T2*-weighted images of brain and cerebellum (CRBL) after MPIOs-αP-selectin injection did not reveal induced signal void in MOG-induced EAE mice. (B) Quantification of MPIOs-αP-selectin–induced signal voids in brain and cerebellum of MOG-induced EAE. NS, not significant. (C) Immunohistological images of the MOG-induced EAE brain and cerebellum show the absence of CD4+ leukocytes infiltration. (D) Axial and sagittal molecular imaging of P-selectin (T2*-3D–weighted images) in PLP-induced EAE revealed increase in MPIOs-αP-selectin induced signal void in brain and cerebellum (CRBL) during the first relapse, and a decrease in MPIOs-αP-selectin signal void during the recovery. MPIOs-αP-selectin–induced signal void reappears during second relapse. (E) Quantification of MPIOs-αP-selectin induced signal voids in brain and cerebellum of PLP-induced EAE. *P < 0.05; **P < 0.01 vs. sham animals in the same structure; #P < 0.05; ##P < 0.01 vs. indicated condition. n = 4–6 mice for each clinical group. (F) Representative immunohistological images of the infiltrated areas of the PLP-induced EAE brain. CD4 leukocyte (green), fibrinogen (red), and cell nuclei (blue) by epifluorescence microscopy allows observing the spatiotemporal dissemination of the immune cells infiltration. (G, Right) Distribution of MPIOs-αP-selectin induced signal voids in one white matter region (somatosensory cortex 1, S1) and one gray matter region (internal capsule, IC) in the brain, with corresponding atlas (G, Left). (H) Quantification of MPIOs-αP-selectin–induced signal voids in cerebral gray (somatosensory cortex 1 S1) and white matter (internal capsule, IC). #P < 0.05.
Fig. 6.
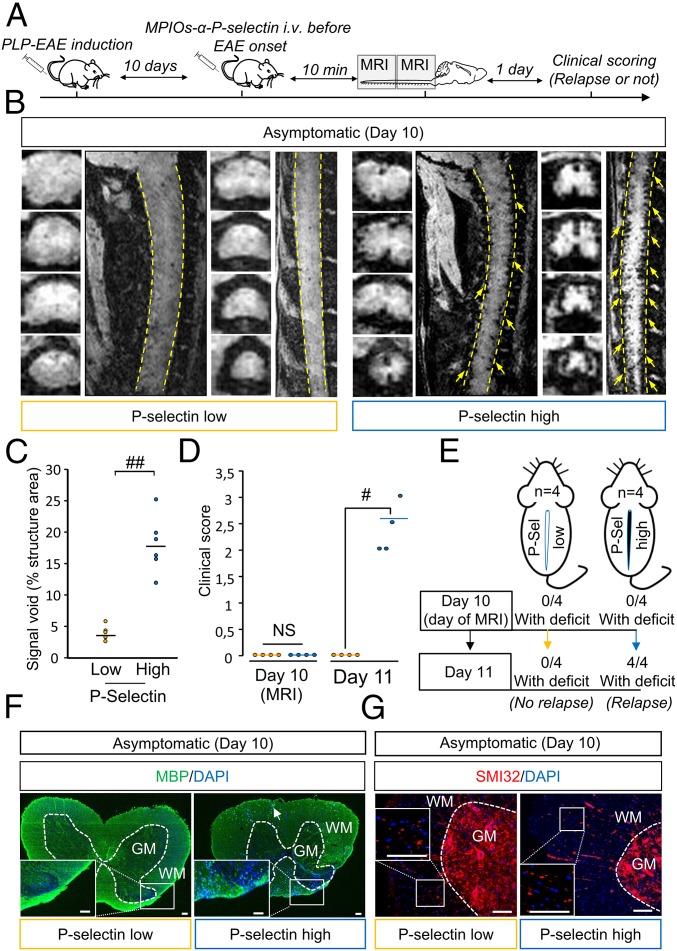
MPIOs-αP-selectin–induced hyposignal predicts relapses in PLP-induced EAE. (A) Experimental design. (B) Representative high-resolution T2*-weighted images after MPIOs-α P-selectin injection PLP-induced EAE mice without deficits (CS 0 at day 10; D10). Yellow arrows indicate signal voids. (C) Corresponding signal void quantification. ##P < 0.01. (D) Clinical score of P-selectin-high (blue line) or -low (yellow line) mice the day of MRI acquisition (D10) and the day after (D11). #P < 0.05. (E) Schematic representation of the main findings. (F) Representative immunohistological images of myelin basic protein (MBP; green) and cell nuclei (blue) in asymptomatic P-selectin-low and -high animals. (G) Representative immunohistological images of axonal damage (SMI-32; red) and cell nuclei (blue) in asymptomatic P-selectin-low and asymptomatic P-selectin-high animals. (Scale bars: 100 µm.) See Table S1 for detailed sample size.
MPIOs-α P-Selectin Allows for Predicting Relapses in Asymptomatic Animals and Remissions in Symptomatic Animals.
We first assessed the ability of MPIOs-αP-selectin to predict the appearance of a first relapse in asymptomatic animals (Fig. 6). Asymptomatic animals (clinical score 0) were injected i.v. with MPIOs-αP-selectin at day 10 (median day of first relapse) and subjected to molecular imaging (Fig. 6 A and B). We stratified two groups of mice based on their endothelial activation profile at day 10 (Fig. 6 B and C) and monitored them clinically for the occurrence or not of a second relapse at day 11 (Fig. 6A). A first group (P-selectin-low) showed little, if any, signal void in MRI (individual signal void <5%, mean signal void: 3.69 ± 1.12%; Fig. 6 B and C) and a second group (P-selectin-high) showed substantial MPIOs-αP-selectin signal void in MRI (individual signal void > 5%, mean signal void: 17.77 ± −4.5%; Fig. 6 B and C). Interestingly, none of the EAE animals within the P-selectin−low group showed a second relapse 24 h later (day 11) (Fig. 6D: mean clinical score 0. Fig. 6E: 0 animals with deficit at day 11). Conversely, all P-selectin-high animals declared a first relapse 24h later (day 11) (Fig. 6D: mean clinical score 2.4 ± 0.48. Fig. 6E: 100% of animals showing deficits at day 11). P-selectin-low animals did not show overt demyelination (Fig. 6F, Left), whereas P-selectin-high animals did (punctuate or absent MBP immunostaining Fig. 6F, Right). Axonal damage was, however, present in P-selectin-high and P-selectin-low animals (SMI-32 staining; Fig. 6G).
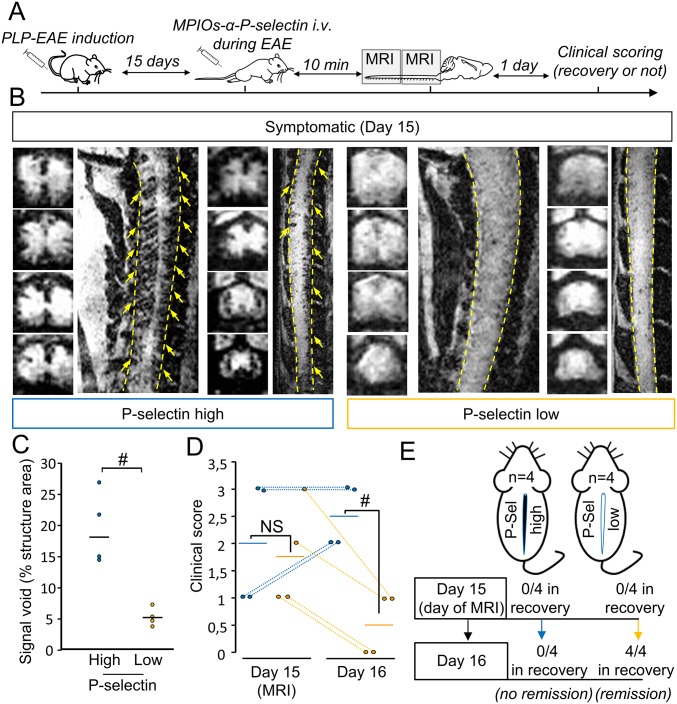
Second, we assessed whether MPIOs-αP-selectin imaging could predict remission in symptomatic animals (Fig. S7). Symptomatic animals were injected with MPIOs-αP-selectin at disease peak (day 15) and subjected to molecular imaging (Fig. S7 A and B). Following the same strategy as above, we stratified two groups of mice (P-selectin-low and P-selectin-high) based on their MRI profile at day 15 (Fig. S7 B and C) and monitored them clinically for the occurrence or not of a remission at day 16 (Fig. S7A). Interestingly, none of the EAE animals within the P-selectin-high group showed remission 24 h later (day 16) (Fig. S7D: mean clinical score 2.5 ± 0.57. Fig. S7E: 0 animals in recovery at day 16). Conversely, all P-selectin-low animals recovered 24 h later (day 6) (Fig. S7D: mean clinical score 0.5 ± 0.58. Fig. S7E: 100% of animals in remission at day 15). Overall, these data indicate that MPIOs-αP-selectin enhanced molecular MRI allows predicting relapses and remissions in PLP-induced EAE.
Fig. S7.
MPIOs-αP-selectin–induced hyposignal predicts remission in PLP-induced EAE. (A) Experimental design. (B) Representative high-resolution T2*-weighted images after MPIOs-αP-selectin injection from PLP-induced EAE mice with deficits (first relapse, D15). Yellow arrows indicate signal voids. (C) Corresponding signal void quantification. #P < 0.05. n = 4 per group. (D) Clinical score analysis of P-selectin-high (blue line) or -low mice (yellow line) the day of MRI acquisition (day 15) and the day after (D16) (n = 4 per group) #P < 0.05. (E) Schematic representation of the main findings. See Table S1 for detailed sample size.
Discussion
This study reports the development of an original molecular-imaging method for the detection of neuroinflammation in the mouse CNS. By targeting P-selectin, and by using MRI sequences adapted to the imaging of the spinal cord, we provide a diagnostic follow-up for animals subjected to chronic or relapsing–remitting EAE. This study shows the validity of molecular imaging targeting P-selectin for the explorative follow-up of MS-like disease and the prognosis of relapse and remission in mice subjected to animal models of MS.
Imaging-based diagnosis in MS currently consists of tracking the spatiotemporal dissemination of lesions. In this instance, T2-weighted and Fluid Attenuation Inversion Recovery sequences were used for the observation of plaques, and Gadolinium-enhanced T1-weighted sequences were used for the detection of the BBB/BSCB opening and to estimate whether a lesion is new or old. Therefore, endothelial activation and subsequent leukocyte infiltration are not currently assessed by imaging in the clinical practice. Because blood–brain/blood–spinal cord opening, and inflammatory cell infiltration are not necessarily associated (16, 17), MS diagnosis would gain from reliable information concerning endothelial activation provided by MPIOs-αP-selectin–enhanced molecular MRI to improve the estimation of disease activity and enable the earlier detection of lesions in formation.
MRI using MPIOs coupled to antibodies against endothelial adhesion molecules have been used before to assess endothelial activation in experimental models of brain diseases with a neuroinflammatory component (11). MPIO-coupled antibodies against inducible cell adhesion molecule 1 (ICAM-1) and vascular cell adhesion molecule 1 (VCAM-1) were used in animal models of stroke, Alzheimer’s disease (8), and MS (7, 18, 19). More recently, an equivalent strategy targeting P-selectin has been developed in our group (9). This tool showed optimized sensitivity, compared with VCAM-1–targeted MPIOs, for the detection of endothelial activation, especially in the context of mild insults such as transient ischemic attack (9). In the present study, we show that this tool enables follow-up of disease activity and prediction of relapse/remission cycles in EAE. In a previous study, MRI-compatible agents (glyconanoparticles) indiscriminately targeting E- and P-selectin were used to detect focal inflammation in the brain of EAE mice (20). E-selectin expression has been suggested to occur subsequently to P-selectin (21). Because the question of the timing was crucial in the present study, we believe that targeting P-selectin provided an advantage over E-selectin. The present work brings the following elements: (i) detection of endothelial activation not only in the brain, but also in the cerebellum and spinal cord; (ii) quantitative spatiotemporal follow-up of disease course in relation to clinical manifestations; (iii) follow-up in two different models of EAE for which specificities were unveiled by P-selectin imaging; (iv) spatial resolution and sensitivity high enough to allow imaging inflammation in the spinal cord of EAE mice, with a distinction between white and gray matter; and (v) prediction of relapses and remissions. Of note, CNS endothelial cells—in contrast to any other endothelial cells in the body—do not store P-selectin in Weibel–Palade bodies, but rather up-regulate P-selectin expression in inflammatory conditions (10). This fact may explain the very low MPIOs-αP-selectin–induced signal in control conditions, which may have contributed to increase the sensitivity of our method.
Although the chronic model showed a slow caudo-rostral progression of endothelial activation only in the spinal cord (ventral part), the relapsing–remitting model showed endothelial activation in the whole spinal cord (ventral and dorsal part), the brain, and the cerebellum from the early stages. Rather than a direct reflection of the number of lymphocytes within the tissue, P-selectin imaging gives a reliable and quantitative reflection of disease activity. This finding is very important when considering that lymphocyte number in the tissue is not a direct index of disease activity. In fact, we report differential patterns of lymphocyte infiltration in the two models: In MOG-induced EAE, the constant progression of symptoms along time was associated with a constant increase in both the number of lymphocytes and BSCB permeability. In contrast, in PLP-induced EAE, the number of lymphocytes remained mostly unchanged during relapses and remission, despite variations of BSCB permeability. In particular, remission was not accompanied by a drop in the number of lymphocytes within the tissue, except for thoracic regions, although BSCB permeability partially recovered. In contrast, relapse was not accompanied by either an increase in lymphocyte number or an increase in BSCB permeability. This finding is compatible with the fact that remission is not necessarily linked to a decrease in infiltrate number (due to their degeneration or “exit” from the spinal cord). Conversely, relapse is not necessarily linked to an increase in infiltrate number. Rather, relapse and remission could be due to changes in phenotype or activity of infiltrated cells (22). Also, one has to consider that only T cells that have crossed the glia limitans mediate the disease (23, 24), which may explain why the global number of lymphocytes does not reliably reflect disease activity. P-selectin signal, in contrast, is proportional to disease activity: It raises during relapses and drops during remission.
Because we used male mice for MOG-EAE and female mice for PLP-EAE, differences between the two models might in part be due to sex differences. Further studies should be performed in appropriate animal models.to address this question.
P-selectin signal is not only an index of disease activity, but also predicts relapse and remission in PLP-induced EAE. The presence of MPIOs-αP-selectin–induced signal void in asymptomatic animals predicts the appearance of relapse. Conversely, the disappearance of P-selectin signal in symptomatic animals predicts their remission. This finding suggests that imaging tools targeting P-selectin may serve in the managing of MS patients. In particular, detection of an increased P-selectin signal may help documenting the ongoing formation of a new lesion before it can be observed by using conventional imaging. In line with this finding, increased P-selectin signal may predict relapses in remitting patients, which would enable anticipating the setup of treatment. Conversely, the decrease in P-selectin signal may announce remission in patients with active disease. This method may be particularly useful to assess the ability of a drug to modify disease course in primary progressive or relapsing–remitting MS. Future imaging tools targeting P-selectin may thus be used as “companion diagnosis” for clinical practice or in clinical trials.
“P-selectin-low” animals show axonal damage without overt demyelination (normal appearing white matter; NAWM), whereas in “P-selectin-high” animals, the combination of demyelination and axonal damage could induce symptom onset. Previous reports suggested that axonal damage can occur independently and not necessarily as a consequence of demyelination (25, 26). Our method could discriminate between animals in which NAWM predominates and those in which demyelination and axonal damage concur.
The size of MPIOs avoids their passive extravasation across BBB and BSCB, which supports the use of MPIO-coupled antibodies to specifically detect endothelial activation. However, one limitation to their use as imaging tools in humans is their poor biodegradability. The half-life of MPIOs in the bloodstream is short (27), but they remain in peripheral organs after their injection (28) (Fig. S8A), although they do not interfere with EAE course (Fig. S8B). Nevertheless, this limitation should be overcome soon by the synthesis of new-generation, biodegradable contrast-enhancing particles (29, 30), some of them being compatible with the detection of inflammation in vivo (31). The dose of iron injected into the animals (1 mg/kg) has also been reduced in our study compared with previous studies (11), thanks to the strong signal changes induced by MPIOs-αP-selectin. In addition, MPIOs-αP-selectin is cleared from target endothelium in less than 24 h, which makes them compatible with repeated measures and longitudinal follow-up. Together, these points indicate that, in the future, biodegradable contrast-enhancing particles targeting P-selectin may be developed for diagnosis, follow-up, and prediction of relapse and remission in MS.
Fig. S8.
Biodistribution of MPIOs after injection in EAE mice and effect on the shape of clinical score. (A) Representative T2*-weighted images before and 5 min after administration of MPIOs-αP-selectin in EAE mice, revealing a nonspecific uptake in the liver and the spleen. (B) EAE mice were injected with MPIOs (blue line) or buffer (orange line) at symptoms onset. Clinical score was assessed daily by one examiner blinded to the treatment (n = 7 per group).
Materials and Methods
Animal experiments were performed in accordance with the French (Decree 87/848) and the European (Directive 86/609) guidelines (Project 02654.02, Center Agreement D14118001). Standard procedures for experimental autoimmune encephalomyelitis (EAE), MPIO conjugation, MRI, vascular permeability, immunohistochemistry and statistical analysis are described in SI Materials and Methods.
SI Materials and Methods
EAE.
Chronic EAE (MOG-induced EAE) was induced in 12-wk-old male C57BL6/J mice (Janvier) via s.c. immunization with 200 µg of recombinant myelin oligodendrocyte glycoprotein (MOG35–55, Cambridge Research Biochemicals) in an emulsion mixed (volume ratio 1:1) with Complete Freund's Adjuvant (CFA; Difco Laboratories) containing 600 µg of heat-killed Mycobacterium tuberculosis H37Ra (MBT; Difco). Control (CFA) animals were injected with saline mixed with CFA containing 500 µg of heat-killed MBT. The emulsion was administered to regions above the shoulder and the flanks (total of four sites; 50 μL at each injection site). All animals were additionally intraperitoneally (i.p.) injected with 200 ng of pertussis toxin derived from Bordetella pertussis (Sigma-Aldrich) in 200 µL of saline at the time of and at 48 h after immunization.
Relapsing–remitting EAE (PLP-induced EAE) was induced in 5- to 7-wk-old female SJL/J mice (Janvier) via the same protocol [except that MOG is replaced by recombinant proteolipidic protein (PLP139–151; Eurogentec)].
All animals of this study were maintained under specific pathogen-free conditions at the Centre Universitaire de Ressources Biologiques (Basse-Normandie, France).
Clinical Score.
Mice were examined daily for clinical signs of EAE and were scored as follows: 0, no disease; 1, limp tail; 2, hindlimb weakness; 3, complete hindlimb paralysis; 4, hindlimb paralysis plus forelimb paralysis; and 5, moribund or dead. Induction of EAE was performed by two persons blinded without knowledge of the injected treatment (saline or myelin protein). All clinical scores were assessed daily by one examiner blinded to the EAE.
Targeting Moiety Conjugation to MPIO.
Purified polyclonal goat anti-mouse antibodies for P-selectin (AF737; R&D Systems) or control rat IgG (Jackson ImmunoResearch) were covalently conjugated to MPIO (diameter 1.08 μm) with p-toluenesulphonyl reactive surface groups (Invitrogen) in borate buffer (pH 9.5) by incubation at 37 °C for 48 h. A total of 40 μg of antibody was used for the coating of 1 mg of reactive MPIOs. MPIOs were then washed in PBS containing 0.5% BSA at 4 °C and incubated for 24 h at room temperature, to block the remaining active groups. MPIOs were rinsed in PBS (0.1% BSA). To disperse MPIO aggregates, a sonication procedure at low intensity was performed immediately after antibody labeling for 60 s. Thereafter, conjugated MPIOs were stored at 4 °C in a PBS buffer under constant agitation to prevent settling and aggregate formation.
MRI and Analysis.
The 3D respiration-gated T2*-weighted gradient echo imaging with flow compensation (GEFC; spatial resolution of 150 μm × 75 μm × 75 μm interpolated to an isotropic resolution of 75 μm) with TE/TR 8.6/200 ms and a flip angle (FA) of 25° was performed to visualize MPIOs (acquisition time = 10 min). All high-resolution T2*-weighted images presented in this study are minimum-intensity projections of four consecutive slices (yielding a Z resolution of 280 μm). When appropriate, mice randomly received MPIO-IgG or MPIO-p-selectin. Although MPIO injections were performed outside the magnet, the positions of the mice during pre- and post-MPIO acquisitions did not change (the mice were placed exactly at the same position and were not removed from the animal holder). MRIs were not performed in the same animals longitudinally.
Prediction of Relapses and Remissions by MRI.
For prediction of the first relapse, PLP-EAE mice were imaged with MPIO-α-P-Sel at day 10 after induction, when ∼50% of mice were expected to experience symptom onset, based on a retrospective study of incidence in which we pooled several previous studies in our laboratory (n = 110). The number of mice was not adjusted, nor were any mice excluded or added. The mice were then affiliated to “high” and “low” group by careful examination of MRI images by an experienced examiner. The presence of high or low P-selectin signal was confirmed by measurement of signal void (see above). Clinical score was assessed for each mouse the day after (day 11 after induction) by an examiner blinded to the groups (low or high P-Sel). An equivalent strategy was used for prediction of remission.
MRI Analysis.
The images of the organs were manually segmented using ImageJ. Lastly, 3D Otsu automated threshold was applied, and the signal void volume was computed (in percentage of the total organ volume). Results are presented as the volume of MPIOs-induced signal void divided by the volume of the structure of interest (in percentage). All analyses were performed by using ImageJ (Version 1.49e). All analyses were assessed by one examiner blinded to the clinical score and the type of EAE.
Kinetic of MPIOs-αP-Selectin Clearance.
Consecutive high-resolution T2*-weighted images were acquired at different times after MPIOs-αP-selectin administration in CS2 EAE mice. For that, mice were injected with MPIOs-αP-selectin and 5 min after were placed in the MRI to start the first acquisition (10 min after the injection). Between each high-resolution T2*-weighted acquisition (10 min, 8 h, and 24 h), mice were placed in their cages and reanesthetized for each new MRI acquisition. The different parts of the spinal cord were always imaged in the same order (rostral spinal cord first and caudal spinal cord after, for a total of 22 min of acquisition).
Immunohistochemistry.
Deeply anesthetized mice were transcardially perfused with cold heparinized saline (35 mL). Tissues were postfixed during 48 h at 4 °C (PBS 0.1 M, pH 7.4, containing 2% paraformaldehyde and 0.2% picric acid) and cryoprotected (sucrose 20% in veronal buffer; 24 h; 4 °C) before freezing in Tissue-Tek (Miles Scientific). Cryomicrotome-cut transversal sections (8–10 µm) were collected on poly-lysine slides and stored at −80 °C before processing. Sections were coincubated overnight with goat anti–P-selectin (1:1,000; R&D Systems), rabbit anti-laminin (1:1,000; Abcam), rat anti-CD4 (1:25; eBioscience), rabbit anti-CD3 (1:200; Abcam), rabbit anti-MBP (1:800 Abcam), sheep antifibrinogen, and mouse anti-SMI32 (1:800; Abcam). Primary antibodies were revealed by using Fab'2 fragments of donkey anti-rat, -rabbit, or -goat IgG linked to FITC or TRITC (1:600; Jackson ImmunoResearch). Washed sections were coverslipped with antifade medium containing DAPI, and images were digitally captured by using a Leica DM6000 microscope-coupled coolsnap camera, visualized with Metavue software (Version 5.0; Molecular Devices), and further processed by using ImageJ software (Version 1.49e; NIH). All analyses were performed blinded to the experimental data.
The 3D Reconstruction.
Images of double immunostaining (Laminin and P-selectin) were collected by using a Leica DM6000 microscope-coupled coolsnap camera. Images were taken with a z-step of 0.2 µm. The 3D structure of the vessel was reconstructed from microscope images by using Imaris software (Version 5.5; Bitplane). Volume and surface functions were used.
In Vivo Vascular Permeability.
Mice were deeply anesthetized with isoflurane 5% and maintained under anesthesia with 2% isoflurane in a 70%/30% gas mixture (N2O/O2) during surgery. The rectal temperature was maintained at 37 ± 0.5 °C throughout the surgical procedure by using a feedback-regulated heating system. A total of 200 μL of 2% Evans blue solution in saline was infused by i.v. injection. Evans blue was allowed to circulate for 4 h (mice awake in their cage), and mice were subsequently deeply anesthetized and perfused via the left ventricle with heparinized saline solution. Brain and spinal cords were excised and placed in optical imaging (Biospace), and Evans blue fluorescence was measured (excitation 650 nm, emission filter 700 nm). Fluorescence was quantified with the M3 Vision software (Biospace).
Platelet Depletion.
Platelet depletion was accomplished by using purified rat monoclonal antibodies directed against mouse platelet GPIbα (CD42b), following manufacturer's recommendations (Emfret Analytics). GPIbα antibody (2 µg/g) was administered i.v. in EAE-mice (clinical score > 2) in the treated group 1 h before MPIOs-αP-selectin injection and MRI studies. Platelet depletion was confirmed by flow cytometry analyses on blood samples from the same mice. Blood cells were analyzed on a FACSVerse (Becton Dickinson) equipped with its accompanying software (FACSuite, Becton Dickinson) on 30,000 cells with size and granularity of red blood cells (RBCs) gate. When stated, anti-CD41 monoclonal antibody conjugated with FITC was added to the blood and incubated together for 20 min at room temperature to confirm platelet population.
Statistical Analysis.
Results are presented as the mean ± SD. Sample size are indicated in Table S1 for each group. Normality tests were performed on all samples (D'Agostino–Pearson omnibus test and Shapiro–Wilk test). When normality could not be assumed, we used nonparametric tests (Kruskal–Wallis for multiple comparisons followed by Mann–Whitney's U test), which are the most stringent in these conditions. For correlations, Pearson or Spearman tests were used (respectively, when normality could or could not be assumed after normality tests).
Table S1.
Group sizes and distributions
| Group | n | Normality assumption |
| Fig. 1 | ||
| Before (rostral) | 3 | No |
| After MPIOs-αIgG (rostral) | 3 | No |
| After MPIOs-αP-selectin (rostral) | 6 | No |
| Before (caudal) | 3 | No |
| After MPIOs-αIgG (caudal) | 3 | No |
| After MPIOs-αP-selectin (caudal) | 6 | No |
| Fig. 2 | ||
| Sham (rostral) | 3 | No |
| Clinical score 1 (rostral) | 3 | No |
| Clinical score 2 (rostral) | 4 | No |
| Clinical score 3 (rostral) | 4 | No |
| Clinical score 4 (rostral) | 3 | No |
| Sham (caudal) | 3 | No |
| Clinical score 1 (caudal) | 3 | No |
| Clinical score 2 (caudal) | 4 | No |
| Clinical score 3 (caudal) | 4 | No |
| Clinical score 4 (caudal) | 3 | No |
| Fig. 4 | ||
| Sham (rostral) | 4 | No |
| First relapse (rostral) | 6 | No |
| Recovery (rostral) | 4 | No |
| Second relapse (rostral) | 4 | No |
| Sham (caudal) | 4 | No |
| First relapse (caudal) | 6 | No |
| Recovery (caudal) | 4 | No |
| Second relapse (caudal) | 4 | No |
| Fig. 6 | ||
| P-selectin-low | 6 | No |
| P-selectin-high | 6 | No |
| Fig. S7 | ||
| P-selectin-high | 4 | No |
| P-selectin-low | 4 | No |
Number of animals (n) is given for each experimental group within corresponding figures, together with the result of normality assumption tests (D'Agostino–Pearson omnibus and Shapiro–Wilk tests).
Acknowledgments
We thank Dr. Rubio Marina and Prof. Ali Carine for their useful advices concerning the manuscript; Dr. Camille Leonetti for her help with 3D image reconstructions; and Dr. Mikaël Naveau for his guidance on statistics. This work was supported by the European Union via the FP7 programme, INSERM, Unicaen, Regional Council of Normandy, and the Association pour la Recherche sur la Sclérose en Plaques.
Footnotes
Conflict of interest statement: The use of P-selectin for the diagnosis of multiple sclerosis is the subject of a patent application (EP16305132.9) by F.D. for INSERM and University of Caen.
This article is a PNAS Direct Submission.
This article contains supporting information online at www.pnas.org/lookup/suppl/doi:10.1073/pnas.1619424114/-/DCSupplemental.
References
- 1.Compston A, Coles A. Multiple sclerosis. Lancet. 2008;372:1502–1517. doi: 10.1016/S0140-6736(08)61620-7. [DOI] [PubMed] [Google Scholar]
- 2.Lublin FD. New multiple sclerosis phenotypic classification. Eur Neurol. 2014;72:1–5. doi: 10.1159/000367614. [DOI] [PubMed] [Google Scholar]
- 3.Polman CH, et al. Diagnostic criteria for multiple sclerosis: 2010 revisions to the McDonald criteria. Ann Neurol. 2011;69:292–302. doi: 10.1002/ana.22366. [DOI] [PMC free article] [PubMed] [Google Scholar]
- 4.Frohman EM, et al. Most patients with multiple sclerosis or a clinically isolated demyelinating syndrome should be treated at the time of diagnosis. Arch Neurol. 2006;63:614–619. doi: 10.1001/archneur.63.4.614. [DOI] [PubMed] [Google Scholar]
- 5.Rossi B, Angiari S, Zenaro E, Budui SL, Constantin G. Vascular inflammation in central nervous system diseases: Adhesion receptors controlling leukocyte-endothelial interactions. J Leukoc Biol. 2011;89:539–556. doi: 10.1189/jlb.0710432. [DOI] [PubMed] [Google Scholar]
- 6.McAteer MA, et al. In vivo magnetic resonance imaging of acute brain inflammation using microparticles of iron oxide. Nat Med. 2007;13:1253–1258. doi: 10.1038/nm1631. [DOI] [PMC free article] [PubMed] [Google Scholar]
- 7.Serres S, et al. VCAM-1-targeted magnetic resonance imaging reveals subclinical disease in a mouse model of multiple sclerosis. FASEB J. 2011;25:4415–4422. doi: 10.1096/fj.11-183772. [DOI] [PMC free article] [PubMed] [Google Scholar]
- 8.Montagne A, et al. Ultra-sensitive molecular MRI of cerebrovascular cell activation enables early detection of chronic central nervous system disorders. Neuroimage. 2012;63:760–770. doi: 10.1016/j.neuroimage.2012.07.018. [DOI] [PubMed] [Google Scholar]
- 9.Quenault A, et al. Molecular magnetic resonance imaging discloses endothelial activation after transient ischaemic attack. Brain. 2017;140:146–157. doi: 10.1093/brain/aww260. [DOI] [PMC free article] [PubMed] [Google Scholar]
- 10.Barkalow FJ, Goodman MJ, Gerritsen ME, Mayadas TN. Brain endothelium lack one of two pathways of P-selectin-mediated neutrophil adhesion. Blood. 1996;88:4585–4593. [PubMed] [Google Scholar]
- 11.Gauberti M, Montagne A, Quenault A, Vivien D. Molecular magnetic resonance imaging of brain-immune interactions. Front Cell Neurosci. 2014;8:389. doi: 10.3389/fncel.2014.00389. [DOI] [PMC free article] [PubMed] [Google Scholar]
- 12.Carrithers MD, Visintin I, Kang SJ, Janeway CA., Jr Differential adhesion molecule requirements for immune surveillance and inflammatory recruitment. Brain. 2000;123:1092–1101. doi: 10.1093/brain/123.6.1092. [DOI] [PubMed] [Google Scholar]
- 13.Sathiyanadan K, Coisne C, Enzmann G, Deutsch U, Engelhardt B. PSGL-1 and E/P-selectins are essential for T-cell rolling in inflamed CNS microvessels but dispensable for initiation of EAE. Eur J Immunol. 2014;44:2287–2294. doi: 10.1002/eji.201344214. [DOI] [PubMed] [Google Scholar]
- 14.Piccio L, et al. Efficient recruitment of lymphocytes in inflamed brain venules requires expression of cutaneous lymphocyte antigen and fucosyltransferase-VII. J Immunol. 2005;174:5805–5813. doi: 10.4049/jimmunol.174.9.5805. [DOI] [PubMed] [Google Scholar]
- 15.Kerfoot SM, Kubes P. Overlapping roles of P-selectin and alpha 4 integrin to recruit leukocytes to the central nervous system in experimental autoimmune encephalomyelitis. J Immunol. 2002;169:1000–1006. doi: 10.4049/jimmunol.169.2.1000. [DOI] [PubMed] [Google Scholar]
- 16.Ladewig G, et al. Spatial diversity of blood-brain barrier alteration and macrophage invasion in experimental autoimmune encephalomyelitis: A comparative MRI study. Exp Neurol. 2009;220:207–211. doi: 10.1016/j.expneurol.2009.08.027. [DOI] [PubMed] [Google Scholar]
- 17.Weise G, Stoll G. Magnetic resonance imaging of blood brain/nerve barrier dysfunction and leukocyte infiltration: Closely related or discordant? Front Neurol. 2012;3:178. doi: 10.3389/fneur.2012.00178. [DOI] [PMC free article] [PubMed] [Google Scholar]
- 18.Mardiguian S, et al. Anti-IL-17A treatment reduces clinical score and VCAM-1 expression detected by in vivo magnetic resonance imaging in chronic relapsing EAE ABH mice. Am J Pathol. 2013;182:2071–2081. doi: 10.1016/j.ajpath.2013.02.029. [DOI] [PMC free article] [PubMed] [Google Scholar]
- 19.Blezer ELA, et al. In vivo MR imaging of intercellular adhesion molecule-1 expression in an animal model of multiple sclerosis. Contrast Media Mol Imaging. 2015;10:111–121. doi: 10.1002/cmmi.1602. [DOI] [PubMed] [Google Scholar]
- 20.van Kasteren SI, et al. Glyconanoparticles allow pre-symptomatic in vivo imaging of brain disease. Proc Natl Acad Sci USA. 2009;106:18–23. doi: 10.1073/pnas.0806787106. [DOI] [PMC free article] [PubMed] [Google Scholar]
- 21.Yang J, et al. Targeted gene disruption demonstrates that P-selectin glycoprotein ligand 1 (PSGL-1) is required for P-selectin-mediated but not E-selectin-mediated neutrophil rolling and migration. J Exp Med. 1999;190:1769–1782. doi: 10.1084/jem.190.12.1769. [DOI] [PMC free article] [PubMed] [Google Scholar]
- 22.Koutrolos M, Berer K, Kawakami N, Wekerle H, Krishnamoorthy G. Treg cells mediate recovery from EAE by controlling effector T cell proliferation and motility in the CNS. Acta Neuropathol Commun. 2014;2:163. doi: 10.1186/s40478-014-0163-1. [DOI] [PMC free article] [PubMed] [Google Scholar]
- 23.Flach A-C, et al. Autoantibody-boosted T-cell reactivation in the target organ triggers manifestation of autoimmune CNS disease. Proc Natl Acad Sci USA. 2016;113:3323–3328. doi: 10.1073/pnas.1519608113. [DOI] [PMC free article] [PubMed] [Google Scholar]
- 24.Agrawal S, et al. Dystroglycan is selectively cleaved at the parenchymal basement membrane at sites of leukocyte extravasation in experimental autoimmune encephalomyelitis. J Exp Med. 2006;203:1007–1019. doi: 10.1084/jem.20051342. [DOI] [PMC free article] [PubMed] [Google Scholar]
- 25.Recks MS, et al. Early axonal damage and progressive myelin pathology define the kinetics of CNS histopathology in a mouse model of multiple sclerosis. Clin Immunol. 2013;149:32–45. doi: 10.1016/j.clim.2013.06.004. [DOI] [PubMed] [Google Scholar]
- 26.Lassmann H. Axonal and neuronal pathology in multiple sclerosis: What have we learnt from animal models. Exp Neurol. 2010;225:2–8. doi: 10.1016/j.expneurol.2009.10.009. [DOI] [PubMed] [Google Scholar]
- 27.Melemenidis S, et al. Molecular magnetic resonance imaging of angiogenesis in vivo using polyvalent cyclic RGD-iron oxide microparticle conjugates. Theranostics. 2015;5:515–529. doi: 10.7150/thno.10319. [DOI] [PMC free article] [PubMed] [Google Scholar]
- 28.Belliere J, et al. Unmasking silent endothelial activation in the cardiovascular system using molecular magnetic resonance imaging. Theranostics. 2015;5:1187–1202. doi: 10.7150/thno.11835. [DOI] [PMC free article] [PubMed] [Google Scholar]
- 29.Sakhalkar HS, et al. Leukocyte-inspired biodegradable particles that selectively and avidly adhere to inflamed endothelium in vitro and in vivo. Proc Natl Acad Sci USA. 2003;100:15895–15900. doi: 10.1073/pnas.2631433100. [DOI] [PMC free article] [PubMed] [Google Scholar]
- 30.Nkansah MK, Thakral D, Shapiro EM. Magnetic poly(lactide-co-glycolide) and cellulose particles for MRI-based cell tracking. Magn Reson Med. 2011;65:1776–1785. doi: 10.1002/mrm.22765. [DOI] [PMC free article] [PubMed] [Google Scholar]
- 31.Perez-Balderas F, et al. Covalent assembly of nanoparticles as a peptidase-degradable platform for molecular MRI. Nat Commun. 2017;8:14254. doi: 10.1038/ncomms14254. [DOI] [PMC free article] [PubMed] [Google Scholar]


