Significance
Seamless integration of electrical probes within neural tissue could substantially enhance their impact and open up new opportunities in neuroscience research through electronic therapeutics. This paper describes systematic studies of brain tissue behavior following implantation of a design for probes that can be precisely targeted to specific brain regions by syringe injection as in many biological species and have an ultraflexible open mesh structure similar to brain tissue itself. Studies of the chronic tissue response postimplantation demonstrate that these tissue-like probes do not elicit inflammation or scarring, in contrast to more conventional probes. Moreover, neurons were found to penetrate through the probes’ open mesh structure, thus demonstrating an unprecedented level of integration and compatibility with the brain circuitry.
Keywords: neural probes, ultraflexible macroporous probes, in vivo implants, minimal neuroinflammation, brain–machine interface
Abstract
Implantation of electrical probes into the brain has been central to both neuroscience research and biomedical applications, although conventional probes induce gliosis in surrounding tissue. We recently reported ultraflexible open mesh electronics implanted into rodent brains by syringe injection that exhibit promising chronic tissue response and recording stability. Here we report time-dependent histology studies of the mesh electronics/brain-tissue interface obtained from sections perpendicular and parallel to probe long axis, as well as studies of conventional flexible thin-film probes. Confocal fluorescence microscopy images of the perpendicular and parallel brain slices containing mesh electronics showed that the distribution of astrocytes, microglia, and neurons became uniform from 2–12 wk, whereas flexible thin-film probes yield a marked accumulation of astrocytes and microglia and decrease of neurons for the same period. Quantitative analyses of 4- and 12-wk data showed that the signals for neurons, axons, astrocytes, and microglia are nearly the same from the mesh electronics surface to the baseline far from the probes, in contrast to flexible polymer probes, which show decreases in neuron and increases in astrocyte and microglia signals. Notably, images of sagittal brain slices containing nearly the entire mesh electronics probe showed that the tissue interface was uniform and neurons and neurofilaments penetrated through the mesh by 3 mo postimplantation. The minimal immune response and seamless interface with brain tissue postimplantation achieved by ultraflexible open mesh electronics probes provide substantial advantages and could enable a wide range of opportunities for in vivo chronic recording and modulation of brain activity in the future.
Stable chronic mapping of single neurons with action potential temporal resolution in the central neural system could have significant impact on research focused on both fundamental questions in neuroscience and biomedical applications (1–3). For example, fMRI (4, 5) has the ability to map whole-brain activity, although low spatiotemporal resolution (6) precludes monitoring neural circuits at the cellular level. Optical imaging (7, 8) is capable of mapping at single neuron spatial resolution, although applications have been limited by penetration depth, temporal resolution, specimen heating, and incorporation of genetically encoded reporters (9). Flexible surface electrode arrays (10–12) are also capable of mapping activity at the cellular level but are not capable of accessing deeper brain regions and generally have spatial resolution inferior to that of optical imaging. Implantable electrical probes can provide advantages for high-spatiotemporal-resolution neural recordings independent of probing depth compared with other techniques (6). However, conventional implanted electrical probes, such as silicon and microwire probes (13, 14), generally exhibit immune responses that lead to glial scar formation and neuronal cell depletion at the interfacial tissue/probe region (15–18).
Recent studies have investigated the potential advantages of reducing mechanical stiffness (19–21), feature sizes (22), as well as density of the material used for fabrication of probes (15) in terms of reduced gliosis. For example, polymer fiber-based neural probes with bending stiffness values ca. 8% of a rigid microwire showed reduced accumulation of astrocytes (ca. 50%) around probes compared with microwires 1 and 2 wk postimplantation (20). However, accumulations of astrocytes and microglia have still been observed around the fiber probe surfaces, presumably due to the bending stiffness mismatch with soft neural tissue.
To address the issues of conventional rigid devices we have introduced a paradigm for implantable multielectrode probes based upon an ultraflexible open mesh structure (23–26), where the mesh has a unique combination of structural and mechanical features. Specifically, the mesh has all size features comparable to or smaller than neuron soma and bending stiffness values of ∼0.1 nN⋅m, comparable to a 150-μm-thick brain tissue slice (i.e., the same as the overall implanted open mesh diameter), ∼0.4 nN⋅m (27, 28) and orders of magnitude smaller (more flexible) than conventional probes (14, 29, 30). Herein, we present systematic time-dependent histology studies of the mesh electronics/brain-tissue interface obtained from tissue sections perpendicular (horizontal slices) and parallel (sagittal slices) to the long axis of probes, as well as time-dependent measurements obtained from horizontal tissue sections containing the cross-sections of implanted conventional flexible thin-film polymer probes. These studies provide insight addressing the distinct evolution of the chronic immune response and tissue remodeling in the open mesh electronics versus conventional polymer thin-film probes, and moreover they demonstrate that the macroporous structure of the mesh electronics enables 3D interpenetration of axonal projections and even neuron somata into the interior of mesh electronics.
Results and Discussion
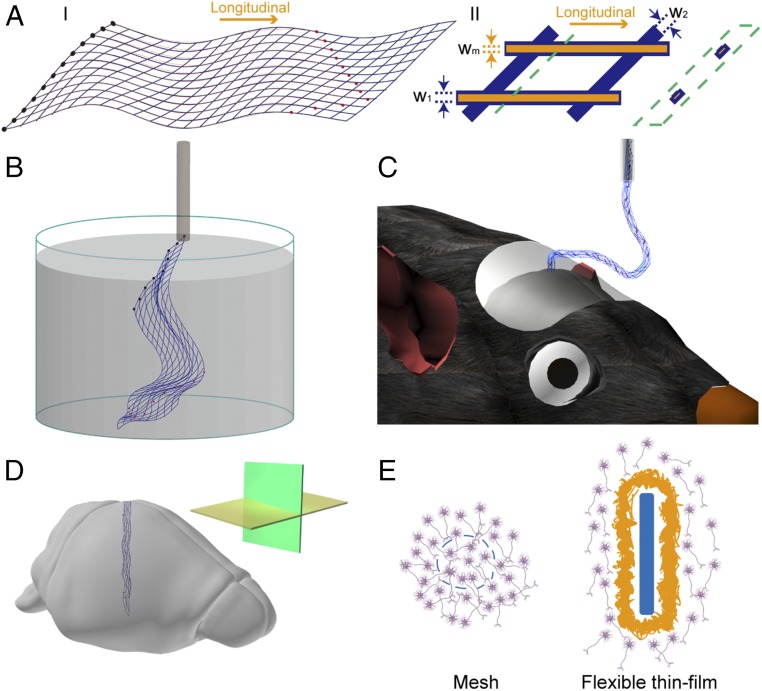
The free-standing mesh electronics were fabricated using standard photolithography (PL) procedures (Materials and Methods and SI Text) as described in detail elsewhere (23, 25, 26). The mesh electronics (Fig. 1A) consist of an individually addressable array of recording electrodes at one end connected by passivated metal lines to input/output (I/O) pads located at the opposite end of the mesh structure. The insulated metal interconnects are encapsulated by two layers of SU-8 photoresist, an epoxy-based biocompatible polymer (31). The longitudinal and transverse polymer elements of the mesh electronics have thicknesses of ca. 900 nm and widths of 20 μm. We have also used polyimide flexible thin-film probes with thicknesses, 25 μm, comparable to the lower end of the range, 20–100 μm used in reported studies (29, 30, 32, 33); the width of these thin-film probes, 500 μm, was comparable to the outer diameter of the capillary needle that was used for injection of mesh electronics, ca. 650 μm. Analysis of the bending stiffness for the mesh electronics and flexible thin-film probe structures (SI Text) yields a value for the longitudinal (Fig. 1A) stiffness, 0.104 nN⋅m for the mesh electronics, that is more than 104 times smaller (i.e., more flexible) than the 3.3 × 10³ nN⋅m value for the polyimide thin-film probe.
Fig. 1.
Schematics of mesh electronics. (A) Schematics of the mesh electronics structure in 2D. (I) Overall design of mesh electronics structure, where the blue lines highlight the overall mesh structure, the black filled circles at left indicate I/O pads, and the red filled circles indicate recording electrodes. (II) A single unit cell of mesh electronics, where the orange lines, which are shown without top polymer layer, highlight the metal interconnects and blue lines correspond to polymer passivation layer; w1, w2, and wm indicate the widths of the longitudinal polymer, transverse polymer, and metal lines, respectively. The schematic in the green dashed box highlights the cross-section view, which shows the polymer encapsulated metal structure, at the position indicated by the green dashed line. (B) Schematic of free-standing mesh electronics floating in aqueous solution and ready to be loaded into a glass needle. (C) Schematic of mesh electronics injected into mouse brain, with part of the mesh sagging between the brain and the needle. (D) Schematic of mesh electronics implanted in brain tissue with horizontal (yellow plane) and sagittal (green plane) sectioning directions highlighted in the inset. (E) Schematics of the interface between mesh electronics and the brain tissue (Left, cross-section view) and that between flexible thin-film and the brain tissue (Right, cross-section view). Mesh elements and the flexible thin-film are highlighted in blue, neurons are in purple, and glial scar is in yellow.
The ultraflexible and macroporous mesh electronics, with ∼90% of free space, can be suspended in aqueous solution (Fig. 1B), drawn into a glass capillary syringe needle (Fig. 1 B and C), and then implanted in a targeted mouse brain region by stereotaxic injection (refs. 25 and 26, Fig. 1 C and D, Materials and Methods, and SI Text). Following stereotaxic injection of mesh electronic or insertion of polymer thin-film probes, the mice brains were fixed at specific time points postimplantation and then prepared for analysis as either horizontal brain sections, which contained embedded mesh or thin-film cross-sections (Fig. 1E), or sagittal sections parallel to the mesh probe longitudinal axis (Materials and Methods and SI Text). The capability to section the brain tissue with embedded probes enables clear cellular-scale visualization of the tissue–electronics interface, in contrast to more rigid probes that must be removed before sectioning (16).
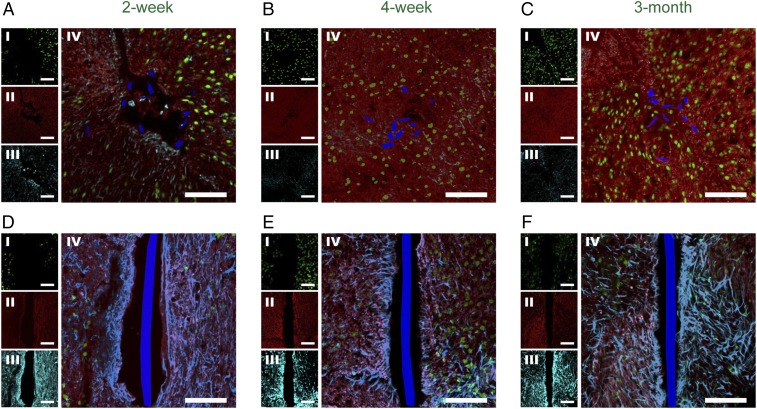
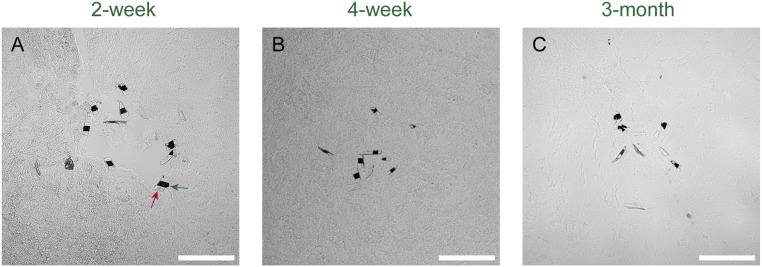
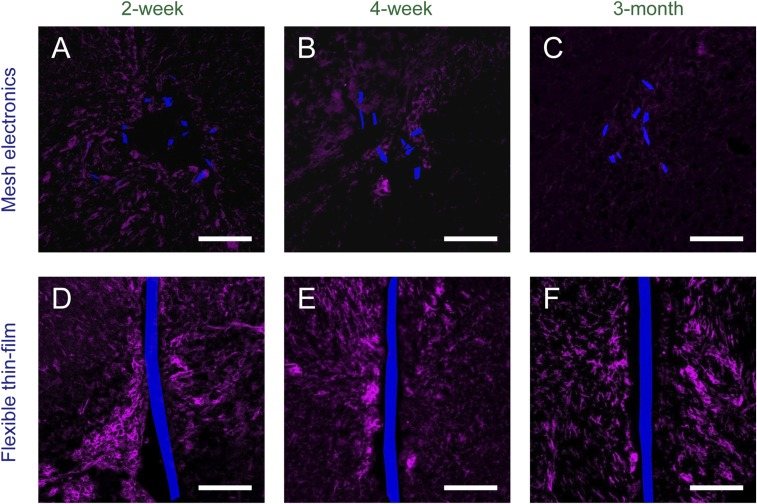
Confocal fluorescence microscopy images of time-dependent horizontal brain tissue samples containing mesh electronics or flexible thin-film probes from 2 wk, 4 wk, and 3 mo postimplantation (hereafter, all times refer to postimplantation) are shown in Fig. 2. The tissue samples were stained with monoclonal antibodies for neuronal nuclear antigen (NeuN, green), neurofilaments (NF, red), and glial fibrillary acidic protein (GFAP, cyan) to label neuron somata, axons, and astrocytes, respectively (Materials and Methods and SI Text). The positions of the mesh electronics elements in horizontal section images (blue) were extracted from differential interference contrast (DIC) microscopy images (Fig. S1) and positions of flexible thin-film probes (blue) were acquired using the same method. In addition, tissue slices adjacent to those shown in Fig. 2 were stained with antibody for ionized calcium-binding adapter molecule (Iba-1, magenta) to label microglia (Fig. S2). The confocal fluorescence microscopy images of tissue samples reveal several important points. First, images from the 2-wk mesh electronics-implanted samples (Fig. 2A and Fig. S2A) show that axons (NF) interpenetrate the mesh boundary to the probe interior, there is little overexpression of microglia (Iba-1), and there is only a slight accumulation of astrocytes (GFAP). In contrast, strong accumulation of astrocytes and a 20- to 50-μm neuron depletion zone (i.e., greatly reduced NeuN and NF) was observed around flexible thin-film probes at 2 wk (Fig. 2D), as well as substantial accumulation of microglia (Fig. S2D).
Fig. 2.
Time-dependent histology of horizontal tissue slices containing implanted mesh electronics and flexible thin-film probes. Confocal fluorescence microscopy images of horizontal tissue slices containing mesh electronics/flexible thin-film probes at 2 wk (A and D), 4 wk (B and E), and 3 mo (C and F) postimplantation. In all of the panels the image labels were NeuN (I, green), NF (II, red), GFAP (III, cyan), and NeuN, NF, GFAP composite (IV). The mesh electronics and flexible thin-film cross-sections are pseudocolored blue. (Scale bars in all images, 100 μm.)
Fig. S1.
DIC microscopy images of horizontal sectioned samples of implanted mesh electronics probes in mice brains at (A) 2 wk, (B) 4 wk, and (C) 3 mo postinjection. Longitudinal mesh elements with encapsulated metal interconnects appear as dark features (e.g., green arrow in A) and SU-8–only elements appear as lighter gray features (e.g., red arrow in A) at the middle of each image. The DIC images were acquired from the same region of the same tissue slices used to obtain the confocal microscopy images in Fig. 2 A–C; the mesh features imaged by DIC are shown as pseudocolored blue in the composite images shown in Fig. 2 A–C. (Scale bars in all images, 100 μm.)
Fig. S2.
Time-dependent histology of chronically implanted mesh electronics (A–C) and flexible thin-film probes (D–F) in mice brains (horizontal sections). Tissue slices are labeled with Iba-1 (magenta) to highlight microglia; mesh electronics and flexible thin-film probes were imaged by DIC and are pseudocolored blue. (Scale bars in all images, 100 μm.)
Second, images from the intermediate 4-wk mesh electronics-implanted samples (Fig. 2B and Fig. S2B) show that (i) there is no astrocyte and little or no microglia accumulation near the mesh elements, (ii) axons interpenetrated into the interior region and the tissue is continuous within and across the boundaries of the mesh, and (iii) there are neuron somata near and/or close to the interior boundary of mesh elements. Significantly, images from 3-mo mesh electronics-implanted samples (Fig. 2C and Fig. S2C) exhibit axons and neuron somata within the mesh electronics interior at levels close to the signals hundreds of microns away, and, additionally, background levels of astrocytes and microglia around the mesh elements. It is also worthwhile to note that the penetration of axons and neuron somata into mesh interior is not correlated with statistically significant contraction of the mesh. Specifically, acute microcomputed tomography (micro-CT) images of mesh electronics implanted into mouse brains (Fig. S3) show mesh diameters similar to those estimated from the optical microscopy studies of horizontal sections from samples at 2, 4, and 12 wk (Fig. 2 A–C). In comparison, images of 4-wk and 3-mo flexible thin-film probe-implanted samples (Fig. 2 E and F) maintain the substantial accumulation of astrocytes and depletion of neuron somata around the thin film that is consistent with glial scarring (30, 32).
Fig. S3.
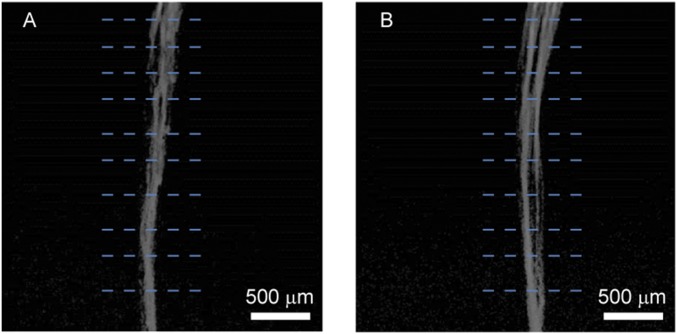
(A and B) Micro-CT images of two different mesh electronics implanted into a mouse brain in an acute manner. Diameter measurements of each mesh at 10 randomly selected positions (blue dashed lines) resulted in average diameters of 163 ± 40 μm for the mesh in A and 215 ± 44 μm for the mesh in B.
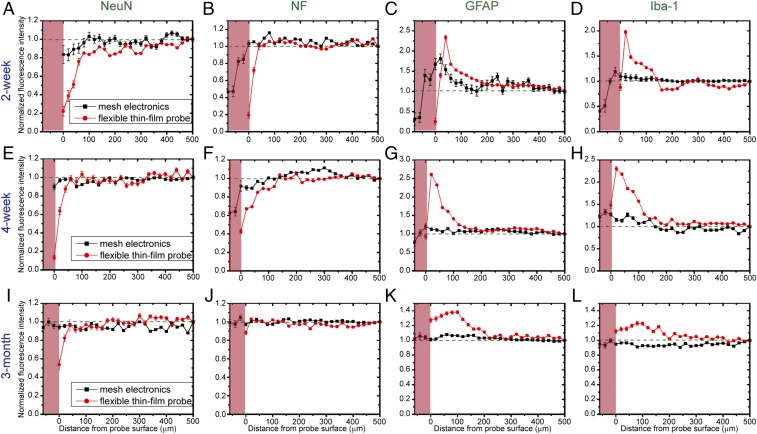
To quantify the above observations we have analyzed confocal microscopy images of the different antibody cell marker distributions as a function of distance from the surface of mesh and thin-film probes at 2 wk, 4 wk, and 3 mo, as shown in Fig. 3. In these plots, the relative specific cell marker signal was obtained by normalizing the fluorescence intensity with the baseline value defined as the fluorescence intensity averaged over a range of 500–520 μm away from the probe (Materials and Methods and SI Text). Several key findings are evident from these plots. First, at all times the mesh electronics show lower increases in GFAP (astrocytes) and Iba-1 (microglia) signals near the probe surfaces than the flexible thin films. For 2-wk samples, the GFAP (Fig. 3C) and Iba-1 signals (Fig. 3D) at the surface of flexible thin-film probes was 1.3 and 1.7 times the maximum of the mesh electronics, respectively. Importantly, the 4-wk and 3-mo mesh electronics-implanted samples show that the GFAP (Fig. 3 G and K) and Iba-1 (Fig. 3 H and L) signals return to baseline at the surface of the mesh electronics, while remaining elevated by ca. 2 and 1.3 times, respectively, at the flexible thin-film probe surfaces. In addition, these data show that both astrocytes and microglia penetrate to the interior of the mesh electronics reaching baseline levels at 3 mo; that is, there is near normal distribution of these cells across the entire sample.
Fig. 3.
Fluorescence intensity as a function of distance from the probe boundary for mesh electronics (black) and flexible thin-film probe (red) analyzed based on zoomed-out images of those shown in Fig. 2 and Fig. S2 with a field of view of 1,275 μm × 1,275 μm. (A–D) Fluorescence intensity of NeuN, NF, GFAP, and Iba-1, respectively, for 2-wk postimplanted samples. (E–H) Fluorescence intensity of NeuN, NF, GFAP, and Iba-1, respectively, for 4-wk postimplanted samples. (I–L) Fluorescence intensity of NeuN, NF, GFAP, and Iba-1, respectively, for 3-mo postimplanted samples. The pink shaded regions indicate interior of mesh electronics. Details of methods that were used to determine the boundary of mesh electronics and to average and normalize fluorescence intensity values of pixels in the images are described in SI Text and Fig. S4. Error bars represent the SEM.
Second, the NeuN (neuron somata) signals showed little or no decrease when approaching the mesh electronics probe surface for 4-wk (Fig. 3E) and 3-mo (Fig. 3I) samples, whereas there were 90% and 50% decreases at the same times near the surfaces of the flexible thin-film probes. Notably, these data also show that the NeuN signal is ca. 95% of baseline within the mesh electronics interior for 3-mo samples (Fig. 3I). In addition, at all times the NF (axons) signals for the mesh electronics showed little or no decrease near the probe surfaces, whereas NF signals are reduced from 90 to 10% from 2 wk to 3 mo near the flexible thin-film surfaces (Fig. 3 B, F, and J). These data further showed NF signals within the mesh electronics interior at all times, and that the interior NF signal is the same as baseline at 3 mo.
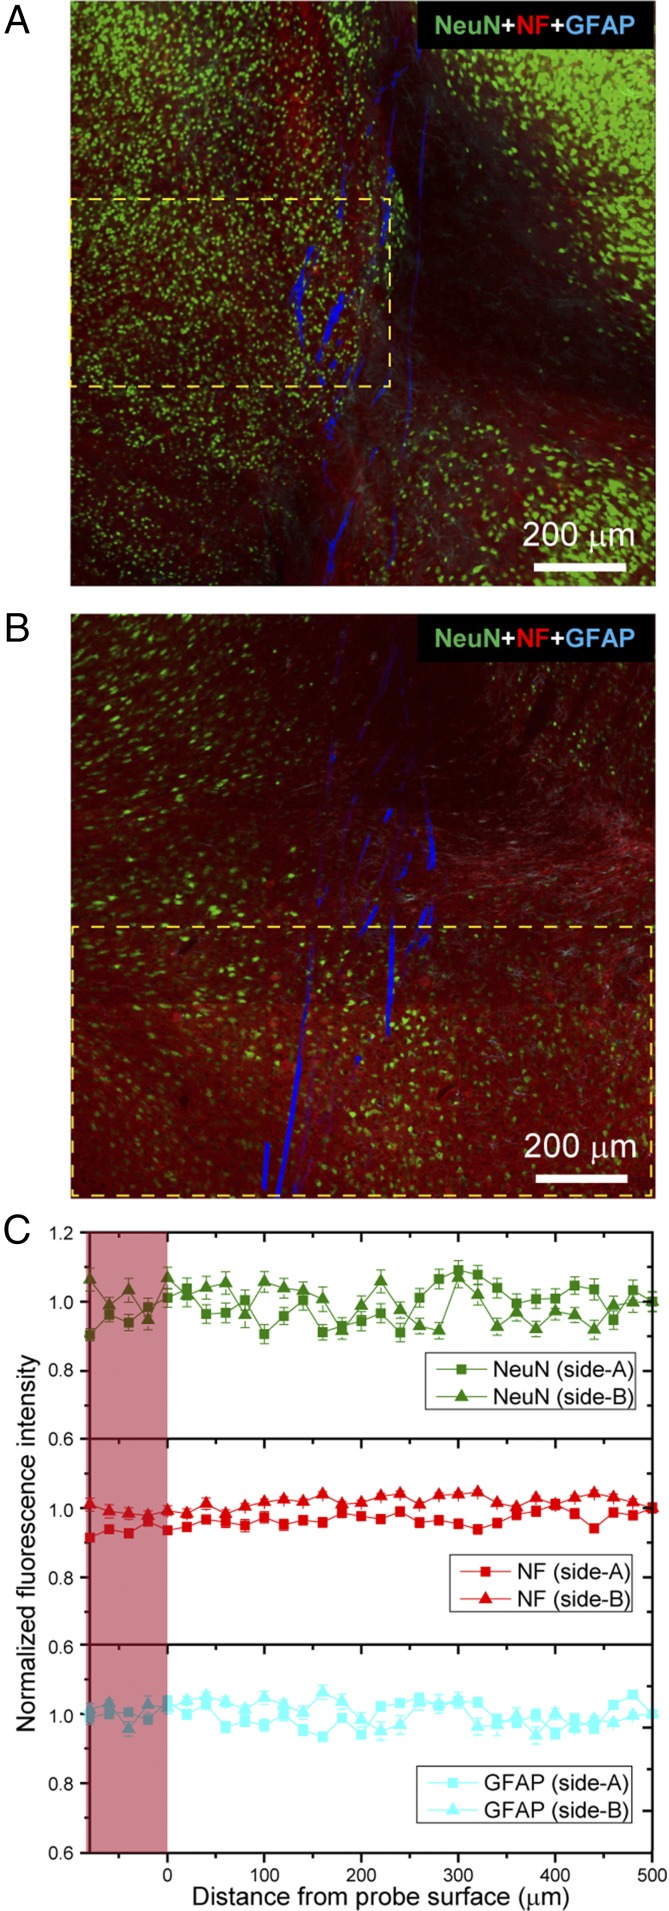
The horizontal brain slices described above provide detailed information about the local tissue/probe interfaces for the mesh electronics and flexible thin-film implants and also allow comparison with previous studies of more rigid conventional probes (29, 30, 32, 33). These horizontal sections cannot, however, provide a global view of the probe/tissue interface, which typically extends millimeters in depth in the mouse brain. As a step toward addressing this key issue we carried out histology studies on a sagittal brain section parallel to the mesh electronics injection axes and containing nearly the entire length of the probe within the tissue slice at 3 mo postimplantation (Materials and Methods and SI Text). The confocal microscopy images (Fig. 4 A and B and Fig. S5), which were recorded from both sides of the tissue slice at a depth of ca. 5 μm due to limited diffusion of the antibody labels through the ca. 200-μm-thick sagittal slice (Materials and Methods and SI Text), highlight several key points. First, there is no evidence for proliferation of astrocytes (GFAP) or depletion of axons (NF) adjacent to the mesh electronics elements, which span >1 mm in length for these ca. 1.3- × 1.3-mm images. Second, there seems to be nearly uniform penetration of axons through and density within the mesh probe elements, although there are some variations across the images as a whole. Third, although there are image-wide variations in the density of neuron somata (NeuN), examination of similar density regions indicate that neuron somata density is similar in the mesh electronics interior and adjacent exterior regions over length scales of at least 0.5 mm (e.g., yellow dashed box, Fig. 4B). Analysis of the normalized fluorescence intensity for NeuN, NF, and GFAP (Fig. 4C) allows the above observations to be quantified (Materials and Methods and SI Text). For example, the GFAP and NF normalized signals analyzed for each side of the sagittal slice demonstrate a uniform distribution of astrocytes and axons, respectively, from ca. 0.5 mm away from the probe surface through its interior along the ∼1.3-mm length of the probe. In addition, analysis of NeuN signals from regions of relatively uniform distribution on both sides of the tissue slice clearly show that the density of neuron somata is approximately the same within the mesh interior as far away as over at least the 0.4- to 0.5-mm lengths analyzed.
Fig. 4.
Histology of a sagittal tissue slice containing nearly the full implanted mesh electronics probe. (A and B) Confocal fluorescence microscopy images of a sagittal tissue slice including the mesh electronics probe at 3 mo postimplantation. Each of the images are 3×3 composite images recorded directly in the Tile Scan mode, where each component image of the Tile Scan had a field of view of 425 µm × 425 µm. The tissue slice was stained with antibodies for NeuN (green), NF (red), and GFAP (cyan); the mesh is shown as pseudocolored blue. The images were recorded at an optical focal plane ca. 5 μm below the surfaces of side-A (A) and side-B (B). (C) Fluorescence intensity as a function of distance from the boundary of the mesh electronics in images of side-A (A) and side-B (B). The pink shaded regions indicate interior of mesh electronics on each side. The NF and GFAP fluorescence intensity was analyzed based on the entire images, and the NeuN fluorescence intensity was analyzed based on the regions shown in yellow dashed boxes in A and B. Error bars represent SEM.
Fig. S5.
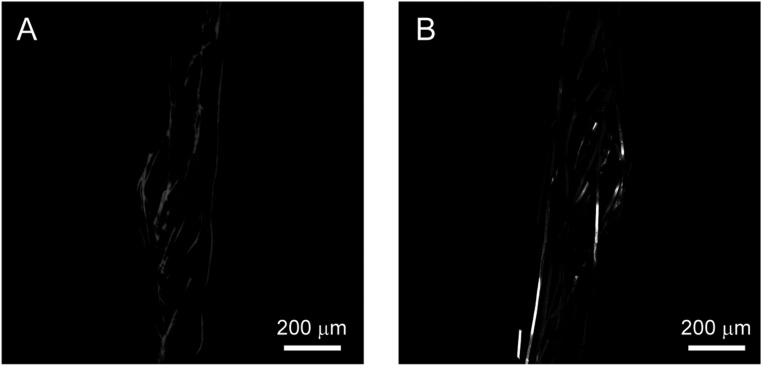
Mesh electronics images from the sagittal tissue slice. Images were acquired in reflection mode of the confocal microscope (see SI Text for details). (A and B) Reflection images of mesh electronics from side-A and side-B, respectively, of the sagittal tissue slice images shown in Fig. 4 A and B. Each of the images are 3×3 composite images recorded directly in the Tile Scan mode, where each component image of the Tile Scan had a field of view of 425 µm × 425 µm. The mesh electronics elements were extracted from these reflection images and then merged with corresponding confocal fluorescence images shown in Fig. 4 (SI Text).
These histology results for both horizontal and sagittal sections highlight several unique features of the implanted mesh electronics compared with conventional probes. First, the mesh electronics produces little inflammation at short times (2 wk) postimplantation, and, moreover, there is essentially no evidence for immune response—no elevation of astrocytes or microglia, and no glial scar formation—at longer times. In contrast, conventional silicon, microwire, and flexible thin-film probes, which have orders of magnitude greater bending stiffness (i.e., are more rigid) elicit a substantial inflammatory response postimplantation as evidenced by the accumulation of astrocytes and microglia and of glial scar formation around these implanted probes (refs. 15–19, Figs. 2 D–F and 3, and Fig. S2 D–F). Second, and perhaps most important, the mesh electronics do not adversely affect the distributions of neuron somata and axons adjacent to mesh electronics implant elements. Moreover, the macroporous open structure of the mesh electronics enables axons and neuron somata to penetrate into its interior with natural cell distributions over at least ca. millimeter length scales at longer times. However, conventional rigid and flexible thin-film probes usually introduce a 20- to 50-μm depletion region of neurons and thus yield interfaces distinct from natural tissue (refs. 15–19, Figs. 2 D–F and 3, and Fig. S2 D–F). Hence, the mesh electronics yield a seamless integration of probes with neural tissue not possible with more rigid conventional probes, and moreover the penetration of neurons through the open mesh structure can yield a relatively large electrophysiological mapping area with only a very small cost (<1% vs. a solid probe) of occupation volume.
Conclusion
We have conducted systematic time-dependent histology studies of the interface of mesh electronics and flexible thin-film probes with brain tissue. The results show that mesh electronics lead to much less inflammation and damage to surrounding neurons than flexible thin-film probes at short times, and, moreover, the mesh electronics exhibit essentially no evidence for chronic immune response and does not adversely affect the natural distribution of neurons at longer times. The small amount of tissue damage and astrocyte proliferation observed in mesh electronics/tissue samples at 2 wk postimplantation, which recovers by 4 wk, can be attributed to acute damage during the initial implantation. Thus, it should be possible to reduce this acute damage by using smaller-diameter needles for mesh injection and possibly speed the recovery time by coinjection of drugs that reduce inflammation (34, 35) and/or biochemical modification of the mesh electronics (36–39). More importantly, interpenetration of axons and neuron somata into the interior of mesh electronics allows for the formation of a seamless interface between mesh electronics and neural tissue in a manner not previously achieved with more conventional probes. This observation of seamless integration and the ultraflexibility of mesh electronics suggests that the mesh electronics could affect related areas such as implants to, for example, the spinal cord and neuromuscular junctions (40, 41), as well as opening a new window for brain–machine interfaces and cyborg animals (42–44).
Materials and Methods
Fabrication of Syringe-Injectable Mesh Electronics and Flexible Thin Film.
Mesh electronics were fabricated following procedures reported previously (23, 25, 26). Key steps in mesh electronics fabrication are described in SI Text. In brief, (i) an Ni sacrificial layer with a thickness of 100 nm was thermally evaporated (Sharon Vacuum) onto a 3-inch Si wafer, (ii) a 420-nm layer of negative photoresist SU-8 (SU-8 2000.5; MicroChem Corp.) was spin-coated on the Si wafer then patterned by PL, (iii) PL and thermal deposition were used to pattern and deposit metal interconnects Cr/Au (5/100 nm) and Pt sensing electrodes Cr/Pt (5/50 nm) on the SU-8 layer, (iv) and step ii was repeated to pattern an SU-8 passivation layer, serving as the top insulating layer of the metal interconnects. Flexible thin film was prepared by cutting polyimide film (Kapton, 25 μm in thickness; CS Hyde Company) into small probes with a width of ca. 500 μm and length of ca. 4 mm.
Stereotaxic Surgery and Probe Implantation into Mice Brains.
Key steps for stereotaxic surgery and implantation of mesh electronics and flexible thin-film probes are described in SI Text. In brief, all tools and probes were sterilized before using. An anesthetized mouse (adult male C57BL/6J mice; Jackson Laboratory) was fixed on a stereotaxic frame (Lab Standard Stereotaxic Instrument) to perform surgery and implantation of probes.
All procedures performed on the mice were approved by the Animal Care and Use Committee of Harvard University. The animal care and use programs at Harvard University meet the requirements of the federal law (89-544 and 91-579) and NIH regulations and are also accredited by the American Association for Accreditation of Laboratory Animal Care.
Histology Sample Preparation.
Key steps for sample preparation are described in SI Text. In brief, mice with implanted mesh electronics or flexible thin film at postimplantation times of 2 wk, 4 wk, and 3 mo were anesthetized and then transcardially perfused with 1× PBS, followed with 4% formaldehyde (Sigma-Aldrich) before decapitation. The brain was resected from the cranium and placed in 4% formaldehyde for 24 h and then transferred to 1× PBS for 24 h at 4 °C to remove remaining formaldehyde. For horizontal sectioning, the brain was cryoprotected, embedded, and then sectioned into 10-µm-thick horizontal slices using Leica CM1950 cryosectioning instrument (Leica Microsystems). For sagittal sectioning, the brain was embedded in 3% agarose (SeaPlaque Lonza Group Ltd.) hydrogel after being fixed in 4% formaldehyde, imaged by micro-CT to determine mesh probe orientation, and sectioned into 200-μm slices through vibratome stage (VT1000 S vibrating blade microtome; Leica).
Immunohistochemistry.
Horizontal brain tissue sections were rinsed three times in 1× PBS and blocked using a blocking solution consisting of 0.3% Triton X-100 (Life Technologies) and 5% goat serum (Life Technologies) in 1× PBS for 1 h at room temperature. Slices were then incubated with the primary antibodies, rabbit anti-NeuN (1:200 dilution; Abcam), mouse anti-neurofilament (1:400 dilution; Abcam), rat anti-GFAP (1:500 dilution; Thermo Fisher Scientific), or rabbit anti-Iba1 (1:400 dilution; Wako Chemicals) containing 0.3% Triton X-100 and 3% goat serum overnight at 4 °C. After incubation, slices were rinsed nine times for total of 45 min with 1× PBS, before they were incubated with the secondary antibodies, Alexa Fluor 488 goat anti-rabbit (1:200 dilution; Abcam), Alexa Fluor 568 goat anti-mouse (1:200 dilution; Abcam), and Alexa Fluor 647 goat anti-rat (1:200 dilution; Abcam), for 1 h at room temperature. Slices were then rinsed nine times for a total of 30 min before they were mounted on glass slides with coverslips using ProLong Gold Antifade Mountant (Life Technologies). The slides remained in the dark at room temperature for at least 24 h before microscopic imaging. Sagittal brain tissue sections were rinsed three times in 1× PBS and blocked using a solution consisting of 0.3% Triton X-100 (Life Technologies) and 5% goat serum (Life Technologies) in 1× PBS for 6 h at room temperature. Slices were then incubated with the primary antibodies, rabbit anti-NeuN (1:200 dilution; Abcam), mouse anti-neurofilament (1:400 dilution; Abcam), and rat anti-GFAP (1:500 dilution; Thermo Fisher Scientific Inc) containing 0.3% Triton X-100 and 3% goat serum for 12 h at 4 °C and then flipped over for another 12 h at 4 °C. After incubation, slices were rinsed three times every hour for a total of 6 h. Then they were incubated with the secondary antibodies, Alexa Fluor 488 goat anti-rabbit (1:200 dilution; Abcam), Alexa Fluor 568 goat anti-mouse (1:200 dilution; Abcam), and Alexa Fluor 647 goat anti-rat (1:200 dilution; Abcam) for 6 h and flipped over for another 6 h at room temperature. Slices were then rinsed three times every hour for a total of 6 h before they were mounted on glass slides with coverslips using ProLong Gold Antifade Mountant (Life Technologies). The slides remained in the dark at room temperature for at least 24 h before microscopic imaging.
Imaging and Image Data Analysis.
Confocal fluorescence imaging of the samples was acquired on a Zeiss LSM 880 confocal microscope (Carl Zeiss Microscopy GmbH). Confocal images of antibody-labeled horizontal slices in Fig. 2 and Fig. S2 were acquired using 488-, 561-, and 633-nm lasers as the excitation sources for Alexa Fluor 488, Alexa Fluor 568, and Alexa Fluor 647, respectively, and a 1-Airy unit (AU) pinhole. The mesh electronics in each slice was imaged with DIC on the same microscope (Fig. S1) and was assigned as a false blue color in the composite images (SI Text). Images of flexible thin-film probes were acquired using the same method. Confocal images from both sides of the antibody-labeled sagittal slice in Fig. 4 were acquired using the same excitation sources as above, a 3-AU pinhole, which yields an optical section thickness of ca. 9 μm, and image planes centered at ca. 5 μm below surfaces of the sample. The mesh electronics in Fig. 4 were imaged in reflection mode using the same confocal microscope and imaging conditions (Fig. S5 and SI Text).
ImageJ software and custom MATLAB software were used for image analysis of both horizontal and sagittal slices (SI Text). In short, the distance of each pixel from mesh electronics in a given image was defined as its shortest distance from mesh boundary and the intensity values for all pixels with distances binned over an interval of 20 μm were averaged and normalized against the baseline intensity, which is defined as the average fluorescence intensity of all pixels 500–520 μm away from the mesh boundary.
SI Text
Fabrication of Syringe-Injectable Mesh Electronics.
The syringe-injectable mesh electronics used in these studies had design parameters similar to previous reports (23, 25, 26) with (i) total mesh width, W = 2 mm; (ii) widths of longitudinal SU-8 elements, w1 = 20 μm, and transverse SU-8 elements, w2 = 20 μm; (iii) angle between longitudinal and transverse elements, α = 45°; (iv) spacing or pitch of the transverse elements, L1 = 333 μm, and longitudinal elements, L2 = 250 μm; (v) gold interconnect line width, wm = 10 μm; and (vi) three-layer sandwich structure (SU-8 polymer/metal/SU-8 polymer, as indicated in Fig. 1A, II) for longitudinal ribbons and two-layer structure (SU-8 polymer/SU-8 polymer) for transverse ribbons. The mesh electronics fabrication was carried out using published methods (26, 28) with key steps as follows. (i) A 100-nm-thick sacrificial layer of Ni was thermally evaporated onto a 3-inch Si wafer (600-nm thermal oxide; Nova Electronic Materials), which was precleaned in an oxygen plasma (50 W, 1 min). (ii) Negative photoresist SU-8 (SU-8 2000.5; MicroChem Corp.) was spin-coated on the wafer to a thickness of ca. 420 nm, prebaked sequentially at 65 °C for 1 min and 95 °C for 4 min, and then patterned to the bottom layer mesh structure by PL. After PL exposure the sample was postbaked sequentially at 65 °C for 1 min and 95 °C for 3 min. (iii) The SU-8 photoresist was then developed (SU-8 Developer; MicroChem Corp.) for 1.5 min, rinsed with isopropanol, dried in a N2 flow, and hard-baked at 180 °C for 1 h. (iv) The wafer was then cleaned in an oxygen plasma (50 W, 1 min), spin-coated with MCC Primer 80/20 and LOR 3A lift-off resist (MicroChem Corp.), and baked at 180 °C for 5 min. After cooling, the wafer was spin-coated with Shipley 1805 positive photoresist (Microposit; Dow Chemical Company), baked at 115 °C for 4 min, and then the pattern for metal features was defined by PL and developed in MF-CD-26 (Microposit; Dow Chemical Company) for 90 s. (v) A 5-nm-thick Cr layer and a 100-nm-thick Au layer were thermally evaporated, followed by a lift-off step (Remover PG; MicroChem Corp.) (vi) Steps iv and v were repeated for patterning and deposition of the Pt sensing electrodes (Cr/Pt, 5 nm/50 nm). (vii) Steps ii and iii were repeated for patterning the top SU-8 layer, which was aligned to the bottom SU-8 layer and served to fully encapsulate the metal interconnect lines but not the Pt sensing electrodes. (viii) Finally, the Si wafer was cleaned in an oxygen plasma (50 W, 1 min), and then transferred to a Ni etchant solution (40% FeCl3:39% HCl:H2O = 1:1:20) to remove the sacrificial Ni layer and release the mesh electronics from the Si substrate.
Effective Bending Stiffness of Implanted Probes.
The effective bending stiffness per width of the three-layer longitudinal ribbon elements in the mesh, D1, can be estimated as (45)
| [S1] |
where Es is Young’s modulus of SU-8, Em is Young’s modulus of gold, h is the total ribbon thickness, hm is the metal thickness, w1 is the width of the SU-8 ribbon elements, and wm is the width of metal. The Young’s modulus values are Es = 2 GPa and Em = 79 GPa (26), and with other experimental values of h = 948 ± 10 (SD) nm, hm = 105 nm, w1 = 20 µm, and wm = 10 µm, then yields D1 = 0.104 ± 0.005 (SD) nN⋅m.
The effective bending stiffness of the longitudinal ribbon elements of the mesh was also estimated with finite element software ABAQUS as reported previously (23). The composite cross-section of the longitudinal ribbon consists of two layers of SU-8 with total thickness of 843 nm, width of 20 µm and a 105-nm-thick gold layer with width of 10 µm between the two SU-8 layers (as indicated by the cross-section view in Fig. 1A, II). Young’s moduli of 2 GPa for SU-8 and 79 GPa for gold (as above) were used in the simulation with the longitudinal ribbon treated as a free beam. The simulated bending stiffness of a single longitudinal ribbon, 0.125 nN⋅m, is consistent with the value determined above using Eq. S1, and the longitudinal and transverse bending stiffness values determined from our previous simulation of the mesh 2D single unit cell (23).
The effective bending stiffness per width of standard polyimide flexible thin-film probes (30), D2, is given by (45)
| [S2] |
where Ep is the Young’s modulus of polyimide and hp is the thickness of the probe. When Ep = 2.5 GPa and hp = 25 µm, then D2 = 3.3 × 10³ nN⋅m.
Vertebrate Animal Subjects.
Adult male C57BL/6J mice (Jackson Laboratory) were used in this study. All procedures performed on the mice were approved by the Animal Care and Use Committee of Harvard University. The animal care and use programs at Harvard University meet the requirements of the federal law (89-544 and 91-579) and NIH regulations and are also accredited by the American Association for Accreditation of Laboratory Animal Care. Animals were group-housed on a 12-h:12-h light:dark cycle in Harvard University’s Biology Research Infrastructure and given food and water for ad libitum consumption as appropriate.
Stereotaxic Surgery and Probe Implantation.
Key steps for in vivo implantation of mesh or polyimide flexible thin-film electronic probes into live mice brains include the following. (i) All probes were sterilized with 70% ethanol before use. Mesh electronics were sterilized with 70% ethanol and rinsed in sterile deionized water then transferred into sterile 1× PBS. Flexible thin-film probes (25 μm in thickness, ca. 500 μm in width) were sterilized with 70% ethanol and dried with nitrogen. (ii) Mice were anesthetized through i.p. injection of a mixture of ketamine (75 mg/kg; Patterson Veterinary Supply Inc.) and dexdomitor (1 mg/kg; Orion Corp.) and verified via toe pinch before surgery. A heating pad (37 °C) was placed under mice during surgery to maintain appropriate body temperature. (iii) Mouse hair was removed using lotion (Nair; Church & Dwight) and iodophor was applied to sterilize the depilated scalp skin. (iv) A 1-cm longitudinal incision along the sagittal sinus was made and the skin was resected to expose a 5- × 5-mm portion of the skull. (v) A 1-mm-diameter hole was drilled using a dental drill (micromotor with on/off pedal 110/220; Grobet USA) with stereotaxic coordinates of anteroposterior −1.70 mm and mediolateral 2.00 mm, and the dura was removed. (vi) Flexible thin-film probes were inserted 4 mm into the mouse brain through the hole; mesh electronics were loaded into a glass capillary needle with i.d. of 400 μm and o.d. of 650 μm (Produstrial LLC) and then injected into the mouse brain using our reported controlled injection procedure (25). The wound is sealed by applying Metabond enamel etchant gel (Parkell Inc.) over the exposed cranial bone and the skin was sealed by using 3M Vetbond Tissue Adhesive (Santa Cruz Biotechnology Inc.)
Postoperative Care of Animals.
Antibiotic ointment (WATER-JEL Technologies) was applied copiously around the wound after surgery. The mouse was returned to a cage equipped with a 37 °C heating pad and its activity monitored every hour until it fully recovered from anesthesia. Buprenex (buprenorphine; Patterson Veterinary Supply Inc.) was administered intraperitoneally at a dose of 0.05 mg/kg body weight every 12 h for up to 72 h postsurgery.
Histology Sample Preparation for Horizontal Sections.
Mice implanted with mesh or flexible thin-film probes at postinjection/implantation times of 2 wk, 4 wk, and 3 mo were anesthetized with ketamine and dexdomitor as above and then were transcardially perfused with 1× PBS, followed with 4% formaldehyde (Sigma-Aldrich) before decapitation. The scalp skin was removed and exposed skull at the probe insertion site was ground for 10–20 min at 10,000 rpm using a high-speed rotary tool (Dremel). The brain was resected from the cranium and placed in 4% formaldehyde for 24 h to fix brain tissue and then transferred to 1× PBS for another 24 h at 4 °C to remove remaining formaldehyde. The brain was transferred to incrementally increasing sucrose solutions (10–30%) (Sigma-Aldrich) at 4 °C to cryoprotect the tissue. Then, the brain was transferred to optimum cutting temperature compound (Tissue-Tek O.C.T. Compound; VWR) and frozen at −80 °C. The frozen sample was sectioned into 10-µm-thick horizontal slices using a Leica CM1950 cryosectioning instrument (Leica Microsystems).
Histology Sample Preparation for Sagittal Sections.
Mice implanted with mesh electronics probes at 3 mo postimplantation were transcardially perfused, and then the brains were resected as described above in the preparation of horizontal sections. The brains were placed in 4% formaldehyde for 24 h and then transferred to 1× PBS for another 24 h at 4 °C to remove remaining formaldehyde. The brains were then embedded in 3% agarose (SeaPlaque Lonza Group Ltd.) hydrogel, cut into cubes of 1 cm (height) × 2 cm (length) × 2.5 cm (width), and imaged by micro-CT to define the polar angle θ in the spherical coordinate system (usually less than 15°) between the surface of the hydrogel and the longitudinal axis of the mesh probe. The hydrogel cubes were then cut using a homemade sectioning machine according to measured angle θ to make one surface of the cube parallel to the longitudinal axis of the implanted mesh and also parallel to the midline of the brain. The cubes with this defined surface/probe orientation were then mounted on a vibratome (VT1000 S vibrating blade microtome; Leica) stage and sectioned into 200-μm slices.
Imaging and Image Data Analysis.
Confocal fluorescence microscopy images were acquired on a Zeiss LSM 880 confocal microscope (Carl Zeiss Microscopy GmbH). Confocal images of antibody-labeled horizontal slices in Fig. 2 and Fig. S2 were acquired using 488-, 561-, and 633-nm lasers as the excitation sources for Alexa Fluor 488, Alexa Fluor 568, and Alexa Fluor 647, respectively, and a 1-AU pinhole. The mesh electronics in each slice was imaged with DIC on the same microscope (Fig. S1). Mesh electronics elements were extracted from DIC images as false blue color using MATLAB. The extracted images were then merged with corresponding confocal images using ImageJ software for composite images shown in Fig. 2 and Fig. S2. Images of flexible thin-film probes were acquired using the same method, where the flexible thin-film probes are assigned a false blue color in the composite images. Confocal images of the antibody-labeled sagittal slice in Fig. 4 were acquired using the same excitation sources as above, a 3-AU pinhole, which yields an optical section thickness of ca. 9 μm, and imaging plane centered at ca. 5 μm below the surface of the sample. The mesh electronics in Fig. 4 were imaged with reflection mode of the same confocal microscope by collecting reflected photons with zero Stokes shift off the highly reflective metal interconnect lines in the mesh and the same 3-AU pinhole (Fig. S5). The mesh electronics elements were extracted from reflection images as a false blue color using MATLAB and then merged with corresponding confocal images using ImageJ software for composite images shown in Fig. 4. Both sides of the sagittal slice were imaged with the same method and shown in Fig. 4A (side-A) and Fig. 4B (side-B), respectively.
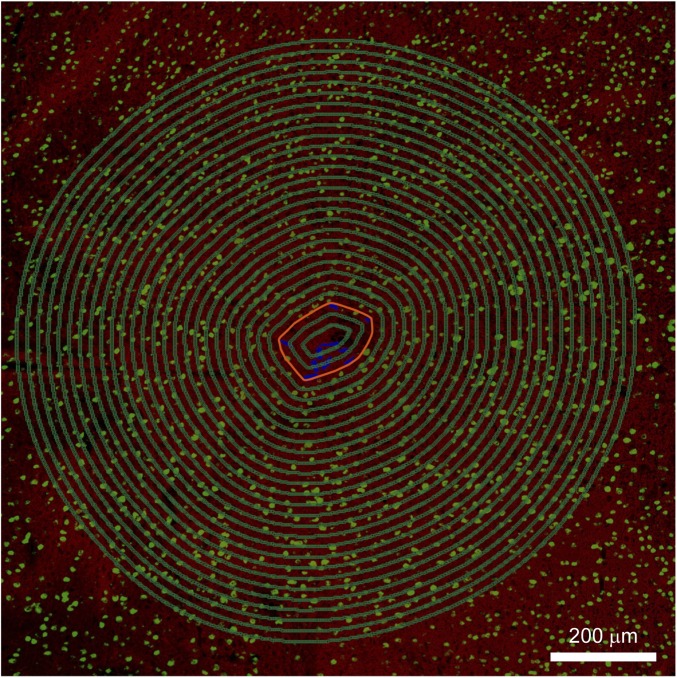
Custom MATLAB software was used for analysis of the fluorescence intensity in confocal microscope images. Fluorescence intensities of NF, NeuN, GFAP, and Iba-1 were analyzed based on zoomed-out images of those shown in Fig. 2 and Fig. S2 with a field of view of 1,275 μm × 1,275 μm and the images in Fig. 4. The analysis procedure was the similar for all of these images and follows the specific example of the horizontal-slice shown in Fig. S4, from a zoom-out of Fig. 2B, IV. First, the mesh boundary was defined by a polygon (red-orange, Fig. S4) that is drawn to encompass all mesh ribbons tangentially. This mesh boundary separates all pixels in a given image into “interior” pixels (used for plotting within the pink shaded regions of Fig. 3) and “exterior” pixels (used for plotting outside the pink shaded regions of Fig. 3). The distance of each pixel from mesh electronics was defined as its shortest distance to the boundary of mesh electronics (the red-orange polygon). Pixels in the image were grouped according to the distances from mesh electronics. As shown in Fig. S4, all pixels on each of the green polygons share the same distance from the mesh boundary. The fluorescence intensity of each pixel was obtained and the intensity values for all pixels with distances binned over an interval of 20 μm were averaged and then normalized by the baseline intensity defined as the average fluorescence intensity of all pixels 500–520 μm away from the mesh boundary. The same method was used for the fluorescence intensity analysis of images in Figs. 2 and 4 and Fig. S2, including the flexible thin-film probes. For Fig. 4, NF and GFAP fluorescence intensity was analyzed based on entire images, whereas the NeuN fluorescence intensity was analyzed based on the regions shown in yellow dashed boxes. These boxed regions were selected to have a relatively homogeneous neuron distribution. The pink shaded regions in Figs. 3 and 4 indicate the interior of mesh electronics, and the zero distance corresponds to the surfaces of the mesh electronics and flexible thin-film probes.
Fig. S4.
Schematic of the fluorescence intensity data analysis based on the zoomed-out image (3×3 composite image recorded directly in the Tile Scan mode, where each component image of the Tile Scan had a field of view of 425 µm × 425 µm) of Fig. 2B, IV with a field of view of 1,275 μm × 1,275 μm. The red-orange polygon indicates the mesh boundary that is drawn according to the method described in SI Text. The green polygons in the image indicate groups of pixels that share the same distance from mesh boundary. The space between two adjacent green polygons is 20 μm.
Micro-CT Imaging and Analysis.
Images (Fig. S3) and the orientations of injected mesh electronics probes in fixed mouse brain tissue at different times postimplantation (acute–3 mo) were determined using an HMXST micro-CT X-ray scanning system with a standard horizontal imaging axis cabinet (HMXST225; Nikon Metrology). Typical imaging parameters were 65 kV and 130 μA (no filter). Shading correction and flux normalization were applied before scanning to adjust the X-ray detector. CT Pro-3D software (Nikon-Metris) was used to calibrate centers of rotation and to reconstruct the images. VGStudio MAX software (Volume Graphics GMbh) was used for 3D rendering and analysis of the reconstructed images.
Acknowledgments
C.M.L. acknowledges support of this work by the F-Prime Biomedical Research Initiative. G.H. is supported by American Heart Association Postdoctoral Fellowship 16POST27250219.
Footnotes
The authors declare no conflict of interest.
This article contains supporting information online at www.pnas.org/lookup/suppl/doi:10.1073/pnas.1705509114/-/DCSupplemental.
References
- 1.Cash SS, Hochberg LR. The emergence of single neurons in clinical neurology. Neuron. 2015;86:79–91. doi: 10.1016/j.neuron.2015.03.058. [DOI] [PMC free article] [PubMed] [Google Scholar]
- 2.Yuste R. From the neuron doctrine to neural networks. Nat Rev Neurosci. 2015;16:487–497. doi: 10.1038/nrn3962. [DOI] [PubMed] [Google Scholar]
- 3.Carandini M. From circuits to behavior: A bridge too far? Nat Neurosci. 2012;15:507–509. doi: 10.1038/nn.3043. [DOI] [PubMed] [Google Scholar]
- 4.Eklund A, Nichols TE, Knutsson H. Cluster failure: Why fMRI inferences for spatial extent have inflated false-positive rates. Proc Natl Acad Sci USA. 2016;113:7900–7905. doi: 10.1073/pnas.1602413113. [DOI] [PMC free article] [PubMed] [Google Scholar]
- 5.deBettencourt MT, Cohen JD, Lee RF, Norman KA, Turk-Browne NB. Closed-loop training of attention with real-time brain imaging. Nat Neurosci. 2015;18:470–475. doi: 10.1038/nn.3940. [DOI] [PMC free article] [PubMed] [Google Scholar]
- 6.Poldrack RA, Farah MJ. Progress and challenges in probing the human brain. Nature. 2015;526:371–379. doi: 10.1038/nature15692. [DOI] [PubMed] [Google Scholar]
- 7.Gong Y, et al. High-speed recording of neural spikes in awake mice and flies with a fluorescent voltage sensor. Science. 2015;350:1361–1366. doi: 10.1126/science.aab0810. [DOI] [PMC free article] [PubMed] [Google Scholar]
- 8.Hochbaum DR, et al. All-optical electrophysiology in mammalian neurons using engineered microbial rhodopsins. Nat Methods. 2014;11:825–833. doi: 10.1038/nmeth.3000. [DOI] [PMC free article] [PubMed] [Google Scholar]
- 9.Hamel EJO, Grewe BF, Parker JG, Schnitzer MJ. Cellular level brain imaging in behaving mammals: An engineering approach. Neuron. 2015;86:140–159. doi: 10.1016/j.neuron.2015.03.055. [DOI] [PMC free article] [PubMed] [Google Scholar]
- 10.Khodagholy D, et al. NeuroGrid: Recording action potentials from the surface of the brain. Nat Neurosci. 2015;18:310–315. doi: 10.1038/nn.3905. [DOI] [PMC free article] [PubMed] [Google Scholar]
- 11.Chang EF. Towards large-scale, human-based, mesoscopic neurotechnologies. Neuron. 2015;86:68–78. doi: 10.1016/j.neuron.2015.03.037. [DOI] [PMC free article] [PubMed] [Google Scholar]
- 12.Viventi J, et al. Flexible, foldable, actively multiplexed, high-density electrode array for mapping brain activity in vivo. Nat Neurosci. 2011;14:1599–1605. doi: 10.1038/nn.2973. [DOI] [PMC free article] [PubMed] [Google Scholar]
- 13.Schwarz DA, et al. Chronic, wireless recordings of large-scale brain activity in freely moving rhesus monkeys. Nat Methods. 2014;11:670–676. doi: 10.1038/nmeth.2936. [DOI] [PMC free article] [PubMed] [Google Scholar]
- 14.Bhandari R, Negi S, Solzbacher F. Wafer-scale fabrication of penetrating neural microelectrode arrays. Biomed Microdevices. 2010;12:797–807. doi: 10.1007/s10544-010-9434-1. [DOI] [PubMed] [Google Scholar]
- 15.Lind G, Linsmeier CE, Schouenborg J. The density difference between tissue and neural probes is a key factor for glial scarring. Sci Rep. 2013;3:2942. doi: 10.1038/srep02942. [DOI] [PMC free article] [PubMed] [Google Scholar]
- 16.Polikov VS, Tresco PA, Reichert WM. Response of brain tissue to chronically implanted neural electrodes. J Neurosci Methods. 2005;148:1–18. doi: 10.1016/j.jneumeth.2005.08.015. [DOI] [PubMed] [Google Scholar]
- 17.Grill WM, Norman SE, Bellamkonda RV. Implanted neural interfaces: Biochallenges and engineered solutions. Annu Rev Biomed Eng. 2009;11:1–24. doi: 10.1146/annurev-bioeng-061008-124927. [DOI] [PubMed] [Google Scholar]
- 18.Marin C, Fernández E. Biocompatibility of intracortical microelectrodes: current status and future prospects. Front Neuroeng. 2010;3:8. doi: 10.3389/fneng.2010.00008. [DOI] [PMC free article] [PubMed] [Google Scholar]
- 19.Fattahi P, Yang G, Kim G, Abidian MR. A review of organic and inorganic biomaterials for neural interfaces. Adv Mater. 2014;26:1846–1885. doi: 10.1002/adma.201304496. [DOI] [PMC free article] [PubMed] [Google Scholar]
- 20.Canales A, et al. Multifunctional fibers for simultaneous optical, electrical and chemical interrogation of neural circuits in vivo. Nat Biotechnol. 2015;33:277–284. doi: 10.1038/nbt.3093. [DOI] [PubMed] [Google Scholar]
- 21.Luan L, et al. Ultraflexible nanoelectronic probes form reliable, glial scar-free neural integration. Sci Adv. 2017;3:e1601966. doi: 10.1126/sciadv.1601966. [DOI] [PMC free article] [PubMed] [Google Scholar]
- 22.Kozai TDY, et al. Ultrasmall implantable composite microelectrodes with bioactive surfaces for chronic neural interfaces. Nat Mater. 2012;11:1065–1073. doi: 10.1038/nmat3468. [DOI] [PMC free article] [PubMed] [Google Scholar]
- 23.Liu J, et al. Syringe-injectable electronics. Nat Nanotechnol. 2015;10:629–636. doi: 10.1038/nnano.2015.115. [DOI] [PMC free article] [PubMed] [Google Scholar]
- 24.Xie C, et al. Three-dimensional macroporous nanoelectronic networks as minimally invasive brain probes. Nat Mater. 2015;14:1286–1292. doi: 10.1038/nmat4427. [DOI] [PubMed] [Google Scholar]
- 25.Hong G, et al. Syringe injectable electronics: Precise targeted delivery with quantitative input/output connectivity. Nano Lett. 2015;15:6979–6984. doi: 10.1021/acs.nanolett.5b02987. [DOI] [PubMed] [Google Scholar]
- 26.Fu T-M, et al. Stable long-term chronic brain mapping at the single-neuron level. Nat Methods. 2016;13:875–882. doi: 10.1038/nmeth.3969. [DOI] [PubMed] [Google Scholar]
- 27.Budday S, et al. Mechanical properties of gray and white matter brain tissue by indentation. J Mech Behav Biomed Mater. 2015;46:318–330. doi: 10.1016/j.jmbbm.2015.02.024. [DOI] [PMC free article] [PubMed] [Google Scholar]
- 28.Rooij R, Kuhl E. Constitutive modeling of brain tissue: Current perspectives. Appl Mech Rev. 2016;68:010801. [Google Scholar]
- 29.Huang SH, Lin SP, Chen JJJ. In vitro and in vivo characterization of SU-8 flexible neuroprobe: From mechanical properties to electrophysiological recording. Sens Actuators A Phys. 2014;216:257–265. [Google Scholar]
- 30.Kim TI, et al. Injectable, cellular-scale optoelectronics with applications for wireless optogenetics. Science. 2013;340:211–216. doi: 10.1126/science.1232437. [DOI] [PMC free article] [PubMed] [Google Scholar]
- 31.Nemani KV, Moodie KL, Brennick JB, Su A, Gimi B. In vitro and in vivo evaluation of SU-8 biocompatibility. Mater Sci Eng C. 2013;33:4453–4459. doi: 10.1016/j.msec.2013.07.001. [DOI] [PMC free article] [PubMed] [Google Scholar]
- 32.Mercanzini A, et al. Demonstration of cortical recording using novel flexible polymer neural probes. Sens Actuators A Phys. 2008;143:90–96. [Google Scholar]
- 33.David-Pur M, Bareket-Keren L, Beit-Yaakov G, Raz-Prag D, Hanein Y. All-carbon-nanotube flexible multi-electrode array for neuronal recording and stimulation. Biomed Microdevices. 2014;16:43–53. doi: 10.1007/s10544-013-9804-6. [DOI] [PMC free article] [PubMed] [Google Scholar]
- 34.Rennaker RL, Miller J, Tang H, Wilson DA. Minocycline increases quality and longevity of chronic neural recordings. J Neural Eng. 2007;4:L1–L5. doi: 10.1088/1741-2560/4/2/L01. [DOI] [PMC free article] [PubMed] [Google Scholar]
- 35.Karuppagounder SS, et al. Therapeutic targeting of oxygen-sensing prolyl hydroxylases abrogates ATF4-dependent neuronal death and improves outcomes after brain hemorrhage in several rodent models. Sci Transl Med. 2016;8:328ra29. doi: 10.1126/scitranslmed.aac6008. [DOI] [PMC free article] [PubMed] [Google Scholar]
- 36.Sommakia S, Gaire J, Rickus JL, Otto KJ. Resistive and reactive changes to the impedance of intracortical microelectrodes can be mitigated with polyethylene glycol under acute in vitro and in vivo settings. Front Neuroeng. 2014;7:33. doi: 10.3389/fneng.2014.00033. [DOI] [PMC free article] [PubMed] [Google Scholar]
- 37.Keefer EW, Botterman BR, Romero MI, Rossi AF, Gross GW. Carbon nanotube coating improves neuronal recordings. Nat Nanotechnol. 2008;3:434–439. doi: 10.1038/nnano.2008.174. [DOI] [PubMed] [Google Scholar]
- 38.Zhong Y, Bellamkonda RV. Dexamethasone-coated neural probes elicit attenuated inflammatory response and neuronal loss compared to uncoated neural probes. Brain Res. 2007;1148:15–27. doi: 10.1016/j.brainres.2007.02.024. [DOI] [PMC free article] [PubMed] [Google Scholar]
- 39.Cui X, Wiler J, Dzaman M, Altschuler RA, Martin DC. In vivo studies of polypyrrole/peptide coated neural probes. Biomaterials. 2003;24:777–787. doi: 10.1016/s0142-9612(02)00415-5. [DOI] [PubMed] [Google Scholar]
- 40.Jackson A, Zimmermann JB. Neural interfaces for the brain and spinal cord–restoring motor function. Nat Rev Neurol. 2012;8:690–699. doi: 10.1038/nrneurol.2012.219. [DOI] [PubMed] [Google Scholar]
- 41.Moritz CT, Perlmutter SI, Fetz EE. Direct control of paralysed muscles by cortical neurons. Nature. 2008;456:639–642. doi: 10.1038/nature07418. [DOI] [PMC free article] [PubMed] [Google Scholar]
- 42.Borton D, Micera S, Millán JdelR, Courtine G. Personalized neuroprosthetics. Sci Transl Med. 2013;5:210rv2. doi: 10.1126/scitranslmed.3005968. [DOI] [PubMed] [Google Scholar]
- 43.Hochberg LR, et al. Reach and grasp by people with tetraplegia using a neurally controlled robotic arm. Nature. 2012;485:372–375. doi: 10.1038/nature11076. [DOI] [PMC free article] [PubMed] [Google Scholar]
- 44.Velliste M, Perel S, Spalding MC, Whitford AS, Schwartz AB. Cortical control of a prosthetic arm for self-feeding. Nature. 2008;453:1098–1101. doi: 10.1038/nature06996. [DOI] [PubMed] [Google Scholar]
- 45.Steif PS. Mechanics of Materials. Pearson; Upper Saddle River, NJ: 2012. [Google Scholar]


