

Abstract
Background
There is a lack of comprehensive patient-datasets regarding prevalence of severe hypertriglyceridemia (sHTG; triglycerides ≥10 mmol/L), frequency of co-morbidities, gene mutations, and gene characterization in sHTG. Using large surveys combined with detailed analysis of sub-cohorts of sHTG patients, we here sought to address these issues.
Methods
We used data from several large Norwegian surveys that included 681,990 subjects, to estimate the prevalence. Sixty-five sHTG patients were investigated to obtain clinical profiles and candidate disease genes. We obtained peripheral blood mononuclear cells (PBMC) from six male patients and nine healthy controls and examined expression of mRNAs involved in lipid metabolism.
Results
The prevalence of sHTG was 0.13 (95% CI 0.12-0.14)%, and highest in men aged 40-49 years and in women 60-69 years. Among the 65 sHTG patients, a possible genetic cause was found in four and 11 had experienced acute pancreatitis. The mRNA expression levels of carnitine palmitoyltransferase (CPT)-1A, CPT2, and hormone-sensitive lipase, were significantly higher in patients compared to controls, whereas those of ATP-binding cassette, sub-family G, member 1 were significantly lower.
Conclusions
In Norway, sHTG is present in 0.1%, carries considerable co-morbidity and is associated with an imbalance of genes involved in lipid metabolism, all potentially contributing to increased cardiovascular morbidity in sHTG.
Electronic supplementary material
The online version of this article (doi:10.1186/s12944-017-0511-9) contains supplementary material, which is available to authorized users.
Keywords: Co-morbidity, Genetics, Pancreatitis, Prevalence, Triglycerides
Background
Severe hypertriglyceridemia (sHTG) can be defined as a non-fasting serum concentration of triglycerides (TG) ≥10 mmol/L. The frequency of risk factors for sHTG (e.g. obesity, diabetes and high alcohol consumption) has increased in the last decades, calling for increased awareness of sHTG, and at present the prevalence in the general population is still uncertain.
There are upcoming possible therapies for sHTG such as apolipoprotein CIII inhibitors or lopitapide [1]. In addition, a gene therapy product for lipoprotein lipase deficiency has been approved by the European Medicines Agency [2], and monoclonal antibody-based therapy has also been applied [3]. To utilize these novel therapeutic modalities there is a need for more data on the prevalence and consequences of sHTG.
In the present study we therefore aimed (i) to describe the prevalence of sHTG in Norway by surveying several large cohorts; (ii) to present detailed clinical data of patients with sHTG; and (iii) to examine the expression of lipid-related genes in peripheral blood mononuclear cells of patients with hypertriglyceridemia.
Methods
The study protocol was approved by the Regional Committee for Medical Health Research Ethics (#S-08337a/S-07455a) and by the Norwegian Data Inspectorate (#08/3914). A written informed consent was obtained from each patient included in the study and the study protocol conformed to the ethical guidelines of the 1975 Declaration of Helsinki.
Collection of data from three surveys to estimate the prevalence of sHTG
The current data on prevalence originates from (i) the COhorts of NORway (CONOR; n = 172,956); (ii) the 3 Counties Study (n = 92,080); and (iii) the 40 Years Survey (n = 416,954). The data from these three surveys have in the present study been merged (n = 681,990) to generate data of the Norwegian population.
CONOR covers 10 population-based studies during 1994-2003 from different parts of Norway, both urban and rural regions. Some studies invited all residents above a specific age (for example all above 19 years in the HUNT 2 study), whereas others invited all subjects in selected age groups (for example all 30-, 40-, 45-, 60 and 75 years in the OPPHED- and TROFINN studies). The overall participation rate was 60% and varied between the studies. The participants (aged 20-103 years) filled in a questionnaire covering physical activity, history of previous cardiovascular disease (CVD), diabetes and use of medicine. A non-fasting blood sample was collected. Body mass index (BMI) and systolic blood pressure were also measured. For subjects who participated more than once we used the last measured TG values. Details of the research tools and the measurements of blood chemistry have been described elsewhere [4].
In the 3 Counties Study (covering the counties Oppland in Eastern part of Norway; Sogn og Fjordane in Western part of Norway; and Finnmark in Northern part of Norway; during 1974-1988) all residents aged 35-49 years at the study start in each county were invited to the first screening. The study had three visits in each county. The same birth cohorts and in some counties broader age groups, were invited to the second and third screening in each county. Altogether about 93,000 men and women participated in at least one screening. The participation rate varied from 78% to 90%. The participants were screened for CVD risk factors and a non-fasting blood sample was collected. We have included the last measured TG value for each participant in the present study. Details of the research tools and the measurements of blood chemistry have been described elsewhere [5, 6].
The 40 Years Survey was conducted from 1985 to 1999 and consisted of 429,245 participants from 18 counties. All inhabitants aged 40-42 years were invited to the survey whereas in some counties and municipalities broader age groups were included. The participation rate varied from 69% in Nord-Trøndelag county in 1992 to 46% in Østfold- and Aust-Agder counties in 1999. A non-fasting blood sample was collected. A few subjects participated more than once, and for them the last TG value was used in the present study. Details of the research tools and the measurements of blood chemistry have been described elsewhere [7].
From each study, we included all participants who had obtained measurements of serum triglycerides and who had answered the questionnaires.
Collection of data from patients with sHTG for detailed analyses
All individuals >18 years treated for sHTG at the Lipid Clinic from January 1st 2002 to December 31st 2007 were identified by searching the medical records for the diagnoses (ICD-10 classification): pure hypertriglyceridemia (E78.1), mixed hyperlipidemia (E78.2) and hyperchylomicronemia (E78.3). To ensure that the hypertriglyceridemia was not transient, only patients with long-lasting sHTG was included, i.e. they were diagnosed with sHTG both at the time of referral and at two consecutive time points 2-6 months apart. One hundred and twelve patients fulfilled the inclusion criteria and were invited by letter. Sixty-five (58%) patients returned a signed informed consent and were included in the study and came for a baseline visit. Inclusion and exclusion criteria are listed in the Additional file 1: Table S1. Data regarding age, diagnoses, clinical findings, laboratory measures, and use of medication were collected from their medical records. All laboratory values were collected after at least 12 h of fasting and analysed at the laboratory at Oslo University Hospital, using standard procedures. Most patients were controlled after 0.5, 1, 2 and 3 years (± 3 months) after the baseline visit. The genes lipoprotein lipase (LPL), apolipoprotein C-II (APOC2), apolipoprotein A-V (APOA5), glycosylphosphatidylinositol-anchored high density lipoprotein-binding protein 1 (GPIHBP1) and lipase maturation factor 1 (LMF1) were sequenced at the Unit for Cardiac and Cardiovascular Genetics, Department of Medical Genetics, Oslo University Hospital, and apolipoprotein E was genotyped. Information regarding diet and lifestyle were collected from the validated food questionnaire SmartDiet [8].
RNA expression of lipid-related genes in peripheral blood mononuclear cells
Six male patients with hypertriglyceridemia and nine male control subjects were recruited from employees of the Lipid Clinic and the University of Oslo, respectively, to this sub-study.
We analyzed a range of lipid-related genes (Additional file 1: Table S2) in peripheral blood mononuclear cells (PBMC) obtained from heparinized blood by gradient centrifugation in Isopaque-Ficoll (Lymphoprep, Nycomed, Oslo, Norway). The assay-numbers (hs-numbers) of the specific genes chosen for the analysis are included (Additional file 1: Table S2). PBMC pellets for mRNA expression analyses were immediately frozen and stored at −80 °C. Total RNA was isolated from all PBMC samples using RNeasy mini kit (Qiagen, Hilden, Germany) with lysis buffer containing β-mercaptoethanol, and RNase-Free DNase (Qiagen) and stored at −80 °C. RNA quantity and -quality measurements were performed using the ND 1000 Spectrophotometer (Saveen Werner, Carlson Circle Tampa, FL) and Agilent Bioanalyser (Agilent Technologies, Santa Clara, CA), respectively. Four hundred ng RNA from all samples were reverse-transcribed using High Capacity RNA-to-cDNA Kit (Applied Biosystems, Foster City, CA). Quantitative real-time polymerase chain reaction (RT-qPCR) was performed using Custom TaqMan Array micro Fluidic cards (Applied Biosystems). The endogenous control genes glucuronidase β (GUSβ) and TATA box binding protein (TBP) were used for normalization. The relative mRNA level for each transcript was calculated by the ΔΔ cycle threshold method [9].
Statistical analyses
The patient data were analysed with the Statistical Package for the Social Sciences (SPSS), version 16.0. Results from non-parametric statistical analyses are reported as median and 95% confidence interval (95% CI). Results from variables that showed a normal distribution are reported as mean and standard deviation (SD). For comparisons of two groups of individuals, the Mann-Whitney U test was used. Significance was assumed for p < 0.05. The prevalence data were analyzed with SPSS version 19.
Results
Prevalence of hypertriglyceridemia
The prevalence of subjects with non-fasting serum TG concentrations ≥10 mmol/L, i.e. sHTG, was 0.13 (95% CI 0.12-0.14) % based on pooled data from the three different surveys, while 2.0% of the participants had moderately increased TG levels (i.e. between 5.0 and 9.9 mmol/L) (Table 1). Furthermore, about 28% had TG levels above 2 mmol/L, a cut-off value often used for diagnosing hypertriglyceridemia [10]. Notably these pooled estimates stem from different surveys with somewhat different inclusion criteria, age distributions and time periods.
Table 1.
Distribution of non-fasting serum triglycerides in Norwegian population surveys
| Triglyceride concentration (mmol/L) | |||||
|---|---|---|---|---|---|
| Survey | Participantsa | < 2.0 | 2.0 – 4.9 | 5.0 – 9.9 | ≥ 10.0 |
| n | n (%) | n (%) | n (%) | n (%) | |
| CONOR | 172,956 | 125,455 (72.54) | 44,408 (25.68) | 2919 (1.69) | 174 (0.10) |
| 3 Counties Study | 92,080 | 62,928 (68.34) | 27,071 (29.40) | 1955 (2.12) | 126 (0.14) |
| 40 Years Survey | 416,954 | 299,080 (71.73) | 108,615 (26.05) | 8695 (2.09) | 562 (0.13) |
| Total | 681,990 | 487,463 (71.48) | 180,094 (26.41) | 13,569 (1.99) | 862 (0.13) |
aFor persons who participated more than once, the last triglyceride value was used in the present study
Hypertriglyceridemia in the CONOR survey- relation to other risk factors
The CONOR survey provided further age- and gender specific data of the included participants. The prevalence of sHTG was significantly higher in men than in women for the three age groups between 30 and 59 years (Table 2). Moreover, the prevalence peaked in the age group 40-49 years for men and in the age group 60-69 years for women. We next examined whether various known risk factors for cardiovascular disease were associated with elevated TG values (Table 3). A non-fasting serum concentration of glucose ≥11 mmol/L was present in 15.4% of those with sHTG, compared to only 0.7% of subjects with non-fasting TG < 2 mmol/L (p < 0.05) indicating that high serum glucose was more than 20 times more prevalent in sHTG subjects. The prevalence of systolic blood pressure above 160 mmHg was similar in those with sHTG (13.9%) and those with non-fasting TG < 2 mmol/L (10.2%) (p > 0.05). Furthermore, among the sHTG subjects, a BMI ≥ 30 kg/m2 was present in 41.6% in comparison to 10.8% of subjects with non-fasting TG < 2 mmol/L (p < 0.05). When asked if they had ever experienced a myocardial infarction (MI), 2.7% of the subjects with TG < 2 mmol/L answered yes compared to 5.8% of those with sHTG (p < 0.05). Only 6% of sHTG subjects reported to be physical active ≥3 h/week compared to 13.7% among those with TG < 2 mmol/L (p < 0.05). Daily smoking was reported by 29.9% of subjects with TG levels <2 mmol/L and in 48.6% of those with sHTG (p < 0.05).
Table 2.
Prevalence of severe hypertriglyceridemia in the CONOR survey
| Men | Women | |||||
|---|---|---|---|---|---|---|
| Age group (years) | sHTG | n | Prevalencea (95% CI) | sHTG | n | Prevalencea (95% CI) |
| 0 – 29 | 2 | 5274 | 38 (5 – 137) | 1 | 6458 | 15 (0 – 86) |
| 30 – 39 | 22 | 12,921 | 170 (107 – 258) | 1 | 15,126 | 7 (0 – 37) |
| 40 – 49 | 73 | 28,156 | 259 (203 – 326) | 16 | 32,376 | 49 (28 – 80) |
| 50 – 59 | 21 | 9847 | 213 (132 – 326) | 3 | 9687 | 31 (6 – 90) |
| 60 – 69 | 12 | 12,278 | 98 (51 – 171) | 10 | 10,890 | 92 (44 – 169) |
| 70 – 79 | 5 | 13,925 | 36 (12 – 84) | 6 | 11,879 | 51 (19 – 110) |
| 80 – 89 | 0 | 1604 | ND | 2 | 2535 | 79 (10 – 285) |
aThe prevalence data are expressed per 100,000 subjects. sHTG severe hypertriglyceridemia, CI confidence interval, ND not detected
Table 3.
Distribution of biochemistry, clinical and lifestyle characteristics in relation to serum triglycerides in the CONOR survey
| Non-fasting trigycerides (mmol/L) | ||||||||||
|---|---|---|---|---|---|---|---|---|---|---|
| < 2.0 | 2.0-4.9 | 5.0-9.9 | ≥ 10 | Total | ||||||
| n | % | n | % | n | % | n | % | n | % | |
| Non-fasting serum glucose (mmol/L) | ||||||||||
| < 7.0 | 103,889 | 94.5 | 35,527 | 88.0 | 2134 | 80.2 | 119 | 73.5 | 141,669 | 92.5 |
| 7.0-8.9 | 4432 | 4.0 | 3065 | 7.6 | 262 | 9.8 | 16 | 9.9 | 7775 | 5.1 |
| 9.0-10.9 | 855 | 0.8 | 759 | 1.9 | 95 | 3.6 | 2 | 1.2 | 1711 | 1.1 |
| ≥ 11.0 | 734 | 0.7 | 1006 | 2.5 | 170 | 6.4 | 25 | 15.4 | 1935 | 1.3 |
| Total | 109,910 | 100.0 | 40,357 | 100.0 | 2661 | 100.0 | 162 | 100.0 | 153,090 | 100.0 |
| Systolic blood pressure (mmHg) | ||||||||||
| < 160 | 112,395 | 89.8 | 36,850 | 83.3 | 2376 | 81.5 | 149 | 86.1 | 151,770 | 88.0 |
| ≥ 160 | 12,715 | 10.2 | 7383 | 16.7 | 538 | 18.5 | 24 | 13.9 | 20,660 | 12.0 |
| Total | 125,110 | 100.0 | 44,233 | 100.0 | 2914 | 100.0 | 173 | 100.0 | 172,430 | 100.0 |
| Body mass index (kg/m2) | ||||||||||
| < 20 | 6120 | 4.9 | 350 | 0.8 | 5 | 0.2 | 0 | 0.0 | 6475 | 3.8 |
| 20.0-24.9 | 58,443 | 46.8 | 9791 | 22.2 | 339 | 11.7 | 16 | 9.2 | 68,589 | 39.9 |
| 25.0-29.9 | 46,690 | 37.4 | 22,380 | 50.8 | 1464 | 50.5 | 85 | 49.1 | 70,619 | 41.1 |
| ≥ 30.0 | 13,501 | 10.8 | 11,506 | 26.1 | 1092 | 37.7 | 72 | 41.6 | 26,171 | 15.2 |
| Total | 124,754 | 100.0 | 44,027 | 100.0 | 2900 | 100.0 | 173 | 100.0 | 171,854 | 100.0 |
| Have had myocardial infarction | ||||||||||
| Yes | 3371 | 2.7 | 2193 | 5.0 | 146 | 5.1 | 10 | 5.8 | 5720 | 3.4 |
| No | 120,420 | 97.3 | 41,489 | 95.0 | 2718 | 94.9 | 163 | 94.2 | 164,790 | 96.6 |
| Total | 123,791 | 100.0 | 43,682 | 100.0 | 2864 | 100.0 | 173 | 100.0 | 170,510 | 100.0 |
| Hard physical activity during one week | ||||||||||
| No | 38,733 | 36.5 | 15,432 | 43.0 | 1089 | 46.0 | 58 | 38.4 | 55,312 | 38.3 |
| < 1 h | 26,506 | 25.0 | 9176 | 25.6 | 597 | 25.2 | 50 | 33.1 | 36,329 | 25.1 |
| 1 - 2 h | 26,371 | 24.8 | 7328 | 20.4 | 449 | 19.0 | 34 | 22.5 | 34,182 | 23.6 |
| ≥ 3 h | 14,575 | 13.7 | 3917 | 10.9 | 233 | 9.8 | 9 | 6.0 | 18,734 | 13.0 |
| Total | 106,185 | 100.0 | 35,853 | 100.0 | 2368 | 100.0 | 151 | 100.0 | 144,557 | 100.0 |
| Daily smoking | ||||||||||
| No | 87,015 | 70.1 | 30,394 | 69.4 | 1862 | 64.7 | 89 | 51.4 | 119,360 | 69.8 |
| Yes | 37,129 | 29.9 | 13,380 | 30.6 | 1016 | 35.3 | 84 | 48.6 | 51,609 | 30.2 |
| Total | 124,144 | 100.0 | 43,774 | 100.0 | 2878 | 100.0 | 173 | 100.0 | 170,969 | 100.0 |
Clinical, genetic and biochemical profiles of patients with severe hypertriglyceridemia
To give a more in-depth characterization of patients with sHTG, 65 subjects who agreed to participate (51 men and 14 women) were further characterized by clinical, genetic and biochemical methods. Among these 65 patients, 28 were diagnosed with a primary hypertriglyceridemia whereas the remaining 37 had a secondary hypertriglyceridemia.
Among the men, the mean (± SD) age was 45.6 ± 9.1 years and the mean BMI was 29.2 ± 4.0 kg/m2. Among the women, the mean age was 46.7 ± 6.4 years and the mean BMI was 29.4 ± 4.6 kg/m2. In four of the 28 patients with primary hypertriglyceridemia a possible genetic cause of the sHTG was found: Homozygosity for a deletion comprising exons 3 and 4 in GPIHBP1 was found in two women who both had been hospitalized for pancreatitis several times [11]. Another patient suffered from type III hyperlipidemia due to apolipoprotein E2/E2 homozygosity. One patient was heterozygous for the two non-synonymous SNPs: c.106G > A (rs1801177) and c.998G > A (rs144466625) (Ref. seq.: NM _000237.2) in the LPL gene. We do not know whether these SNPs reside on different alleles. No mutations were found in LMF1, APOC2 or APOA5.
The values of the biochemical characteristics of the 65 patients with sHTG were within the standard reference limits except for high values of total cholesterol and TG (Additional file 1: Table S3). The median and maximum fasting serum TG values at the first visit were 12.3 and 57.3 mmol/L, respectively. Forty-eight percent of the patients smoked daily, 50% were overweight (BMI > 25 kg/m2), 36% were obese (BMI > 30 kg/m2), and 43% were physically inactive (< 30 min of physical activity maximally once per week).
Metabolic syndrome, hypertension, high alcohol intake, diabetes mellitus type 2 and other conditions known to be associated with sHTG were observed in 61 of the 65 (94%) patients (Fig. 1). In total, 11 (17%) patients had experienced pancreatitis (4 with one episode and 7 with recurrent episodes) and all had co-factors known to increase the risk for pancreatitis (alcohol abuse, n = 4 and diabetes type 2, n = 7). At the first measurement after initiation of treatment, patients who had experienced acute pancreatitis (mean TG 22.1 mmol/L) had significantly higher TG values than patients without pancreatitis (mean TG 8.2 mmol/L). Eleven of the patients with sHTG had a medical history of coronary artery disease and eight other patients experienced a coronary event during the study period.
Fig. 1.
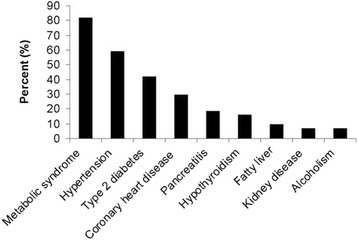
Frequency distribution of comorbidities in the 65 patients with severe hypertriglyceridemia
All 65 patients had received lifestyle advice and diet therapy from a clinical nutritionist at least once, whereas 33 used one or several lipid-lowering medications when referred to the Lipid Clinic, increasing to 43 at the last consultation (Additional file 1: Table S4). None used medication known to increase TG. Among the 65 patients, 10 had reached a serum TG concentration within the laboratory reference value of 2.6 mmol/L or lower one year after the first visit at the Lipid Clinic. Due to the small number of this subset compared to the much higher number in the larger surveys, we cannot readily make comparisons between them.
PBMC expression of lipid-related genes
In the subgroup of six male hypertriglyceridemic patients and 9 male control subjects, mRNA levels of relevant genes involved in lipid metabolism were analysed in PBMC since previous studies have shown that dyslipidemic alterations are reflected in the PBMC transcriptome [12, 13]. Their characteristics are displayed in the Additional file 1: Table S5. None of them had cardiovascular disease. These patients had significantly higher levels of total cholesterol, TG and glucose, and lower levels of apolipoprotein A1 compared to the controls (Table 4).
Table 4.
Characteristics of the male sub-sample with gene expression profiling and cholesterol efflux measurements compared with male control subjects
| Hypertriglyceridemia | Controls | p-values | |
|---|---|---|---|
| n = 6 | n = 9 | ||
| Age (years) | 44 (32-50) | 52 (25-60) | 0.41 |
| Total cholesterol (mmol/L) | 8.9 (5.2-14.6) | 4.5 (3.7-5.6) | 0.004 |
| LDL cholesterol (mmol/L) | 2.3 (1.9-3.8) | 2.9 (2.0-4.1) | 0.41 |
| HDL cholesterol (mmol/L) | 1.4 (0.8-2.4) | 1.5 (1.1-2.0) | 0.63 |
| Triglycerides (mmol/L) | 17.3 (5.1-58) | 0.7 (0.4-1.5) | 0.001 |
| Apolipoprotein A1 (mg/L) | 1.1 (1.1-1.4) | 1.5 (1.1-1.7) | 0.019 |
| Apolipoprotein B (mg/L) | 0.8 (0.7-1.1) | 0.8 (0.6-1.1) | 0.58 |
| Free fatty acids (nmol/L) | 593 (372-798) | 387 (172-681) | 0.090 |
| Hs-CRP (mg/L) | 2.4 (0.7-20) | 1.1 (0.7-2.8) | 0.20 |
| Glucose (mmol/L) | 10.1 (5.5-14.7) | 5.0 (4.4-5.4) | 0.001 |
Data are presented as median (range)
Hs-CRP high sensitivity C-reactive protein
The mRNA expression levels of CPT-1A and CPT-2, encoding mitochondrial enzymes involved in β-oxidation of fatty acids, were significantly higher in the patients compared to the controls (Additional file 2: Figure S1). The mRNA expression of LIPE, encoding the hormone sensitive lipase that hydrolyzes stored TG to free fatty acids, was also significantly elevated among the patients compared to the controls. In contrast, the mRNA expression of ABCG1, encoding a protein contributing to cholesterol efflux capacity, was significantly lower in the HTG patients compared to the controls.
Discussion
In the present study we show that the prevalence of sHTG in Norway is about 0.1%, and associated with a number of serious co-morbidities such as CVD and pancreatitis. The high prevalence of elevated non-fasting glucose concentrations, obesity and low physical activity suggest a disturbed energy metabolism in these subjects. Moreover, in a subgroup of patients, we found that the hypertriglyceridemic phenotype was associated with changes in gene expression of key players in lipid metabolism, potentially contributing to the high prevalence of CVD in these patients.
There are few nation-wide data on the prevalence of hypertriglyceridemia, and there is no established definition of sHTG. Reportedly 1.7% of adults in the United States 2001-2006 had elevated fasting TG values ranging from 5.6 to 22.6 mmol/L [14], whereas we found that 2% of the subjects had moderately elevated non-fasting TG levels (5-10 mmol/L) in Norway, similar to the 1.9% recently reported in Denmark [10]. In addition, about 25% of US adults had hypertriglyceridemia (TG values >2 mmol/L), i.e. about the same estimate as we report here (28%). In comparison, among otherwise healthy adult Iranians, nearly 10% had hypertriglyceridemia in 2013 [15], whereas the corresponding percentage of hypertriglyceridemia in Västerbotten County, Sweden in 2008-2010 was 15.5 and 31.9 among women and men, respectively [16]. In the present study 20% of the women and 36% of the men had TG values >2 mmol/L, based on the data from the CONOR survey. Collectively, our Norwegian data are quite similar to the quoted estimates of the prevalence of hypertriglyceridemia obtained in populations from the US [14], Iran [15] and Sweden [16]. Notably, these populations differ in relation to life-styles and risks of CVD. Moreover, the data from the CONOR-survey consistently showed that sHTG level was associated with a number of risk factors for CVD, diabetes and the metabolic syndrome, as evidenced by elevated glucose, blood pressure, BMI as well as low physical activity [17]. If these risk factors represent potential causes or consequences of sHTG or if they are associated phenomena reflecting common pathogenic mechanisms such as those leading to metabolic syndromes, are at present not known.
The 28 patients with primary hypertriglyceridemia who were included in the sHTG sub-study had persistent sHTG for several months, but in only four of them was a possible genetic cause found, demonstrating that even in a long lasting sHTG a genetic cause is usually not found among currently known predisposing genes. Unfortunately we do not have data regarding the prevalence of heterozygous mutations in the 65 patients. The fasting TG values were reduced by nearly 60% after treatment, a reduction that seemed to persist for years. In line with others we observed that sHTG was associated with several serious co-morbidities [18]. Notably, 19 of the 65 patients (29%) had established coronary heart disease and eight of these patients experienced a coronary event during the study period, suggesting that they were at significant risk even after treatment with marked decrease in TG levels. Without a control group we cannot exclude the possibility that the fall in TG levels is the natural evolution of the disease (sHTG). However, the relatively rapid effect of treatment observed after 6 months, which then remained fairly constant, may be interpreted as a real treatment effect. Similar to other studies [19, 20] our data shows that complete normalization of plasma TG values is rarely achieved in patients with sHTG. In patients with sHTG, those with a history of acute pancreatitis had particularly high TG values. Moreover, patients with sTG levels and pancreatitis all had co-factors known to increase the risk for pancreatitis [18], potentially suggesting that sHTG on its own will not predispose to acute pancraetitis. On the other hand, Pedersen et al. [10] recently showed that even those with mild hypertriglyseridemia (TG > 2 mmol/L) were at increased risk for acute pancreatitis, after adjustment for several known confounders.
In the subgroup of six hypertriglyceridemic patients we found that the PBMC mRNA expression of several key mediators in lipid metabolism was altered as compared to controls. Thus, the patients were characterized by higher mRNA expression of CPT-1A, CPT-2, and LIPE, concomitantly with lower mRNA expression of ABCG1 compared to controls. Defects in CPT-1 and CPT-2 are associated with hypertriglyceridemia in humans [21], whereas increased CPT-1 activity is associated with reduced TG concentrations and reduced muscle- and liver steatosis in rats [22], suggesting that the high TG levels in the present study population is not caused by decreased β-oxidation. CPT is a PPARα target gene and, as expected, in the patients treated with fibrates, the PBMC mRNA expression of CPT1A and CPT2 were higher compared to controls, thereby counteracting the increased TG levels. Hormone sensitive lipase (LIPE) is also a PPARα target gene, inducing hydrolyses of TG to fatty acids, and this enzyme was also upregulated in PBMC from patients. Thus, it is tempting to hypothesize that the up-regulation of these PPARα sensitive enzymes may represent counteracting mechanisms to down-regulate TG levels. In contrast to the up-regulation of genes involved in fatty acid metabolism, PBMC from these patients had decreased mRNA expression of ABCG1, a transporter involved in mediating cholesterol efflux, potentially leading to reduced cholesterol efflux capacity.
In the present study we combined data of prevalence and treatment with analyses to characterize the molecular etiology to strengthen the observations. We acknowledge the fact that since our pooled estimate of sHTG was based on several large surveys, we cannot conclude that this is fully representative for the general Norwegian population. Another possible weakness in large population surveys is that sick people usually participate to a lower extent than healthy. Additionally we cannot exclude possible confounding due to differences in life-styles. Since sHTG is associated with a considerable comorbidity the present data may thus have underestimated the true prevalence of sHTG in the population. On the other hand, patients with sHTG are referred to the Lipid Clinic from all over Norway increasing the representativeness for this population. A fasting TG value was not always available. Moreover, lack of a control group and a participation rate of 58% may have led to a selection bias in the 65 patients with persistent sHTG. Regarding the PBMC sub-study, a limitation is that few patients were included and only male subjects were studied.
Conclusions
In conclusion, sHTG was present in 1/1000 subjects based on a pooled estimate from several large surveys. Furthermore sHTG was associated with serious comorbidity, in particular CVD, and was associated with an imbalance of genes involved in lipid metabolism. Notably, sHTG is easy and inexpensive to detect and deserve increased attention to limit serious organ complications.
Acknowledgments
Funding
The study was supported in part by the Throne Holst Foundation for Nutrition Research, University of Oslo.
Availability of data and materials
All datasets generated and analyzed in this study are available from the corresponding author on request.
Authors’ contributions
KR and POI planned the study and drafted the manuscript. IN, SMU, BH, PA and KBH performed the mRNA expression analyses. IVO collected data from the 65-patient sub-study. RS collected and analysed the data from the population surveys. KEB performed the genetic profiling. All authors analysed data and revised the manuscript. All authors read and approved the final manuscript.
Competing interests
The authors declare no conflict of interest with respect to this manuscript.
Consent for publication
Not applicable.
Ethics approval and consent to participate
The study protocol was approved by the Regional Committee for Medical Health Research Ethics (#S-08337a/S-07455a) and by the Norwegian Data Inspectorate (#08/3914). A written informed consent was obtained from each patient included in the study and the study protocol conformed to the ethical guidelines of the 1975 Declaration of Helsinki.
Abbreviations
- ABCG1
ATP-binding cassette, sub-family G, member 1
- APO
Apolipoprotein
- BMI
Body mass index
- CONOR
Cohorts of Norway
- CPT
Carnitine palmitoyltransferase
- CVD
Cardiovascular disease
- GPIHBP1
Glycosylphosphatidylinositol-anchored high density lipoprotein-binding protein 1
- GUSβ
Glucuronidase β
- LIPE
Hormone sensitive lipase
- LMF1
Lipase maturation factor 1
- LPL
Lipoprotein lipase
- PBMC
Peripheral blood mononuclear cells
- SD
Standard deviation
- sHTG
Severe hypertriglyceridemia
- TBP
TATA box binding protein
- TG
Triglycerides
Additional file
Inclusion and exclusion criteria for patients with sHTG for detailed analyses. Table S2. List of lipid-related genes analyzed in peripheral blood mononuclear cells from patients with severe hypertriglyceridemia. Table S3. Baseline biochemical characteristic of 65 patients with severe hypertriglyceridemia. Table S4. Combinations of medications used at end of study among the 65 patients with hypertriglyceridemia. Table S5. Characteristics of the six patients with hypertriglyceridemia subjected to in-depth molecular analyses. (PDF 258 kb)
Footnotes
Electronic supplementary material
The online version of this article (doi:10.1186/s12944-017-0511-9) contains supplementary material, which is available to authorized users.
Contributor Information
Kjetil Retterstøl, Email: kjetil.retterstol@medisin.uio.no.
Ingunn Narverud, Email: ingunn.narverud@medisin.uio.no.
Randi Selmer, Email: randi.selmer@fhi.no.
Knut E. Berge, Email: kberge@ous-hf.no
Ingvild V. Osnes, Email: ingvild.veseth@lds.no
Stine M. Ulven, Email: smulven@medisin.uio.no
Bente Halvorsen, Email: b.e.halvorsen@medisin.uio.no.
Pål Aukrust, Email: paukrust@ous-hf.no.
Kirsten B. Holven, Email: k.b.holven@medisin.uio.no
Per O. Iversen, Phone: + 47 22 85 13 91, Email: p.o.iversen@medisin.uio.no
References
- 1.Sacks FM, Stanesa M, Hegele RA. Severe hypertriglyceridemia with pancreatitis: thirteen years’ treatment with lomitapide. JAMA. 2014;174:443–447. doi: 10.1001/jamainternmed.2013.13309. [DOI] [PubMed] [Google Scholar]
- 2.Salmon F, Grosios K, Petry H. Safety profile of recombinant adeno-associated viral vectors: focus on alipogene tiparvovec (Glybera(R)) Exp Rev Clin Pharacol. 2014;7:53–65. doi: 10.1586/17512433.2014.852065. [DOI] [PubMed] [Google Scholar]
- 3.Sahebkar A, Chew GT, Watts GF. Recent advances in pharmacotherapy for hypertriglyceridemia. Prog Lipid Res. 2014;56:47–66. doi: 10.1016/j.plipres.2014.07.002. [DOI] [PubMed] [Google Scholar]
- 4.Naess O, Sogaard AJ, Arnesen E, Beckstrom AC, Bjertness E, Engeland A, et al. Cohort profile: cohort of Norway (CONOR) Int J Epidemiol. 2008;37:481–485. doi: 10.1093/ije/dym217. [DOI] [PMC free article] [PubMed] [Google Scholar]
- 5.Tverdal A, Foss OP, Leren P, Holme I, Lund-Larsen PG, Bjartveit K. Serum triglycerides as an independent risk factor for death from coronary heart disease in middle-aged Norwegian men. Am J Epidemiol. 1989;129:458–465. doi: 10.1093/oxfordjournals.aje.a115157. [DOI] [PubMed] [Google Scholar]
- 6.Bjartveit K, Foss OP, Gjervig T, Lund-Larsen PG. The cardiovascular disease study in Norwegian counties. Background and organization. Acta Med Scand. 1979;634:1–70. [PubMed] [Google Scholar]
- 7.Tverdal A, Hjellvik AV, Selmer R. Coffee intake and oral-oesophageal cancer: follow-up of 389,624 Norwegian men and women 40-45 years. Br J Cancer. 2011;105:157–161. doi: 10.1038/bjc.2011.192. [DOI] [PMC free article] [PubMed] [Google Scholar]
- 8.Svilaas A, Strom EC, Svilaas T, Borgejordet A, Thoresen M, Ose L. Reproducibility and validity of a short food questionnaire for the assessment of dietary habits. Nutrition, metabolism, and cardiovascular diseases. NMCD. 2002;12:60–70. [PubMed] [Google Scholar]
- 9.Livak KJ, Schmittgen TD. Analysis of relative gene expression data using real-time quantitative PCR and the 2(−Delta Delta C(T)) method. Methods. 2001;25:402–408. doi: 10.1006/meth.2001.1262. [DOI] [PubMed] [Google Scholar]
- 10.Pedersen SB, Langsted A, Nordestgaard BG. Nonfasting mild-to-moderate hypertriglyceridemia and risk of acute pancreatitis. JAMA Int Med. 2016;176:1834–1842. doi: 10.1001/jamainternmed.2016.6875. [DOI] [PubMed] [Google Scholar]
- 11.Berge KE, Retterstol K, Romeo S, Pirazzi C, Leren TP. Type 1 hyperlipoproteinemia due to a novel deletion of exons 3 and 4 in the GPIHBP1 gene. Atherosclerosis. 2014;234:30–33. doi: 10.1016/j.atherosclerosis.2014.02.005. [DOI] [PubMed] [Google Scholar]
- 12.Konieczna J, Sanchez J, van Schothorst EM, Torrens JM, Bunschoten A, Palou M, et al. Identification of early transcriptome-based biomarkers related to lipid metabolism in peripheral blood mononuclear cells of rats nutritionally programmed for improved metabolic health. Genes Nutr. 2014;9:366. doi: 10.1007/s12263-013-0366-2. [DOI] [PMC free article] [PubMed] [Google Scholar]
- 13.Jung UJ, Seo YR, Ryu R, Choi MS. Differences in metabolic biomarkers in the blood and gene expression profiles of peripheral blood mononuclear cells among normal weight, mildly obese and moderately obese subjects. Br J Nutr. 2016;116:1022–1032. doi: 10.1017/S0007114516002993. [DOI] [PubMed] [Google Scholar]
- 14.Christian JB, Bourgeois N, Snipes R, Lowe KA. Prevalence of severe (500 to 2,000 mg/dl) hypertriglyceridemia in United States adults. Am J Cardiol. 2011;107:891–897. doi: 10.1016/j.amjcard.2010.11.008. [DOI] [PubMed] [Google Scholar]
- 15.Esteghamati A, Hafezi-Nejad N, Sheikhbahaei S, Heidari B, Zandieh A, Ebadi M, et al. Risk of coronary heart disease associated with metabolic syndrome and its individual components in Iranian subjects: a matched cohort study. J Clin Lipid. 2014;8:279–286. doi: 10.1016/j.jacl.2014.02.002. [DOI] [PubMed] [Google Scholar]
- 16.Ng N, Johnson O, Lindahl B, Norberg M. A reversal of decreasing trends in population cholesterol levels in Vasterbotten County. Sweden Glob Health Action. 2012;5 [DOI] [PMC free article] [PubMed]
- 17.Kushner PA, Cobble ME. Hypertriglyceridemia: the importance of identifying patients at risk. Postgrad Med. 2016;128:848–858. doi: 10.1080/00325481.2016.1243005. [DOI] [PubMed] [Google Scholar]
- 18.Stefanutti C, Julius U. Treatment of primary hypertriglyceridemia states-general approach and the role of extracorporeal methods. Atherosclerosis. 2015;18:85–94. doi: 10.1016/j.atherosclerosissup.2015.02.017. [DOI] [PubMed] [Google Scholar]
- 19.Oh RC, Lanier JB. Management of hypertriglyceridemia. Am Fam Phys. 2007;75:1365–1371. [PubMed] [Google Scholar]
- 20.Scherer J, Singh VP, Pitchumoni CS, Yadav D. Issues in hypertriglyceridemic pancreatitis: an update. J Clin Gastroenterol. 2014;48:195–203. doi: 10.1097/01.mcg.0000436438.60145.5a. [DOI] [PMC free article] [PubMed] [Google Scholar]
- 21.Joshi M, Eagan J, Desai NK, Newton SA, Towne MC, Marinakis NS, et al. A compound heterozygous mutation in GPD1 causes hepatomegaly, steatohepatitis, and hypertriglyceridemia. Eur J Hum Genet. 2014;22:1229–1232. doi: 10.1038/ejhg.2014.8. [DOI] [PMC free article] [PubMed] [Google Scholar]
- 22.Ferreira MR, Camberos Mdel C, Selenscig D, Martucci LC, Chicco A, Lombardo YB, et al. Changes in hepatic lipogenic and oxidative enzymes and glucose homeostasis induced by an acetyl-L-carnitine and nicotinamide treatment in dyslipidaemic insulin-resistant rats. Clin Exp Pharm Physiol. 2013;40:205–211. doi: 10.1111/1440-1681.12050. [DOI] [PubMed] [Google Scholar]
Associated Data
This section collects any data citations, data availability statements, or supplementary materials included in this article.
Data Availability Statement
All datasets generated and analyzed in this study are available from the corresponding author on request.