

Abstract
Kidney transplantation (KTx) represents the best available treatment for patients with end-stage renal disease. Still, full benefits of KTx are undermined by acute rejection (AR). The diagnosis of AR ultimately relies on transplant needle biopsy. However, such an invasive procedure is associated with a significant risk of complications and is limited by sampling error and interobserver variability. In the present review, we summarize the current literature about non-invasive approaches for the diagnosis of AR in kidney transplant recipients (KTRs), including in vivo imaging, gene expression profiling and omics analyses of blood and urine samples. Most imaging techniques, like contrast-enhanced ultrasound and magnetic resonance, exploit the fact that blood flow is significantly lowered in case of AR-induced inflammation. In addition, AR-associated recruitment of activated leukocytes may be detectable by 18F-fluoro-deoxy-glucose positron emission tomography. In parallel, urine biomarkers, including CXCL9/CXCL10 or a three-gene signature of CD3ε, IP-10 and 18S RNA levels, have been identified. None of these approaches has been adopted yet in the clinical follow-up of KTRs, but standardization of procedures may help assess reproducibility and compare diagnostic yields in large prospective multicentric trials.
Keywords: 18FDG-PET/CT, acute rejection, kidney biopsy, kidney transplantation, magnetic resonance imaging, ultrasonography
Introduction
Kidney transplantation (KTx) represents the best available treatment for patients with end-stage renal disease. Each year, 3.500 kidney transplants are performed in the EuroTransplant zone (www.eurotransplant.org). Still, full benefits of KTx are regrettably undermined by acute rejection (AR), which may be cellular or antibody-mediated [1]. AR may affect all kidney transplant recipients (KTRs) throughout their lifetime, independent of age or gender [2]. Furthermore, subclinical AR affects 10–30% of KTRs within the first year following KTx and is an early predictor of subsequent graft failure [3, 4]. Subclinical AR has been defined as ‘the documentation by light histology of unexpected evidence of AR in a stable patient’ and concerns 5–10% of patients without high immunological risk. Hence, most transplant centres routinely perform ‘surveillance’ transplant biopsies between 3 and 12 months post-KTx. Since current immunosuppressive drugs efficiently treat AR, diagnosing AR early is crucial. Of note, it is still not debated whether subclinical AR should be treated or not. Although some centres treat subclinical AR, others do not compulsively treat it because of the lack of strong evidence about the risk–benefit balance of increased immunosuppression. In a 10-year observational prospective cohort study of 1001 consecutive non-selected KTRs who underwent ABO-compatible, complement-dependent, cytotoxicity-negative crossmatch KTx and who underwent screening biopsies at 1 year, treatment of subclinical T-cell-mediated AR resulted in similar long-term graft survival as in patients without rejection [4]. In contrast, subclinical antibody-mediated AR detected at the 1-year screening biopsy carried a negative prognostic value independent of initial donor-specific antibody status, previous immunologic events, estimated glomerular filtration rate (eGFR) and proteinuria.
In clinical practice, the detection of AR critically depends on periodic assessments of serum creatinine (SCr), an insensitive measure of renal injury, together with clinical signs like oedema or hypertension [5]. Ultimately, diagnosis of AR relies on transplant needle biopsy. Examining kidney samples by light microscopy provides well-characterized and gold-standard criteria for renal AR summarized in the conventional Banff classification [2, 6]. However, such an invasive procedure may cause graft bleeding or arteriovenous fistula. In addition, distinct reports based on former pathology classification [7] or frozen pre-implantation biopsies [8] highlighted sampling error and interobserver variability. Moreover, repeated biopsies to evaluate the renal graft's status pose challenges, including practicability and cost. Therefore, alternative, less invasive but highly sensitive modalities are currently under investigation to reinforce our armamentarium in the diagnosis of AR [1, 9–15]. Likewise, it would be useful to non-invasively predict non-rejection in KTRs with acute renal dysfunction and suspected AR in order to avoid needless transplant biopsy. The term ‘acute dysfunction with no rejection’ (ADNR) has been recently proposed by Kurian et al. [16] to reflect such a frequent condition in which AR is suspected on the basis of clinical and biological judgments, but not confirmed by histology. The mechanisms and long-term consequences of ADNR remain unknown.
In the present review, we summarize the current literature about non-invasive approaches for the diagnosis of AR in KTRs, with a particular emphasis on in vivo imaging methods. The benefits and limitations of gene expression profiling and omic analyses of blood and urine samples in the non-invasive diagnosis of renal AR are reviewed in a complementary Part II article. Most imaging techniques exploit the fact that blood flow is significantly lowered in case of AR-induced inflammation. Indeed, AR is associated with a recruitment of activated leukocytes into the transplant, with the release of vasoactive mediators, such as endothelin, leukotrienes, thromboxane A2 and LG3 (C-terminal fragment of perlecan) [17, 18]. In addition, activated leukocytes are characterized by an increased avidity for glucose and its radiolabelled analogue, 18F-fluoro-deoxy-glucose (18F-FDG). Such an accumulation of 18F-FDG is detectable by positron emission tomography (PET), as demonstrated in both rat and man [15, 19].
Ultrasound
Ultrasound (US) is based on the ‘Doppler effect’, which stipulates that US reflected from moving structures changes its frequency. The main advantages of US include rapidity and the absence of radiation or injections of nephrotoxic contrast agent. Conversely, US is highly operator dependent and the interpretation may be significantly influenced by extra-renal factors, such as age, body mass index, atherosclerosis and arterial stiffness. In severe AR, duplex colour Doppler US shows a spectral waveform in which the diastolic arterial flow is decreased (Figure 1) [20]. Consequently, evaluation of the renal transplant resistance index (RI) may help detect acute graft dysfunction [21–23]. However, RI measurements cannot differentiate AR from acute tubular necrosis (ATN), calcineurin inhibitor toxicity, renal vein thrombosis, ureteral obstruction or pyelonephritis [22]. In case of delayed graft function (DGF) [24], sequential Doppler US does not help specifically detect AR. In 2014, Shebel et al. [25] suggested that power Doppler may distinguish ATN with preserved cortical perfusion from AR with reduced perfusion. Power Doppler is based on the amplitude of the Doppler signal to detect moving matter. This procedure is independent of flow direction—thereby excluding signal aliases—and is independent of angle—thereby allowing detection of smaller velocities than colour Doppler [23, 26, 27]. The role of power Doppler in the diagnosis of AR remains controversial [28, 29] and additional investigations are required to assess its sensitivity/specificity and predictive values (Table 1).
Fig. 1.

Representative Doppler ultrasound imaging in case of biopsy-proven renal allograft acute rejection. Doppler ultrasound images of a renal allograft (from the same kidney transplant recipient) (A) without versus (B) with biopsy-proven acute rejection (AR). The index of resistance (IR; normal value <0.70) of renal parenchyma is significantly increased in the case of AR (B). VSM, maximal systolic velocity; VTD, telediastolic velocity.
Table 1.
Characteristics of imaging approaches used in the diagnosis of kidney allograft acute rejection
| Images in AR | Availability in humans | Sensitivity and specificity | Advantages |
Disadvantages |
|||||||
|---|---|---|---|---|---|---|---|---|---|---|---|
| Ultrasound | Colour Doppler |
|
Yes | Se 40% Sp 62% [29] |
|
|
|||||
| Power Doppler | ↓ cortical perfusion | Yes | Se 40% [28]/82% [25] Sp 100% [25, 28] |
|
|||||||
| CEUS | ↑ signal intensity | No | High Sp versus ATN-CSA High Sp versus CSA toxicity Poor Sp versus infections [30] |
Feasible as early as 2 days post transplantation | |||||||
| CT | Perfusion CT | ↓ renal blood flow | Yes | Unknown [31] |
|
||||||
| MRI | Contrast-enhanced MRI |
|
Yes | Unknown |
|
Nephrogenic systemic fibrosis | |||||
| Diffusion-weighted MRI | ↓ ADC | Under-development |
|
||||||||
| Arterial spin labelling | ↓ renal perfusion | Under development | Unknown | ||||||||
| BOLD imaging | ↓ R2* values in medulla | Under-development | Se 80% [46], 96.4% [47] Sp 72% [46], 74.4% [47] |
||||||||
| USPIO-enhanced dynamic MRI | Hypointensity on T*2-weighted images | Yes | Unknown | ||||||||
| Nuclear imaging | Scintigraphy | Dynamic |
99mTc DTPA MAG3 |
Flat uptake curves Decreased perfusion |
Yes | Sp 87.9% [59] | 3D |
|
|||
| Static ± SPECT | Ga-Ci | ↑ signal intensity | Yes | Poor specificity [60] |
|
||||||
| 99mT-SC | Se 93.3% Sp 44.4% [9] |
No influence of renal function |
|
||||||||
| Radiolabelled WBCs | Yes (in some facilities) | PPV 100% NPV 95.1% [61] |
|
||||||||
| Radiolabelled monoclonal Ab | Yes | Unknown [13] |
|
||||||||
| PET-CT |
18F-FDG PET-CT |
↑ value of the mean SUV | Yes | Se 100% Sp 50% [15] |
|
|
|||||
| 18F-FDG-labelled WBCs | Yes | Unknown [62] |
|
|
|||||||
AR, acute rejection; CT, computed tomography; MRI, magnetic resonance imaging; RI, resistance index; Se, sensitivity; Sp, specificity; SUV, standard uptake value; Ga-Ci: 67Ga-citrate; 99mTSC: 99mTc-sulfur colloid; WBCs, white blood cells; Ab, antibodies; PPV, positive predictive value; NPV, negative predictive value.
Molecular imaging techniques specifically targeting T-lymphocytes represent another promising tool for the detection of AR. Grabner et al. [30] recently performed a study using antibody-mediated contrast-enhanced US (CEUS) using microbubbles targeting CD3-, CD4- or CD8-positive T-cells in various murine models of kidney diseases. The results of CEUS correlated with histopathological scoring of rejection, CD3 immuno-signal and mRNA expression levels of chemoattractant cytokines. Signal intensities reflected the degree of inflammation in the allograft as early as 2 days after KTx. Conversely, ATN and CSA toxicity were not associated with increased CEUS signals. Thus, CD3-mediated CEUS may help specifically detect renal AR. Further preclinical and clinical studies are warranted to assess the diagnostic yield of CEUS in real-life settings since infection-induced infiltration of T-lymphocytes may represent an important confounding factor [30].
Computed tomography
Computed tomography (CT) uses X-rays to create pictures of cross sections of the body. Perfusion techniques are based on the injection of iodinated contrast agents (Table 1). In 2013, Helck et al. [31] retrospectively suggested that studying perfusion of kidney allografts by CT may help non-invasively differentiate AR from ATN. Twenty-two patients with either AR (n = 6) or ATN (n = 16) were included. There was no significant difference regarding SCr levels between groups. All patients underwent a multiphase CT angiography, which showed that renal blood flow values were significantly lower in allografts with biopsy-proven AR (48.3 ± 21 mL/100 mL/min) in comparison to those with ATN (77.5 ± 21 mL/100 mL/min) [32]. The mean effective radiation dose of the CT perfusion protocol was 13.6 ± 5.2 mSv. Further investigations are necessary to assess the clinical relevance of this quantitative perfusion technique in discriminating the various causes of acute graft dysfunction, taking into account the radiation exposure and the risk of contrast-induced nephropathy (which promotes the persistence of ATN).
Magnetic resonance imaging
Magnetic resonance imaging (MRI) derives from the radiofrequency signal generated by hydrogen atoms placed in an external magnetic field. The main advantages of contrast-enhanced MRI after infusion of gadolinium-based agents include high-contrast resolution and the absence of ionizing radiation. KTRs with biopsy-proven AR show a lower cortical enhancement with delayed renal excretion (Table 1). Many reports have qualitatively evaluated the shape of the renal enhancement curve to diagnose acute dysfunction. As early as 1997, Szolar et al. [33] performed a study including 23 patients with clinically suspected ATN or AR and 8 consecutive control patients, who underwent MR perfusion imaging of renal allograft. The increase in cortical signal intensity was significantly smaller in patients with AR (61 ± 4% increase above baseline) compared with that measured in normal allografts (136 ± 9% increase above baseline) and patients with ATN (129 ± 3% increase above baseline) [33–38]. It should be noted, the administration of gadolinium-based contrast agents has been associated with nephrogenic systemic fibrosis, a devastating fibrosing disorder of the skin and other systemic organs. Their use is therefore prohibited in patients with acute kidney injury (AKI) or stage 4/5 chronic kidney disease, as well as in KTRs [39, 40].
Innovative applications of MRI avoiding gadolinium-based agents have been recently developed (Table 1). Diffusion-weighted imaging (DWI) provides quantification of the Brownian motion of water protons by calculating the apparent diffusion coefficient (ADC) [41–44]. Several studies have shown that ADC in patients with stable renal function is significantly higher than in patients with kidney dysfunction [41, 42, 44]. The diagnostic accuracy of ADC evaluation in detecting acute renal allograft dysfunction is high, although the specificity in AR diagnosis is low [41–43]. Indeed, ADC can be lowered in various conditions, like ATN, drug toxicity and ischaemia [41, 42, 44]. Arterial spin labelling (ASL) is another non-invasive functional MRI approach that allows one to quantify renal perfusion without administration of contrast agents by labelling water protons of the arterial blood with radiofrequency pulses [45]. A recent study conducted by Hueper et al. [45] demonstrated that renal perfusion was significantly reduced in patients with DGF. Forty-six patients underwent contrast-free ASL MRI 4 to 11 days after KTx. Renal biopsies were performed within 5 days of MRI. Twenty-six of 46 patients developed DGF. Of these, nine patients had biopsy-proven AR. Renal perfusion was significantly lower in the DGF group compared with the control group (231 ± 15 versus 331 ± 15 mL/min/100 g). Renal perfusion significantly correlated with eGFR, RI and cold ischaemia time. Note that ASL is not available in routine clinical practice. Finally, blood oxygenation level-dependent (BOLD) imaging uses deoxygenated haemoglobin as an endogenous contrast agent. When the blood concentration of deoxyhemoglobin increases, the T2* relaxation time of the protons decreases, which increases dephasing in the surrounding tissues. R2* corresponds to 1/T2*, and is an index of the signal loss rate [40, 46–50]. Decreased R2* values in the renal medulla correspond to increased oxygen concentration. Hence, BOLD imaging may help differentiate AR from ATN [43–45, 51]. Han et al. [34] showed that allografts with ATN have decreased oxygen bioavailability in early stages. Eighty-two patients with normal graft function and 28 patients with biopsy-proven AR (n = 21) or ATN (n = 7) were enrolled. Patients with AR and ATN underwent BOLD MRI within 6 days before or after kidney transplant biopsy. The mean cortical R2* level was significantly higher in the ATN group (15.25 ± 1.03/s) compared with the normal group (13.35 ± 2.31/s) and the AR group (12.02 ± 1.72/s). However, such an observation was not confirmed by Djamali et al. [52], most probably because of the complex definition of ATN stages [51]. Furthermore, oxygenation is dynamic and may be influenced by a number of local and systemic stimuli, including drugs [46–49, 51].
Besides these innovative MRI applications based on endogenous contrast materials, ultrasmall superparamagnetic iron oxide (USPIO)-enhanced dynamic MRI tracks macrophage accumulation in various tissues and organs, including kidney transplant (Table 1). In vivo experimental USPIO studies have been performed in rats. USPIO particles are trapped by macrophages through absorptive endocytosis, which creates MR signal reduction in T2*-weighted images [53–57]. Although sensitive, USPIO-enhanced dynamic MRI is characterized by poor specificity since image hypointensity may result from sources other than labelled cells [53–55]. Moreover, it may be difficult to differentiate AR from infection or ischaemic injury, which are also known to be associated with macrophage recruitment [53–58].
Renal scintigraphy
Planar scintigraphy detects, with a γ camera, the distribution of radioactivity after administration of a γ photon-emitting radiopharmaceutical agent (Table 1). Single photon emission computed tomography (SPECT) intrinsically offers high intrinsic activity due to (i) the significant tissue penetration of conventional tracers, (ii) the ability to detect very low accumulations of tracers and (iii) the large range of available radiotracers [13, 63]. In addition, nuclear imaging is largely operator independent and generates three-dimensional (3D) functional images of metabolic processes covering the whole organ/body (upon the technique used). Radiotracers for renal scintigraphy are devoid of nephrotoxicity [13, 55]. In the particular case of AR, SPECT-based approaches may detect the recruitment of activated leukocytes into the transplant [13].
Dynamic renal scintigraphy with 99mTc-DTPA or MAG3 shows poor specificity for AR diagnosis [21, 64–66]. Aktas et al. [36] suggested that serial radionuclide imaging may help distinguish parenchymal causes of graft failure. This retrospective study included 32 patients with acute renal allograft dysfunction. In patients with AR, at least two sets of serial images were obtained after intravenous injection of 340 MBq of 99mTc-DTPA. Sensitivity and specificity were high in the diagnosis of AR. Sensitivity was even higher when considering the perfusion curve after the peak (P/PL) rather than measuring the curve from start to peak (Hilson's PI) [59]. Indeed, the major pathophysiologic difference between AR and ATN concerns renal blood flow, which is significantly impaired in AR but relatively well-preserved in ATN [59].
Besides dynamic scintigraphy, static imaging using radiotracers accumulating in renal parenchyma, like 67Ga-citrate, 125I-fibrinogen and 99mTc-sulfur colloid, have been studied in AR. Although comparative meta-analysis suggested a similar specificity of these tracers in AR [60], 99mTc-sulfur colloid might be the only one operational in clinical settings within the permissible radiation dose. 67Ga-citrate accumulates in the polymorphonuclear granulocytes recruited to inflammatory lesions, with no differential specificity between bacterial or sterile inflammation and AR [60]. Iodinated fibrinogen has been shown to deposit along the vascular system and into renal interstitium in case of AR [60, 63, 64]. In 1976, Niederle et al. [67] performed a prospective study on 22 patients using 125I-fibrinogen. The uptake of radiolabelled fibrinogen was increased in all biopsy-proven AR. Histologically, the kidneys with increased accumulation of fibrinogen showed extensive deposits of fibrin in blood vessels, glomeruli, intracapillary thrombi and interstitium [63]. However, 125I is not suited for scintigraphic imaging, and this tracer has never been used in routine clinical practice [60]. Finally, 99mTc-sulfur colloid is trapped in fibrin thrombosis associated with AR [9, 60]. The accumulation of 99mTc-sulfur colloid in kidney grafts is independent of renal function. Imaging after infusion of 99mTc-sulfur colloid appeared to discriminate AR on the basis of a strictly visual scale [9]. Unfortunately, several studies using computer-assisted quantification of allograft uptake compared with the surrounding pelvis showed conflicting results, with false-negative and false-positive rates that were too high to make 99mTc-sulfur colloid useful in predicting renal AR in routine clinical practice [65]. Furthermore, 99mTc-sulfur colloid does not accumulate in cases of AR-associated necrosis or in patients receiving high doses of heparin [60].
Several experimental and clinical pilot trials have been performed using radiolabelled white blood cells (WBCs) to detect renal AR, with conflicting results [13, 63, 70]. Preclinical tests using ex vivo radiolabelled leukocytes highlighted significant translational limitations (Table 1). First, labelled WBCs briefly accumulate in the lungs. Second, labelling stability varies. Third, the compound stability of the tracer and radionuclide half-life have to be taken into account before reliably measuring the accumulation of labelled leukocytes [13, 55]. Finally, background activity as well as the degree of attenuation of target organ activity may limit the interpretation [66]. In 2004, Lopes de Souza et al. [38] used 99mTc-labelled WBCs to evaluate AR in KTRs. This prospective study enrolled 100 KTRs. Scintigraphy detected 13 of 16 biopsy-proven ARs and 4 of 5 ATNs, which corresponds to a sensitivity of 81% for AR and 80% for ATN. The specificity was 100%. The positive predictive value was 100% and the negative predictive value was 95.1 and 98.9% for AR and ATN, respectively. Similarly, radiolabelled monoclonal antibodies directed against infiltrating cells have also been used. Anti-CD3 (cytotoxic T-cells), anti-CD4 (helper T-cells), anti-CD20 (B-cells), anti-CD25 (T- and B-cells), anti-DR (antigen-presenting cells) or anti-granulocyte have been tested to assess inflammation. Application of radiolabelled anti-CD3 or anti-CD25 might be promising in the particular settings of AR [59]. Still, this technique may cause allergic reactions and is restricted to intra- and perivascular antigens since antibodies do not cross the endothelial barrier [13, 63].
Positron emission tomography
PET detects pairs of γ rays indirectly emitted by positron emitting radionuclides, like 18F-FDG. PET/CT offers a direct 3D co-registration with low-dose CT without administration of contrast medium. 18F-FDG PET/CT is routinely used for detection, characterization, staging and follow-up of inflammatory processes of various origins [71, 72]. Activated leukocytes are indeed characterized by high metabolic activity and increased uptake of glucose and its analogue, 18F-FDG (Table 1). Renal AR is associated with a recruitment of activated leukocytes into the transplant, which is the basis of the Banff classification [6]. The advantages of 18F-FDG-PET/CT are rapid imaging and a high target:background ratio [72]. It can be used safely in patients with renal function ranging from normal to mildly reduced GFR to ESRD. In rats, the renal clearance of 18F-FDG does not correlate with renal function [19]. In particular, acute kidney injury secondary to cyclosporin exposure or ischaemia/reperfusion (I/R) is not associated with significant elevation in renal 18FDG accumulation. In man, Minamimoto et al. [73] investigated the influence of renal function on 18F-FDG distribution and uptake in 20 normal volunteers and 20 patients with suspected renal failure. Regions of interest were placed over 15 different regions throughout the body, including the left kidney. No significant difference was observed in the renal mean standard uptake value (SUV) between healthy volunteers and patients with suspected renal failure. Limitations of 18F-FDG-PET/CT imaging include its cost and availability, as well as the exposure to radiation originating from both PET and CT procedures. Still, a cumulative exposure dose of ∼5 mSv remains low compared with other classical radiological exams, like thorax CT (7 mSv) or abdomen CT (8 mSv) or coronary angiography (16 mSv) [15, 74]. The uptake of 18F-FDG is not specific for inflammation and may be increased in other conditions, like tumours or infections [71, 75]. Furthermore, physiological urinary excretion of 18F-FDG may hamper the measurement of 18FDG uptake in the renal parenchyma [76]. Late acquisitions may help overcome this problem and eventually improve the background:noise ratio. One rodent model of allogeneic KTx suggested that 18F-FDG PET/CT non-invasively detects renal cellular-mediated AR [19, 51]. Recently, we have prospectively shown the usefulness of 18F-FDG PET/CT in KTRs presenting with suspected AR prompting a transplant biopsy (Figure 2) [15]. On the basis of 32 18FDG-PET/CTs in 31 adult KTRs, we found a positive correlation between 18F-FDG transplant uptake (i.e. mean SUV) and the acute composite Banff score of leukocyte infiltration (r2 = 0.49). The area under the receiver operating characteristic (ROC) curve (AUC) was 0.93, with 100% sensitivity and 50% specificity, using a mean SUV threshold of 1.6. The poor specificity of 18F-FDG PET/CT in detecting AR is primarily due to the nature of the radiotracer. Although supporting a role for 18F-FDG PET/CT in AR screening, these preliminary data raise many unresolved issues, including (i) the dynamics of transplant 18F-FDG uptake, (ii) the comparative yield of 18F-FDG PET/CT in cellular- versus antibody-mediated AR, (iii) the predictive value of transplant 18F-FDG uptake on long-term renal function and (iv) the yield of 18FDG-PET/CT in subclinical AR.
Fig. 2.
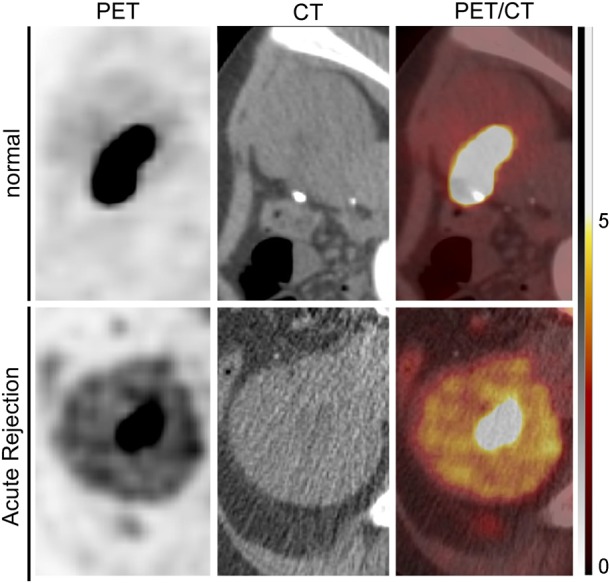
Representative 18F-FDG PET/CT imaging in case of biopsy-proven renal allograft acute rejection. Positron-emission tomography (PET; left column), computed tomography (CT; middle column) and combined PET/CT images taken ∼180 min after intravenous administration of 18fluoro-deoxy-glucose (18FDG) are shown for one kidney transplant recipient (KTR) with normal renal histology (upper panels) and one KTR with biopsy-proven acute rejection (AR). The tracer, 18FDG, significantly accumulates in the renal parenchyma in case of AR. Note the detection of excreted 18FDG in the urinary pelvis in both normal and pathological situations. The arbitrary scale of the standard uptake value (from 0 to 5) is illustrated on the right side.
Grabner et al. [39] investigated the diagnostic yield of 18F-FDG-labelled T lymphocytes in a rat model of allogenic KTx (Table 1). The accumulation of labelled T-cells was significantly elevated in allografts with AR [1.07 ± 0.28% of injected dose (ID)] compared with to native control kidneys (0.49 ± 0.18% ID). No difference was found among native controls, CSA toxicity and kidneys with I/R injury. To validate PET data, they showed significant correlations between imaging-based in vivo measurements of T-cell accumulation with autoradiography, histology and PCR quantifications. The use of radiolabelled cells has several advantages, such as higher sensitivity with a minimum radiation dose and less urinary excretion of free 18F-FDG, which enables early acquisition and quantification. However, the production of radiolabelled leukocytes in man would be laborious and time-consuming.
Conclusions and perspectives
Renal AR remains one of the leading causes of reversible acute dysfunction in KTRs and is an early predictor of subsequent graft failure [3, 4]. The diagnosis and classification of AR ultimately rely on transplant needle biopsy. Indeed, the current imaging procedures do not differentiate AR subtypes and therefore do not help in adjusting immunosuppressive therapies. However, imaging may be useful in the early detection of AR, thereby quickening and improving KTR management, as well as in the follow-up of biopsy-proven AR subtypes. Importantly, the non-invasive discrimination of AR from ADNR, with the highest negative predictive value, would help avoid needless and risky transplant biopsies. On the basis of the current literature, MRI and 18F-FDG PET/CT appear the most promising approaches. Nevertheless, none of these has been adopted yet in routine clinical practice. This may be partly explained by methodological and financial limitations. Standardization and validation of analysis procedures are urgently required to assess reproducibility in prospective multicentric trials. Furthermore, additional studies should focus on the diagnostic yields of combinations of imaging and omics methods.
Conflict of interest statement
The authors have no conflicts of interest to report. This manuscript has not been previously published elsewhere, in whole or in part.
Acknowledgements
The authors cordially thank the surgeons (M. Meurisse, C. Coimbra Marques, A. De Roover, O. Detry, E. Hamoir, P. Honoré, L. Kohnen, N. Meurisse and J-P Squifflet), the physicians (C. Bonvoisin, A. Bouquegneau, S. Grosch, L. Vanovermeire and P. Xhignesse) and the members of the local transplant coordination centre (M.-H. Delbouille, M.-H. Hans, J. Mornard) for their commitment to kidney transplantation at the University of Liège Hospital (ULg CHU) in, Liège, Belgium. We are also grateful to the nurses (Mme Wetz) of the Division of Nuclear Medicine of ULg CHU for the logistics and organization of 18F-FDG-PET/CT imaging of kidney transplant recipients with suspected acute rejection. F.J. is a Fellow of the Fonds National de la Recherche Scientifique (Research Credit #3309), and received support from the University of Liège (Fonds Spéciaux à la Recherche, Fonds Léon Fredericq) and the ULg CHU (Fonds d'Investissement de Recherche Scientifique), as well as from the Royal Academy of Medicine of Belgium (Prix O. Dupont).
References
- 1. Suthanthiran M, Schwartz JE, Ding R et al. Urinary-cell mRNA profile and acute cellular rejection in kidney allografts. N Engl J Med 2013; 369: 20–31 [DOI] [PMC free article] [PubMed] [Google Scholar]
- 2. Williams WW, Taheri D, Tolkoff-Rubin N et al. Clinical role of the renal transplant biopsy. Nat Rev Nephrol 2012; 8: 110–121 [DOI] [PMC free article] [PubMed] [Google Scholar]
- 3. Rush D, Nickerson P, Gough J et al. Beneficial effects of treatment of early subclinical rejection: a randomized study. J Am Soc Nephrol 1998; 9: 2129–2134 [DOI] [PubMed] [Google Scholar]
- 4. Loupy A, Vernerey D, Tinel C et al. Subclinical rejection phenotypes at 1 year post-transplant and outcome of kidney allografts. J Am Soc Nephrol 2015; 26: 1721–1731 [DOI] [PMC free article] [PubMed] [Google Scholar]
- 5. Thomas ME, Blaine C, Dawnay A et al. The definition of acute kidney injury and its use in practice. Kidney Int 2015; 87: 62–73 [DOI] [PubMed] [Google Scholar]
- 6. Haas M, Sis B, Racusen LC et al. Banff 2013 meeting report: inclusion of C4d-negative antibody-mediated rejection and antibody-associated arterial lesions. Am J Transplant 2014; 14: 272–283 [DOI] [PubMed] [Google Scholar]
- 7. Furness PN, Taub N. International variation in the interpretation of renal transplant biopsies: report of the CERTPAP Project. Kidney Int 2001; 60: 1998–2012 [DOI] [PubMed] [Google Scholar]
- 8. Azancot MA, Moreso F, Salcedo M et al. The reproducibility and predictive value on outcome of renal biopsies from expanded criteria donors. Kidney Int 2014; 85: 1161–1168 [DOI] [PubMed] [Google Scholar]
- 9. Einollahi B, Bakhtiari P, Simforoosh N et al. Renal allograft accumulation of technetium-99m sulfur colloid as a predictor of graft rejection. Transplant Proc 2005; 37: 2973–2975 [DOI] [PubMed] [Google Scholar]
- 10. Khalifa F, Beache GM, El-Ghar MA et al. Dynamic contrast-enhanced MRI-based early detection of acute renal transplant rejection. IEEE Trans Med Imaging 2013; 32: 1910–1927 [DOI] [PubMed] [Google Scholar]
- 11. Blydt-Hansen TD, Sharma A, Gibson IW et al. Urinary metabolomics for noninvasive detection of borderline and acute T cell-mediated rejection in children after kidney transplantation. Am J Transplant 2014; 14: 2339–2349 [DOI] [PubMed] [Google Scholar]
- 12. Ong S, Mannon RB. Genomic and proteomic fingerprints of acute rejection in peripheral blood and urine. Transplant Rev 2015; 29: 60–67 [DOI] [PMC free article] [PubMed] [Google Scholar]
- 13. Pawelski H, Schnöckel U, Kentrup D et al. SPECT- and PET-based approaches for noninvasive diagnosis of acute renal allograft rejection. Biomed Res Int 2014; 2014: 874785. [DOI] [PMC free article] [PubMed] [Google Scholar]
- 14. Hirt-Minkowski P, De Serres SA, Ho J. Developing renal allograft surveillance strategies—urinary biomarkers of cellular rejection. Can J Kidney Health Dis 2015; 2: 28. [DOI] [PMC free article] [PubMed] [Google Scholar]
- 15. Lovinfosse P, Weekers L, Bonvoisin C et al. Fluorodeoxyglucose F(18) positron emission tomography coupled with computed tomography in suspected acute renal allograft rejection. Am J Transplant 2015; 16: 310–316 [DOI] [PubMed] [Google Scholar]
- 16. Kurian SM, Williams AN, Gelbart T et al. Molecular classifiers for acute kidney transplant rejection in peripheral blood by whole genome gene expression profiling. Am J Transplant 2014; 14: 1164–1172 [DOI] [PMC free article] [PubMed] [Google Scholar]
- 17. Spurney RF, Ibrahim S, Butterly D et al. Leukotrienes in renal transplant rejection in rats. Distinct roles for leukotriene B4 and peptidoleukotrienes in the pathogenesis of allograft injury. J Immunol 1994; 152: 867–876 [PubMed] [Google Scholar]
- 18. Soulez M, Pilon E-A, Dieudé M et al. The perlecan fragment LG3 is a novel regulator of obliterative remodeling associated with allograft vascular rejection. Circ Res 2012; 110: 94–104 [DOI] [PubMed] [Google Scholar]
- 19. Reuter S, Schnöckel U, Schröter R et al. Non-invasive imaging of acute renal allograft rejection in rats using small animal F-FDG-PET. PLoS One 2009; 4: e5296. [DOI] [PMC free article] [PubMed] [Google Scholar]
- 20. Brown ED, Chen MY, Wolfman NT et al. Complications of renal transplantation: evaluation with US and radionuclide imaging. Radiographics 2000; 20: 607–622 [DOI] [PubMed] [Google Scholar]
- 21. Burgos FJ, Pascual J, Marcen R et al. The role of imaging techniques in renal transplantation. World J Urol 2004; 22: 399–404 [DOI] [PubMed] [Google Scholar]
- 22. Cano H, Castañeda DA, Patiño N et al. Resistance index measured by Doppler ultrasound as a predictor of graft function after kidney transplantation. Transplant Proc 2014; 46: 2972–2974 [DOI] [PubMed] [Google Scholar]
- 23. Kocabaş B, Aktaş A, Aras M et al. Renal scintigraphy findings in allograft recipients with increased resistance index on Doppler sonography. Transplant Proc 2008; 40: 100–103 [DOI] [PubMed] [Google Scholar]
- 24. Mallon DH, Summers DM, Bradley JA et al. Defining delayed graft function after renal transplantation: simplest is best. Transplantation 2013; 96: 885–889 [DOI] [PubMed] [Google Scholar]
- 25. Shebel HM, Akl A, Dawood A et al. Power Doppler sonography in early renal transplantation: does it differentiate acute graft rejection from acute tubular necrosis? Saudi J Kidney Dis Transpl 2014; 25: 733–740 [DOI] [PubMed] [Google Scholar]
- 26. Chow L, Sommer FG, Huang J et al. Power Doppler imaging and resistance index measurement in the evaluation of acute renal transplant rejection. J Clin Ultrasound 2001; 29: 483–490 [DOI] [PubMed] [Google Scholar]
- 27. Wang H-K, Chou Y-H, Yang A-H et al. Evaluation of cortical perfusion in renal transplants: application of quantified power Doppler ultrasonography. Transplant Proc 2008; 40: 2330–2332 [DOI] [PubMed] [Google Scholar]
- 28. Sidhu MK, Gambhir S, Jeffrey RB et al. Power Doppler imaging of acute renal transplant rejection. J Clin Ultrasound 1999; 27: 171–175 [DOI] [PubMed] [Google Scholar]
- 29. Trillaud H, Merville P, Tran Le Linh P et al. Color Doppler sonography in early renal transplantation follow-up: resistive index measurements versus power Doppler sonography. AJR Am J Roentgenol 1998; 171: 1611–1615 [DOI] [PubMed] [Google Scholar]
- 30. Grabner A, Kentrup D, Pawelski H et al. Renal contrast-enhanced sonography findings in a model of acute cellular allograft rejection. Am J Transplant 2016; 16: 1612–1619 [DOI] [PubMed] [Google Scholar]
- 31. Helck A, Wessely M, Notohamiprodjo M et al. CT perfusion technique for assessment of early kidney allograft dysfunction: preliminary results. Eur Radiol 2013; 23: 2475–2481 [DOI] [PubMed] [Google Scholar]
- 32. Sebastià C, Quiroga S, Boyé R et al. Helical CT in renal transplantation: normal findings and early and late complications. Radiographics 2001; 21: 1103–1117 [DOI] [PubMed] [Google Scholar]
- 33. Szolar DH, Preidler K, Ebner F et al. Functional magnetic resonance imaging of human renal allografts during the post-transplant period: preliminary observations. Magn Reson Imaging 1997; 15: 727–735 [DOI] [PubMed] [Google Scholar]
- 34. Hricak H, Terrier F, Marotti M et al. Posttransplant renal rejection: comparison of quantitative scintigraphy, US, and MR imaging. Radiology 1987; 162: 685–688 [DOI] [PubMed] [Google Scholar]
- 35. Khalifa F, Abou El-Ghar M, Abdollahi B et al. A comprehensive non-invasive framework for automated evaluation of acute renal transplant rejection using DCE-MRI. NMR Biomed 2013; 26: 1460–1470 [DOI] [PubMed] [Google Scholar]
- 36. Khalifa F, El-Baz A, Gimel'farb G et al. Non-invasive image-based approach for early detection of acute renal rejection. Med Image Comput Comput Assist Interv 2010; 13: 10–18 [DOI] [PubMed] [Google Scholar]
- 37. Onniboni M, De Filippo M, Averna R et al. Magnetic resonance imaging in the complications of kidney transplantation. Radiol Med 2013; 118: 837–850 [DOI] [PubMed] [Google Scholar]
- 38. Yamamoto A, Zhang JL, Rusinek H et al. Quantitative evaluation of acute renal transplant dysfunction with low-dose three-dimensional MR renography. Radiology 2011; 260: 781–789 [DOI] [PMC free article] [PubMed] [Google Scholar]
- 39. Perazella MA, Reilly RF. Nephrogenic systemic fibrosis: recommendations for gadolinium-based contrast use in patients with kidney disease. Semin Dial 2008; 21: 171–173 [DOI] [PubMed] [Google Scholar]
- 40. Abu-Alfa AK. Nephrogenic systemic fibrosis and gadolinium-based contrast agents. Adv Chronic Kidney Dis 2011; 18: 188–198 [DOI] [PubMed] [Google Scholar]
- 41. Abou-El-Ghar ME, El-Diasty Ta, El-Assmy aM et al. Role of diffusion-weighted MRI in diagnosis of acute renal allograft dysfunction: a prospective preliminary study. Br J Radiol 2012; 85: e206–e211 [DOI] [PMC free article] [PubMed] [Google Scholar]
- 42. Kaul A, Sharma RK, Gupta RK et al. Assessment of allograft function using diffusion-weighted magnetic resonance imaging in kidney transplant patients. Saudi J Kidney Dis Transpl 2014; 25: 1143–1147 [DOI] [PubMed] [Google Scholar]
- 43. Eisenberger U, Thoeny HC, Binser T et al. Evaluation of renal allograft function early after transplantation with diffusion-weighted MR imaging. Eur Radiol 2010; 20: 1374–1383 [DOI] [PubMed] [Google Scholar]
- 44. Park SY, Kim CK, Park BK et al. Assessment of early renal allograft dysfunction with blood oxygenation level-dependent MRI and diffusion-weighted imaging. Eur J Radiol 2014; 83: 2114–2121 [DOI] [PubMed] [Google Scholar]
- 45. Hueper K, Gueler F, Bräsen JH et al. Functional MRI detects perfusion impairment in renal allografts with delayed graft function. Am J Physiol Renal Physiol 2015; 308: F1444–F1451 [DOI] [PubMed] [Google Scholar]
- 46. Han F, Xiao W, Xu Y et al. The significance of BOLD MRI in differentiation between renal transplant rejection and acute tubular necrosis. Nephrol Dial Transplant 2008; 23: 2666–2672 [DOI] [PubMed] [Google Scholar]
- 47. Xiao W, Xu J, Wang Q et al. Functional evaluation of transplanted kidneys in normal function and acute rejection using BOLD MR imaging. Eur J Radiol 2012; 81: 838–845 [DOI] [PubMed] [Google Scholar]
- 48. Liu G, Han F, Xiao W et al. Detection of renal allograft rejection using blood oxygen level-dependent and diffusion weighted magnetic resonance imaging: a retrospective study. BMC Nephrol 2014; 15: 158. [DOI] [PMC free article] [PubMed] [Google Scholar]
- 49. Park SY, Kim CK, Park BK et al. Evaluation of transplanted kidneys using blood oxygenation level-dependent MRI at 3 T: a preliminary study. AJR Am J Roentgenol 2012; 198: 1108–1114 [DOI] [PubMed] [Google Scholar]
- 50. Sadowski EA, Fain SB, Alford SK et al. Assessment of acute renal transplant rejection with blood oxygen level-dependent MR imaging: initial experience. Radiology 2005; 236: 911–919 [DOI] [PubMed] [Google Scholar]
- 51. Grabner A, Kentrup D, Schnöckel U et al. Non-invasive imaging of acute allograft rejection after rat renal transplantation using 18F-FDG PET. J Vis Exp 2013: e4240. [DOI] [PMC free article] [PubMed] [Google Scholar]
- 52. Djamali A, Sadowski EA, Samaniego-Picota M et al. Noninvasive assessment of early kidney allograft dysfunction by blood oxygen level-dependent magnetic resonance imaging. Transplantation 2006; 82: 621–628 [DOI] [PubMed] [Google Scholar]
- 53. Beckmann N, Cannet C, Fringeli-Tanner M et al. Macrophage labeling by SPIO as an early marker of allograft chronic rejection in a rat model of kidney transplantation. Magn Reson Med 2003; 49: 459–467 [DOI] [PubMed] [Google Scholar]
- 54. Hitchens TK, Ye Q, Eytan DF et al. 19F MRI detection of acute allograft rejection with in vivo perfluorocarbon labeling of immune cells. Magn Reson Med 2011; 65: 1144–1153 [DOI] [PMC free article] [PubMed] [Google Scholar]
- 55. Yang D, Ye Q, Williams M et al. USPIO-enhanced dynamic MRI: evaluation of normal and transplanted rat kidneys. Magn Reson Med 2001; 46: 1152–1163 [DOI] [PubMed] [Google Scholar]
- 56. Ye Q, Yang D, Williams M et al. In vivo detection of acute rat renal allograft rejection by MRI with USPIO particles. Kidney Int 2002; 61: 1124–1135 [DOI] [PubMed] [Google Scholar]
- 57. Zhang Y, Dodd SJ, Hendrich KS et al. Magnetic resonance imaging detection of rat renal transplant rejection by monitoring macrophage infiltration. Kidney Int 2000; 58: 1300–1310 [DOI] [PubMed] [Google Scholar]
- 58. Erpicum P, Detry O, Weekers L et al. Mesenchymal stromal cell therapy in conditions of renal ischaemia/reperfusion. Nephrol Dial Transplant 2014; 29: 1487–1493 [DOI] [PubMed] [Google Scholar]
- 59. Aktas A, Karakayali H, Bilgin N et al. Serial radionuclide imaging in acute renal allograft dysfunction. Transplant Proc 2002; 34: 2102–2105 [DOI] [PubMed] [Google Scholar]
- 60. George EA, Codd JE, Newton WT et al. Comparative evaluation of renal transplant rejection with radioiodinated fibrinogen 99mTc-sulfur collid, and 67Ga-citrate. J Nucl Med 1976; 17: 175–180 [PubMed] [Google Scholar]
- 61. Lopes de Souza SA, Barbosa da Fonseca LM, Torres Gonçalves R et al. Diagnosis of renal allograft rejection and acute tubular necrosis by 99mTc-mononuclear leukocyte imaging. Transplant Proc 2004; 36: 2997–3001 [DOI] [PubMed] [Google Scholar]
- 62. Grabner A, Kentrup D, Edemir B et al. PET with 18F-FDG-labeled T lymphocytes for diagnosis of acute rat renal allograft rejection. J Nucl Med 2013; 54: 1147–1153 [DOI] [PubMed] [Google Scholar]
- 63. Grabner A, Schnockel U, Kentrup D et al. Strategies for non-invasive molecular imaging of acute allograft rejection by gamma scintigraphy and positron emission tomography. Curr Radiopharm 2011; 4: 10–23 [DOI] [PubMed] [Google Scholar]
- 64. Aktaş A, Aras M, Colak T et al. Indicators of acute rejection on Tc-99m DTPA renal scintigraphy. Transplant Proc 2006; 38: 443–448 [DOI] [PubMed] [Google Scholar]
- 65. Gupta SK, Lewis G, Rogers KM et al. Quantitative (99m)Tc DTPA renal transplant scintigraphic parameters: assessment of interobserver agreement and correlation with graft pathologies. Am J Nucl Med Mol Imaging 2014; 4: 213–224 [PMC free article] [PubMed] [Google Scholar]
- 66. Sanches A, Etchebehere ECSC, Mazzali M et al. The accuracy of (99m)Tc-DTPA scintigraphy in the evaluation of acute renal graft complications. Int Braz J Urol 2003; 29: 507–516 [DOI] [PubMed] [Google Scholar]
- 67. Niederle P, Reneltová I, Rossmann P et al. Clinical detection of rejection nephropathy using 125I-labelled fibrinogen. Int Urol Nephrol 1976; 8: 71–77 [DOI] [PubMed] [Google Scholar]
- 68. Salaman JR. Renal transplant rejection detected with 125 I-fibrinogen. Proc R Soc Med 1972; 65: 476. [DOI] [PMC free article] [PubMed] [Google Scholar]
- 69. Smith SB, Wombolt DG. Histologic correlation of transplant rejection diagnosed by computer-assisted sulfur colloid scan. Urology 1983; 21: 151–153 [DOI] [PubMed] [Google Scholar]
- 70. Petronis JD, Kittur DS, Wilasrusmee C. Critical evaluation of radiolabeled lymphocytes to detect acute renal transplant rejection in a large animal model. Med Sci Monit 2002; 8: BR515–BR520 [PubMed] [Google Scholar]
- 71. Jouret F, Lhommel R, Beguin C et al. Positron-emission computed tomography in cyst infection diagnosis in patients with autosomal dominant polycystic kidney disease. Clin J Am Soc Nephrol 2011; 6: 1644–1650 [DOI] [PubMed] [Google Scholar]
- 72. Boellaard R, Delgado-Bolton R, Oyen WJG et al. FDG PET/CT: EANM procedure guidelines for tumour imaging: version 2.0. Eur J Nucl Med Mol Imaging 2015; 42: 328–354 [DOI] [PMC free article] [PubMed] [Google Scholar]
- 73. Minamimoto R, Takahashi N, Inoue T. FDG-PET of patients with suspected renal failure: standardized uptake values in normal tissues. Ann Nucl Med 2007; 21: 217–222 [DOI] [PubMed] [Google Scholar]
- 74. Mettler FA, Huda W, Yoshizumi TT et al. Effective doses in radiology and diagnostic nuclear medicine: a catalog. Radiology 2008; 248: 254–263 [DOI] [PubMed] [Google Scholar]
- 75. Barrington SF, Mikhaeel NG, Kostakoglu L et al. Role of imaging in the staging and response assessment of lymphoma: consensus of the International Conference on Malignant Lymphomas Imaging Working Group. J Clin Oncol 2014; 32: 3048–3058 [DOI] [PMC free article] [PubMed] [Google Scholar]
- 76. Engel H, Steinert H, Buck A et al. Whole-body PET: physiological and artifactual fluorodeoxyglucose accumulations. J Nucl Med 1996; 37: 441–446 [PubMed] [Google Scholar]