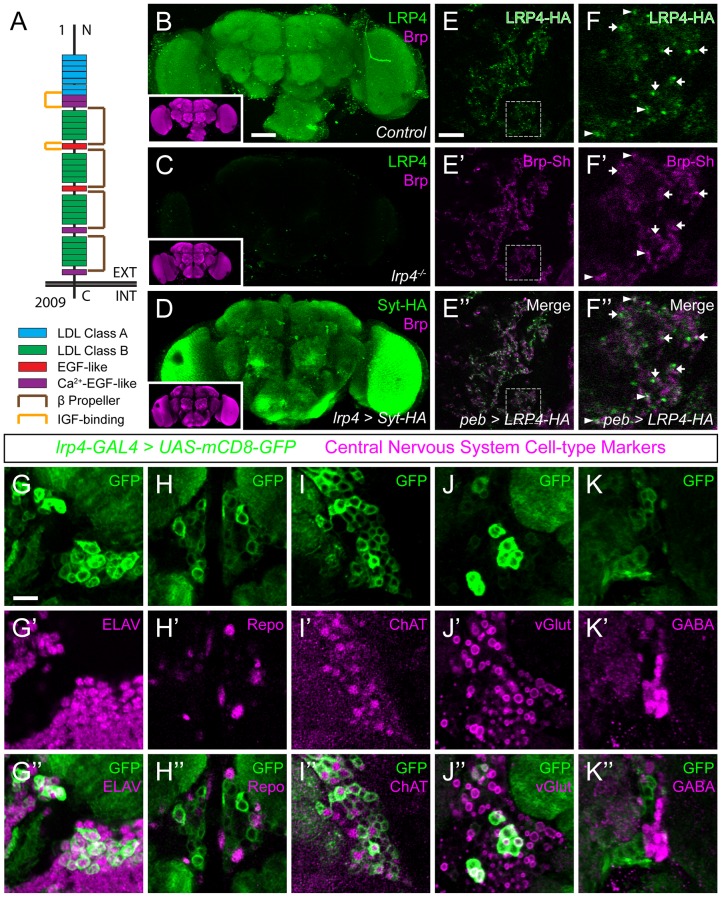
Figure 1. LRP4 is a synaptic protein expressed in excitatory neurons.
(A) Domain structure of Drosophila LRP4. Numbers indicate amino acids. EXT, extracellular side. INT, intracellular side. (B) Representative confocal image stack of a control Drosophila brain stained with antibodies against endogenous LRP4 (green) and Bruchpilot (inset, magenta) demonstrating expression throughout the brain. (C) Representative confocal image stack of an lrp4dalek null brain stained with antibodies against LRP4 (green) and Brp (inset, magenta) demonstrating antibody specificity. (D) Representative confocal image of a Drosophila brain expressing UAS-Syt-HA via lrp4-GAL4 and stained with antibodies to HA (D, green) and N-Cadherin (inset, magenta). The expression pattern resembles that of endogenous LRP4, supporting the specificity of lrp4-GAL4. (E) Representative single slice within a single antennal lobe glomerulus of a brain processed for expansion microscopy (proExM) expressing LRP4-HA and Brp-Short-mStraw in all ORNs via pebbled-GAL4 and stained with antibodies to HA (E, E”, green) and mStraw (E’-E”, magenta). LRP4 localizes to synaptic neuropil regions. (F) High magnification image of the region bounded by dashed lines in (E) and stained as above. Arrows indicate LRP4-HA localization adjacent to / not directly overlapping with Bruchpilot-Short. Arrowheads indicate overlapping LRP4-HA and Brp-Short localization. (G–K) Representative high magnification confocal stack images of neuronal cell bodies surrounding the antennal lobe in animals expressing UAS-mCD8-GFP via lrp4-GAL4 and stained for antibodies against GFP (G-K, green) and other cell-type markers (G’-K’, magenta). Merge channels (G’’–K’’) show colocalization of lrp4 with the neuronal marker ELAV (G’’) but not the glial cell marker Repo (H’’). Neurons positive for lrp4 show colocalization with choline acetyltransferase (ChAT, I’’), and the vesicular glutamate transporter (vGlut, J’’), but little to no colocalization with the inhibitory neurotransmitter GABA (K’’), suggesting that lrp4-positive cells are largely excitatory neurons. The percentage of GFP-positive cells that are ALSO positive for the cell-type specific marker are as follows: Elav = 99.50 ± 0.19% overlap; Repo = 0.38 ± 0.18% overlap; ChAT = 59.13 ± 2.48% overlap; vGlut = 22.38 ± 1.28% overlap; GABA = 0.25 ± 0.16% overlap. For all cases, n = 8 animals, ≥ 200 cells per animal. Values = mean ± s.e.m. Scale bars = 50 µm (B–D), 150 μm (B-D, insets), 25 μm (E–F), 10 μm (G–K).


