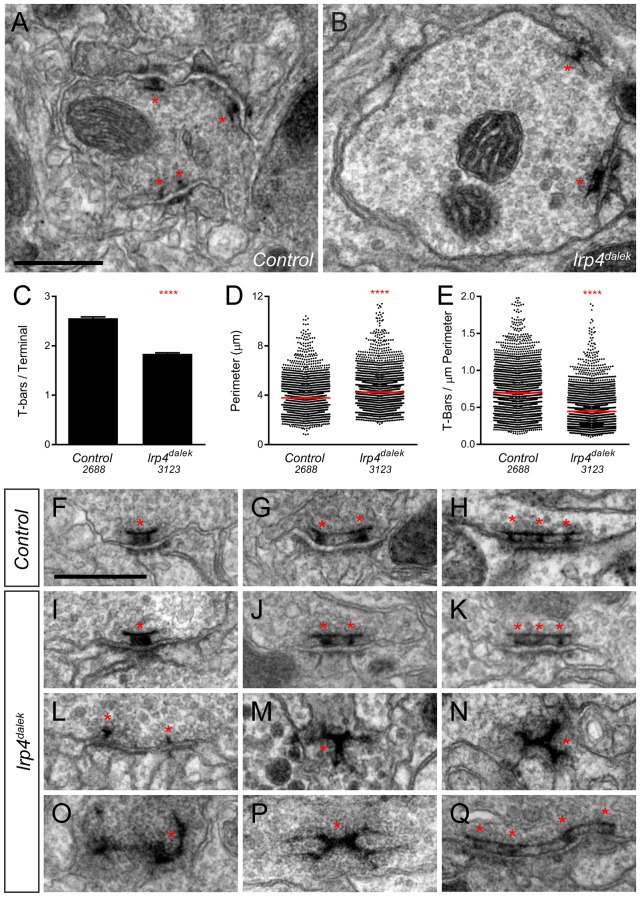
Figure 3. Loss of LRP4 causes defects in T-bar number and morphology.
(A–B) Representative transmission electron micrographs of putative ORN terminal in Control (A) and lrp4dalek (B) adult antennal lobes. Loss of lrp4 results in fewer observed T-bar profiles (asterisk) and a larger terminal perimeter. Scale bar = 1 µm. (C) Quantification of T-bar profiles per terminal in Control and lrp4dalek terminals. Loss of LRP4 results in a 31% reduction of T-bars. (D) Quantification of terminal perimeter in Control and lrp4dalek adults. Mutant terminals have a 13% greater perimeter than control terminals. (E) Quantification of the T-bar density per µm of terminal perimeter. Loss of LRP4 causes a 36% reduction in T-bar density when the increased terminal perimeter is accounted for. For (C–E), Control has n = 5 animals, 2688 terminals and lrp4dalek has n = 3 animals, 3123 terminals. The number of terminals measured is listed below the genotype. ****p<0.0001. Statistical comparisons (two-tailed Student’s t-test) are done between genotypes. Error bars represent mean ± s.e.m. (F–H) Representative transmission electron micrographs of individual T-bar profiles (asterisk) in control adults. Single (F), double (G), and triple (H) profiles are readily visible. (I–Q) Representative transmission electron micrographs of individual T-bar profiles in lrp4dalek adults. As in control flies, single (I), double (J) and triple (K) T-bar profiles were visible. The majority of T-bars, however, demonstrated morphology defects including those that lacked table tops (L), were detached from the membrane (M–N), were misshapen (N–P), and profiles containing four or more connected T-bars (Q). These all represent morphological defects that are not observed (or very rarely observed) in control adults. Scale bar = 200 nm.

