Abstract.
Radiation backscattered from the patient can contribute substantially to skin dose in fluoroscopically guided interventions (FGIs). The distribution of backscatter is not spatially uniform, and use of a single backscatter factor cannot provide an accurate determination of skin dose. This study evaluates a method to determine the backscatter spatial distribution through convolution of a backscatter-to-primary (BP) point spread function (PSFn). The PSFn is derived for a pencil beam using EGSnrc Monte Carlo software and is convolved with primary distributions using a dose-tracking system. The backscatter distribution calculated using the convolution method is validated with Monte Carlo-derived distributions for three different size “uniform” fields and with XR-QA2 Gafchromic film for nonuniform x-ray fields obtained using region-of-interest (ROI) attenuators and compensation filters, both with homogenous poly-methyl methacrylate and nonhomogenous head phantoms. The BP ratios inside uniform fields were calculated within of that determined using EGSnrc. For shaped fields, the BP ratio in the unattenuated ROI was calculated within of that measured with film; in the beam-attenuated periphery, agreement was within , due to the larger uncertainty of the dose-response curve of the film in the low-dose region. This backscatter PSFn convolution method is much faster than performing full-field Monte Carlo calculations and provides improved accuracy in skin dose distribution determination for FGI procedures.
Keywords: skin dose, fluoroscopy, backscatter, convolution, region-of-interest attenuator, compensation filter
1. Introduction
X-ray image-guided interventions are increasingly used to treat surgically inaccessible anomalies. Many of these interventions can be prolonged and result in a significant exposure to the patient’s skin.1 The biological damage to the tissue is associated with threshold dose levels for various deterministic effects. A substantial component of dose to the skin is due to backscattered radiation from the patient. Backscatter factors have been measured and calculated by a number of investigators; their results have shown the backscatter factor to be dependent on the size of the field, the thickness of the patient, and the beam energy.2–11 These backscatter factors can be used to convert the incident air kerma to the entrance surface dose at the center of a uniform beam of a given field size since the backscatter factors are determined under these conditions. However, the backscatter contribution to the skin dose will not be uniform across the field from the center to the edge but will decrease toward the periphery of the field and extend beyond the field boundary.12 Furthermore, when the primary beam is not uniform, a single backscatter factor will not be able to describe the distribution of backscatter dose. For example, beam-shaping devices, such as region-of-interest (ROI) attenuators13–15 and compensation filters,16 modulate the photon fluence in the field of view (FOV) by attenuating the x-ray intensity outside the area-of-interest. ROI attenuators result in a dose saving to the patient’s skin, but with increased image noise in the periphery of the x-ray beam and improved image quality in the unattenuated ROI. Likewise, compensation filters in fluoroscopy are used for x-ray signal equalization by compensating for spatially varying patient transmission in the FOV.17 The compensation filter modifies the primary x-ray intensity and results in dose reduction under the filter. The presence of beam-shaping devices modulates the primary dose intensity and thereby the spatial backscatter distribution over the FOV. In this paper, we describe a method to determine the two-dimensional (2-D) skin dose distribution for fluoroscopically guided interventions (FGI) through convolution of a backscatter point spread function (PSFn) with the primary entrance x-ray field.18 Dose distribution determination through the 2-D and three-dimensional (3-D) convolution19,20 of invariant kernels has been reported in radiotherapy for treatment planning with irregular shaped photon beams.21 The current work expands the scope of skin dose determination for FGIs through the use of pencil beam backscatter kernel convolution for irregularly shaped beams resulting from beam-shaping devices.
2. Materials and Methods
To determine the spatial distribution of backscatter to the patient’s skin, a backscatter PSFn normalized to the primary exposure was determined for both a uniform poly-methyl methacrylate (PMMA) phantom and an anthropomorphic head phantom by simulating a pencil beam with EGSnrc Monte Carlo software.22 Convolving this PSFn with the primary incident beam distribution provides the scatter distribution as shown in Fig. 1. This convolution method was incorporated into our dose-tracking system (DTS) software, which is able to model the primary beam and its intersection with the patient in real time on a Toshiba Infinix C-Arm system.23,24 The DTS software is proprietary to Toshiba Medical Systems’ imaging systems since it has been designed to use geometry and exposure information that is available in real time on their digital bus. Similar systems have been developed using the information available on the DICOM radiation dose structured report to provide dose mapping postprocedure,25,26 and the convolution method should be applicable if those systems are able to model the nonuniform primary fields described here. In general, the convolution method is applicable for any beam for which the primary distribution can be described.
Fig. 1.
Example of convolution of a backscatter PSFn with the primary field to obtain the backscatter distribution which extends outside the primary field.
In this study, examples of the application of this method are demonstrated for uniform fields of different size and for nonuniform fields resulting from the use of ROI attenuators and compensation filters. For validation, the results of this convolution method were compared to dose distributions measured with Gafchromic film and calculated with EGSnrc Monte Carlo software.
2.1. Gafchromic Film Dosimetry
To validate the convolution method, we used Gafchromic™ XR-QA2 (Ashland, New Jersey) film to measure the skin dose distribution on phantoms. The dose-response curve of the film was determined using a calibrated 0.6-cc Farmer type ionization chamber (model NE2507/3A, Nuclear Enterprises, Fairchild, New Jersey). The ionization chamber was placed on the beam central axis at the entrance surface of a PMMA phantom or alternatively of an SK-150 anthropomorphic head phantom (Phantom Laboratory, Salem, New York) and exposed to a fixed number of digital acquisition frames at 80 kVp, 3.1-mm Al half value layer (HVL), with an added beam filter of 1.8 mm of Al. The ionization chamber charge was measured with a PTW UNIDOS dosemeter and converted to skin dose using the chamber calibration factor and an air kerma to skin dose conversion factor of 1.06. The ionization chamber was replaced with 1 in. squares of film cut from a sheet from the same lot used for the validations, and subsequently 8 to 9 squares of film were exposed over a range of dose values extending to the peak skin dose (PSD) received by the phantoms during the validation exposures. The films and ionization chamber were placed in contact with the PMMA or SK-150 phantom to maintain the same beam qualities as those used for the skin dose measurements, which included both primary and backscatter radiation. The exposed films were kept for 24 h before they were read out with an HP Photosmart 7510 flatbed scanner at a resolution of 100 dpi with 24-bit color format. The red channel component of the digitized film was used for the dose calculation. The mean pixel value obtained from an unexposed control film was subtracted from the mean pixel value of the irradiated film to remove the base film density value.27 The film evaluation was performed using ImageJ 1.48v software (National Institutes of Health, Bethesda, Maryland). The orientation of the film and location in the flatbed scanner for film digitization were kept the same for the calibration and skin dose measurements.
2.2. Region-of-Interest Attenuator and Compensation Filters
The ROI attenuator used in this study is a 0.7-mm-thick sheet of copper of uniform thickness with a circular aperture in the center that can be inserted into the FOV with an automatic filter placement device. The attenuator reduces the primary beam dose in the region peripheral to the region of diagnostic or interventional interest formed by the circular aperture and the displayed brightness in the periphery is equalized by software relative to the ROI. ROI attenuators result in reduced dose to the patient’s skin due to reduced primary in the periphery and reduced backscatter in the ROI. Image quality is improved in the ROI due to the reduction in scatter to the image receptor, while image quality is reduced in the periphery due to increased image noise. Typically, reduced image quality in the periphery is acceptable to the interventionalist since that part of the image is needed only for reference. The ROI beam attenuator is located in the collimator assembly of the fluoroscopy machine between the x-ray tube and patient.
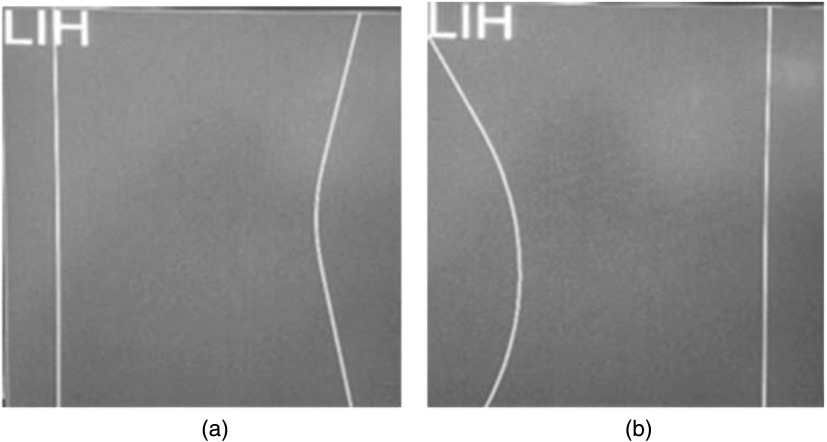
Shaped compensation filters are used in fluoroscopy to compensate for varying patient transmission in the FOV to “equalize” the signal at the image receptor. Two built-in compensation filters in the collimator assembly of a Toshiba Biplane Infinix machine were used for this study; Fig. 2 provides two last image hold (LIH) displays of the virtual outline of each of the two compensation filters when placed in the center of the field to show the outline of their edges on the right and left sides. The filters can be remotely inserted into the x-ray field, translated, as well as rotated, and even overlapped. The compensation filters have a uniform thickness except at the right and left edges in Fig. 2 where they taper linearly to nearly zero thickness.
Fig. 2.
LIH virtual-collimation displays on the control room monitor showing the outlines of two compensation filters (a and b) when centered in the FOV with the outer edges depicted on the right and left side of the filter by solid lines. Each filter has one curved edge and one straight edge and can be freely rotated and translated in the FOV.
To calculate the skin dose distribution, the ROI beam attenuator and the compensation filters are modeled in the DTS software. The movements of the ROI attenuator in the x-ray beam as well as the rotation and translation of the compensation filters are tracked in real time by reading digital controller area network (CAN) bus messages on the imaging system. The CAN bus is a standard network that connects hardware components on the imaging system. The x-ray transmission of the ROI attenuator material and the compensation filters was measured with the 0.6-cc Farmer-type ionization chamber for a range of kVps and beam filters available in the fluoroscopy machine. The measured transmission data points for each beam filter were curve fit as a function of kVp to a polynomial function, and the coefficients are stored in DTS calibration files. The transmission factors for the tapered edges of the compensation filters are calculated separately in the DTS by modeling the thickness variation. The exposure parameters used for the intervention are available to the DTS in real time through the digital CAN bus, and the appropriate factors are chosen for the respective technique parameters used during a procedure. The virtual rays originating from the focal spot to the coordinate vertices of the patient or phantom model are evaluated in the DTS for their intersection with the ROI attenuator or compensation filter model by means of the Möller–Trumbore28 ray triangle intersection algorithm. The primary dose intensity of those rays passing through the unattenuated opening is unchanged, and the intensity for those rays that pass through the ROI attenuator or compensation filter is reduced by the transmission factor to provide the primary beam intensity distribution incident on the patient/phantom.
2.3. Backscatter Point Spread Function and Scatter Dose Calculation
The x-ray tube of a Toshiba Infinix Biplane System was modeled in BEAMnrc/EGSnrc Monte Carlo software to simulate the spectra for this study. The details of the Monte Carlo code and validation of the spectrum are given elsewhere.29 A phase space file containing the spatial and energy information of the beam was used as input to DOSXYZnrc to obtain the dose absorbed per photon in the phantom model. To obtain the PSFn, EGSnrc is used to generate a 1-mm square pencil beam (80 kVp, 3.1-mm Al HVL) consisting of photons incident on a phantom, and the total primary plus backscatter entrance dose distribution is determined for voxels on the surface with 0.02% statistical uncertainty for the central voxel. The voxel dimensions of the simulated phantoms were maintained at except for the x-ray entrance surface layer. The backscatter distribution is obtained by subtracting the primary distribution and is then normalized by the primary dose value for the pencil beam to obtain a normalized backscatter PSFn with a central voxel uncertainty of 0.04%. The resultant PSFn characterizes the backscatter spatial variation for a pencil beam at the entrance surface.
For comparison, both the convolution method and EGSnrc were used to calculate the dose distribution for uniform fields of three sizes: (i) , (ii) , and (iii) at the entrance to a 20-cm-thick PMMA phantom. The voxel dimensions used for the EGSnrc Monte Carlo full-field simulations were to increase the calculation speed, except for the entrance surface layer for which a 0.5-mm thickness was used. The number of histories simulated was for each of the three different beam sizes. The scatter-to-primary dose using EGSnrc was determined by calculating the total dose distribution and the primary dose distribution measured with and without the simulated PMMA phantom, respectively. The statistical uncertainty for the Monte Carlo calculation for the voxels inside the , , field was 0.4%, 0.3%, and 0.6%, respectively, and nearly 11%, 8.8%, and 6.6%, respectively, outside the field.
2.3.1. Backscatter point spread function for PMMA phantom
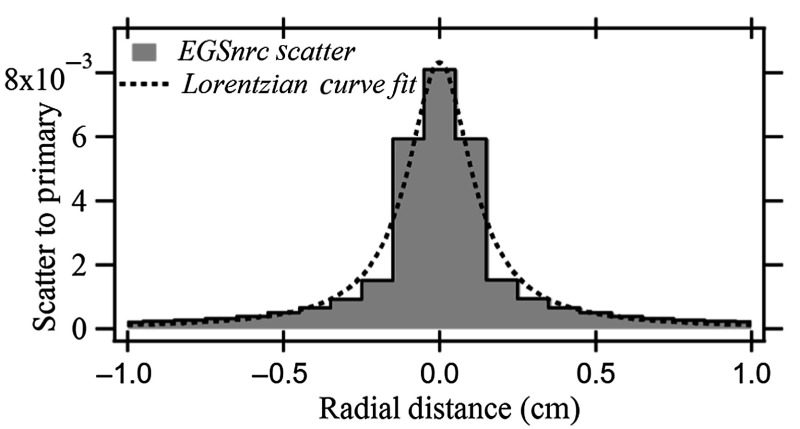
A backscatter PSFn was calculated for a homogenous PMMA phantom. An analytical form of the PSFn was approximated by curve fitting the normalized scatter kernel to a Lorentzian function. For convolution, the entrance plane is composed of a 2-D rectangular grid of 1-mm elements that match with the size of the pencil beam used for the PSFn generation.
2.3.2. Backscatter point spread function for SK-150 head phantom
A backscatter PSFn was also calculated for the SK-150 anthropomorphic head phantom, which has a natural human skull inside and material density equivalent to soft tissue. A CT scan of the SK-150 phantom was obtained and reconstructed with a voxel dimension of . The CT DICOM file was converted to a compactable .egsphant file to simulate the phantom model in EGSnrc Monte Carlo software. The EGSnrc generated a 1-mm square pencil beam (80 kVp, 3.1-mm Al HVL) that was incident on the lateral surface (left side) of the SK-150 phantom, and the backscatter PSFn was obtained by subtracting the primary dose distribution from the total dose distribution followed by normalization with the primary.
2.3.3. Backscatter calculation for a uniform x-ray field: PMMA
To evaluate the convolution method, a primary dose profile matrix with a spatial coordinate resolution of was generated for three different field sizes (, , and ) and located at the interventional reference point 54 cm from the focal spot. Appropriate inverse square intensity corrections were performed for the divergent beam relative to the midpoint of the matrix which intersects the central axis of the beam. The heel-effect beam nonuniformity in the anode–cathode direction is determined using the Gafchromic film and superimposed over the three uniform primary dose distributions. The PSFn kernel for the 20-cm-thick PMMA was convolved with the three primary dose distributions to generate the scatter-to-primary ratio inside and outside the collimated field. For comparison, EGSnrc Monte Carlo software was used to generate the total dose profile and primary dose profile for the same three fields to calculate the backscatter distribution (Sec. 2.3).
2.3.4. Backscatter calculation for nonuniform fields: PMMA
A graphic model of the PMMA phantom’s entrance surface is constructed with uniformly spaced coordinate vertices 1 mm apart consistent with the size of the beam used to generate the PSFn. The PMMA model’s entrance surface was located at the interventional reference point, 54 cm from the x-ray source in the DTS software.17 The primary dose intensities for the PMMA model vertices are obtained from the DTS calibration library for the corresponding kVp and beam filtration after inverse square corrections over the field. The x-ray field is shaped by the insertion of the ROI beam attenuator or two opposed compensation filters into the x-ray beam. The primary dose intensity of the PMMA model vertices is corrected for the transmission factors for those rays passing through the ROI attenuator or compensation filter outlines in the DTS. The transmission factors for the beam-shaping filters are obtained from the DTS calibration library. The DTS calculates and maps the entrance skin dose over the phantom model for each x-ray pulse and sums over all pulses to calculate the cumulative skin dose. The backscatter dose calculation using the PSFn convolution is performed after every exposure pulse and summed over all pulses.
The skin dose for the PMMA phantom was measured using Gafchromic film placed on the entrance surface of the phantom with the simultaneous skin dose calculation by the DTS. The dose intensity results obtained from the Gafchromic film were compared to the dose calculated by the DTS using the PSFn convolution. A numerical validation for the dose calculated by the DTS was performed for two shaped x-ray fields generated using the (i) ROI attenuator and (ii) two opposed compensation filters. The total dose intensity is mapped on the surface of the PMMA model with a color-dose scale. The line dose profile along the ROI perpendicular to the anode–cathode direction was used for the comparison of the dose intensities determined at the same location with the film.
2.3.5. Backscatter calculation for nonuniform fields: SK-150 phantom
A male adult head model equivalent to the dimensions of the SK-150 head phantom was selected from the DTS patient model library. The DTS software contains a comprehensive library of patient anthropomorphic models that are generated from MakeHuman open source 3-D computer graphics software and morphed with Blender 3-D graphics and animation software and that are categorized by patient weight and height. The surface of the models consists of a mesh of vertices that follows the body contour and is not uniformly spaced. The convolution requires uniformly spaced coordinates for backscatter calculation, and a surface with 1 mm spaced coordinates is assumed for scatter kernel convolution at the entrance FOV. To apply the convolution technique, the primary dose calculation is performed on the head model vertex coordinates in the entrance field, whereas the backscatter scatter convolution and subsequent backscatter determination are performed on the mesh overlapping the head model vertex in the entrance field with the vertices spaced 1 mm apart corresponding to the voxel dimensions used for the determination of PSFn. Two shaped fields are generated by the insertion of the ROI beam attenuator and two compensation filters. The phantom was covered with Gafchromic film and exposed laterally while dose was calculated with the DTS. The exposure and geometrical parameters were maintained the same as those for the PMMA phantom validation except for the source to skin distance (SSD), which was 49 cm resulting in an field at the entrance plane. The dose profile averaged over the width of a narrow rectangular strip of the film passing through the midpoint of the beam central axis was calculated for comparison.
3. Results
3.1. Region-of-Interest Attenuator and Compensation Filters
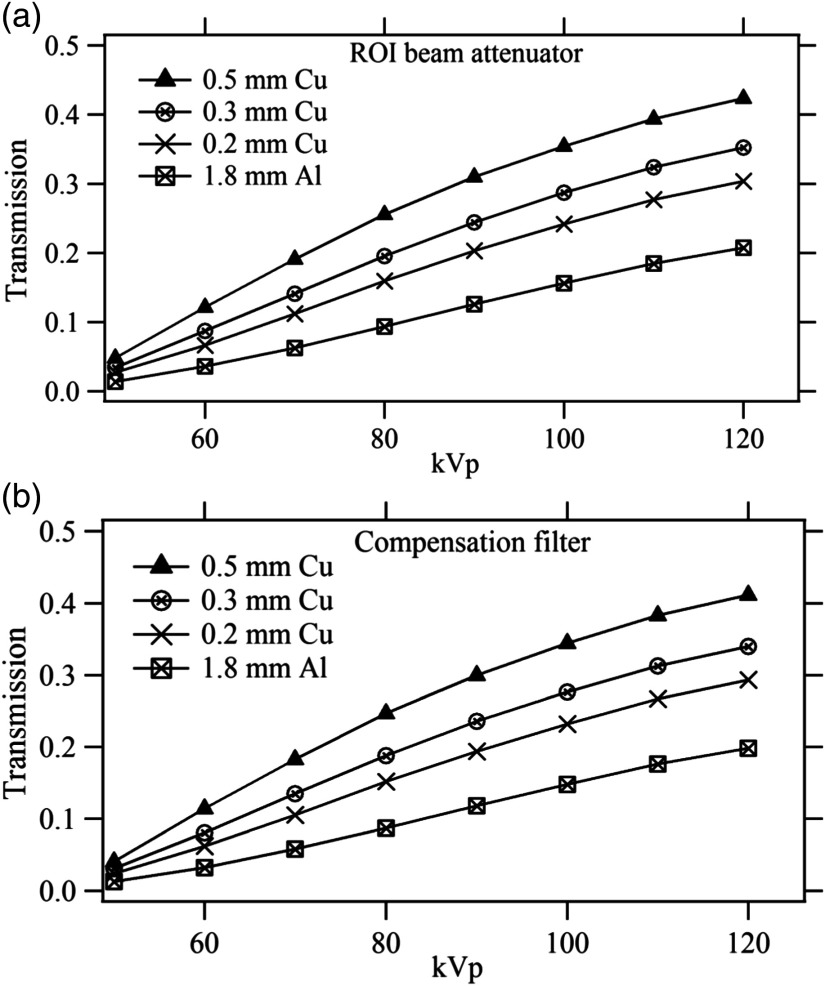
Figures 3(a) and 3(b) give the measured transmission for the ROI beam attenuator and compensation filters as a function of kVp for all available beam filters in the fluoroscopy machine. It is seen that the ROI attenuator transmission varies from about 2% to 5% at 50 kVp and 22% to 43% at 120 kVp, whereas the compensation filter transmission changes from 0.4% to 2% at 50 kVp to 20% to 40% at 120 kVp. The validations for the current study were performed with the 1.8-mm Al beam filter at 80 kVp and this corresponds to 9.4% transmission for the ROI attenuator and 8.7% transmission for the compensation filters.
Fig. 3.
Transmission factors measured for (a) ROI beam attenuator and (b) compensation filters. The legend indicated added beam filters.
3.2. Backscatter Point Spread Function and Scatter Dose: PMMA Phantom
Figure 4 shows the backscatter PSFn and the Lorentzian curve fit for the backscatter distribution of a 1-mm pencil beam for the 20-cm-thick PMMA phantom. A fit of the dose profile was obtained across the PSFn matrix encompassing the central voxel that encloses the primary pencil beam. The dose value for a voxel indicates the averaged dose across the volume the voxel occupies and was placed at the center of the voxel for the curve fit.
Fig. 4.
Backscatter PSFn with Lorentzian curve fit for 20-cm-thick PMMA phantom.
3.2.1. Backscatter calculation for uniform x-ray fields
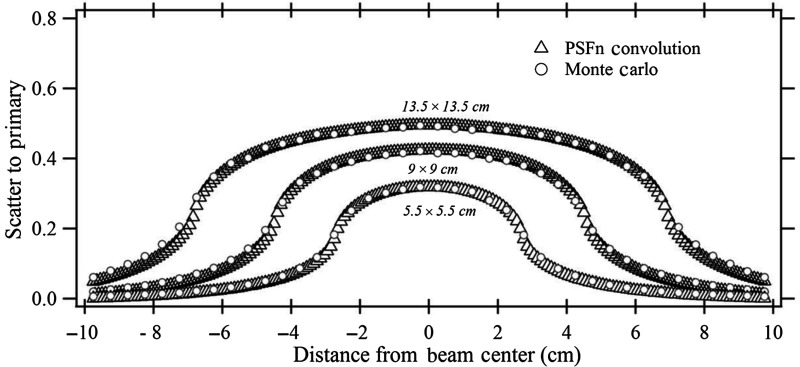
Figure 5 shows the scatter fraction for three different fields calculated with the PSFn convolution and EGSnrc. The backscatter-to-primary (BP) ratio inside and outside the collimated field is determined for a (i) , (ii) , and (iii) field at the entrance to a 20-cm-thick PMMA phantom. The beam quality for the EGSnrc calculation was the same as that used for the generation of PSFn. The PSFn kernel was convolved over the three primary field matrices to produce the backscatter fraction. The scatter distribution from each voxel for the convolution was considered to extend to 75 mm from its origin radially.
Fig. 5.
The BP ratios for three square fields calculated by PSFn convolution and by EGSnrc.
3.2.2. Backscatter calculation for nonuniform fields
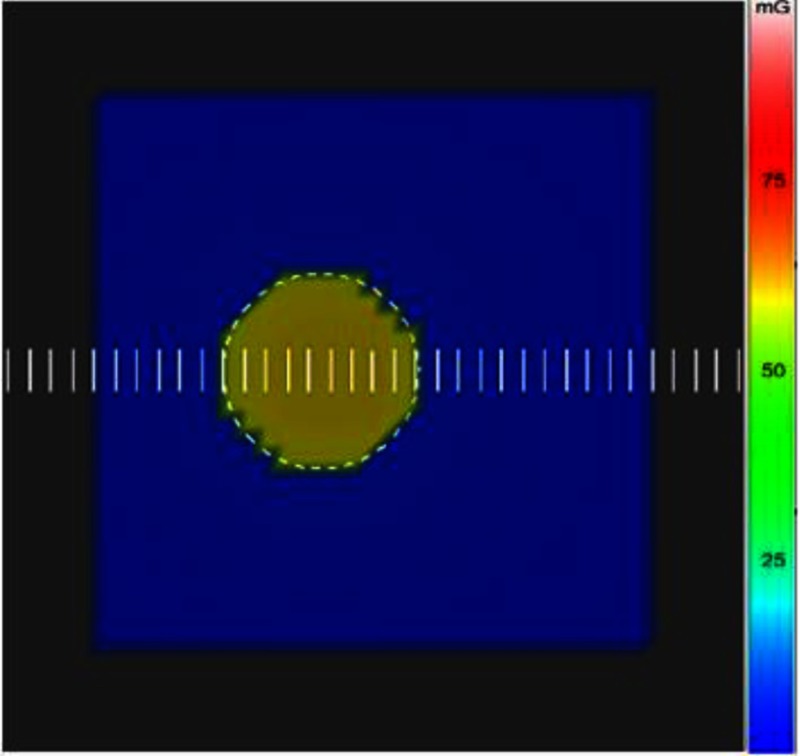
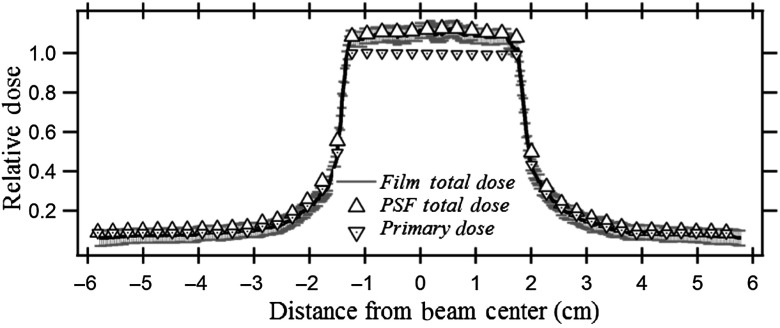
The ROI attenuator was inserted off-centered in the x-ray field with the PMMA phantom placed on its side and exposed laterally. The dose to the skin was measured with Gafchromic film, which was placed at the entrance surface and was simultaneously calculated with the DTS by the backscatter PSFn convolution technique. Figure 6 shows the color-dose mapping over the PMMA surface generated by the DTS with the ROI attenuator outline for the simulated validation procedure. The line dose profile is obtained across the midline of the field indicated as scale bars spaced 1 mm apart in Fig. 6. The entrance FOV was about . The dose-color scale extends from 0 to 100 mGy for this example.
Fig. 6.
Graphic model of PMMA phantom with color-coded entrance dose map generated by the DTS for a beam with an ROI attenuator.
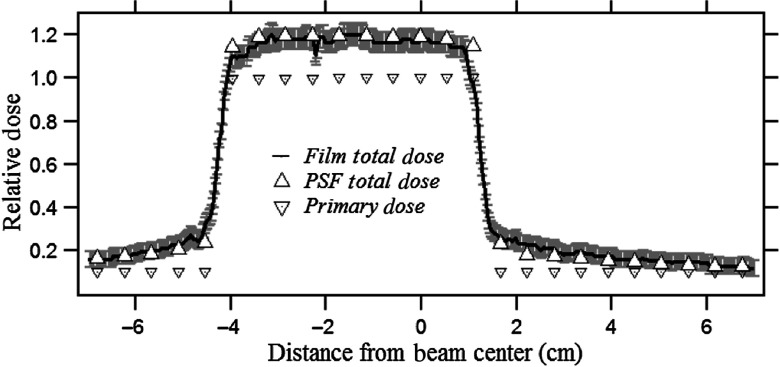
The phantom entrance was placed at the interventional reference point (SSD: 54 cm). The film was exposed for 30 s (80 kVp, 3.1-mm Al HVL, 80 ma, 10 ms, , and 1.8-mm Al beam filtration) and resulted in a PSD of 58 mGy. The ROI receives a relatively higher dose intensity due to the unattenuated primary and higher backscattered radiation compared to the periphery as per the color-dose scale illustration in Fig. 6. The exposed Gafchromic film reflectance was converted to the corresponding dose values using the calibration film dose-response curve. The dose calculated from the film and DTS is plotted on the same graph for comparison in Fig. 7; the dose values are normalized to the primary dose at the center of the ROI. The vertical error bars represent two standard deviations and result from the film calibration coefficient uncertainties.
Fig. 7.
Comparison of dose profile measured by Gafchromic film with that calculated using the PSFn for a beam with an ROI attenuator off-centered at about in the beam. The dose values are normalized to the unattenuated primary dose at the beam center. Also shown is the primary dose without backscatter measured without the phantom.
The unattenuated ROI receives about 20% backscatter relative to primary dose, and the attenuated periphery receives a gradually decreasing scatter with distance from the ROI. Small variations in the film dose intensities in the ROI arise from local pixel-to-pixel fluctuations in the film scan.
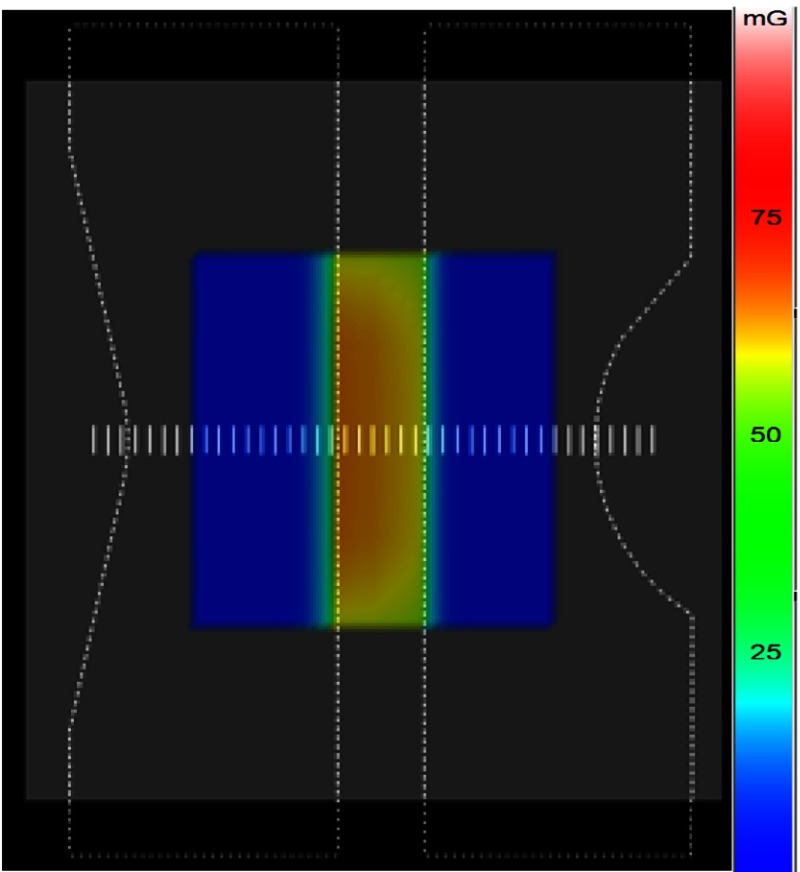
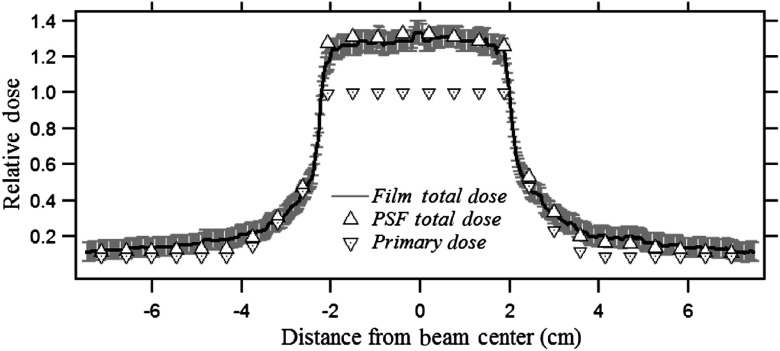
Figure 8 shows the DTS dose mapping on the PMMA phantom model with two compensation filters inserted into the field leaving a central unattenuated region. The phantom was irradiated with the same geometric and exposure parameters used in Sec. 3.2.2. The entrance dose was determined with the convolution method using the DTS software while being measured with Gafchromic film. Figure 9 shows a comparison between the two results with line profiles through the center of the FOV as shown in Fig. 8. The center of the FOV receives the highest dose and the dose gradually decreases toward the periphery due to the tapered edge of the filter as shown in Fig. 8, which shows a steady change of dose color. The DTS dose distribution agrees closely with the Gafchromic film measured distribution within the error bars, which result from the uncertainty of the film dose-response curve.
Fig. 8.
DTS color-dose mapping showing the PMMA block graphic model with opposed compensation filters partially deployed into the beam with a separation of their flat edges in the center.
Fig. 9.
DTS and film normalized dose profile comparison with two opposed compensation filters in the beam for the PMMA phantom
The backscatter factor at the center of the field is about 1.3. The taper in the thickness of compensation filter at the edges causes the gradual reduction in the dose transmission rather than the abrupt drop-off of primary seen for the ROI attenuator edge.
3.3. Backscatter Point Spread Function and Scatter Dose: SK-150 Head Phantom
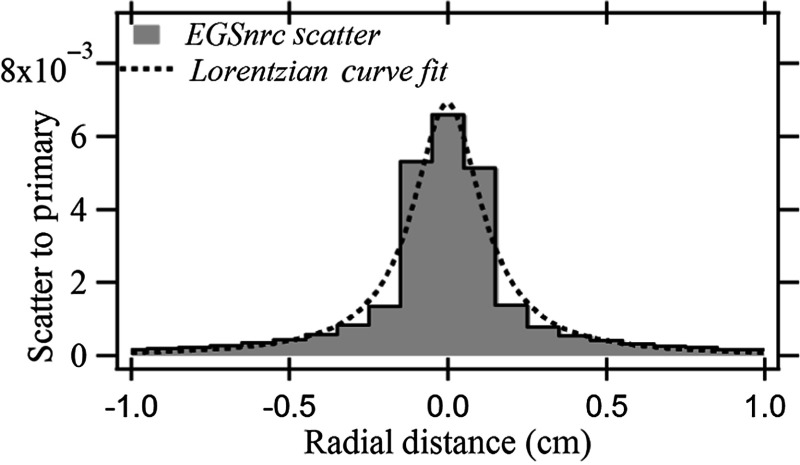
Figure 10 shows PSFn for the lateral surface of the SK-150 head phantom calculated by EGSnrc Monte Carlo software and the Lorentzian fitted curve. The distribution of backscatter for the pencil beam for the anthropomorphic phantom is specific to the region of exposure since it depends on the internal anatomic structures. The SK-150 head phantom surface for the present study is chosen since it is in a view commonly used for neurointerventions. The magnitude of the peak scatter for SK-150 is less than that for PMMA (0.0066 and 0.0081, respectively), likely due to the absorption of backscatter by the bone under the “skin.”30
Fig. 10.
Backscatter PSFn for SK-150 phantom for the lateral surface.
3.3.1. Backscatter calculation for nonuniform fields
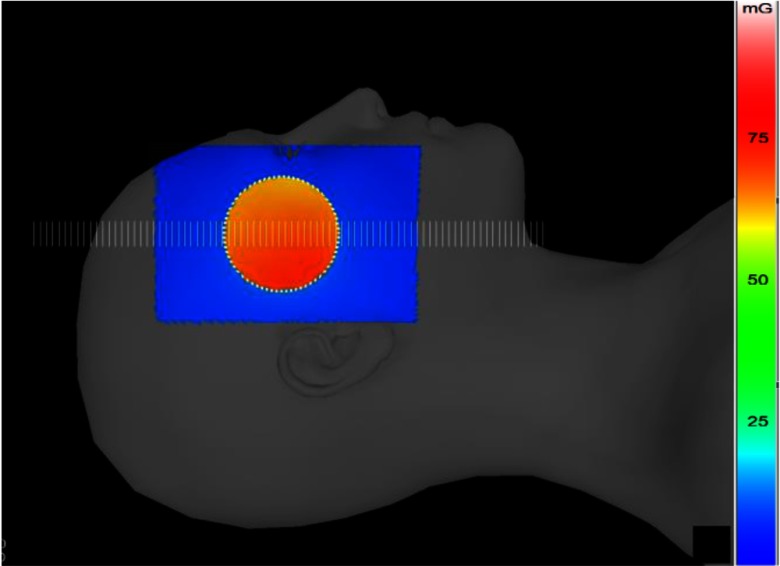
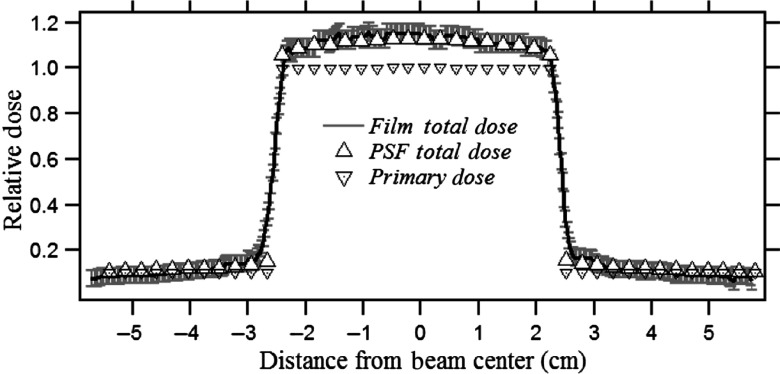
The lateral surface of the SK-150 phantom was covered with Gafchromic film and exposed with an ROI attenuator inserted at the center of the field. An exposure resulted in a PSD of about 70 mGy. The exposure and geometric parameters for the validation with film were kept the same as those used for the previous validations mentioned in Sec. 3.2.2. Figure 11 shows the DTS generated color-dose map for the validation procedure over a patient model matching the SK-150 phantom. A line dose profile is obtained along the horizontal axis of the field over the points indicated by scale bars as shown in Fig. 11. The line dose profile for the corresponding region from the film is estimated from the scan using the calibration curve. The absolute dose magnitudes obtained from the DTS and film were normalized with the unattenuated primary dose intensity for the curves shown in Fig. 12.
Fig. 11.
DTS display of the head model with the dose-color mapped for the validation with the ROI beam attenuator inserted into beam.
Fig. 12.
Dose profile across the midline of the field with an ROI attenuator as determined from convolution and film for the head phantom normalized to the primary in the ROI.
The transmission-dependent primary plus backscatter calculated using convolution (DTS) and film is plotted in Fig. 12. The variation in normalized primary dose across the field by the ROI beam attenuator is also indicated in the figure. The error bars associated with the Gafchromic film result from the calibration curve coefficient uncertainties. The DTS dose lies within the film error bars indicating high accuracy for the backscatter calculated with the convolution method.
A second shaped x-ray field was generated by inserting two compensation filters into the field with a gap in the center. The SK-150 phantom entrance surface was covered with the film while the entrance skin dose was calculated with the DTS using backscatter convolution. The exposure and geometric parameters for this validation were kept the same as the validation for the ROI attenuator.
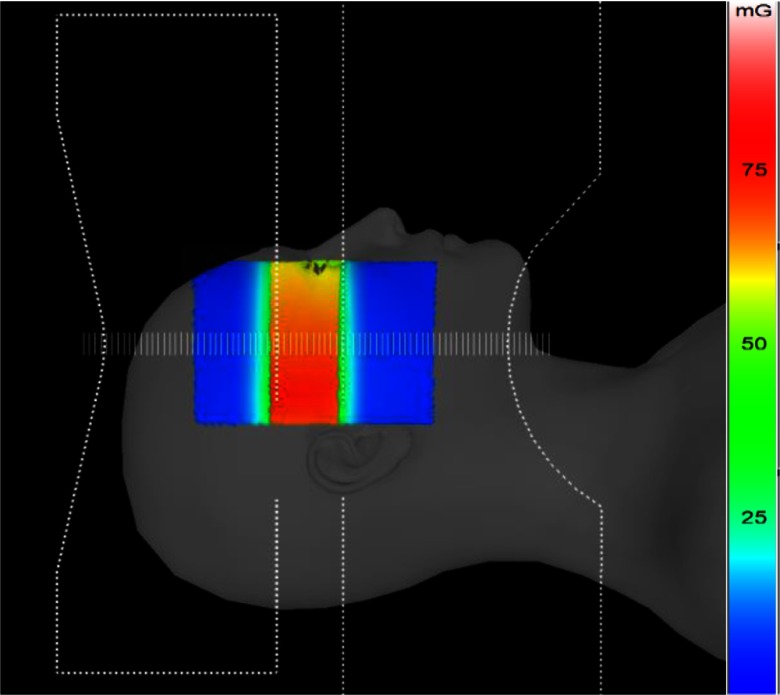
Figure 13 shows the DTS dose map with outlines of the two compensation filters. The higher dose in the bottom half of the central unattenuated region is due to the closer proximity of the head surface in that region to the focal spot. The PSD as indicated by the film and the DTS was close to 70 mGy. The intensity variation from the scanned film was converted to dose and normalized to the unattenuated primary dose in the ROI center. The normalized dose profiles as measured by the film and calculated by the DTS are shown in Fig. 14.
Fig. 13.
DTS patient head model with color-dose map with two compensation filters inserted into the field.
Fig. 14.
DTS and film normalized dose profile comparison for a beam with two compensation filters inserted for the SK-150 head phantom.
4. Discussion
Figure 5 shows the scatter-to-primary distribution obtained along a line perpendicular to the anode–cathode axis for three different uniform entrance FOVs as calculated by full-field EGSnrc and by PSFn convolution. Inside the and fields, the scatter-to-primary values calculated with PSFn convolution agree within 2% of those calculated with EGSnrc. For the field, the PSFn scatter to primary is within of that calculated with full-field EGSnrc. The backscatter PSFn at greater distances from the primary pencil beam has a relatively larger uncertainty than that at closer distances because of the fewer histories tracked, so that the smaller fields had slightly better agreement with the full-field EGSnrc. Toward the field edge, the scatter to primary decreases with a steep slope as seen in Fig. 5. The scatter to primary as calculated at the field edge with the PSFn convolution, for , , and FOV, agrees within 3% with the EGSnrc Monte Carlo simulated scatter-to-primary values. Each full-field Monte Carlo simulation by the CPU took 8 to 10 h of computational time to generate the dose distribution compared to about 500 ms by the PSFn convolution method.
The backscatter PSF will be dependent on various factors, such as beam energy, primary beam entrance angle, and location on the surface of a nonuniform phantom/patient.29 The detailed evaluation of the dependence of backscatter PSF on these parameters is beyond the scope of this work. Benmakhlouf et al.4 have reported the backscatter factor variation with energy within the diagnostic range to be from 5% to 20%, depending on the field size. For the results of this study, a constant beam energy corresponding to 80 kVp, 3.1-mm Al HVL was used. The effect of beam energy on the backscatter PSFn might have to be considered if the beam spectrum changes during the clinical procedure. Furthermore, studies with EGSnrc Monte Carlo on a water phantom have shown a dependence of backscatter PSF on the incident beam angle.29 In addition, the PSFn may change with location in the field for a nonhomogenous object with internal anatomic structures that may modify the backscatter;29,30 this is seen in the difference that we determined between the PSFn for the PMMA and SK-150 head phantoms. In this study, the PSFn calculated for the normal incidence pencil beam is convolved across the entire entrance field over the phantom surface with the assumption that the primary x-rays have nearly normal incidence. X-rays passing through the beam-shaping devices have their spectrum modified and may have a different PSF but this was not considered since the intensity under the attenuator is quite low and the contribution to backscatter will be correspondingly low. The calculation of scatter dose with convolution of a region-specific PSFn would be a more accurate approach; however, the use of the PSFn from the unattenuated region on the surface of the irradiated phantom is a reasonable substitute to get an acceptable accuracy as shown in the results of Secs. 3.2.1, 3.2.2, and 3.3.1. For the validation on the head model as shown in Figs. 11 and 13, the PSFn obtained for the unattenuated region is convolved over the entire FOV. The close agreement of the calculated scatter dose relative to the measured dose is apparent from the validation curves in Figs. 7, 9, 12, and 14. The assumption of replacing region-specific PSFns with a single PSFn from the unattenuated ROI for convolution provides a good approximation as seen in the validation curves of Figs. 12 and 14. Further investigations are needed into those variables that affect the PSFn to determine which should be included in PSFn selection to achieve reasonable error in skin dose determination.
The skin dose mapping for ROI fluoroscopy has been previously incorporated into the DTS software with an unattenuated beam-area weighted correction factor for backscatter estimation.31 As verified by Gafchromic film, the skin dose in the circular ROI was determined accurately by the DTS but had higher error in the attenuated region due to unaccounted for backscatter from the ROI to the periphery.31 The currently described method of PSFn convolution accurately estimates the scatter dose distribution in the regions of the beam with modified primary specific to the beam shape. According to Fig. 7, the PSFn convolution determined the backscatter to be 20% of the primary in the circular ROI for an ROI attenuator modified field, which agrees within 2.5% of that value measured by film. The dose received in the ROI was about 56 mGy, while the skin dose received in the attenuated periphery ranged from 11 to 7 mGy, with the scatter-to-primary ratio ranging from 2.4 to 1.50. In the attenuated region, the convolution-calculated dose was within 17% of that measured by the film, which is within the uncertainty of the film primarily due to the calibration uncertainty of dose-response curve for the low attenuated doses. For the validation with the SK-150 head phantom as in Fig. 12, scatter to primary in the unattenuated ROI estimated by convolution is within 3% that of the film, whereas the backscatter relative to the primary in the ROI agrees with the film within 17%. The BP ratio drops in the attenuated periphery of the field from 1.55 to 1.07 going away from the attenuator edge. The lower backscatter with SK-150 compared to the PMMA phantom is due to the smaller FOV used and scatter absorption by the bone under the “skin” in the phantom.20 The film calibration uncertainty for relative doses in the unattenuated regions of film for both PMMA and SK-150 phantoms was nearly 4% but varied up to 20% for the PMMA and 25% for SK-150 phantom toward the outermost region of the field. The larger uncertainty is due to the film response at low doses toward the periphery of the x-ray field, which was in the range of 4.5 to 5.0 mGy.
The incorporation of compensation filters into the DTS and a modified skin dose calculation were reported previously.9 The backscatter dose component was not accounted for in the calculation for the attenuated regions by the compensation filters and resulted in a discrepancy between the Gafchromic film measured dose and the DTS calculated dose. Using the backscatter PSF convolution method, Figs. 9 and 14 show the dose profile for the PMMA phantom and SK-150 head phantom for a field with two opposed compensation filters partially inserted. For the validation procedure with PMMA, a PSD of 63 mGy was recorded by the film in the unattenuated central region and dropped to as low as 6 mGy toward the edge of the attenuated periphery. The BP calculated by PSFn convolution in the unattenuated region agreed within 3% of that measured with the film with film dose uncertainty due to the film dose-response curve. The dose at the attenuated periphery of the field was calculated within of that of the film due to the low dose value and film calibration uncertainty in that range, which is observed to be around with respect to the relative dose.
For this study, we did not include the patient table or pad in the beam. With the table in the beam, additional corrections for attenuation and forward scattered radiation reaching the entrance skin surface are needed. The legacy DTS includes table attenuation and forward scatter in the calibration files for those rays passing through the table. Forward scatter will also have a spread distribution and, if significant, should be able to be accounted for using a similar forward scatter PSFn convolution. A constant forward scatter dose factor might be a reasonable approximation for acceptable dose distribution accuracy and this is under investigation.
5. Conclusions
We evaluated the use of a normalized backscatter PSFn and investigated its utility to estimate the backscatter distribution over the skin, particularly for nonuniform primary x-ray beams, such as result from the use of ROI attenuators and compensation filters during FGIs. The backscatter PSFn when convolved with the primary beam distribution provides the backscatter distribution across the entire field. This convolution method was validated with EGSnrc Monte Carlo simulations and Gafchromic film measurements for homogenous and anthropomorphic phantoms. The backscatter PSFn convolution could serve as an alternative technique for the determination of the spatial backscatter distribution and subsequently for skin dose mapping during fluoroscopic interventions. This method is more accurate than using a single backscatter factor and faster than performing full-field Monte Carlo calculations.
Acknowledgments
This research was supported by NIH Grant No. R01EB002873 and in part by the Toshiba Medical Systems Corporation.
Biographies
Sarath Vijayan is a PhD student at the State University of New York (SUNY), Buffalo, New York. He has been engaged in the research and development of a real-time skin dose-tracking system (DTS) software, Monte Carlo simulations on patient dose in imaging procedures, and evaluation of high-resolution x-ray imaging detectors.
Zhenyu Xiong is pursuing his doctoral degree at the University at Buffalo (UB), SUNY in medical physics. As a graduate research assistant under Dr. Daniel R. Bednarek, he has worked to improve the DTS. His areas of interest include Monte Carlo simulation on patients’ organs and effective dose and radiation dose measurements.
Stephen Rudin is the director of the Radiation Physics Division, Department of Radiology, SUNY, Buffalo, where he also serves as SUNY distinguished professor. He is the founding director of the Medical Physics Graduate Program at UB and a founding codirector of the UB-Toshiba Stroke and Vascular Research Center. He has been engaged in research in developing high-resolution x-ray imaging detectors, dose reduction methods, and endovascular devices, such as asymmetric stents, worked with major theoretical and clinical implications for medical physics, biomedical engineering, and diagnostic radiology.
Daniel R. Bednarek is a professor of radiology at SUNY, Buffalo, New York. He received his PhD in medical physics from the University of Chicago and has been engaged in research in region-of-interest imaging, including development and evaluation of limited-field-of-view and high-resolution real-time imaging detectors with specific application to neuroimaging. Recent work has focused on determination of patient radiation dose and development of a real-time DTS for interventional fluoroscopic procedures.
Disclosures
The authors received research support from the Toshiba Medical Systems and the National Institutes of Health (NIH). The DTS software is licensed to Toshiba Medical Systems by the Office of Science, Technology Transfer and Economic Outreach of the University at Buffalo.
References
- 1.Balter S., et al. , “Fluoroscopically guided interventional procedures: a review of radiation effects on patient’s skin and hair,” Radiology 254(2), 326–341 (2010). 10.1148/radiol.2542082312 [DOI] [PubMed] [Google Scholar]
- 2.Martin C. J., “Measurement of patient entrance surface dose rates for fluoroscopic x-ray units,” Phys. Med. Biol. 40, 823–834 (1995). 10.1088/0031-9155/40/5/008 [DOI] [PubMed] [Google Scholar]
- 3.Petoussi-Henss N., et al. , “Calculation of backscatter factors for diagnostic radiology using Monte Carlo methods,” Phys. Med. Biol. 43, 2237–2250 (1998). 10.1088/0031-9155/43/8/017 [DOI] [PubMed] [Google Scholar]
- 4.Benmakhlouf H., et al. , “Backscatter factors and mass energy-absorption coefficient ratios for diagnostic radiology dosimetry,” Phys. Med. Biol. 56, 7179–7204 (2011). 10.1088/0031-9155/56/22/012 [DOI] [PubMed] [Google Scholar]
- 5.Carlsson C. A., “Differences in reported backscatter factors for low-energy x-rays: a literature study,” Phys. Med. Biol. 38, 521–531 (1993). 10.1088/0031-9155/38/4/004 [DOI] [Google Scholar]
- 6.Grosswendt B., “Backscatter factors for x-rays generated at voltages between 10 and 100 kV,” Phys. Med. Biol. 29, 579–591 (1984). 10.1088/0031-9155/29/5/010 [DOI] [PubMed] [Google Scholar]
- 7.Grosswendt B., “Dependence on the photon backscatter factor for water on source to phantom distance and irradiation field size,” Phys. Med. Biol. 35, 1233–1245 (1990). 10.1088/0031-9155/35/9/004 [DOI] [Google Scholar]
- 8.Grosswendt B., “Dependence of the photon backscatter factor for water on irradiation field size and source-to-phantom distances between 1.5 and 10 cm,” Phys. Med. Biol. 38, 305–310 (1993). 10.1088/0031-9155/38/2/007 [DOI] [Google Scholar]
- 9.Harrison R. M., “Backscatter factors for diagnostic radiology (1-4 mm Al HVL),” Phys. Med. Biol. 27, 1465–1474 (1982). 10.1088/0031-9155/27/12/005 [DOI] [PubMed] [Google Scholar]
- 10.Klevenhagen S. C., “The build-up of backscatter in the energy range 1 mm Al to 8 mm Al HVL,” Phys. Med. Biol. 27, 1035–1043 (1982). 10.1088/0031-9155/27/8/005 [DOI] [Google Scholar]
- 11.Klevenhagen S. C., “Experimentally determined backscatter factors for x-rays generated at voltages between 16 and 140 kV,” Phys. Med. Biol. 34, 1871–1882 (1989). 10.1088/0031-9155/34/12/010 [DOI] [Google Scholar]
- 12.Vijayan S., et al. , “A system to track skin dose for neuro-interventional cone-beam computed tomography (CBCT),” Proc. SPIE 9783, 97832X (2016). 10.1117/12.2216931 [DOI] [PMC free article] [PubMed] [Google Scholar]
- 13.Rudin S., Bednarek D. R., “Spatial shaping of the beam: collimation, grids, equalization filters, and region-of-interest fluoroscopy,” in Syllabus: A Categorical Course in Physics-Physical and Technical Aspects of Angiography and Interventional Radiology, Balter S., Shope T. B., Eds., pp. 75–85, Radiology Society of North America, Oak Brook, Illinois: (1995). [Google Scholar]
- 14.Rudin S., Bednarek D. R., “Region-of-interest fluoroscopy,” Med. Phys. 19, 1183–1189 (1992). 10.1118/1.596792 [DOI] [PubMed] [Google Scholar]
- 15.Rudin S., et al. , “Clinical application of region-of-interest techniques to radiologic imaging,” RadioGraphics 16, 895–902 (1996). 10.1148/radiographics.16.4.8835978 [DOI] [PubMed] [Google Scholar]
- 16.Vijayan S., et al. , “Incorporating corrections for the head-holder and compensation filters when calculating skin dose during fluoroscopically guided interventions,” Proc. SPIE 9412, 94122I (2015). 10.1117/12.2082292 [DOI] [PMC free article] [PubMed] [Google Scholar]
- 17.Molloi S., et al. , “Area x-ray beam equalization for digital angiography,” Med. Phys. 26, 2684–2692 (1999). 10.1118/1.598808 [DOI] [PubMed] [Google Scholar]
- 18.Vijayan S., et al. , “A backscatter point spread function for entrance skin dose determination,” Med. Phys. 43(6), 3748–3749 (2016). 10.1118/1.4957503 [DOI] [Google Scholar]
- 19.Boyer A. L., Mok E. C., “A photon dose distribution model employing convolution calculations,” Med. Phys. 12, 169–177 (1985). 10.1118/1.595772 [DOI] [PubMed] [Google Scholar]
- 20.Ahnesjö A., Saxner M., Trepp A., “A pencil beam model for photon dose calculation,” Med. Phys. 19, 263–273 (1992). 10.1118/1.596856 [DOI] [PubMed] [Google Scholar]
- 21.Storchi P., Woudstra E., “Calculation of the absorbed dose distribution due to irregularly shaped photon beams using pencil beam kernels derived from basic beam data,” Phys. Med. Biol. 41, 637–656 (1996). 10.1088/0031-9155/41/4/005 [DOI] [PubMed] [Google Scholar]
- 22.Kawrakow I., Rogers D., “The EGSnrc system, a status report advanced Monte Carlo for radiation physics, particle transport simulation and applications,” NRCC Report PIRS-701 (2006).
- 23.Bednarek D. R., et al. , “Verification of the performance accuracy of a real-time skin-dose tracking system for interventional fluoroscopic procedures,” Proc. SPIE 7961, 796127 (2011). 10.1117/12.877677 [DOI] [PMC free article] [PubMed] [Google Scholar]
- 24.Rana V. K., Rudin S., Bednarek D. R., “A tracking system to calculate patient skin dose in real-time during neurointerventional procedures using a biplane x-ray imaging system,” Med. Phys. 43(9), 5131–5144 (2016). 10.1118/1.4960368 [DOI] [PMC free article] [PubMed] [Google Scholar]
- 25.Johnson P. B., et al. , “Skin dose mapping for fluoroscopically guided interventions,” Med. Phys. 38, 5490–5499 (2011). 10.1118/1.3633935 [DOI] [PMC free article] [PubMed] [Google Scholar]
- 26.Khodadadegan Y., et al. , “Validation and initial clinical use of automatic peak skin dose localization with fluoroscopic and interventional procedures,” Radiology 266, 246–255 (2013). 10.1148/radiol.12112295 [DOI] [PubMed] [Google Scholar]
- 27.Tomic N., et al. , “Characterization of calibration curves and energy dependence Gafchromic™ XR-QA2 model based radiochromic film dosimetry system,” Med. Phys. 41, 062105 (2014). 10.1118/1.4876295 [DOI] [PubMed] [Google Scholar]
- 28.Möller T., Trumbore B., “Fast, minimum storage ray triangle intersection,” J. Graphics Tools 2(1), 21–28 (1997). 10.1080/10867651.1997.10487468 [DOI] [Google Scholar]
- 29.Xiong Z., et al. , “Monte Carlo investigation of backscatter point spread function for x-ray imaging examinations,” Proc. SPIE 10132, 1013243 (2017). 10.1117/12.2254064 [DOI] [PMC free article] [PubMed] [Google Scholar]
- 30.Chow J. C. L., Owrangi A. M., “Surface dose reduction from bone interface in kilovoltage X-ray radiation therapy: a Monte Carlo study of photon spectra,” J. Appl. Clin. Med. Phys. 13(5), 215–222 (2012). 10.1120/jacmp.v13i5.3911 [DOI] [PMC free article] [PubMed] [Google Scholar]
- 31.Vijayan S, et al. , “A real-time skin-dose mapping system for region-of-interest (ROI) fluoroscopy,” Med. Phys. 42, 3717–3717 (2015). 10.1118/1.4926185 [DOI] [Google Scholar]


