

Summary
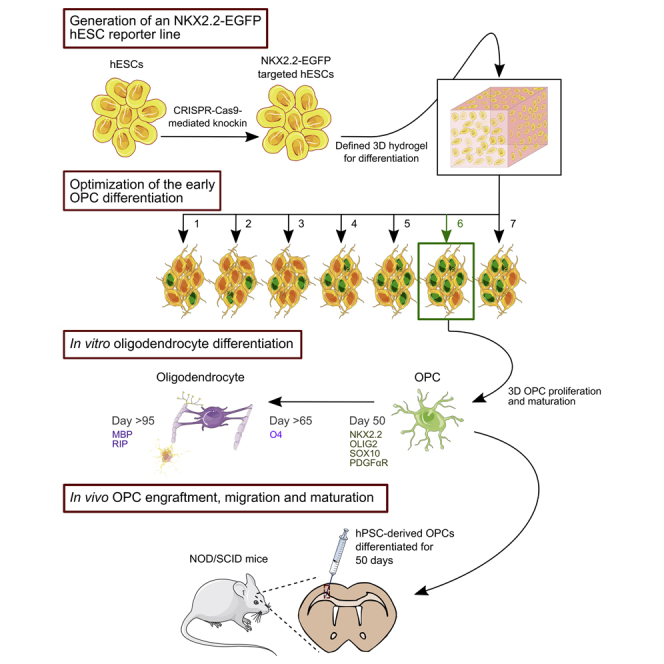
Oligodendrocyte precursor cells (OPCs) offer considerable potential for the treatment of demyelinating diseases and injuries of the CNS. However, generating large quantities of high-quality OPCs remains a substantial challenge that impedes their therapeutic application. Here, we show that OPCs can be generated from human pluripotent stem cells (hPSCs) in a three-dimensional (3D), scalable, and fully defined thermoresponsive biomaterial system. We used CRISPR/Cas9 to create a NKX2.2-EGFP human embryonic stem cell reporter line that enabled fine-tuning of early OPC specification and identification of conditions that markedly increased the number of OLIG2+ and NKX2.2+ cells generated from hPSCs. Transplantation of 50-day-old OPCs into the brains of NOD/SCID mice revealed that progenitors generated in 3D without cell selection or purification subsequently engrafted, migrated, and matured into myelinating oligodendrocytes in vivo. These results demonstrate the potential of harnessing lineage reporter lines to develop 3D platforms for rapid and large-scale production of OPCs.
Keywords: human pluripotent stem cells, oligodendrocyte precursor cells, three-dimensional culture systems, scalable and defined oligodendrocyte differentiation, CRISPR/Cas9 knockin, NKX2.2-EGFP reporter cell line
Graphical Abstract
Highlights
-
•
A defined and scalable 3D system accelerates the differentiation of OPCs from hPSCs
-
•
A NKX2.2-EGFP hESC reporter line enables optimization of OPC differentiation
-
•
3D-derived OPCs engraft, migrate, and mature after implantation into NOD/SCID mice
Oligodendrocyte precursor cells (OPCs) have broad potential for cell therapy; however, differentiating them at scale from human pluripotent stem cells remains challenging. Schaffer and colleagues established a NKX2.2-EGFP hESC reporter line that facilitated the development of a 3D system for directed differentiation of OPCs, which even without cell selection could migrate and mature into oligodendrocytes after implantation into NOD/SCID mice.
Introduction
Demyelinating diseases, injuries, and conditions, including pediatric leukodystrophies, white matter strokes, radiation-induced damage after cancer therapy, and spinal cord injury (SCI), are characterized by the loss or dysfunction of oligodendrocytes, the cells primarily responsible for myelin production in the CNS (Goldman and Kuypers, 2015). Without myelin insulating sheaths, axons are unable to properly conduct electrical impulses (Griffiths, 1998), resulting in impaired neurological and motor function, among other outcomes (Kassmann et al., 2007, Lappe-Siefke et al., 2003). No cure exists for demyelinating conditions, and current treatment regimens can only manage disease symptoms or slow the rate of demyelination (Helman et al., 2015, Najm et al., 2015). Due to their ability to differentiate into myelinating oligodendrocytes, oligodendrocyte precursor cells (OPCs) have emerged as candidates for cell therapy (Archer et al., 1997, Windrem et al., 2004, Windrem et al., 2008). Specifically, unlike mature oligodendrocytes, which are fibrous, fragile, non-proliferative, and non-migratory, OPCs are more resistant to mechanical stress, highly proliferative, and migratory, and can become myelinogenic after dispersal and subsequent maturation (Goldman and Kuypers, 2015).
Human pluripotent stem cells (hPSCs) have the capacity to self-renew and differentiate into all neural lineages and thus represent a promising and, in principle, scalable source for OPCs (Kang et al., 2007, Nistor et al., 2005), unlike primary human tissue (Uchida et al., 2000). In fact, OPCs generated from human embryonic stem cells (hESCs) were used in the first hESC-based clinical trial (Alper, 2009, Keirstead et al., 2005) and are undergoing further clinical development for SCI (Priest et al., 2015). Notably, there have been numerous advances that have enabled the production of OPCs from hPSCs, including several impressive efforts that applied key insights from developmental biology studies (Goldman and Kuypers, 2015). However, additional advances in their manufacturing would help OPCs reach their full therapeutic potential. For instance, current methods for differentiating OPCs from hPSCs can take more than 100 days to complete (Wang et al., 2013); entail undefined components, such as serum or Matrigel, which pose inherent reproducibility and safety challenges (van der Valk et al., 2010); and require purification strategies that can affect cell yield and viability (Diogo et al., 2012, Douvaras et al., 2014). Moreover, the large-scale manufacturing of clinical-grade OPCs could face further challenges considering that, to date, two-dimensional (2D) surfaces have been exclusively harnessed for their production (Czepiel et al., 2015, Douvaras and Fossati, 2015, Hu et al., 2009, Keirstead et al., 2005, Wang et al., 2013). For example, there are currently >200,000 patients with SCI, with an annual new incidence of 17,000 in the United States alone (Singh et al., 2014). Given that current clinical trials for SCI are dosing up to 20 million cells, producing sufficient cells for this target using 2D surfaces could pose a challenge, requiring an estimated 16,000 T75 flasks per year for culture densities of 300,000 cells/cm2. Thus, the field would benefit from the development of scalable processes for generating OPCs from hPSCs.
Compared with 2D surfaces, three-dimensional (3D) stem cell culture can facilitate substantially higher yields (Lei and Schaffer, 2013, Serra et al., 2012, Zweigerdt et al., 2011). For example, using a 3D thermoresponsive material under completely chemically defined conditions, we previously achieved 20-fold expansion of hPSCs every 5 days for a 1072-fold increase in yield during the course of a 280-day culture (Lei and Schaffer, 2013). Notably, this thermoresponsive material had a 2D footprint ∼35-fold lower than the equivalent 2D culture platform. In addition, 3D matrices have the potential to be engineered to more closely resemble embryonic tissue (Kraehenbuehl et al., 2011) and can conceivably promote more rapid and higher efficiency differentiation (Adil et al., 2017, Wu et al., 2014). Furthermore, a defined biomaterial offers the possibility of avoiding undefined components, such as Matrigel and/or fetal bovine serum, which are currently used for hPSC differentiation into OPCs (Douvaras et al., 2014, Stacpoole et al., 2013, Wang et al., 2013).
To contribute toward therapeutic translation of OPCs, we describe a 3D biomaterial system for scalable OPC generation from hPSCs. Because differentiation in either 2D or 3D is highly multifactorial and difficult to monitor, we used genome editing to establish an hESC reporter line that enabled rapid quantification and optimization of early OPC specification. Aided by this live-cell reporter of lineage-specific gene expression, we optimized a procedure for generating OPCs using a thermoresponsive, fully defined 3D culture system based on a PNIPAAm-PEG hydrogel material that we previously harnessed for hPSC expansion. Under the best identified condition, we produced late-stage OPCs from hPSCs within 65 days and mature oligodendrocytes within 95 days. Moreover, transplantation of 50-day-old OPCs generated via the 3D method into the brains of NOD/SCID mice revealed that these OPCs could engraft, migrate, and mature into oligodendrocytes, in the absence of cell purification or selection. These results demonstrate the potential for melding engineered reporters with scalable and defined 3D culture for the rapid and large-scale generation of transplantation-quality OPCs.
Results
Generation of an NKX2.2-EGFP Reporter Cell Line by Genome Editing
Due to the importance of NKX2.2 in promoting oligodendrocyte differentiation and maturation (Fu et al., 2002, Qi et al., 2001, Zhou et al., 2001) as well as its higher specificity for OPC differentiation relative to other early markers, including OLIG2 (Masahira et al., 2006, Qi et al., 2001), we hypothesized that an NKX2.2 expression reporter could be harnessed to optimize early OPC differentiation. We thus developed a strategy to knock EGFP into the nkx2.2 locus of hESCs and thereby generate a NKX2.2-EGFP fusion protein (Figure 1A). We first tested whether an NKX2.2-EGFP fusion could still function to stimulate transcription. HEK293T cells were co-transfected with an expression vector encoding either wild-type NKX2.2 or an NKX2.2-EGFP fusion, as well as a reporter plasmid harboring four direct repeats of the NKX2.2 binding site (Berger et al., 2008) upstream of a luciferase reporter gene. Importantly, no difference (p > 0.5) in luciferase expression was observed between the two NKX2.2 variants (Figure 1B).
Figure 1.

Generation of an NKX2.2-EGFP hESC Reporter Line
(A) Schematic of the gene-targeting strategy used to generate reporter cells. The top cartoon depicts the strategy to optimize early OPC differentiation using CRISPR/Cas9 genome engineering, and the bottom cartoon indicates the structures of the donor plasmid and the nkx2.2 locus before and after gene targeting. Genetic elements are not displayed to scale.
(B) Normalized luciferase activity in HEK293T cells co-transfected with a reporter plasmid containing four repeats of the NKX2.2 binding site sequence upstream a luciferase reporter gene along with an expression vector encoding either wild-type (WT) NKX2.2 or NKX2.2-EGFP (four technical replicates per condition). Mean and SD are shown.
(C) Southern blot of puromycin-resistant WIBR3 hESCs after electroporation with the SpCas9-sgRNA expression vector and the NKX2.2-EGFP donor plasmid. Genomic DNA was digested with SacI and hybridized with a 32P-labeled EGFP probe (see Figure 1A, bottom scheme) that detects a 3.2-kb fragment present only in gene-targeted clones.
(D) Phase-contrast image of N30 cells grown in Mebiol gel for 5 days under expansion conditions. Scale bar, 200 μm.
(E) Immunocytochemistry analysis of NKX2.2-EGFP and the pluripotency markers OCT4 and NANOG in N30 cells after expansion in the synthetic hydrogel. Scale bar, 50 μm.
(F) Western blot of cell lysate from N30 cells after differentiation for 20 days using multiple different conditions. Despite the presence of EGFP in the N30 hESC sample lane, no EGFP fluorescence was observed in N30 cells by fluorescence microscopy or flow cytometry.
We then employed the Cas9 nuclease from Streptococcus pyogenes (SpCas9) and a single-guide RNA (sgRNA) designed to target the last exon of the human NKX2.2 gene to stimulate homology-directed repair with a donor construct encoding EGFP and a PGK-puromycin expression cassette flanked by homology arms to the nkx2.2 locus (Figure 1A). Notably, the NKX2.2 gene has not previously undergone gene targeting in hPSCs. Following plasmid electroporation and puromycin selection, we obtained 36 hESC clones, 23 of which were positive for targeted integration as determined by PCR (Figure S1A). Of five positive clones selected for Southern blot analysis, three were targeted only in the nkx2.2 locus with no detectable off-target integration of EGFP (Figure 1C). Following expansion within the PNIPAAm-PEG hydrogel system, which is described in more detail below, we observed that clone N30 contained both the correct monoallelic modification (Figure S1B) and expressed both OCT4 and NANOG (Figures 1D and 1E), indicating that it likely retained pluripotency. Importantly, this hESC cell line did not express NKX2.2 and displayed only background levels of EGFP fluorescence (Figure 1F).
Patterning OPC Differentiation in a 3D Biomaterial
During organismal development, following neural tube patterning and neural stem cell differentiation, OPCs emerge in both the developing spinal cord and the forebrain in three sequential waves (Goldman and Kuypers, 2015). Key studies have demonstrated that emulating a differentiation route analogous to how OPCs are generated in the first wave within the spinal cord, where Sonic hedgehog (SHH) induces OPC emergence from the pMN domain (Lu et al., 2002) and retinoic acid (RA) promotes their caudalization (Stacpoole et al., 2013), can promote their rapid production from hPSCs (Goldman and Kuypers, 2015, Stacpoole et al., 2013).
Since a biochemically and mechanically defined environment could afford new opportunities for cell-lineage specification, we adapted a 3D biomaterial system for scalable OPC derivation using a PNIPAAm-PEG thermoresponsive hydrogel, which we previously showed is a highly effective system for hPSC expansion (Lei and Schaffer, 2013). In brief, solutions of this polymer are liquid at 4°C but form a gel when warmed to 37°C. Cells can thus be mixed with the liquid solution at 4°C and encapsulated within a solid hydrogel upon warming to 37°C. Following expansion or differentiation, cells can be readily recovered when the gel liquefies upon cooling. Importantly, not only does the resulting matrix support a tunable 3D culture, but this system also protects cells from uncontrolled aggregation and/or agitation-induced shear forces.
To differentiate OPCs from hPSCs in a scalable hydrogel-based system, we tested seven culture conditions utilizing: (1) the dual-SMAD inhibitors SB431542 and LDN193189, which together facilitate neural patterning (Chambers et al., 2009); (2) SHH or Smoothened agonist (SAG), which promote neural tube ventralization (Briscoe and Ericson, 1999, Chen et al., 2002, Hu et al., 2009); (3) RA, which enhances neural tube caudalization (Keirstead et al., 2005, Okada et al., 2004, Stacpoole et al., 2013); and (4) CHIR99021, which promotes OLIG2 expression (Maury et al., 2015) (Figure 2A).
Figure 2.

Optimization of Early OPC Differentiation in 3D
(A) Conditions used for early OPC differentiation. The left diagram indicates the different stages of development of early OPCs and the markers expressed during those stages. The right scheme depicts the different combinations of factors used for differentiation. The best performing condition (6) is highlighted with a black arrow.
(B) Analysis of NKX2.2-EGFP fluorescence after N30 cells were differentiated for 18 days in 3D using conditions 3 and 6.
(C) Heatmap illustrating NKX2.2-EGFP mean fluorescence intensity (MFI) after N30 cells were differentiated for 10, 14, 18, or 20 days using conditions 1–7 (three technical replicates per condition).
(D–F) ICC analysis after N30 cells were differentiated for 18 days in 3D using condition 6 (D and F) and condition 3 (E).
(G–I) Quantitative analysis of ICC using CellProfiler after N30 cells were differentiated for 14 and 18 days. The percentage of positive cells was normalized to DAPI-stained nuclei (>1,000 cells/condition × 3 independent experiments). Mean and SD are shown.
(J) Temporal ClustVis analysis of qPCR gene expression after N30 cells were differentiated in 3D. The concentrations of factors shown in the heatmap caption are: RA (red = 0 nM, blue = 100 nM), SHH (red = 0 ng/mL, blue = 100 ng/mL), SAG (red = 0 μM, white = 0.5 μM, blue = 1 μM), and CHIR (red = 0 μM, blue = 3 μM) (three technical replicates).
(K) Temporal fold-expansion analysis of N30 cells differentiated in 2D or 3D for 11 and 20 days, using condition 6. Expansion was normalized to the number of cells seeded for differentiation (four technical replicates per condition × 4 independent experiments).
∗p < 0.05, ∗∗p < 0.01, ∗∗∗p < 0.001 by Mann-Whitney test. Scale bars, 50 μm (B, D, and F) and 100 μm (E).
Following dual-SMAD induced neural specification, we first assessed the impact of SHH protein versus SAG, a small-molecule SHH signaling agonist, on hESC differentiation (Figure S2). We observed only minor differences in NKX2.2 and OLIG2 expression between these two conditions in this pilot experiment (Figure S2). We thus utilized SAG for all subsequent studies (specifically conditions 2–7), as it is more stable, and prior work has indicated that it may be more active than recombinant SHH at inducing OPC differentiation (Douvaras et al., 2014; Figure 2A). Next, since both motor neuron and OPC development rely on OLIG2 expression (Park et al., 2002), and since Wnt and RA signaling cooperate to specify OLIG2+ human spinal motor neurons (Maury et al., 2015), we also included the Wnt pathway activator CHIR99021 (a GSK inhibitor) and RA in our analysis (conditions 3, 4, and 5 and conditions 4, 5, 6, and 7, respectively). Finally, in addition to varying the SAG concentration (condition 5), the time of RA and SAG addition was varied (conditions 6 and 7).
Optimization of Early OPC Differentiation in 3D
We cultured N30 cells in the 3D biomaterial using conditions 1–7 and quantified early OPC differentiation via EGFP expression. Importantly, both fluorescence and western blot analyses indicated a range of differentiation efficiencies (Figures 1F and 2B), which we further evaluated longitudinally via flow cytometry (Figure 2C). After 18 days of differentiation (Figures 2C–2I), conditions 5, 6, and 7 were found to be the most promising for early OPC differentiation, as they led to NKX2.2-EGFP expression in 65%, 69%, and 50% of cells, respectively (Figure 2G). Condition 6 had the highest NKX2.2-EGFP levels, with peak expression observed at approximately day 14 (Figure 2C). Furthermore, immunofluorescence analysis of NKX2.2 (which included both the wild-type and engineered NKX2.2 proteins) revealed a similar trend, with 79%, 81%, and 73% of the cells positive under conditions 5, 6, and 7, respectively (Figure 2H). A second key early OPC marker, OLIG2, was expressed by 69%, 57%, and 61% of cells in conditions 5, 6, and 7, respectively (Figures 2B–2I).
We next conducted qPCR to further characterize the expression of seven genes that regulate OPC patterning and analyzed the results with ClustVis, an in silico tool that enables clustering of differentiation conditions with similar gene expression patterns at different time points using tree diagrams (Metsalu and Vilo, 2015). Consistent with our efforts to rapidly generate early OPCs characteristic of the first wave of OPC differentiation in the spinal cord, these results highlighted a strong patterning effect characteristic of RA-associated caudalization, as indicated by the bimodal clustering of the RA-containing conditions (p < 0.005) (Figure 2J) and by the expression levels of the early spinal cord marker HOXB4. This effect was also seen in ICC analysis of OLIG2 expression, where conditions with RA (conditions 4, 5, 6, and 7) had the highest percentage of OLIG2-expressing cells (Figures 2E, 2F, and 2I). Overall, immunostaining (Figures 2B–2I) and qPCR (Figure 2J) suggested that SAG and RA combined may increase early OPC patterning. Likewise, based on NKX2.2-EGFP fluorescence and qPCR analysis of OLIG2 and NKX2.2 expression, the addition of both SAG and RA on day 2 (condition 6) was more effective than starting SAG after the RA treatment (condition 7). Additionally, using condition 6, which was apparently the most effective for OPC differentiation, we compared the fold increase of cells differentiated in the PNIPAAm-PEG system and on a standard Matrigel-coated 2D surface. Notably, after 20 days, 3D culture yielded ∼3.5-fold more cells overall than a 2D surface (p < 0.0005) (Figure 2K), consistent with past findings indicating that 3D culture can increase cell yield (Lei and Schaffer, 2013). Finally, it is noteworthy that among conditions 5, 6, and 7, only condition 7 had previously been used to differentiate OPCs, though exclusively on 2D systems (Douvaras and Fossati, 2015, Douvaras et al., 2014), highlighting the promise of pairing new soluble media conditions with the 3D biomaterial to further tune and enhance differentiation.
To analyze the generality of the approach, we tested the seven conditions using a different cell line, H9 hESCs. After again conducting qPCR and ClustVis analysis, we similarly observed an RA-based bimodal data clustering of the conditions that promoted NKX2.2 and OLIG2 gene expression, with a clear segregation of conditions 4, 5, 6, and 7 (Figure 3A). Encouragingly, ICC analysis of H9 cells differentiated under condition 6 on days 14 and 18 revealed that most cells (∼80%) expressed the OPC markers NKX2.2 and OLIG2 by day 18, indicating increased differentiation (Figures 3B and 3C). Because condition 6 resulted in the highest NKX2.2 and OLIG2 expression levels using both N30 and H9 hESCs, we also tested this culture medium composition for 3D differentiation of transmembrane C-terminal fragment (TCTF) human induced pluripotent stem cells (iPSCs). On days 14 and 18, using both ICC and qPCR, we again observed high expression levels of NKX2.2 and OLIG2 (Figures 3D–3F).
Figure 3.

Early OPC Differentiation in hPSCs
(A) Temporal ClustVis analysis of qPCR gene expression after H9 hESCs were differentiated in 3D (three technical replicates).
(B and D) ICC analysis of early OPC markers and the proliferation marker Ki-67 after H9 (B) and TCTF (D) cells were differentiated in 3D for 18 days. Scale bars, 50 μm.
(C and E) Quantitative analysis of ICC using CellProfiler after H9 (C) and TCTF (E) cells were differentiated for 14 and 18 days (>1,000 cells × 3 independent experiments). Mean and SD are shown.
(F) Temporal qPCR analysis of early OPC gene expression after TCTFs were differentiated for 12 and 16 days in 3D (three technical replicates).
In summary, using the best condition (i.e., condition 6) with the 3D system, we observed 92%, 84%, and 57% OLIG2+ cells on day 18 using TCTF, H9, and N30 cells, respectively. By comparison, prior studies observed ∼70% OLIG2+ cells after differentiating hPSCs for 24 days (Stacpoole et al., 2013) or 8 days (Douvaras et al., 2014) using a Matrigel-coated 2D surface. Taken together, these results illustrate that modulating factors that govern early patterning can enhance early OPC differentiation in 3D. Additionally we showed the advantages of adding SAG and RA both early and simultaneously in a manner not previously tested.
3D Culture Supports Oligodendrocyte Maturation
After optimizing early OPC differentiation, we assessed the potential of 3D culture for maturing OPCs to the stages needed for biomedical applications. Based on prior work (Douvaras et al., 2014), we used a base maturation medium for this process (containing T3, PDGF-AA, and NT-3, and other OPC-specifying factors). Importantly, early OPC marker expression can decrease within the first 2 weeks of cell differentiation (Douvaras et al., 2014; Figures 2C and S3). We hypothesized that adding fibroblast growth factor 2 (FGF-2) or OPC maturation medium during this window could potentially alleviate this issue. Notably, FGF-2 has been reported to enhance OPC expansion and maturation (Kang et al., 2007, Kerr et al., 2010), although its role in human OPC differentiation has been unclear (Hu et al., 2009, Stacpoole et al., 2013, Wang et al., 2013). Using H9 cells, which yielded ∼85% OLIG2+ cultures (Figure 3), we thus added FGF-2 with OPC proliferation medium at day 14 or day 20, followed by the OPC maturation medium (Figure 4A and Table S2). After adding FGF-2 daily from day 14 to day 18, and maturation medium thereafter (henceforward referred to as early FGF treatment), we observed similar OPC differentiation results on day 24 with and without FGF-2 (Figure S4). However, given the trend for the number of O4+ cells (Figure 4B), condition 6 with the early FGF treatment was explored in greater detail.
Figure 4.

3D Differentiation Enables Oligodendrocyte Maturation
(A) Conditions tested for OPC maturation. The left diagram illustrates different developmental stages for OPCs and oligodendrocytes and lists their specific markers. The right scheme depicts the strategies used for oligodendrocyte maturation after the differentiation of early OPCs with condition 6. Early FGF, the best performing method, is highlighted with a black arrow.
(B) Quantification of O4 expression by ICC after differentiating H9 cells for 95 days using several different strategies and passaging cells onto 2D on day 75. Results show the average number of O4+ cells (per initial 1,000 hPSCs seeded for differentiation) present in each of the IXM-imaged culture areas. Cells were counted using CellProfiler software (25 fields per condition, with >200 cells each, × 4 independent experiments).
(C) ICC analysis of H9 cells differentiated for 18 days using early FGF.
(D and E) ICC analysis of H9 cells differentiated for 55 and 65 days using early FGF.
(F) qPCR analysis of OPC and oligodendrocyte gene expression in H9 cells differentiated for 50, 75, and 95 days (three technical replicates).
(G and I) ICC analysis of H9 cells differentiated for 89 and 95 days using early FGF and passed onto 2D after 75 days of differentiation in 3D.
(H) Quantification of O4 expression analysis by ICC using CellProfiler after N30 cells were differentiated for 95 days using the seven different conditions tested for early OPC differentiation in 3D. Results show the average number of O4+ cells differentiated per initial 1,000 hPSCs seeded for differentiation. Cells were passed onto 2D on day 75 (>1,000 cells/condition × ≥3 independent experiments). Mean and SD are shown.
∗p < 0.05 by Mann-Whitney test. Scale bars, 50 μm (C and D [left and right], E and G [left], and I), 20 μm (D [middle] and G [right]), and 100 μm (G, middle).
Having defined an advantageous set of conditions for late-stage OPC maturation, we longitudinally analyzed OPC maturation markers on days 18, 55, and 65 using H9 cells (Figures 4C–4E). First, expression of the OPC marker PDGFαR was detected by day 18 (Figure 4C). Next, following 55 days of the differentiation, NKX2.2 and OLIG2 were expressed by most cells (∼70%), and the key OPC marker SOX10 was expressed by ∼60% of cells (Figure 4D). Finally, O4 expression was first observed on day 55 (Figure 4D) and progressively increased thereafter (Figure 4E). Importantly, because proliferative and migrating OPCs are well suited for transplantation, cells that express SOX10 but not the more mature OPC marker O4 may reside in a developmental stage ideal for implantation (Goldman and Kuypers, 2015), which in our 3D system corresponded to day-50 cells (Figures 4D and 4F). Likewise, additional analysis showed that cells generated in this 3D system had high viability upon cryopreservation (Figure S4).
We also investigated whether OPCs generated with the appropriate level of developmental maturity for transplantation studies had the potential to develop into late-stage OPCs and oligodendrocytes, whose scalable 3D production could enable drug discovery, disease modeling, or other studies that depend on mature cultures. We used a 95-day protocol that incorporated early FGF treatment for OPC maturation, but then transferred these 3D-generated cells onto 2D for late-stage OPC maturation and electrophysiology studies on day 75. qPCR analysis on days 50, 75, and 95 showed an increase and plateau in the expression of OPC and oligodendrocyte markers (Figure 4F). Notably, ICC analysis revealed a longitudinal increase in the number of cells expressing O4 and confirmed the presence of mature oligodendrocytes, as evident in myelin basic protein (MBP) and RIP expression after completion of the differentiation timeline (Figure 4G). Also, supporting the initial premise that early stages of the differentiation may affect the long-term maturation of OPCs, we observed at least 2-fold more O4+ cells differentiated with condition 6 at day 95 than with the other six conditions tested in the absence of cell selection (Figure 4H). Moreover, at day 95, there were comparatively fewer TUJ1+ (βIII-tubulin) neurons and GFAP+ (glial fibrillary acidic protein) astrocytes in the culture (Figure 4I), which often are present in oligodendrocyte differentiating populations (Douvaras et al., 2014, Wang et al., 2013).
Together, these results demonstrate the ability of the 3D system to generate not only early OPCs but also late-stage OPCs and fully differentiated oligodendrocytes, which offer promise for disease modeling and drug discovery studies.
Voltage Imaging Analysis of O4+ Cells Differentiated in 3D Reveals Spiking and Non-spiking OPCs
An important developmental trait of maturing OPCs is their ability to fire action potentials upon stimulation, as both rodent (Káradóttir et al., 2008) and human OPCs (Livesey et al., 2016, Stacpoole et al., 2013) have been reported to possess excitable membranes. Furthermore, due to changes in channel expression upon OPC maturation (Sontheimer et al., 1989) and the progressive decrease in voltage-gated spiking activity of maturing hPSC-derived OPCs (Livesey et al., 2016), voltage imaging offers a means for evaluating OPC maturation since it can effectively serve as an early functional OPC marker. We thus investigated the electrical firing properties of cells generated in 3D and transferred onto 2D on day 75 (to enable this analysis) as a measure of OPC physiological maturity. Using a recently described voltage-sensitive dye (Kulkarni et al., 2017), we optically measured the ability of 89-day-old cells to fire after excitation with a 1-ms pulse from a transwell stimulation electrode. Of the 15 O4+ cells analyzed, 12 showed spiking behavior upon stimulation (Figures 5A and 5B), consistent with prior work indicating that ∼75% of O4+ OPCs formed on 2D surfaces display spiking behavior (Stacpoole et al., 2013). Our results thus demonstrate that hPSC-derived O4+ OPCs generated in 3D possessed electrophysiological properties similar to those previously reported for OPCs (Livesey et al., 2016). Importantly this establishes that, like 2D systems, 3D culture can generate OPCs with spiking behavior.
Figure 5.

3D Differentiation Generates Firing and Non-firing OPCs
(A) Multicolor epifluorescence imaging of voltage-sensitive dye fluorescence localized to the cell membrane of live-stained O4+ OPCs. Cells were differentiated for 89 days using condition 6 with early FGF treatment and passed onto 2D on day 75 for imaging. Scale bars, 20 μm.
(B) Optical recording of membrane potential in firing (1 and 2) and non-firing OPCs (3 and 4) after field stimulation using a 1-ms pulse from a transwell stimulation electrode.
OPCs Differentiated in 3D for 50 Days Engraft, Migrate, and Mature in the CNS after Transplantation into NOD/SCID Mice
Finally, we evaluated whether OPCs generated in 3D were functional in vivo. After 50 days of differentiation, we harvested cells from the thermoresponsive 3D hydrogel for transplantation. In several prior studies, OPCs were purified using an anti-O4 antibody prior to implantation (Douvaras et al., 2014, Wang et al., 2013); however, the observed OPC derivation efficiency (∼80% SOX10+ OPCs; Figure 4D) led us to investigate transplanting cells in the absence of isolation. We implanted ∼150,000 cells into the corpus callosum of 30-day-old NOD/SCID mice via a unilateral stereotaxic injection (Figure 6A). Immunohistochemistry (IHC) analysis of forebrain sections 3 weeks after injection revealed HNA+ (human nuclear antigen) cells that expressed the OPC markers PDGFαR, NG2, OLIG2, and SOX10 along the injection track and within the corpus callosum (Figures 6B–6D). Four months after injection, cells were still present at the injection site but had also migrated extensively throughout the corpus callosum and cortex (Figure S6). Importantly, ∼75% of the HNA+ cells that remained at the injection site or migrated expressed the OPC-specific and oligodendrocyte-specific marker OLIG2 (Figure 6F), and relatively few of these cells expressed the astrocyte marker GFAP (Figures 6B and 6F). Finally, 6 months after injection, we found that >90% of HNA+ cells had moved away from the injection site and dispersed fully into the corpus callosum and cortex, which is a migratory signature of OPCs (Goldman and Kuypers, 2015; Figure 6E).
Figure 6.

OPCs Generated in 3D Engraft, Migrate, and Mature In Vivo
(A) Schematic illustration of the injection site in the corpus callosum of NOD/SCID mice. H9 cells were differentiated for 50 days in 3D using condition 6 with early FGF treatment and transplanted as cell-spheres into 30-day-old mice.
(B–D) Immunohistochemistry analysis for the expression of human nuclear antigen (HNA) with (B) OLIG2, (C) NG2, (D) SOX10, and PDGFR in brain tissue sections from NOD/SCID at 3 weeks after transplantation. White arrow indicates transplanted-OPC migration into the corpus callosum.
(E–I) IHC analysis of brain tissue sections from NOD/SCID at 4 and 6 months after transplantation. (E) Stitched image of a coronal section showing HNA+ cell migration into the corpus callosum and across the cortex, away from the injection site. The posterior forceps of the corpus callosum are indicated by the yellow dashed line. HNA and GFAP images, which were taken from the hemisphere where cells were implanted, are shown at a higher magnification. (G) Quantification of the HNA+ cells that survived implantation at 3 weeks, 4 months, and 6 months after transplantation, normalized to the number of cells injected (150,000 cells). Each dot represents the average number of cells estimated per animal (≥6 sections per animal, sampling the entire range where HNA+ cells were found, were analyzed). Mean and SD are shown. (F and H) IHC of HNA+ cells that co-express OLIG2, SOX10, and MBP. Orange arrows indicate HNA+/OLIG2+ cells, red arrow indicates an HNA+ cell, green arrow indicates one mouse OLIG2+ cell, and the white arrow indicates one HNA+/SOX10+/MBP+ cell. (I) Confocal z stacks of HNA+ cells that co-express MBP and SOX10.
Scale bars, 250 μm (E), 200 μm (B, left), 100 μm (F and H), 50 μm (B [right], C, and D), and 10 μm (I).
In addition, we measured transplanted cell prevalence over time. Specifically, HNA+ cells in the brain were counted 3 weeks, 4 months, and 6 months after injection. The numbers of HNA+ cells at both 4 and 6 months were approximately 6-fold higher than at 3 weeks, indicating that the OPCs had the capacity to proliferate in vivo (Figure 6G). Importantly, there were no signs of tissue overgrowth, since even after 6 months the number of HNA+ cells were smaller than the total number of implanted cells, and there was no cell migration into the contralateral hemisphere. We also identified a small percentage of HNA+ cells in the cortex that expressed both SOX10 and MBP (∼15%) (Figures 6H and 6I), suggesting that SOX10+ 50-day OPCs differentiated in 3D have the potential to mature into MBP+ myelin-producing cells in vivo. Collectively, these results demonstrate that OPCs differentiated in 3D biomaterials can engraft, migrate within the brain, and mature into MBP+ cells.
Discussion
OPCs are strong candidates for cell therapy (Lebkowski, 2011). This is particularly evident given their ability to rescue brain function through remyelination in a mouse model of congenital hypomyelination (Wang et al., 2013), promote functional recovery in a rat model of radiation-induced brain trauma (Piao et al., 2015), and yield encouraging initial clinical results for cervical SCI (Priest et al., 2015). Over the past decade, several methods have been established for differentiating human OPCs from hPSCs (Douvaras et al., 2014, Stacpoole et al., 2013). As a step toward their clinical manufacture and translation, the development of a scalable and chemically defined platform for producing OPC would be desirable. Here, we demonstrate that transplantation-quality OPCs can be differentiated from hPSCs using a fully defined and scalable 3D biomaterial system.
The NKX2.2-EGFP hESC reporter line described here allowed for optimization of early OPC differentiation. By measuring NKX2.2 expression in real time, we found that synchronous addition of SAG and RA, combined with dual-SMAD inhibition, was sufficient to promote OPC patterning in a PNIPAAm-PEG hydrogel, a robust result validated using three different hPSC lines. Interestingly, while most of the conditions that contained RA yielded similar levels of OLIG2+ and NKX2.2+ cells, our best method for early OPC differentiation in the 3D biomaterial later generated at least 2-fold more O4+ cells than the other conditions tested upon late OPC maturation. This suggests that precise dorsal and ventral commitment of early OPCs can have a profound effect on late-stage commitment.
Another factor that enabled rapid OPC generation was our use of OPC maturation medium earlier in the differentiation protocol. Because the relative decrease in OPC marker expression that was observed previously (Douvaras et al., 2014) was seen here after day 14 (Figure S3), we added OPC maturation medium earlier than in other reports (Douvaras et al., 2014, Keirstead et al., 2005, Nistor et al., 2005, Stacpoole et al., 2013). In addition, because MBP expression was observed as early as day 72 using our differentiation protocol (Figure S4) versus day 95 (Douvaras et al., 2014), or even day 140 (Stacpoole et al., 2013, Wang et al., 2013), 3D culture possibly offers the means to enhance and accelerate the generation of oligodendrocytes. OPC differentiation efficiencies approaching ∼90% could obviate the need for cell-purification strategies before the in vitro use of hPSC-derived oligodendrocytes (Najm et al., 2015). Future work may thus explore additional optimization to further enhance maturation efficiency in 3D culture, such as the use of patterning factors that have been suggested to promote efficient oligodendrocyte maturation (Figure S5) (Barratt et al., 2016, Lourenço et al., 2016, Stacpoole et al., 2013).
We showed that O4+ cells generated in our 3D system exhibited previously reported hallmarks of spiking and non-spiking OPCs (Káradóttir et al., 2008). For instance, previous studies demonstrated that ∼75% of O4+ OPCs differentiated from hESCs in 2D fired action potentials (Stacpoole et al., 2013). Our results indicate that ∼80% of 3D-derived O4+ cells responded to induced depolarization, which establishes that, like 2D systems, 3D culture can generate OPCs that exhibit spiking behavior and have the potential to undergo further maturation. Future work will focus on establishing a more detailed understanding of the electrophysiological properties of these OPCs to more accurately classify and direct their differentiation for therapeutic applications.
Finally, using a NOD/SCID mouse model, we demonstrated that OPC spheres generated in the PNIPAAm-PEG hydrogel could survive, migrate, and mature into MBP+ oligodendrocytes after transplantation. This differentiation process yielded a high proportion of OPCs that enabled us to assess engraftment in the absence of cell enrichment, which is a laborious and time-consuming process that can potentially compromise cell viability and health. We observed robust proliferation and migration with no cell overgrowth 4 and 6 months after implantation, indicating that this approach could potentially be harnessed to safely implant hPSC-derived cells. The progressive migration of HNA+ cells that we observed also suggests that 3D-generated OPCs recreated important developmental hallmarks, which can be instrumental to cell therapy (Franklin and Gallo, 2014). Future studies evaluating the efficacy of these OPCs in disease models will shed further light on their potential to rescue nervous system function.
Given the ability of cell therapy to treat demyelinating diseases (Ben-Hur and Goldman, 2008) and the fact that hESC-based cell therapies for SCI are now under development (Lebkowski et al., 2017, Priest et al., 2015), scalable and fully defined OPC production systems have the potential to accelerate their clinical development. Using our biomaterial system, we generated ∼3.5-fold more early OPCs per hPSC seeded for differentiation than using 2D, and we reduced the time needed to form these cells by ∼30% compared with current state-of-the-art methods (Douvaras et al., 2014).
In conclusion, we combined the benefits afforded by scalable 3D culture with optimization of conditions using an hESC reporter line to yield a rapid, simple, and efficient approach for generating transplantation-quality OPCs from hPSCs.
Experimental Procedures
hPSC Cell Culture
Human WIBR3 (Lengner et al., 2010) (NIH Stem Cell Registry #0079), H9 ESCs (NIH Stem Cell Registry #0062), and TCTF-8FLVY6C2 iPSCs (a gift from Dr. Song Li) were cultured as previously described (Lei and Schaffer, 2013). In brief, after Accutase (STEMCELL Technologies) dissociation, single cells were seeded in the presence of 10 μM ROCK inhibitor, Y-27632 (Selleckchem), and E8 medium (Life Technologies) in PNIPAAm-PEG hydrogel (CosmoBio) and expanded for 4–5 days before differentiation.
OPC Differentiations
Following expansion, hPSCs were cultured in early OPC differentiation medium as described in Figure 2A and fed daily with neural induction medium. All media compositions and factor concentrations are provided in Table S2. In brief, cells were first patterned with the dual-SMAD inhibitors LDN193189 and SB431542, and then ventralized using SHH or SAG. In some conditions, cells were caudalized using RA. On day 11 of the differentiation, cell aggregates were split at a 1:3 ratio, broken into smaller-size aggregates by gentle pipetting (up and down, 10–15 times), re-encapsulated in the thermoresponsive gel, and fed with OPC proliferation medium. FGF-2 (10 ng/mL) (Peprotech) was then added to the OPC proliferation medium, as described in Figure 4A (added daily from day 14 until day 18, or from day 20 until day 24 of the differentiation). After FGF treatment, cells were fed every 2–3 days with OPC maturation medium, which included 20 μg/mL L-ascorbic acid (Sigma) from day 75 until day 95. See Table S2 for a detailed description of the differentiation conditions.
Transplantation into NOD/SCID Mice
All stem cell procedures and procedures in animals were performed following NIH Guidelines for Animal Care and Use and were approved by the UC Berkeley Animal Care and Use Committee, the Committee for Laboratory and Environmental Biosafety, and the Stem Cell Research Oversight committee. OPCs differentiated for 50 days were harvested as spheres from the 3D gel and resuspended in OPC maturation medium at a density of 50,000 cells/μL. Then 3 μL (∼150,000 cells) were injected into the corpus callosum of 30-day-old NOD/SCID mice (The Jackson Laboratory) at the stereotaxic coordinates AP, +1.2; ML, −1.2; DV, −2.0 using a 10-μL syringe with a 22s Gauge Point Style 4 needle with a 30° angle (Hamilton). Animals were euthanized at 3 or 16 weeks after surgery by transcardiac perfusion with 4% paraformaldehyde. Brains were processed and sectioned as previously described (Ashton et al., 2012).
Statistics
Data are presented as the mean of three or more independent experiments unless stated otherwise. Error was calculated as the SD of the mean. Statistical significance was calculated using the Mann-Whitney test or an (unpaired) one-tailed Student's t test using GraphPad Prism, as indicated in the figure legends.
Author Contributions
G.M.C.R., T.G., and D.V.S. designed the study; G.M.C.R. performed the differentiations; G.M.C.R., T.G., D.H., and D.V.S. designed and generated the hESC reporter line; F.K.L. performed the Southern blot; J.W. assisted with cell culture; R.U.K. and E.W.M. performed live-cell imaging and supplied reagents; M.M.A. and A.T.R. assisted with animal studies; G.M.C.R., T.G., M.M.D., J.M.S.C., and D.V.S. wrote the paper.
Acknowledgments
We thank Claudia Cattoglio for insightful discussions, Tina Wagner for helping with electroporations, and Gokul Nathan Ramadoss for helping with IHC analysis. This work was supported by the California Institute for Regenerative Medicine grants RT3-07800 and DISC2-08982 and a kind gift from Mr. Dennis Chan. G.M.C.R. was supported by the Fundação para a Ciência e a Tecnologia (FCT) Portugal (SFRH/BD/89374/2012). T.G. was supported by a Ruth L. Kirschstein National Research Service Award (F32GM113446). M.M.A. was supported in part by CIRM Training Grant TG2-01164, R.U.K. was supported in part by an NIH Training Grant (GMT32GM066698), and E.W.M. was supported by UC Berkeley Hellman Fellows Fund and the NIH (R00NS078561). D.V.S., G.M.C.R., and M.M.A. are inventors on patent applications related to biomaterials for stem cell culture.
Published: May 25, 2017
Footnotes
Supplemental Information includes Supplemental Experimental Procedures, six figures, and four tables and can be found with this article online at http://dx.doi.org/10.1016/j.stemcr.2017.04.027.
Supplemental Information
References
- Adil M.M., Rodrigues G.M.C., Kulkarni R.U., Rao A.T., Chernavsky N.E., Miller E.W., Schaffer D.V. Efficient generation of hPSC-derived midbrain dopaminergic neurons in a fully defined, scalable, 3D biomaterial platform. Sci. Rep. 2017;7:40573. doi: 10.1038/srep40573. [DOI] [PMC free article] [PubMed] [Google Scholar]
- Alper J. Geron gets green light for human trial of ES cell-derived product. J. Biotechnol. 2009;27:213–214. doi: 10.1038/nbt0309-213a. [DOI] [PubMed] [Google Scholar]
- Archer D.R., Cuddon P.A., Lipsitz D., Duncan I.D. Myelination of the canine central nervous system by glial cell transplantation: a model for repair of human myelin disease. Nat. Med. 1997;3:54–59. doi: 10.1038/nm0197-54. [DOI] [PubMed] [Google Scholar]
- Ashton R.S., Conway A., Pangarkar C., Bergen J., Lim K.-I., Shah P., Bissell M., Schaffer D.V. Astrocytes regulate adult hippocampal neurogenesis through ephrin-B signaling. Nat. Neurosci. 2012;15:1399–1406. doi: 10.1038/nn.3212. [DOI] [PMC free article] [PubMed] [Google Scholar]
- Barratt H.E., Budnick H.C., Parra R., Lolley R.J., Perry C.N., Nesic O. Tamoxifen promotes differentiation of oligodendrocyte progenitors in vitro. Neuroscience. 2016;5:146–156. doi: 10.1016/j.neuroscience.2016.01.026. [DOI] [PubMed] [Google Scholar]
- Ben-Hur T., Goldman S.A. Prospects of cell therapy for disorders of myelin. Ann. N. Y. Acad. Sci. 2008;1142:218–249. doi: 10.1196/annals.1444.014. [DOI] [PubMed] [Google Scholar]
- Berger M.F., Badis G., Gehrke A.R., Talukder S., Philippakis A.A., Peña-Castillo L., Alleyne T.M., Mnaimneh S., Botvinnik O.B., Chan E.T. Variation in homeodomain DNA binding revealed by high-resolution analysis of sequence preferences. Cell. 2008;133:1266–1276. doi: 10.1016/j.cell.2008.05.024. [DOI] [PMC free article] [PubMed] [Google Scholar]
- Briscoe J., Ericson J. The specification of neuronal identity by graded Sonic Hedgehog signalling. Semin. Cell Dev. Biol. 1999;10:353–362. doi: 10.1006/scdb.1999.0295. [DOI] [PubMed] [Google Scholar]
- Chambers S.M., Fasano C.A., Papapetrou E.P., Tomishima M., Sadelain M., Studer L. Highly efficient neural conversion of human ES and iPS cells by dual inhibition of SMAD signaling. Nat. Biotechnol. 2009;27:275–280. doi: 10.1038/nbt.1529. [DOI] [PMC free article] [PubMed] [Google Scholar]
- Chen J.K., Taipale J., Young K.E., Maiti T., Beachy P.A. Small molecule modulation of Smoothened activity. Proc. Natl. Acad. Sci. USA. 2002;99:14071–14076. doi: 10.1073/pnas.182542899. [DOI] [PMC free article] [PubMed] [Google Scholar]
- Czepiel M., Boddeke E., Copray S. Human oligodendrocytes in remyelination research. Glia. 2015;63:513–530. doi: 10.1002/glia.22769. [DOI] [PubMed] [Google Scholar]
- Diogo M.M., da Silva C.L., Cabral J.M.S. Separation technologies for stem cell bioprocessing. Biotechnol. Bioeng. 2012;109:2699–2709. doi: 10.1002/bit.24706. [DOI] [PubMed] [Google Scholar]
- Douvaras P., Fossati V. Generation and isolation of oligodendrocyte progenitor cells from human pluripotent stem cells. Nat. Protoc. 2015;10:1143–1154. doi: 10.1038/nprot.2015.075. [DOI] [PubMed] [Google Scholar]
- Douvaras P., Wang J., Zimmer M., Hanchuk S., O’Bara M.A., Sadiq S., Sim F.J., Goldman J., Fossati V. Efficient generation of myelinating oligodendrocytes from primary progressive multiple sclerosis patients by induced pluripotent stem cells. Stem Cell Rep. 2014;3:250–259. doi: 10.1016/j.stemcr.2014.06.012. [DOI] [PMC free article] [PubMed] [Google Scholar]
- Franklin R.J.M., Gallo V. The translational biology of remyelination: past, present, and future. Glia. 2014;62:1905–1915. doi: 10.1002/glia.22622. [DOI] [PubMed] [Google Scholar]
- Fu H., Qi Y., Tan M., Cai J., Takebayashi H., Nakafuku M. Dual origin of spinal oligodendrocyte progenitors and evidence for the cooperative role of Olig2 and Nkx2.2 in the control of oligodendrocyte differentiation. Development. 2002;129:681–693. doi: 10.1242/dev.129.3.681. [DOI] [PubMed] [Google Scholar]
- Goldman S.A., Kuypers N.J. How to make an oligodendrocyte. Development. 2015;142:3983–3995. doi: 10.1242/dev.126409. [DOI] [PMC free article] [PubMed] [Google Scholar]
- Griffiths I. Axonal swellings and degeneration in mice lacking the major proteolipid of myelin. Science. 1998;280:1610–1613. doi: 10.1126/science.280.5369.1610. [DOI] [PubMed] [Google Scholar]
- Helman G., Van Haren K., Escolar M.L., Vanderver A. Emerging treatments for pediatric leukodystrophies. Pediatr. Clin. North Am. 2015;62:649–666. doi: 10.1016/j.pcl.2015.03.006. [DOI] [PMC free article] [PubMed] [Google Scholar]
- Hu B.-Y., Du Z.-W., Li X.-J., Ayala M., Zhang S.-C. Human oligodendrocytes from embryonic stem cells: conserved SHH signaling networks and divergent FGF effects. Development. 2009;136:1443–1452. doi: 10.1242/dev.029447. [DOI] [PMC free article] [PubMed] [Google Scholar]
- Kang S.-M., Cho M.S., Seo H., Yoon C.J., Oh S.K., Choi Y.M., Kim D.-W. Efficient induction of oligodendrocytes from human embryonic stem cells. Stem Cells. 2007;25:419–424. doi: 10.1634/stemcells.2005-0482. [DOI] [PubMed] [Google Scholar]
- Káradóttir R., Hamilton N.B., Bakiri Y., Attwell D. Spiking and nonspiking classes of oligodendrocyte precursor glia in CNS white matter. Nat. Neurosci. 2008;11:450–456. doi: 10.1038/nn2060. [DOI] [PMC free article] [PubMed] [Google Scholar]
- Kassmann C.M., Lappe-Siefke C., Baes M., Brügger B., Mildner A., Werner H.B., Natt O., Michaelis T., Prinz M., Frahm J. Axonal loss and neuroinflammation caused by peroxisome-deficient oligodendrocytes. Nat. Genet. 2007;39:969–976. doi: 10.1038/ng2070. [DOI] [PubMed] [Google Scholar]
- Keirstead H.S., Nistor G., Bernal G., Totoiu M., Cloutier F., Sharp K., Steward O. Human embryonic stem cell-derived oligodendrocyte progenitor cell transplants remyelinate and restore locomotion after spinal cord injury. J. Neurosci. 2005;25:4694–4705. doi: 10.1523/JNEUROSCI.0311-05.2005. [DOI] [PMC free article] [PubMed] [Google Scholar]
- Kerr C.L., Letzen B.S., Hill C.M., Agrawal G., Thakor N.V., Sterneckert J.L., Gearhart J.D., All A.H. Efficient differentiation of human embryonic stem cells into oligodendrocyte progenitors for application in a rat contusion model of spinal cord injury. Int. J. Neurosci. 2010;120:305–313. doi: 10.3109/00207450903585290. [DOI] [PubMed] [Google Scholar]
- Kraehenbuehl T.P., Langer R., Ferreira L.S. Three-dimensional biomaterials for the study of human pluripotent stem cells. Nat. Methods. 2011;8:731–736. doi: 10.1038/nmeth.1671. [DOI] [PubMed] [Google Scholar]
- Kulkarni R.U., Yin H., Pourmandi N., James F., Adil M.M., Schaffer D.V., Wang Y., Miller E.W. A rationally-designed, general strategy for membrane orientation of photoinduced electron transfer-based voltage-sensitive dyes. ACS Chem. Biol. 2017;12:407. doi: 10.1021/acschembio.6b00981. [DOI] [PMC free article] [PubMed] [Google Scholar]
- Lappe-Siefke C., Goebbels S., Gravel M., Nicksch E., Lee J., Braun P.E., Griffiths I.R., Nave K.-A. Disruption of Cnp1 uncouples oligodendroglial functions in axonal support and myelination. Nat. Genet. 2003;33:366–374. doi: 10.1038/ng1095. [DOI] [PubMed] [Google Scholar]
- Lebkowski J. GRNOPC1: the world’s first embryonic stem cell-derived therapy. Regen. Med. 2011;6:11–13. doi: 10.2217/rme.11.77. [DOI] [PubMed] [Google Scholar]
- Lebkowski, J.S., Fessler, R., Leslie, D., Steinberg, G., Kurpad, S., Liu, C., and Wirth, E. (2017). Safety and Efficacy of Human Embryonic Stem Cell Derived Oligodendrocyte Progenitor Cells (AST-OPC1) in Patients with Subacute Cervical Spinal Cord Injury. In ASGCT 20th Annual Meeting, (Washington, DC), p. 330.
- Lei Y., Schaffer D.V. A fully defined and scalable 3D culture system for human pluripotent stem cell expansion and differentiation. Proc. Natl. Acad. Sci. USA. 2013;110:E5039–E5048. doi: 10.1073/pnas.1309408110. [DOI] [PMC free article] [PubMed] [Google Scholar]
- Lengner C.J., Gimelbrant A.A., Erwin J.A., Cheng A.W., Guenther M.G., Welstead G.G., Alagappan R., Frampton G.M., Xu P., Muffat J. Derivation of pre-X inactivation human embryonic stem cells under physiological oxygen concentrations. Cell. 2010;141:872–883. doi: 10.1016/j.cell.2010.04.010. [DOI] [PubMed] [Google Scholar]
- Livesey M.R., Magnani D., Clearly E.M., Vasisthe N.A., James O.T., Selvaraj B.T., Burr K., Story D., Shaw C.E., Kind P.C. Maturation and electrophysiological properties of human pluripotent stem cell-derived oligodendrocytes. Stem Cells. 2016;34:1040–1053. doi: 10.1002/stem.2273. [DOI] [PMC free article] [PubMed] [Google Scholar]
- Lourenço T., Paes de Faria J., Bippes C.A., Maia J., Lopes-da-Silva J.A., Relvas J.B., Grãos M. Modulation of oligodendrocyte differentiation and maturation by combined biochemical and mechanical cues. Sci. Rep. 2016;6:21563. doi: 10.1038/srep21563. [DOI] [PMC free article] [PubMed] [Google Scholar]
- Lu Q.R., Sun T., Zhu Z., Ma N., Garcia M., Stiles C.D., Rowitch D.H. Common developmental requirement for Olig function indicates a motor neuron/oligodendrocyte connection. Cell. 2002;109:75–86. doi: 10.1016/s0092-8674(02)00678-5. [DOI] [PubMed] [Google Scholar]
- Masahira N., Takebayashi H., Ono K., Watanabe K., Ding L., Furusho M., Ogawa Y., Nabeshima Y., Alvarez-Buylla A., Shimizu K. Olig2-positive progenitors in the embryonic spinal cord give rise not only to motoneurons and oligodendrocytes, but also to a subset of astrocytes and ependymal cells. Dev. Biol. 2006;293:358–369. doi: 10.1016/j.ydbio.2006.02.029. [DOI] [PubMed] [Google Scholar]
- Maury Y., Côme J., Piskorowski R.A., Salah-Mohellibi N., Chevaleyre V., Peschanski M., Martinat C., Nedelec S. Combinatorial analysis of developmental cues efficiently converts human pluripotent stem cells into multiple neuronal subtypes. Nat. Biotechnol. 2015;33:89–96. doi: 10.1038/nbt.3049. [DOI] [PubMed] [Google Scholar]
- Metsalu T., Vilo J. ClustVis: a web tool for visualizing clustering of multivariate data using principal component analysis and heatmap. Nucleic Acids Res. 2015;43:W566–W570. doi: 10.1093/nar/gkv468. [DOI] [PMC free article] [PubMed] [Google Scholar]
- Najm F.J., Madhavan M., Zaremba A., Shick E., Karl R.T., Factor D.C., Miller T.E., Nevin Z.S., Kantor C., Sargent A. Drug-based modulation of endogenous stem cells promotes functional remyelination in vivo. Nature. 2015;522:216–220. doi: 10.1038/nature14335. [DOI] [PMC free article] [PubMed] [Google Scholar]
- Nistor G.I., Totoiu M.O., Haque N., Carpenter M.K., Keirstead H.S. Human embryonic stem cells differentiate into oligodendrocytes in high purity and myelinate after spinal cord transplantation. Glia. 2005;49:385–396. doi: 10.1002/glia.20127. [DOI] [PubMed] [Google Scholar]
- Okada Y., Shimazaki T., Sobue G., Okano H. Retinoic-acid-concentration-dependent acquisition of neural cell identity during in vitro differentiation of mouse embryonic stem cells. Dev. Biol. 2004;275:124–142. doi: 10.1016/j.ydbio.2004.07.038. [DOI] [PubMed] [Google Scholar]
- Park H.-C., Mehta A., Richardson J.S., Appel B. olig2 is required for zebrafish primary motor neuron and oligodendrocyte development. Dev. Biol. 2002;248:356–368. doi: 10.1006/dbio.2002.0738. [DOI] [PubMed] [Google Scholar]
- Piao J., Major T., Auyeung G., Policarpio E., Menon J., Droms L., Gutin P., Uryu K., Tchieu J., Soulet D. Human embryonic stem cell-derived oligodendrocyte progenitors remyelinate the brain and rescue behavioral deficits following radiation. Cell Stem Cell. 2015;16:198–210. doi: 10.1016/j.stem.2015.01.004. [DOI] [PMC free article] [PubMed] [Google Scholar]
- Priest C.A., Manley N.C., Denham J., Wirth E.D., 3rd, Lebkowski J.S. Preclinical safety of human embryonic stem cell-derived oligodendrocyte progenitors supporting clinical trials in spinal cord injury. Regen. Med. 2015;10:939–958. doi: 10.2217/rme.15.57. [DOI] [PubMed] [Google Scholar]
- Qi Y., Cai J., Wu Y., Wu R., Lee J., Fu H., Rao M., Sussel L. Control of oligodendrocyte differentiation by the Nkx2.2 homeodomain transcription factor. Development. 2001;128:2723–2733. doi: 10.1242/dev.128.14.2723. [DOI] [PubMed] [Google Scholar]
- Serra M., Brito C., Correia C., Alves P.M. Process engineering of human pluripotent stem cells for clinical application. Trends Biotechnol. 2012;30:350–359. doi: 10.1016/j.tibtech.2012.03.003. [DOI] [PubMed] [Google Scholar]
- Singh A., Tetreault L., Kalsi-Ryan S., Nouri A., Fehlings M.G. Global prevalence and incidence of traumatic spinal cord injury. Clin. Epidemiol. 2014;6:309–331. doi: 10.2147/CLEP.S68889. [DOI] [PMC free article] [PubMed] [Google Scholar]
- Sontheimer H., Trotter J., Schachner M., Kettenmann H. Channel expression correlates with differentiation stage during the development of oligodendrocytes from their precursor ceils in culture. Neuron. 1989;2:1135–1145. doi: 10.1016/0896-6273(89)90180-3. [DOI] [PubMed] [Google Scholar]
- Stacpoole S.R.L., Spitzer S., Bilican B., Compston A., Karadottir R., Chandran S., Franklin R.J.M. High yields of oligodendrocyte lineage cells from human embryonic stem cells at physiological oxygen tensions for evaluation of translational biology. Stem Cell Rep. 2013;1:437–450. doi: 10.1016/j.stemcr.2013.09.006. [DOI] [PMC free article] [PubMed] [Google Scholar]
- Uchida N., Buck D.W., He D., Reitsma M.J., Masek M., Phan T.V., Tsukamoto A.S., Gage F.H., Weissman I.L. Direct isolation of human central nervous system stem cells. Proc. Natl. Acad. Sci. USA. 2000;97:14720–14725. doi: 10.1073/pnas.97.26.14720. [DOI] [PMC free article] [PubMed] [Google Scholar]
- Van der Valk J., Brunner D., De Smet K., Fex Svenningsen A., Honegger P., Knudsen L.E., Lindl T., Noraberg J., Price A., Scarino M.L. Optimization of chemically defined cell culture media—replacing fetal bovine serum in mammalian in vitro methods. Toxicol. In Vitro. 2010;24:1053–1063. doi: 10.1016/j.tiv.2010.03.016. [DOI] [PubMed] [Google Scholar]
- Wang S., Bates J., Li X., Schanz S., Chandler-Militello D., Levine C., Maherali N., Studer L., Hochedlinger K., Windrem M. Human iPSC-derived oligodendrocyte progenitor cells can myelinate and rescue a mouse model of congenital hypomyelination. Cell Stem Cell. 2013;12:252–264. doi: 10.1016/j.stem.2012.12.002. [DOI] [PMC free article] [PubMed] [Google Scholar]
- Windrem M.S., Nunes M.C., Rashbaum W.K., Schwartz T.H., Goodman R.A., McKhann G., Roy N.S., Goldman S.A. Fetal and adult human oligodendrocyte progenitor cell isolates myelinate the congenitally dysmyelinated brain. Nat. Med. 2004;10:93–97. doi: 10.1038/nm974. [DOI] [PubMed] [Google Scholar]
- Windrem M.S., Schanz S.J., Guo M., Tian G.-F., Washco V., Stanwood N., Rasband M., Roy N.S., Nedergaard M., Havton L.A. Neonatal chimerization with human glial progenitor cells can both remyelinate and rescue the otherwise lethally hypomyelinated shiverer mouse. Cell Stem Cell. 2008;2:553–565. doi: 10.1016/j.stem.2008.03.020. [DOI] [PMC free article] [PubMed] [Google Scholar]
- Wu S., Johansson J., Damdimopoulou P., Shahsavani M., Falk A., Hovatta O., Rising A. Spider silk for xeno-free long-term self-renewal and differentiation of human pluripotent stem cells. Biomaterials. 2014;35:8496–8502. doi: 10.1016/j.biomaterials.2014.06.039. [DOI] [PubMed] [Google Scholar]
- Zhou Q., Choi G., Anderson D.J. The bHLH transcription factor Olig2 promotes oligodendrocyte differentiation in collaboration with Nkx2.2. Neuron. 2001;31:791–807. doi: 10.1016/s0896-6273(01)00414-7. [DOI] [PubMed] [Google Scholar]
- Zweigerdt R., Olmer R., Singh H., Haverich A., Martin U. Scalable expansion of human pluripotent stem cells in suspension culture. Nat. Protoc. 2011;6:689–700. doi: 10.1038/nprot.2011.318. [DOI] [PubMed] [Google Scholar]
Associated Data
This section collects any data citations, data availability statements, or supplementary materials included in this article.