

Abstract
We present a cancer nanomedicine based on acidic pH targeted gold nanorods designed for multispectral optoacoustic tomography (MSOT). We have designed gold nanorods coated with mesoporous silica and subsequently capped with chitosan (CMGs). We have conjugated pH-sensitive variant 7 pHLIP peptide to the CMGs (V7-CMG) to provide targeting specificity to the acidic tumor microenvironment. In vitro, treatment of S2VP10 and MiaPaca2 cells with V7-CMG containing gemcitabine resulted in significantly greater cytotoxicity with 97% and 96.5% cell death, respectively than gemcitabine alone 60% and 76% death at pH 6.5 (S2VP10 pH 6.5 p=0.009; MiaPaca2 pH 6.5 p=0.0197). In vivo, the V7-CMGs provided the contrast and targeting specificity necessary for MSOT of retroperitoneal orthotopic pancreatic tumors. In the in vivo S2VP10 model, the V7-CMG particle preferentially accumulated within the tumor at 17.1 MSOT a.u. signal compared with 0.7 MSOT a.u. in untargeted CMG control in tumor (P = 0.0002). Similarly, V7-CMG signal was 9.34 MSOT a.u. in the S2013 model compared with untargeted CMG signal at 0.15 MSOT a.u. (P = 0.0004). The pH-sensitivity of the targeting pHLIP peptide and chitosan coating makes the particles suitable for simultaneous in vivo tumor imaging and drug delivery.
Keywords: active targeted nanoparticles, acidic pH, chitosan, mesoporous silica, gold nanorod, pHLIP, multispectral optoacoustic tomography, MSOT, pancreatic cancer
Graphical Abstract
Introduction
The use of nanoparticles for tumor imaging and targeted drug delivery has been an intense field of research in recent years, with the use of nanoparticles containing fluorescent dyes, gold, or silver, employed as imaging and drug delivery vehicles.1–2 Due to the toxic side-effects of chemotherapy agents, improving local delivery of drug is essential in order to improve survival and decrease chemotherapy related morbidity. Despite extensive evaluation of novel nanoconstructs and receptor-targeted nanoparticles to improve detection and drug delivery to tumors, delivery of nanoparticles in clinically relevant models with high tumor specificity and low off-target accumulation remains a challenge. However, it is advantageous that the particles be detectable with modern imaging modalities for both development of new therapies and clinical monitoring of tumor response. Such methods may be particularly suitable for the detection and treatment of pancreatic cancer, which has only seen modest improvements over the last four decades.3–6
The challenge in the detection and treatment of pancreatic cancer is multifactorial and relies on overcoming hypovascularity, cellular efflux mechanisms, ion trapping in the extracellular tumor environment leading to insufficient uptake of drugs or imaging contrast agents, and its retroperitoneal location.7–10 Surgical resection is essential for long-term survival, but pancreatic adenocarcinoma is frequently unamenable to surgical resection due to the advanced stage of disease at presentation.8–9 While tumors are characterized by leaky vasculature in comparison to non-malignant tissue to allow for increased metabolism and uptake of macromolecules and nutrients, known as the Enhanced Permeability and Retention (EPR) effect11–13, the EPR effect is often insufficient to drastically improve tumor specificity of nanoparticle binding alone. To overcome this obstacle, actively targeted nanoparticles will allow for more rapid delivery of drug or dye cargo to the tumor prior to clearance from the circulation by macrophages and the reticuloendothelial system or the development of a serum protein corona which inhibits nanoparticle efficacy.14–15 The development of nanodelivery vehicles which specifically target tumor that are detectable using imaging systems could improve patient outcome.
Optoacoustic (photoacoustic) imaging is an emerging imaging modality that provides high resolution molecular information at clinically relevant depths.16 Multispectral Optoacoustic Tomography (MSOT) takes advantage of the optoacoustic effect, a process whereby particles excited by pulsed NIR light emit an acoustic signal detectable by ultrasound. Subsequent to a pulsed NIR light, a thermoelastic expansion produces acoustic signals that are detected via an ultrasound transducer. Endogenous and exogenous particles absorb light energy and emit sound waves best at different wavelengths of light energy; integrating the acoustic signals that result from a spectrum of excitation wavelengths yields a high-resolution ultrasound image.17–19 Differential levels of endogenous contrast allow hemoglobin, vascular definition and organ location to be detected and integrated into a single image containing both the contrast agent along with a variety of biological information such as tissue oxygenation and inflammation17, 25.
Gold nanoparticles have been used extensively as contrast agents for photoacoustic imaging.20–22 They are biologically inert, can be coated with organic polymers so as to be loaded with drug or fluorescent dye, and can be conjugated with targeting moieties such as peptides.20, 23–24 Gold nanorods (GNRs) are ideal for optoacoustic (OA) imaging contrast agents as they can display strong longitudinal surface plasmon resonance peaks in the near-infrared (NIR) absorption range of 700–900 nm. This allows them to be imaged with minimal photoabsorption by body tissue while creating a high resolution three dimensional image unattainable with traditional two dimensional planar imaging techniques.16, 21, 24–26 Because gold nanorods change shape and become more spherical upon absorption of OA laser fluence during in vivo imaging, encapsulation of the particle with mesoporous silica (MS) protects the GNRs from thermal deformation, enhances GNR thermal stability, and increases OA signal.27–29 MS coated gold nanorods (MS-GNRs) have the potential to be used as theranostic particles for tumor imaging and drug delivery.30 However, the porous nature of MS is also problematic if MS-GNRs are to be used for drug delivery due to the leakage of toxic chemotherapeutics prior to delivery at the target site. This can be overcome by the addition of stimuli responsive “gatekeeper” molecules to the MS particles.
The use of a pH-sensitive gatekeeper is particularly attractive for tumor imaging and drug delivery. The extracellular environment of tumors is significantly more acidic than physiologic pH 7.4 found in healthy tissues, often in the range of pH 6.5–6.9.10, 31–32 Studies have attempted to exploit this characteristic of tumors by creating pH-sensitive drug delivery and imaging modalities. Among the most promising pH-sensitive targeting agents are pH (low) insertion peptides (pHLIP) and chitosan coated nanoparticles.33–38
pH low insertion peptides (pHLIPs) are a group of well characterized water soluble, semi-hydrophobic peptides derived from the bacteriorhodopsin C helix. While the peptide is at equilibrium between water soluble and membrane associated species at neutral pH, protonation of negatively charged residues within the helical segment of the peptide increases peptide hydrophobicity resulting in a conformational change upon stimulation with acidic pH and formation of an alpha-helix that inserts across the membrane.33, 35–36 Numerous variants of the pHLIP have been synthesized, with multiple studies demonstrating the promising potential of pHLIPs for pH-sensitive in vivo targeting and delivery of gold nanoparticles and NIR dyes for tumor imaging.33, 35–36, 39–40 Likewise, chitosan coated nanoparticles have been shown to be pH-sensitive gatekeepers of drug, releasing drug at acidic pH.41–43 Our group previously demonstrated that a pHLIP targeted NIR-dye probe effectively targets the low pH environment of orthotopic pancreatic tumors in vivo for tumor imaging with MSOT.40
Building upon these results, we investigated V7 pHLIP targeting of the acidic tumor milieu as a mechanism to actively target a chitosan coated mesoporous silica gold nanorods (CMGs) to improve tumor specificity and reduce off-target uptake by filtering organs. We have synthesized pH-sensitive CMGs conjugated to the variant 7 (V7) pHLIP (V7-CMG) for theranostic OA tumor imaging and targeted drug delivery. With the addition of V7 to the CMGs, greater targeting specificity is conferred to the particle in vitro and in vivo. Our study is unique in the usage of acidic pH-targeted, chitosan capped, mesoporous silica, gold nanorods which have been synthesized as contrast agents for OA imaging. The use of an orthotopic model enhances the translational ability of these particles compared to subcutaneous tumor models which have artificially high vascularity, decreased metastatic potential, and do not adequately mimic the tumor environment.44–45 These particles are unique in their ability to encapsulate either a drug or fluorescent probe cargo and deliver it directly to a tumor, while shielding the cargo from the systemic exposure. To further demonstrate the clinical applicability of our particles, we have loaded our nanoparticles with the pyrimidine analog gemcitabine, a chemotherapeutic commonly used for treatment of pancreatic carcinoma. We tested the ability of our particles to selectively release drug in an acidic environment and performed cell-viability assays. Our results demonstrate V7-CMGs to be an efficacious modality for targeting acidosis in the tumor environment in vivo with 3-dimensional MSOT.
Experimental Methods
Materials
Cetyltrimethylammonium bromide (CTAB) (≥99% for molecular biology), Gold(III) chloride trihydrate (HAuCl4), sodium borohydride, sodium borohydride (NaBH4), silver nitrate (AgNO3), L-Ascorbic Acid (L-AA), tetraethyl orthosilicate (TEOS), (3-aminopropyl) triethoxysilane (APTES),(3- gycidyloxypropyltrimethoxysilane (GPTMS), dimethylformide (DMF), N-succinimidyl 4-(maleimidomethyl) cyclohexanecarboxylate (SMCC), indocyanine green (ICG), IR-780 percholate dye, dye content > 99% (IR-780), methanol (99.8%), and ethanol (99.5%) were purchased from Sigma-Aldrich (St. Louis, MO, USA) and used as received. Bovine serum albumin lyophilized powder, ≥96% (BSA) was purchased from Sigma-Aldrich (St. Louis, MO, USA) and dissolved in autoclaved PBS. Dulbecco’s Modified Eagle’s Medium (DMEM), L-glutamine, and RPMI medium were purchased from Life Technologies (New York, NY, USA). Fetal bovine serum (FBS) was purchased from Atlanta Biologicals (Lawrenceville, GA, USA). V7 pHLIP peptide sequence ACEEQNPWARYLEWLFPTETLLLEL was purchased from C S Bio Company (Menlo Park, CA, USA).
Preparation of pH specific PBS and culture media
pH specific cell culture media comprised of RPMI-1640 were constructed in sterilized phosphate buffer without adding sodium bicarbonate. Phosphate buffer (25 mM) at desired pH (7.4, 6.8 and 6.5) for DMEM and cell washing was prepared by mixing the required amount of sodium phosphate monobasic and sodium phosphate dibasic (Sigma-Aldrich, St. Louis, MO, USA) in distilled water. Afterwards, phosphate buffer was sterilized by autoclave. 13.6 gm of DMEM powder was dissolved in the sterilized phosphate buffer (1 L, 25 mM) at the desired pH. Afterwards, DMEM media solutions were filtered through the sterilized Whatman qualitative filter paper, grade-1 (Sigma-Aldrich, St. Louis, MO, USA) and DMEM solution was mixed with 10% fetal bovine serum and 1% L-glutamine. pH of DMEM media solution with supplements was checked by pH meter (Denver Instrument Ultrabasic, Bohemia, NY, USA) and if required pH was maintained by adding sterilized sodium hydroxide (1 M) or hydrochloric acid (1 M).
Preparation of Gold Nanorods (CTAB-GNRs)
Gold nanorods were synthesized via a seed-mediated, CTAB surfactant directed aqueous solution adapted from the methods described by Wu and Xu 67.
Synthesis of Seed Solution
2.5 mL of 0.2 M CTAB solution was mixed with 2.5 mL of 0.6 mM HAuCl4 by magnetic stirring. 0.3 mL of ice-cold 0.01 M NaBH4 was added to the solution, which formed a yellowish solution. The solution remained stirring at room temperature for 15 minutes until use.
Synthesis of Growth Solution
1.5 mL of 0.05 M HAuCl4 and .225 mL of 0.05 M AgNO3 were added to 100 mL of 0.1 M CTAB solution at room temperature under magnetic stirring. 1.25 mL of 0.08 M L-AA was added drop-wise to the solution, which caused it to turn from brown to colorless. 0.20 mL of the seed solution was then added to the growth solution at room temperature, and the solution gradually changed purple over 5–10 m. The reaction was allowed to proceed for 12 h. The reaction was then centrifuged for 20 m at 12,000 RPM to remove the excess CTAB surfactant.
Preparation of Mesoporous Silica Gold Nanorods
Mesoporous silica coating with modification of the shell with amino groups was achieved by co-condensation. 0.10 mL of 0.1 M NaOH was added to the gold nanorods under magnetic stirring, serving as a catalyst. Subsequently, 30 μL of 20% TEOS in methanol together with 10 μL of 2% APTES in methanol was added to the stirring solution three times at 30 minute intervals. The reaction was allowed to proceed for 24 h. The MS-GNRs were collected by centrifugation at 5000 RPM for 30 minutes with five washes in half methanol (99%) and half ethanol (100%). The nanoparticles were dispersed in 5 mL Milli-Q water and stored at 4°C.
Preparation of Chitosan-Capped Mesoporous Silica Gold Nanorods (CMG)
2.0 g of chitosan was dissolved in 200 mL of 5% acetic acid in Millipore water (1% weight chitosan) under magnetic stirring at room temperature for 24 h. MS-GNRs were dispersed in 5 mL 100% ethanol and dispersed by ultrasonication for 3 m. The pH of the MS-GNR in ethanol solution was decreased to between 3.8 and 3.5 by the addition of acetic acid. 0.1 g of GPTMS was then injected into the MSN-GNR in ethanol under magnetic stirring and allowed to react for 3 h. 20 mL of the prepared chitosan solution was added to the mixture and allowed to mix at room temperature for 24 h. The CMGs were collected by centrifugation at 10,000 RPM, 15 m and washed in 70% ethanol 5X prior to storage at 4° C.
V7 Conjugation to CMG
29.1 mg of CMG was dissolved in 0.2 mL DMF and gently vortexed. 1.4 mg of V7 pHLIP sequence ACEEQNPWARYLEWLFPTETLLLEL (C S Bio, Menlo Park, CA,USA) in 0.2 mL PBS and 0.2 mL DMF and gently vortexed. 3.6 mg of SMCC (Sigma-Aldrich, St. Louis, MO, USA) was dissolved in 0.2 mL DMF and gently vortexed as well. The three solutions were combined in a 1.5 mL and set on a magnetic stirrer at room temperature for 24 h. An additional 0.2 mL PBS was added to the final solution, which results in final concentrations of 400 μM SMCC and 456 μM V7 peptide. The V7-CMGs were washed 5X in PBS and collected by centrifugation at 10,000 RPM for 10 m.
Zeta-potential measurements
Electrophoretic mobility (μE) of the samples was measured at 25° C with Zetasizer Nano-ZS (Malvern Instruments, Ltd., Malvern, United Kingdom). The zeta-potential of the samples was calculated from μE using the following Smoluchowski’s equation:
Where ζ is the zeta-potential, ε the permittivity of solvent, and η the viscosity of solvent.
Transmission electron microscopy (TEM) and Dynamic Light Scattering characterization of nanoparticles
The initial morphology of V7-CMG, CMG, MS-GNR, and CTAB-GNR was observed using transmission electron microscope (TEM; Tecnai-F20, FEI Co., Eindhoven, Netherlands). For this, 50 μl samples of each particle were dropped onto copper-mesh grids (Electron Microscopy Science, Hatfield, PA, USA). Then, they were dried at room temperature for 24 h prior to imaging. Dynamic light scattering (DLS) measurements were conducted to determine size distribution of the nanoparticles. We used a Malvern 4800 Autosizer (Malvern, United Kingdom) employing a 7132 digital correlator and hydrodynamic diameters (Dh) were calculated using the Stokes–Einstein relationship.
V7-CMG in vitro binding analysis
V7-CMGs, 110 μM were incubated with 7 mM indocyanine green (ICG) at pH 3.0 for 24 h, room temperature under magnetic stirring. The pH was raised to 8.0–9.0 with 1.0 M NaOH and the particles were incubated and allowed to equilibrate for an additional hour under magnetic stirring at room temperature. The ICG loaded particles were washed in PBS 3X and collected by centrifugation at 10,000 RPM, 10 minutes.
S2VP10 pancreatic adenocarcinoma cells, 106, were plated in 6 well plates in pH 7.4 DMEM + 10% FBS + 1% L-glutamine and allowed to attach overnight at 37° C, 5% CO2. The next day cells were switched to either pH 7.4 or pH 6.5 DMEM + 10% BSA +1% L-glutamine and rocked in an incubator at 37° C, without addition of CO2 (80% N2 and 20% O2) for 2 h. Cells were then treated with either 10 nM V7-CMG-ICG or 10 nM CMG-ICG and rocked in an incubator at 37° C, without addition of CO2 (80% N2 and 20% O2) for 2 h. The cells were washed 5X in PBS with the fifth wash lasting 15 minutes at 37° C, without addition of CO2 (80% N2 and 20% O2). The PBS from the third wash was replaced and cellular uptake of ICG was analyzed using the Odyssey Infrared Imaging System (LI-COR, Lincoln, NE, USA). Cells are treated in 0% CO2 to prevent generation of carbonic acid via reaction between phosphate buffered media and environmental CO2. Dosimetry analysis of ICG-fluorescence was performed using Image-J software. V7-CMG-ICG concentration based on the known concentration of V7 incubated with the CMGs to produce the V7-CMG particles. Dry weights were calculated from small samples of solution dried with a rotary evaporator (Heidolph Instruments, Schwabach, Germany) and the concentrations of the CMG-ICG solution was extrapolated from the dry weights.
Flow Cytometry
S2VP10 pancreatic adenocarcinoma cells, 106, were plated in 6 well plates in pH 7.4 DMEM + 10% FBS + 1% L-glutamine and allowed to attach overnight. The next day cells were switched to either pH 7.4 or pH 6.5 DMEM + 10% BSA +1% L-glutamine and rocked in an incubator at 37° C, without addition of CO2 (80% N2 and 20% O2) for 2 h. Cells were then treated with either 10 nM V7-CMG-ICG or 10 nM CMG-ICG and rocked in an incubator at 37° C, without addition of CO2 (80% N2 and 20% O2) for 2 h. Cells were then scraped and collected. Flow cytometry was performed using the BD FACSCanto flow cytometer (BD Biosciences, San Jose, CA, USA) with 50,000 events and cell counts analyzed with FlowJo software (TreeStar, Inc, Ashland, OR, USA).
Encapsulation of CMGs with Gemcitabine
CMGs (0.1g) were mixed in a 32 μM solution of gemcitabine in PBS. The pH of the solution was decreased to between pH 3.0–4.0 with acetic acid and allowed to mix under gentle magnetic stirring for 24 h. After 24 h, the pH of the solution was abruptly increased to between pH 8.0 and 9.0 with NaOH and allowed to equilibrate under magnetic stirring at room temperature for one hour, thereby forming gemcitabine encapsulated CMGs (CMG-Gem).
Gemcitabine Release Assay
Three vials of pH 8.0–9.0 gemcitabine + CMG encapsulation solution (2 mL) were centrifuged 30 minutes at 12,500 RPM. The supernatant was aspirated and the CMG-Gem nanoparticles were re-suspended in 2 mL of pH 7.4, 6.5, or 6.0 PBS. All samples remained under magnetic stirring at room temperature for 96 h. These nanoparticles were characterized by NanoDrop 2000c/2000 UV-Vis Spectrophotometer (Thermo Scientific, Wilmington, DE, USA). Gemcitabine release was calculated by UV-Vis absorbance at 275 nm with 3 separate measurements of two drops of from each sample, for a total of 6 measurements per pH condition per time point. An average of the values was plotted as the UV-VIS absorbance for that time point. Prior to each supernatant sampling, each sample was spun for 10 minutes at 10,000 RPM to precipitate the nanoparticles. Percentage gemcitabine release was calculated by dividing the average value for each pH sample measurement at a time point by the maximum UV-Vis value measured for that pH value over a 96 hour period.
Cell Viability Assay with Treatment with V7-CMG-Gem in pH Media
S2VP10 pancreatic cancer cells, 5 × 10⁴/well, were plated in 24 well plates in commercially made DMEM + 10% FBS + 1% L-glutamine and allowed to incubate overnight at 5% CO2, 37° C. The next day, wells were washed with PBS and placed into the specified pH media of DMEM + 10% BSA + 1% L-glutamine and placed at 37° C without addition of CO2 (80% N2 and 20% O2) for 3 h. Cells were then treated as control, with 300nM gemcitabine, 300nM V7-CMG, or 300nM V7-CMG-Gem and allowed to incubate for 24 h at 37° C without addition of CO2 (80% N2 and 20% O2). Cells are treated without addition of CO2 to prevent generation of carbonic acid via reaction between phosphate buffered media and environmental CO2. All treatments were decontaminated with UV-light for 1 hour prior to cell treatment. Cell viability was assessed at 24 h with a Neutral Red Assay.
Neutral Red Assay
In a cell culture hood, cells are washed in 0.5 mL of pH specific PBS and then treated with 20 μg/mL Neutral Red Dye in pH specific DMEM media and allowed to incubate for 2 h at 37° C without addition of CO2 (80% N2 and 20% O2). After incubation, the remaining steps occurred at the bench. Each well was aspirated and washed in 0.5 mL 1% BSA. Cells were then fixed for no more than 2 minutes in 100 μL 1% formaldehyde. Each well was then incubated in 0.5 mL of 1% BSA on a shaker for 5 minutes. Each well was then incubated in Neutral Red Destain solution (10 mL DI water, 10 mL 96% EtOH, 0.2 mL glacial acetic acid) for 10 minutes on a shaker prior to bottom-read fluorescence on a BioTek plate reader (BioTek Instruments, Winooski, VT, USA). Cell viability was determined by absorbance counts relative to the pH 7.4 control.
Western Blot Analysis
S2VP10 and MiaPaca2 pancreatic adenocarcinoma, were plated in 75 cm2 flasks and cultured at 37° C, 5% CO2 until 70% confluent. For treatment, cells were placed in either pH specific DMEM (described above) at pH 7.4 or pH 6.5 + 10% FBS + 1% L-Glutamine without CO2 (80% N2 and 20% O2). Whole cell protein lysates were collected using sodium orthovanadate (Sigma-Aldrich, St. Louis, MO, USA) NuPAGE 4–12% Bis Tris gels were used for protein electrophoresis (Life Technologies, Grand Island, NY, USA). Transfer to nitrocellulose membranes was performed using the iBLOT gel transfer device from Invitrogen (Life Technologies, Grand Island, NY, USA). Odyssey blocking buffer was used for western blotting (LI-COR, Lincoln, NE, USA). Primary antibodies for western blot were incubated at 4°C overnight at the following concentrations: β-actin (1:2000) (Pierce Chemicals, Thermo Fisher Scientific, Rockford, IL, USA), Cleaved-caspase 3 (1:1000) and Pro-caspase 3 (Cell signaling Technology, Beverly, MA, USA), Pro and Cleaved-caspase 9 (ab69514, Abcam, Cambridge, UK). Blots were washed in TBS 3X for 10 minutes per wash prior to incubation in secondary antibodies. Secondary antibodies were rabbit and mouse IR-Dye antibodies (LI-COR, Lincoln, NE, USA). The secondary antibodies were incubated for 1 h at 25° C (1:3000) in Odyssey blocking buffer and washed again 3X for 10 minutes per wash prior to development. Blots were developed and analyzed using the Odyssey Infrared Imaging System (LI-COR, Lincoln, NE, USA). Dosimetry of bands was determined using Image suite 2.0 (Li-COR) and compared to β-actin.
Optoacoustic tissue phantoms
Optoacoustic tissue phantoms were used to observe optoacoustic signal in two settings: 1) contrast agent only (CMG, free IR-780 dye, CMG-780, and V7-CMG-780) and 2) cellular uptake of V7-CMG-780 at pHs 7.4, 7.0, 6.8, and 6.5 by S2VP10L cells. S2VP10 cells, 5×10⁵, were plated into 6 well plates for 18 h in DMEM media at pH 7.4. Media was removed and cells were incubated in pH specific media for 3 h at 37° C without addition of CO2 (80% N2 and 20% O2). Following pH adjustment, V7-CMG-780 or CMG-780 particles (100 nM) were added for 2 h under gentle rocking at 37° C with addition of CO2. Cells were then washed three times with the condition specific pH 7.4 or pH 6.5 PBS and the cells were scraped and collected in 1 mL pH specific PBS. The tissue phantom was constructed by following procedures: Fixed cylindrical phantoms of 2 cm diameter were prepared using a gel made from distilled water containing agar (Sigma Aldrich, St. Louis, MO, USA) for jellification (1.3% w/w) and an intralipid 20% emulsion (Sigma Aldrich, St. Louis, MO, USA) for light diffusion (6% v/v), resulting in a gel presenting a reduced scattering coefficient of μ’s ≈ 10 cm−1. A cylindrical inclusion approximately 3 mm diameter containing the nanoparticle treated cells or the particle to be analyzed was put in the middle of the phantom.
To identify the optoacoustic spectra of CMG-780, CMG, or IR-780, each agent was inserted into tissue phantoms and optoacoustic data was acquired at each 5 nm wavelengths from 680–900 using MSOT at a single position located approximately in the middle of the phantom to compare to the spectra obtained using the spectrophotometer (data not shown). Signal was measured using a Region of Interest method from MSOT images. Data obtained in MSOT arbitrary units (a.u.) was statistically compared using ANOVA. The optoacoustic spectra matched the spectra obtained with the spectrophotometer.
Orthotopic implantation of pancreatic cancer cells within SCID mice
Female severe combined immunodeficient mice 4 weeks of age were used for this study in strict adherence to a University of Louisville Institutional Animal Care and Use Committee (IACUC) approved protocol. Mice were placed on 2920X alfalfa free-rodent diet (Harlan Laboratories, Indianapolis, IN, USA) to reduce background signal during imaging. An established model for orthotopic cell implantation into the mouse pancreas was followed as previously described17–18, 68. Briefly, 10 mice were anesthetized with isoflurane and hair was removed from the abdomen using Nair with aloe followed by washing with warm water. The abdomen was then prepped with betadine. A 1-cm incision was made in the left upper quadrant, with the pancreas exposed by retraction of the spleen. Luciferase-cloned S2VP10 cells (S2VP10L) or S2O13 cells (S2O13) were suspended in serum-free DMEM medium at 4° C in a sterile tube. A solution of 5 × 10⁵ cells/30 μL was drawn up using a 28-gauge needle and injected into the tail of the pancreas. A sterile cotton tipped applicator was held over the injection site for 30 s to prevent peritoneal leakage. The organs were returned to the abdomen with the skin and peritoneum closed in a single layer using 5-0 nylon sutures. Mice recovered underneath a warming blanket and were returned to their cages with food and water ad libitum after regaining full mobility.
Tumor monitoring with bioluminescence imaging
Bioluminescence imaging was used immediately following surgery to assess potential leakage of cells from orthotopic implantation with the advanced molecular imager-1000-X instrument (AMI) (Spectral Imaging Instruments, Tucson, AZ, USA). Mice received ip injection of 2.5 mg luciferin 10 min prior to imaging, and those with signs of peritoneal leakage were excluded from further study. Sutures were removed after 5 days to prevent artifact during subsequent imaging studies. Tumor size was followed daily with bioluminescence imaging. At day 7 post-implant, 10 mice per cell line S2VP10L or S2O13 were selected based upon bioluminescence signal to evaluate V7-CMG-780 and CMG-780 for in vivo imaging using MSOT.
Particle preparation for injection
44.8 mg of CMG was mixed with 1mL of IR-780 dye (1 mM) in DMF and pH was adjusted to 3 by adding acetic acid. Then, it was stirred overnight. Afterwards, pH was adjusted to 7.4 by adding 1 M NaOH and stirred 5 h. 2.2 mg of V7 was added into above solutions and stirred 10 h. Then, it was centrifuged 5000 RPM for 20 minutes for 3 times by washing with 0.5% NaCl with 10 mM phosphate buffers to get V7-CMG having the concentration of 112 mg/mL in terms of CMG. The control (112 mg/mL CMG) was synthesized by same method without adding V7. These nanoparticles were characterized as optoacoustic tissue phantoms, as described above.
Evaluation of particle binding with planar fluorescent imaging
Systemic injection of V7-CMG-780 or CMG-780 was confirmed with near-infrared fluorescent imaging by AMI fluorescent imaging. NIR-fluorescence imaging was repeated prior to MSOT imaging at 3 h post-injection. Additionally, organs (liver, kidney, and pancreas tumor) were removed 4 h post injection from 3 mice per cell line were injected with V7-CMG-780 or CMG-780. Tissues were immediately placed into a petri dish with PBS 7.4 pH at 37° C, and within 30 s from organ removal were imaged using NIR-fluorescence imaging (AMI).
Evaluation of V7-CMG-780 accumulation in vivo assessed using Multispectral Optoacoustic Tomography
The inVision-256TF multispectral optoacoustic tomography system (iThera Medical, Munich, Germany) was used for real-time detection of V7-CMG particle biodistribution within orthotopic pancreatic xenografts. The mice were anesthetized with 1.6% isoflurane inhalant delivered in 0.8 L medical air and 0.1 L O2, then depilated using a combination of shaving and application of Nair with aloe (Church & Dwight Co, Princeton, NJ, USA), which was removed with moist gauze. Anesthetic depth was maintained throughout the image acquisitions with mice oriented ventral side up in the animal holder. Mice were imaged using MSOT prior to iv injection to determine baseline signal. Three h post iv injection of V7-CMG-780 or CMG-780 control whole-body imaging was performed using transverse slices with a 0.2-mm step from the liver to the kidney (38–56 mm), at wavelengths of 680, 710, 730, 740, 760, 770, 780, 800, 850, 900 nm for each position, using 25 averages per wavelength with acquisition time of 10 μsec per frame in order to minimize the influence of animal movement in the images. Excitation of the V7-CMG was conducted using a tunable parametric oscillator pumped by an Nd: YAG laser. Pancreatic tumors were identified based upon the deoxy-hemoglobin signal in the live-screen multispectral preview.
MSOT Image Reconstruction and Analysis
Raw data obtained with MSOT was reconstructed with multispectral analysis performed as previously described17–18. Spectral analysis was performed at wavelengths corresponding to the nanoparticle, oxy- and deoxy-hemoglobin. Spectra utilized for spectral unmixing of the nanoparticle are located within Figure 2C with oxy- and deoxy-hemoglobin spectra identified in previous publicatons17. Reconstruction was conducted using back-projection at a resolution of 75μm using ViewMSOT software version 3.5 (iThera Medical, Munich, Germany). The Multispectral Processing was conducted using Linear Regression with ViewMSOT 3.5, where known molar absorptivity spectra (e.g. for oxy-hemoglobin, deoxy-hemoglobin, and nanoparticle) are used to model the relationship between chromophore concentration and MSOT signal over a range of wavelengths. The approach assumes knowledge about all absorbers present in the imaged tissue in order to correctly attribute contributions from the different wavelengths to the unmixed component images69. In order to ensure comparability among data sets, the reconstruction parameters (field of view, speed of sound, pixel size, and the high/low pass filters) and spectral unmixing parameters were consistently applied to all data. Spectral unmixing was performed in the absence of correction for fluence heterogeneities and attenuation as a function of tissue depth including spectral coloring.
Figure 2.

Characterization of nanoparticles. (A) Transmission electron micrograph of particles indicates the 102 nm diameter. (B) Dynamic light scattering indicates size distribution of the particles by intensity with the peak value at 108 nm (C) The optoacoustic spectra of CMG, IR-780 dye, and CMG-780 nanoparticles was obtained using tissue phantoms with MSOT. Both CMG and IR-780 demonstrate single, characteristic peaks appropriate peaks for each particle or dye. The peak for CMG-780 is bimodal, reflective of both CMG and IR-780 components. Because CMG-780 contains photoabsorbing components (gold nanorod and IR-780), the characteristic spectral peak is influenced by both components. The spectral shift of the CMG-780 to include a broader shoulder is likely due to the influence of the absorption of the gold nanorod on IR-780, resulting in slight alteration to the absorption spectra of IR-780. This optoacoustic spectra was used to calibrate the MSOT to only detect foci of contrast which demonstrates bimodal absorption spectra as the MSOT laser and detectors scan through the NIR spectra.
The orthotopic tumors had a similar location and distance from the skin surface from animal to animal, thus fluence issues would equally affect all animals. Image stacks were imported into Image J for further evaluation of the 3D characteristics of probe binding within the tumor using orthogonal views. The location of orthotopic tumors was identified based upon the presence of deoxy-hemoglobin, based upon deoxy-hemoglobin spectra 17, and relative location of the spleen and kidney. In addition, a region of interest (ROI) method was applied to determine signal strength in the tumors, liver, and kidney of both V7-CMG and CMG treated mice using ViewMSOT software and reported as MSOT a.u. The ROI was manually created with an ellipse drawing tool using the deoxy-hemoglobin spectrally unmixed component as a guide for tumor location on the cross-section showing the largest area for the tumor. The deoxy-hemoglobin component was used to provide a basis for tumor segmentation in animals receiving control nanoparticle, as there was significant overlap in signal localization between V7-CMG and deoxy-hemoglobin. The ROI area was kept constant for all image slices 3.5 mm2, thus creating a non-uniform elliptical prism volume of interest (VOI). The mean pixel intensity per cross-section in the VOI for the spectrally unmixed injected agent (V7-CMG and CMG) was plotted as MSOT signal vs. position to assess the signal strength in the tumor. This analysis produced a consistent parabolic shape of signal over distance in the tumor. The maximal ‘mean signal per cross-section’ in the volume was used as a quantitative indicator of probe binding in the tumor. Since optoacoustic signals using the detection geometry of this system are subject to out-of-plane contributions, this method was used to find the center of signal intensity and minimize variability from out-of-plane artifacts. The capacity of this optoacoustic system to deliver semi-quantitative data reflective of relative probe accumulation in vivo in murine models using the aforementioned reconstruction and multispectral unmixing methods was previously established.70 The MSOT a.u. values for the pH-targeted (V7-CMG) and control nanoparticle were compared using SAS 9.3 (SAS, Cary, NC, USA).
Statistics
In vitro, comparison of signal intensity across pH levels for each cell line was performed with ANOVA using SAS 9.3 (SAS, Cary, NC, USA). In vivo, the MSOT a.u. values for the V7-CMG-780 and CMG-780 nanoparticles were compared using Wilcoxon sum-rank test and ANOVA followed by Tukey post hoc test using SAS 9.3 (SAS, Cary, NC, USA). Significance was observed where p <0.05.
Results and Discussion
Nanoparticle characterization
The goal of this project was to create a nano-vehicle that enhances tumor targeting, provides tumor-targeted drug delivery, and facilitates tumor detection via MSOT in orthotopic pancreatic tumors in live mice. Pure gold nanorods were synthesized (CTAB-GNR) and subsequently coated with mesoporous silica (MS-GNRs). The mesoporous silica coating was functionalized with amino groups and the MS-GNRs were subsequently coated with chitosan to create CMGs. The chitosan coated particles were functionalized with V7 pHLIP to create V7-CMGs via conjugation of the V7 pHLIP to the amino groups on the mesoporous silica coating using a N-succinimidyl 4-(maleimidomethyl)cyclohexanecarboxylate (SMCC) linker. An infrared 780nm wavelength fluorescent dye (IR-780) was encapsulated in V7-CMG and CMG to enhance contrast with MSOT (V7-CMG-780, CMG-780) (Figures 1, 2). While an initial absorbance of IR-780, CMG, and CMG-780 was obtained using a spectrophotometer as a control, these agents were also inserted within a tissue phantom and evaluated using MSOT. The resulting optoacoustic spectra of IR-780, CMG, and CMG-780 was utilized for all MSOT images (Figure 2C). The creation of a particle with bimodal absorption peaks of gold and IR-780 dye allows more precise imaging and targeting of the particles. Image reconstruction with overlay of the bimodal peaks verifies the location of IR-780 dye containing particles and allows for monitoring and detection of off-target cargo (IR-780 dye) release.
Figure 1.

Construction scheme of V7-CMG-780 particles.
The synthesized pure gold nanorods in this study (CTAB-GNR) contain an unstable CTAB bilayer on the surface of GNR which induces aggregation of CTAB-coated GNR and contributes to cytotoxicity to human cells, owing to the cytotoxic nature of free CTAB.46 By encapsulating the GNRs in MS, the GNRs are more suitable for biomedical applications. Transmission electron microscopy (TEM), UV-Vis spectroscopy, and zeta-potential were used to characterize the chemical properties of the nanoparticles (Figures 2A–B). Transmission electron microscopy (TEM) demonstrates the nanoparticles to be approximately 102 nm in diameter (Figure 2A) and dynamic light scattering demonstrates the narrow distribution of particle size (Figure 2B). This is small enough to pass through human capillaries (5–10 μm in diameter) and the pores in vessel walls (~200 nm diameter).14 An analysis of CMG, CMG-780, and IR-780 dye was performed in tissue phantoms using MSOT (Figure 2C). CMG demonstrates peak absorption of 255.3 MSOT arbitrary units (a.u.) at 720nm. This peak absorption range is within the transparent window of soft tissues to improve detection using MSOT.21–22, 24–25 IR-780 demonstrates peak absorption of 285 a.u. at 780nm. CMG-780 appropriately demonstrates two peak absorbances, characteristic of the CMG particle and IR-780 (Figure 2C). The measured zeta-potential appropriately characterizes each particle. The CTAB stabilized GNRs (CTAB-GNRs) had a zeta potential of +23 mV due to the presence of positively charged CTAB, but encapsulation of GNRs in MS (MS-GNR) resulted in a −11.2 mV zeta-potential, indicating that anionic MS bound to cationic GNR by electrostatic interaction. The CMG-780 had a zeta potential of +0.89 mV and was expected to be slightly positive or about neutral because the summative cationic charge of chitosan and gold is greater than that of the anionic silanol group of MS. V7-CMG-780 had a zeta potential of −2.0 mV. At neutral pH (7.4), the negative charge of the many glutamic acid residue sidechains of the V7 pHLIP confers adds an additional negative charge to the particle. Consequently, it was expected and observed to be slightly more anionic than CMG.
In vitro V7-CMG binding ability
To provide greater pH-sensitive tumor targeting specificity, we conjugated the V7 pHLIP to CMGs to create V7-CMG nanoparticles. To test the ability of the particle to localize to and deliver a cargo to tumor cell, V7-CMG nanoparticles were loaded with indocyanine green (ICG), denoted V7-CMG-ICG. CMGs were also encapsulated with ICG (CMG-ICG) to serve as the control. S2VP10L cells were treated with 10 nM of V7-CMG-ICG or CMG-ICG for 2 hours under pH 7.4 or 6.5 conditions and subsequently washed 5X in same pH adjusted PBS prior to imaging with the Odyssey Infrared Imaging System. In vitro treatment of S2VP10 cells in pH 6.5 media with V7-CMG-ICG demonstrated 31X greater ICG delivery than observed by with treatment by untargeted CMG-ICG (Figure 3 A–B). In vitro binding results attained with the Odyssey imaging system were confirmed with flow cytometry (Figure 3 C–D). The same treatment conditions were scraped and collected for analysis with flow cytometry. Cells treated with V7-CMG-ICG demonstrated nearly 25X greater nanoparticle delivery to S2VP10L cells treated in pH 6.5 media (602 mean counts) compared to pH 7.4 media (24 mean counts). Untargeted CMG-ICG cargo dye delivery at pH 6.5 (198 mean counts) was nearly 5X greater than that at pH 7.4 (44 mean counts). Importantly, nanoparticle uptake was 3X greater at pH 6.5 by V7-CMG-ICG than the untargeted CMG-ICG (602 vs. 198 mean counts). The significantly increased levels of ICG within the cells at pH 6.5 vs pH 7.4 resulted from acidic pH specific nanodelivery as opposed to residual particle deposited in the extracellular matrix of the plate as the plates were extensively washed in the same manner prior to evaluation. The increased signal intensity measured with V7-CMG-ICG demonstrates the superiority in cell targeting and cargo delivery of the V7-CMG-ICG compared to untargeted CMG-ICGs in acidic conditions.
Figure 3.

In vitro binding analyses of 10 nM CMG-ICG and V7-CMG-ICG demonstrate acidic pH-targeted delivery of nanoparticle ICG dye cargo at acidic pH. Odyssey infrared imaging (A) and dosimetry analysis (B) demonstrate greatly enhance delivery of cargo by the V7 targeted particle at acidic pH. There is minimal dye delivery at pH 6.5 or 7.4 by CMG. Treatment with V7-CMG-ICG demonstrated 31X greater ICG signal at pH 6.5 compared to pH 7.4 (A&B). Dosimetry studies were confirmed by flow cytometry for cells treated with CMG-ICG (C) and V7-CMG-ICG (D). Cells treated with V7-CMG-ICG demonstrated nearly 25X greater nanoparticle delivery to S2VP10L cells treated in pH 6.5 media (602 mean counts) compared to pH 7.4 media (24.4 mean counts). Untargeted CMG-ICG cargo dye delivery at pH 6.5 (198 mean counts) was nearly 5X greater than that at pH 7.4 (44.8 mean counts). Importantly, nanoparticle uptake was 3X greater at pH 6.5 by V7-CMG-ICG than the untargeted CMG-ICG (602 vs. 198 mean counts).
Tumor cells are a heterogeneous population due to genetic mutations, epigenetic changes, and differences in cell surface receptor expression.47–48 The heterogeneity and variable expression of cell-surface receptors within a tumor makes receptor-specific targeting difficult and ineffective.33, 49 The V7 pHLIP confers a targeting advantage in that it non-specifically inserts into all phospholipid membranes in an acidic environment regardless of the extracellular membrane receptors displayed on tumor cells, making it superior to receptor-specific targeting ligands used in other imaging and drug delivery modalities. The mechanism of improved V7 pHLIP targeted delivery has been shown to be mediated by membrane insertion and translocation of the pHLIP peptide.39 This likely results in particle delivery to the cell via 1) endocytosis by membrane fusion with the nanoparticle or 2) macropinocytosis due to insertion of multiple pHLIPs into the cellular membrane resulting in membrane disruption and blebbing which triggers nanoparticle insertion.50
Drug Release Assay
Our goal was to synthesize a nanodelivery vehicle to increase tumor specific targeting, improve tumor detection, and reduce off-target accumulation. MS-GNRs have the potential to be used as theranostic particles for tumor imaging and drug delivery.30 Amine functionalization of the MS can serve as a linker for targeting moieties, and the porous nature of MS allows for encapsulation of drug or fluorescent dye.30, 51–52 However, the porous nature of MS is also problematic if MS-GNRs are to be used for drug delivery due to the leakage toxic chemotherapeutics prior to delivery at the target site. This can be overcome by the addition of stimuli responsive gatekeeper molecules to the MS particles. Gatekeeper molecules allow controlled, targeted release of drug from MS pores when triggered by external mechanisms such as changes in pH, redox state, temperature, photoirradiation, magnetic actuation, or enzymatic activity.43 CMGs were designed to carry a dye or drug cargos at physiologic pH (7.4), protect the body from off-target delivery, and release the dye or drug when exposed to acidic extracellular tumor environment, pH 6.5–6.8.
Gemcitabine was chosen as a model drug as it is a standard therapy for pancreatic cancer. An in vitro drug release assay was performed with gemcitabine encapsulated in CMGs in physiologic pH and acidic conditions that mimic the acidic extracellular environment of a tumor, pH 6.0 and 6.5. Drug release was quantified with serial UV-Vis spectroscopy measurements using pH specific PBS as a blank. Substantially more drug is released with decreasing pH values. At pH 7.4, 10% as much gemcitabine is released by the CMGs as compared to at pH 6.0 and 6.5 after 8 hours (Figure 4) and was maintained through 96 hours of incubation. If translated to clinical application, this degree of protection would greatly reduce systemic exposure to chemotherapy and help to alleviate toxic side effects to other organs. Upon exposure to low pH conditions, the chitosan chains are protonated and quickly swell, allowing rapid drug release (Figure 1). Gemcitabine is quickly released from the CMG, with 89% and 88% release at pH 6.0 and 6.5, respectively, at 1 hour incubation (Figure 4). These results demonstrate the efficacy of chitosan as a pH-sensitive gatekeeper for the release of gemcitabine from CMGs in acidic conditions. Importantly, these findings exhibit the potential for rapid drug release into the tumor vicinity before the particles continue through the systemic circulation. CMGs may be a viable option for rapid, acidic pH targeted delivery of chemotherapeutics to a tumor, while protecting off-target organs from cytotoxic chemotherapy.
Figure 4.

Drug release assay of gemcitabine loaded CMG particles. The release of gemcitabine from CMG (CMG-Gem) was conducted over 8 hours (shown) and measured up to 96 hours using UV-Vis spectroscopy. Maximal drug release was nearly achieved at less than 1 hour. As the release of gemcitabine did not substantially after the initial 8 hours at any pH including pH 7.4, the first 8 hours are shown. The release curves demonstrate minimal release of gemcitabine from CMG-Gem at pH 7.4 over the course of 96 hours.
Chitosan, a naturally derived polysaccharide, can be linked to the surface of MS nanoparticles with a glycidyloxypropyl trimethoxysilane (GPTMS) linker, thereby stabilizing and increasing the biostability of the MS shell, while serving as a pH-sensitive barrier to encapsulated drug to prevent off-target drug delivery. 41, 43, 53–54 In physiologic pH, chitosan maintains its cationic charge, causing it to be tightly wrapped around the negatively charged MS-GNR coating via ionic interaction, thereby serving as a barrier to cargo release. Because the pKa value of chitosan is 6.3 to 7.0, extracellular acidic pH protonates the amino groups resulting in swelling of the chitosan and causing the polymer to dissociate from the MS, thus, allowing drug cargo to quickly release through the MS pores.41–43, 55 Although chitosan coating has been utilized as a pH-sensitive gatekeeper protecting chemotherapeutics, it has not improved tumor specific release of drugs or dyes in vivo as it does not improve tumor specificity.
V7-CMG drug delivery and cell viability
Next, cell viability assays were performed in different pH conditions to test the ability of our V7-CMG particles to efficiently deliver gemcitabine (V7-CMG-Gem or untargeted CMG-Gem) in vitro. Because many of the side effects of gemcitabine are attributed to drug accumulation in off-target organs at physiologic pH 7.4, and tumors in vivo are well recognized to have more acidic extracellular pH between 6.4–7.0, cytotoxicity was evaluated in two cancer cell lines at pH 7.4, 6.8, and 6.5. S2VP10 and MiaPaca2 pancreatic adenocarcinoma cells were treated with V7-CMG-Gem, V7-CMG-PBS, and gemcitabine alone (Figure 5). While treatment with 300 nM gemcitabine alone killed S2VP10 and MiaPaca2 cells at all pHs evaluated, V7-CMG-Gem only killed cells at acidic pH 6.8 and 6.5 (S2VP10 pH 6.8 p=0.0284; S2VP10 pH 6.5 p=0.0091). At pH 7.4, V7-CMG-Gem has a protective effect from gemcitabine, as treatment with gemcitabine alone results in substantially greater cell death than V7-CMG-Gem; this is demonstrated by < 7% cell death for both cell lines treated with V7-CMG-Gem at pH 7.4 (S2VP10 pH 7.4 p=.9652, MiaPaca2 pH 7.4 p=0.9532). This is due to the prevention of drug release at physiologic pH provided by the chitosan-coated nanoparticles. At pH 6.5, treatment of S2VP10 and MiaPaca2 cells with V7-CMG-Gem resulted in significantly greater cytotoxicity 97% and 96.5% cell death, respectively than gemcitabine alone 60% and 76% death S2VP10 pH 6.5 p=0.009; MiaPaca2 pH 6.5 p=0.0197). We believe this to be a result of enhanced drug delivery by the pHLIP peptide targeted V7-CMG-Gem particles. Endocytosis of nanoparticle encapsulated drug and endosomal release of drug into the cytosol presumably leads to the enhanced cytotoxicity. It should be noted that treatment with unloaded chitosan-coated particles alone has minimal effect on cell viability for both cell lines at all pH levels relative to control. When cells are treated with pH 6.5 media, there is significant cell death from environment , shock, or difficulties in maintaining the proton gradient across the cell membrane. In addition, we have cultured S2VP10 cells for 8 h at pH 6.5 followed by the same nanoparticle treatment and had similar results on a per viable cell basis of nanoparticle accumulation. This environment selects for the most robust, oncogenic cells in a tumor that are most likely to resist chemotherapy treatment. Our results demonstrate that V7-CMG nanoparticles encapsulating a chemotherapeutic drug may improve drug delivery to these most resistant cells and lead to improved cancer treatment. Further, the ability to load these particles with an infrared dye tracer in addition to drug would allow for simultaneous drug delivery and monitoring for future clinical testing and patient treatment
Figure 5.

Cell viability assays of S2VP10 (A) and MiaPaca2 (B) pancreatic adenocarcinoma cell lines treated with 300nM gemcitabine, V7-CMG empty, or 300nM V7-CMG-Gem for 24 hours. In S2VP10 cells, treatment with V7-CMG-Gem at pH 6.5 results in statistically significant enhanced cell death compared to both pH 6.5 and 6.8 gemcitabine alone (*p=0.0091 and *p=0.0284, respectively). In MiaPaca2 cells, treatment with V7-CMG-Gem significantly increased cell death at both pH 6.5 and 6.8 compared to gemcitabine alone (*p=0.0197 and *p=0.0336, respectively). At pH 7.4, V7-CMG-Gem protects cells from exposure to gemcitabine compared to treatment with gemcitabine alone at pH 7.4 to the cells in both S2VP10 and MiaPaca2 cells (tp=0.9652 and tp=0.9532, respectively). V7-CMG does not increase cell death relative to same pH PBS control at pH 7.4, 6.8, or 6.5 in either cell line (p>0.05).
Western Blot Analysis
Western blot analysis confirms the results of our cell viability assays. S2VP10 and MiaPaca2 cells were treated with gemcitabine alone, V7-CMG-Gem, or V7-CMG. We sought to quantitate increased apoptosis resulting from nano-delivered gemcitabine as well as potential toxicity of the nanoparticle only via cleaved-Caspase 3 (cC3) and cleaved-Caspase 9 (cC9) expression, which indicate the terminal portion of the apoptotic cascade. Pro-Caspase 3 and pro-Caspase 9 are the zymogens of the activated (cleaved) enzymes; high expression of the zymogens indicates that apoptosis has not been triggered. We expect to see high levels of zymogen Caspase expression in the cells treated at pH 7.4 with V7-CMG-Gem and V7-CMG. As expected, treatment with V7-CMG-Gem at pH 6.5 substantially increases expression of cC3 and cC9 both cell lines (Figure S1). Greater than 4X and 6X increase in cC9, and a 3X and 2.5X increase in cC3, is observed in S2VP10 and MiaPaca2 cell lines, respectively. Treatment with V7-CMG-PBS at pH 7.4 and pH 6.5 does not increase expression of cC3 or cC9 in either cell line, demonstrating that the cytotoxic effect observed with V7-CMG-Gem in the cell viability assays is not due to the particle itself.
Tissue phantoms confirm acidic pH dye release and the ability to separate IR-780 dye, CMG particles, CMG-780 particles using multispectral optoacoustic tomography
In order to confirm in vitro dye release corresponding to increasing acidic extracellular pH was detectable using multispectral optoacoustic tomography, S2VP10 cells were treated with CMG-780 or V7-CMG-780 particles and inserted into tissue phantoms followed by imaging. Optoacoustic signal observed in tissue phantoms confirmed increasing cellular uptake of dye corresponding to increasing extracellular acidity (Figure S2A–B). These results demonstrate acidic pH specific delivery is greatly enhanced by V7-CMG-780 compared to untargeted CMG-780.
To determine the ability of MSOT to differentiate CMG-780, CMG, or IR-780 signal based upon the spectra, tissue phantoms containing CMG-780, CMG, or IR-780 dye alone were used to validate the absorption spectra (Figure 2) of the particles (Figure S2C). Based upon the spectra of CMG-780 which is characterized by a bimodal peak at 720nm (CMG) and 780nm (IR-780), as demonstrated in Figure 2C, we were able to differentiate CMG-780, CMG, and IR-780 demonstrate that only CMG-780 particles are detected with this bi-modal spectrum, as CMG alone only has a single absorption peak, as does IR-780. The utilization of a bimodal spectrum allows us to verify that our particle and IR-780 cargo remain together. If inappropriate release of cargo is occurring in the circulation, the nanoparticles and IR-780 cargo can each be identified separately by the individual absorption spectra. The benefit of this approach is the increased specificity for CMG-780 particles, reduced non-specific background, and improved monitoring of particle location and dye cargo delivery. This enhances in vivo detection of CMG-780 and V7-CMG-780 particles.
In vivo tumor imaging with V7-CMG
We next analyzed the efficacy of our V7-CMG-780 compared to untargeted CMG nanoparticles as potential contrast imaging agents in vivo using MSOT. Ten female SCID mice were implanted with orthotopic pancreatic adenocarcinoma tumors of luciferase cloned S2VP10L or S2013 cells. For in vivo experiments, an IR-780 dye was encapsulated into the V7-CMG (V7-CMG-780) and untargeted CMG (CMG-780).
Three hours post intravenous (iv) tail vein injection, significant intra-tumoral accumulation of particles V7-CMG-780 with minimal accumulation in the liver or kidney was observed via MSOT (Figure 6A–B, Figure S3 A–B). In the S2VP10 model, V7-CMG-780 accumulation was measured in tumor (17.1 a.u), liver (0.53 a.u.), and kidney (.092 a.u.) via MSOT arbitrary units (a.u), respectively. Minimal accumulation of CMG-780 particles was detected by MSOT in tumor (0.7 a.u.), liver (3.062 a.u.), and kidney (1.042 a.u.) (Figure S4). In the in vivo S2VP10 model, V7-CMG particle preferentially accumulated within the tumor at 17.1 MSOT a.u. signal compared with 0.7 MSOT a.u. in untargeted CMG control in tumor (P = 0.0002). In the S2013 model, V7-CMG-780 accumulation was tumor (9.34 a.u.), liver (0.81 a.u.), kidney (0.24 a.u.), respectively. The CMG-780 particles resulted in minimal accumulation in tumor (0.15 a.u.), liver (3.09 a.u.), and kidney (1.29 a.u.) in the S2013 model. Significantly higher accumulation of V7-CMG-780 was observed in the pancreas tumor of both S2VP10 and S2013 models (p<0.05) than CMG-780 particles (Figures 6 A–B, Figures S3–S4). The V7-CMG signal was 9.34 MSOT a.u. in the S2013 model compared with untargeted CMG signal at 0.15 MSOT a.u. (P = 0.0004). The size of the nanoparticles (~100 nm) allows passage through capillaries (5–10 μm) and vessel pores (~200 nm) for effective delivery to the tumor.14 Given the size of our particles (~100 nm), minimal accumulation was expected in the kidney as they are too large for renal clearance.56–57 The small amount of CMG-780 signal in the liver is concordant with the primary nanoparticle elimination mechanism by hepatic phagocytes and hepatobiliary clearance.15, 56–57
Figure 6.

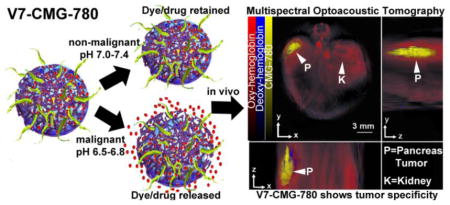
Multispectral, orthogonal views of S2VP10 and S2013 models injected with V7-CMG-780 particles as observed using MSOT. Overlay images of the spectra for CMG-780, oxy-hemoglobin, and deoxy-hemoglobin demonstrate the vascular supply to the tumor (red), hypoxic tumor environment (blue), and CMG-780 (yellow).
Axial slices at 1mm increments attained with MSOT (Figure S3A) show that the particle infiltrates the core of the tumor. This is the first time a pHLIP targeted nanoparticle has been used successfully for the imaging of intra-abdominal visceral tumors with MSOT. MSOT allows measurement of oxy- and deoxy-hemoglobin distribution in vivo.26 Oxy-hemoglobin imaging demonstrates the vascular distribution of the viscera (Figure 6). Deoxy-hemoglobin imaging confirms the hypoxic tumor microenvironment with the demonstration of deoxy-hemoglobin focus in the orthotopically implanted tumor. The focus of hypoxia confirms the acidic tumor microenvironment; where there is a focus of hypoxia and hence deoxy-hemoglobin, there is acidosis.58–59 V7-CMG-780 and tissue oxygenation were obtained using a single MSOT scan. The accumulation patterns of V7-CMG-780 corresponded with tissue hypoxia as indicated in Figure 6. The ability to simultaneously image the nanoparticle as well as a focus of hypoxia via deoxy-hemoglobin enables localization of the particle in the acid pH focus of the tumor in 3-dimensions. Consequently, we can confidently assert V7-CMG-780 accurately targets the acidic environment of the tumor.
While our V7 ligand achieved very high tumor uptake, using this ligand in the context of targeting nanoparticles to orthotopic tumors is unique and translationally more significant than subcutaneous tumor models because the proper physiologic barriers of an orthotopic tumor are in place. In contrast, other studies utilizing pHLIP targeted nanoparticles tumor imaging utilized a subcutaneous tumor model or direct injection of particles.34–35, 60 Subcutaneous tumors do not replicate the tumor microenvironment or organ specific properties which contribute to tumor progression, which is a noted problem for the evaluation of nanoparticles and cancer therapeutics in general.44–45, 61 Subcutaneous tumors also have abnormally high vascularity, artificially high leakiness and immunogenicity, and have decreased metastatic potential; such a model does not translate to clinical application.12, 44 The use of iv injection verifies that our particles in fact target a model tumor, as opposed to relying on the less translationally relevant environment of a subcutaneous tumor or attributing particle targeting to diffusion after direct tumor injection.34–35, 60 Orthotopic tumors using the cancer cell type of interest provide a more reliable model for testing clinical translation of new nanotechnologies.
Ex vivo conformation of IR-780 signal
The accumulation of IR-780 dye within organs was confirmed ex vivo using NIR fluorescence imaging immediately following MSOT imaging (Figure S5). Ex vivo NIR fluorescence imaging results were in agreement with data collected using MSOT imaging. The minimal accumulation by the V7-CMG-780 particle in the liver implies that it is not rapidly cleared from the circulation by phagocytes. In fact, the large accumulation of V7-CMG-780 in the tumor demonstrates the importance of the active targeting and exploitation of the EPR effect of tumors in which leaky tumor vasculature allows for more efficient active targeting.11, 13, 62 The greatly increased accumulation of V7-CMG-780 in the tumor compared to CMG-780 also implies that it is highly unlikely that our V7 targeted particle just accumulated in blood vessels of the tumor. We attribute these promising results to active targeting and exploitation of the EPR effect. This is in contrast to our control particle, CMG-780, which demonstrated significantly less tumor uptake and increased clearance by phagocytes, as indicated by increased uptake in the liver relative to V7-CMG-780. We attribute the increased control particle clearance to increased circulatory time without effectively targeting the tumor due to the lack of active targeting provided by the V7 pHLIP. Thus, these results validate the efficacy of our actively targeted V7-CMG particles.
It is important to note that no signs of end organ damage or hemolysis were noted upon gross inspection of the organs following iv injection of CMGs. Organ damage, necrosis, or ischemia would be reflected in the deoxy-hemoglobin images attained with MSOT. No signs of ischemia or necrosis were detected in our in vivo images. The only focus of hypoxia was appropriately observed in the acidic tumor environment. Previous studies have suggested that in vivo use of theranostic MS and MS-GNRs is limited by the reactive nature of the surface silanol groups of the MS coating, which might interact with and destroy biological molecules and cellular membranes, but it has been shown that coating of the MS with a biocompatible polymer such as polyethylene glycol (PEG) greatly increases biocompatibility and decreases nanoparticle opsonization.63–66 We infer that chitosan confers a similar protective effect. While nanoparticles help to protect the body from traditional excess chemotherapy exposure, drug leakage, particle destruction, and particle accumulation in untargeted organs such as the liver and spleen will almost certainly occur. Thus, it is best if targeted cargo is quickly delivered to the tumor and subsequently removed from the body before the nanoparticles can be broken down or drug leaked. Our results indicate that there is no off-target delivery of nanoparticle cargo by V7-CMG particles, which has not been shown in past studies. Unlike past studies which have utilized localized particle delivery or subcutaneous tumor models, our pHLIP targeted nanoparticle demonstrates efficacious imaging of intra-abdominal orthotopic tumors with MSOT. This is significant because the iv delivery of particles in mice is analogous to the systemic iv delivery of chemotherapeutics to humans. The use of orthotopic pancreatic tumors more closely models clinical application than subcutaneous tumors and enhances the clinical applicability of this study. Most importantly, our findings demonstrate the novel use of a pHLIP targeted nanoparticle that encapsulates a dye and effectively targets the acidic tumor environment for in vivo imaging with MSOT. For future applications, the ability to load V7-CMG with both a dye tracer and drug may allow for simultaneous tumor-targeted drug delivery and monitoring of drug delivery in patients using clinical MSOT 16.
Conclusion
In summary, we have presented a theranostic pH-sensitive chitosan coated mesoporous silica coated gold nanoparticle for targeting of the acidic tumor environment designed for in vivo imaging with MSOT. Although chitosan coating has been utilized as a pH-sensitive gatekeeper protecting chemotherapeutics, it has not improved tumor specific release of drugs or dyes in vivo as it does not improve tumor specificity. The addition of the V7 pHLIP to CMG nanoparticles resulted in enhanced tumor targeting specificity and enhanced delivery of drug and NIR contrast agents to tumor cells. In vivo studies confirmed the ability of V7 targeted chitosan coated nanoparticles to effectively target the acidic tumor microenvironment of visceral tumors. Further, the particles provide pH-sensitive drug release and improved tumor cell targeted drug delivery. Future directions include further investigation of V7-CMG nanoparticles for in vivo cancer treatment and possible application of these nanoparticles for photothermal radiation of tumors. In summary, V7-CMG particles are an effective method to increase tumor detection, increase tumor targeting specificity, and enhance drug delivery while reducing off-target drug interaction.
Supplementary Material
Acknowledgments
We would like to thank NIH 2P50CA101955, P30CA1314841, and the University of Louisville School of Medicine Distinction in Research program for support of this work.
Footnotes
Figure S1, efficacy of V7-CMG+Gemcitabine, V7-CMG without Gemcitabine, and Gemcitabine alone was determined within the environmental conditions of pH 7.4 and 6.5 using western blot analysis; Figure S2: Tissue phantoms highlight the acidic pH selective dye release and ability to separate CMG particles from CMG-780 particles using MSOT; Figure S3: Visualization of CMG-780 particles in a pancreas tumors using MSOT. Figure S4: Biodistribution of V7-CMG-780 and CMG-780 particles in vivo as determined using MSOT with individual organ uptake determined using region of interest (ROI) method; Figure S5: Ex vivo identification of IR-780 dye observed using NIR imaging post MSOT.
References
- 1.Chithrani DB. Nanoparticles for improved therapeutics and imaging in cancer therapy. Recent patents on nanotechnology. 2010;4(3):171–80. doi: 10.2174/187221010792483726. [DOI] [PubMed] [Google Scholar]
- 2.Ahmed N, Fessi H, Elaissari A. Theranostic applications of nanoparticles in cancer. Drug discovery today. 2012;17(17–18):928–34. doi: 10.1016/j.drudis.2012.03.010. [DOI] [PubMed] [Google Scholar]
- 3.Cao H, Le D, Yang LX. Current status in chemotherapy for advanced pancreatic adenocarcinoma. Anticancer research. 2013;33(5):1785–91. [PubMed] [Google Scholar]
- 4.Arslan C, Yalcin S. Current and future systemic treatment options in metastatic pancreatic cancer. Journal of gastrointestinal oncology. 2014;5(4):280–95. doi: 10.3978/j.issn.2078-6891.2014.030. [DOI] [PMC free article] [PubMed] [Google Scholar]
- 5.Thota R, Pauff JM, Berlin JD. Treatment of metastatic pancreatic adenocarcinoma: a review. Oncology (Williston Park, NY) 2014;28(1):70–4. [PubMed] [Google Scholar]
- 6.Werner J, Combs SE, Springfeld C, Hartwig W, Hackert T, Buchler MW. Advanced-stage pancreatic cancer: therapy options. Nature reviews. Clinical oncology. 2013;10(6):323–33. doi: 10.1038/nrclinonc.2013.66. [DOI] [PubMed] [Google Scholar]
- 7.Heinemann V, Reni M, Ychou M, Richel DJ, Macarulla T, Ducreux M. Tumour-stroma interactions in pancreatic ductal adenocarcinoma: rationale and current evidence for new therapeutic strategies. Cancer treatment reviews. 2014;40(1):118–28. doi: 10.1016/j.ctrv.2013.04.004. [DOI] [PubMed] [Google Scholar]
- 8.Bittoni A, Santoni M, Lanese A, Pellei C, Andrikou K, Stefano C. Neoadjuvant therapy in pancreatic cancer: an emerging strategy. Gastroenterology research and practice. 2014;2014:183852. doi: 10.1155/2014/183852. [DOI] [PMC free article] [PubMed] [Google Scholar]
- 9.Sutton JM, Abbott DE. Neoadjuvant therapy for pancreas cancer: Past lessons and future therapies. World journal of gastroenterology: WJG. 2014;20(42):15564–15579. doi: 10.3748/wjg.v20.i42.15564. [DOI] [PMC free article] [PubMed] [Google Scholar]
- 10.Wojtkowiak JW, Verduzco D, Schramm KJ, Gillies RJ. Drug resistance and cellular adaptation to tumor acidic pH microenvironment. Molecular pharmaceutics. 2011;8(6):2032–8. doi: 10.1021/mp200292c. [DOI] [PMC free article] [PubMed] [Google Scholar]
- 11.Iyer AK, Khaled G, Fang J, Maeda H. Exploiting the enhanced permeability and retention effect for tumor targeting. Drug discovery today. 2006;11(17–18):812–8. doi: 10.1016/j.drudis.2006.07.005. [DOI] [PubMed] [Google Scholar]
- 12.Bolkestein MM, de Blois E, Koelewijn SJ, Eggermont AM, Grosveld F, de Jong M, Koning GA. Investigation of Factors Determining the Enhanced Permeability and Retention Effect in Subcutaneous Xenografts. Journal of nuclear medicine: official publication, Society of Nuclear Medicine. 2015 doi: 10.2967/jnumed.115.166173. [DOI] [PubMed] [Google Scholar]
- 13.Maeda H, Wu J, Sawa T, Matsumura Y, Hori K. Tumor vascular permeability and the EPR effect in macromolecular therapeutics: a review. Journal of Controlled Release. 2000;65(1–2):271–284. doi: 10.1016/s0168-3659(99)00248-5. DOI: http://dx.doi.org/10.1016/S0168-3659(99)00248-5. [DOI] [PubMed] [Google Scholar]
- 14.Lazarovits J, Chen YY, Sykes EA, Chan WC. Nanoparticle-blood interactions: the implications on solid tumour targeting. Chemical communications (Cambridge, England) 2015;51(14):2756–67. doi: 10.1039/c4cc07644c. [DOI] [PubMed] [Google Scholar]
- 15.Khlebtsov N, Dykman L. Biodistribution and toxicity of engineered gold nanoparticles: a review of in vitro and in vivo studies. Chemical Society Reviews. 2011;40(3):1647–1671. doi: 10.1039/C0CS00018C. [DOI] [PubMed] [Google Scholar]
- 16.McNally LR, Mezera M, Morgan DE, Frederick PJ, Yang ES, Eltoum IE, Grizzle WE. Current and Emerging Clinical Applications of Multispectral Optoacoustic Tomography (MSOT) in Oncology. Clinical cancer research. 2016 doi: 10.1158/1078-0432.CCR-16-0573. [DOI] [PMC free article] [PubMed] [Google Scholar]
- 17.Kimbrough CW, Hudson S, Khanal A, Egger ME, McNally LR. Orthotopic pancreatic tumors detected by optoacoustic tomography using Syndecan-1. The Journal of surgical research. 2015;193(1):246–54. doi: 10.1016/j.jss.2014.06.045. [DOI] [PMC free article] [PubMed] [Google Scholar]
- 18.Khanal A, Ullum C, Kimbrough CW, Garbett NC, Burlison JA, McNally MW, Chuong P, El-Baz AS, Jasinski JB, McNally LR. Tumor targeted mesoporous silica-coated gold nanorods facilitate detection of pancreatic tumors using Multispectral optoacoustic tomography. Nano Research. 2015;8(12):3864–3877. doi: 10.1007/s12274-015-0886-8. [DOI] [Google Scholar]
- 19.Razansky D, Deliolanis NC, Vinegoni C, Ntziachristos V. Deep tissue optical and optoacoustic molecular imaging technologies for pre-clinical research and drug discovery. Current pharmaceutical biotechnology. 2012;13(4):504–22. doi: 10.2174/138920112799436258. [DOI] [PubMed] [Google Scholar]
- 20.Zhang Z, Wang J, Chen C. Gold nanorods based platforms for light-mediated theranostics. Theranostics. 2013;3(3):223–38. doi: 10.7150/thno.5409. [DOI] [PMC free article] [PubMed] [Google Scholar]
- 21.Xia Y, Li W, Cobley CM, Chen J, Xia X, Zhang Q, Yang M, Cho EC, Brown PK. Gold nanocages: from synthesis to theranostic applications. Accounts of chemical research. 2011;44(10):914–24. doi: 10.1021/ar200061q. [DOI] [PMC free article] [PubMed] [Google Scholar]
- 22.Manohar S, Ungureanu C, Van Leeuwen TG. Gold nanorods as molecular contrast agents in photoacoustic imaging: the promises and the caveats. Contrast media & molecular imaging. 2011;6(5):389–400. doi: 10.1002/cmmi.454. [DOI] [PubMed] [Google Scholar]
- 23.Tong L, Wei Q, Wei A, Cheng JX. Gold nanorods as contrast agents for biological imaging: optical properties, surface conjugation and photothermal effects. Photochemistry and photobiology. 2009;85(1):21–32. doi: 10.1111/j.1751-1097.2008.00507.x. [DOI] [PMC free article] [PubMed] [Google Scholar]
- 24.Li W, Brown PK, Wang LV, Xia Y. Gold nanocages as contrast agents for photoacoustic imaging. Contrast media & molecular imaging. 2011;6(5):370–7. doi: 10.1002/cmmi.439. [DOI] [PMC free article] [PubMed] [Google Scholar]
- 25.Vonnemann J, Beziere N, Bottcher C, Riese SB, Kuehne C, Dernedde J, Licha K, von Schacky C, Kosanke Y, Kimm M, Meier R, Ntziachristos V, Haag R. Polyglycerolsulfate functionalizedgold nanorods as optoacoustic signal nanoamplifiers for in vivo bioimaging of rheumatoid arthritis. Theranostics. 2014;4(6):629–41. doi: 10.7150/thno.8518. [DOI] [PMC free article] [PubMed] [Google Scholar]
- 26.Ntziachristos V, Razansky D. Molecular imaging by means of multispectral optoacoustic tomography (MSOT) Chemical reviews. 2010;110(5):2783–94. doi: 10.1021/cr9002566. [DOI] [PubMed] [Google Scholar]
- 27.Hu X, Gao X. Multilayer coating of gold nanorods for combined stability and biocompatibility. Physical chemistry chemical physics: PCCP. 2011;13(21):10028–35. doi: 10.1039/c0cp02434a. [DOI] [PMC free article] [PubMed] [Google Scholar]
- 28.Chen YS, Frey W, Kim S, Kruizinga P, Homan K, Emelianov S. Silica-coated gold nanorods as photoacoustic signal nanoamplifiers. Nano letters. 2011;11(2):348–54. doi: 10.1021/nl1042006. [DOI] [PMC free article] [PubMed] [Google Scholar]
- 29.Chen YS, Frey W, Kim S, Homan K, Kruizinga P, Sokolov K, Emelianov S. Enhanced thermal stability of silica-coated gold nanorods for photoacoustic imaging and image-guided therapy. Optics express. 2010;18(9):8867–78. doi: 10.1364/oe.18.008867. [DOI] [PMC free article] [PubMed] [Google Scholar]
- 30.Zhang Z, Wang L, Wang J, Jiang X, Li X, Hu Z, Ji Y, Wu X, Chen C. Mesoporous silica-coated gold nanorods as a light-mediated multifunctional theranostic platform for cancer treatment. Advanced materials (Deerfield Beach, Fla) 2012;24(11):1418–23. doi: 10.1002/adma.201104714. [DOI] [PubMed] [Google Scholar]
- 31.Song CWGR, Parl HJ. Influence of Tumor pH on Therapeutic Response. In: Teicher B, editor. Cancer Drug Discovery and Development: Cancer Drug Resistance. 16. Humana Press Inc; Totowa, NJ: 2006. [Google Scholar]
- 32.Wike-Hooley JL, Haveman J, Reinhold HS. The relevance of tumour pH to the treatment of malignant disease. Radiotherapy and oncology: journal of the European Society for Therapeutic Radiology and Oncology. 1984;2(4):343–66. doi: 10.1016/s0167-8140(84)80077-8. [DOI] [PubMed] [Google Scholar]
- 33.Andreev OA, Engelman DM, Reshetnyak YK. Targeting diseased tissues by pHLIP insertion at low cell surface pH. Frontiers in physiology. 2014;5:97. doi: 10.3389/fphys.2014.00097. [DOI] [PMC free article] [PubMed] [Google Scholar]
- 34.Shan L. Molecular Imaging and Contrast Agent Database (MICAD) National Center for Biotechnology Information (US); Bethesda (MD): 2004. Cy5.5-labeled pH low insertion peptide (pHLIP) [PubMed] [Google Scholar]
- 35.Yao L, Daniels J, Moshnikova A, Kuznetsov S, Ahmed A, Engelman DM, Reshetnyak YK, Andreev OA. pHLIP peptide targets nanogold particles to tumors. Proceedings of the National Academy of Sciences of the United States of America. 2013;110(2):465–70. doi: 10.1073/pnas.1219665110. [DOI] [PMC free article] [PubMed] [Google Scholar]
- 36.Weerakkody D, Moshnikova A, Thakur MS, Moshnikova V, Daniels J, Engelman DM, Andreev OA, Reshetnyak YK. Family of pH (low) insertion peptides for tumor targeting. Proceedings of the National Academy of Sciences of the United States of America. 2013;110(15):5834–9. doi: 10.1073/pnas.1303708110. [DOI] [PMC free article] [PubMed] [Google Scholar]
- 37.Di Martino A, Sedlarik V. Amphiphilic chitosan-grafted-functionalized polylactic acid based nanoparticles as a delivery system for doxorubicin and temozolomide co-therapy. International Journal of Pharmaceutics. 2014;474(1–2):134–145. doi: 10.1016/j.ijpharm.2014.08.014. DOI: http://dx.doi.org/10.1016/j.ijpharm.2014.08.014. [DOI] [PubMed] [Google Scholar]
- 38.Xu Y, Wang L, Li YK, Wang CQ. Oxidation and pH responsive nanoparticles based on ferrocene-modified chitosan oligosaccharide for 5-fluorouracil delivery. Carbohydrate polymers. 2014;114:27–35. doi: 10.1016/j.carbpol.2014.08.003. [DOI] [PubMed] [Google Scholar]
- 39.Reshetnyak YK, Andreev OA, Lehnert U, Engelman DM. Translocation of molecules into cells by pH-dependent insertion of a transmembrane helix. Proceedings of the National Academy of Sciences of the United States of America. 2006;103(17):6460–5. doi: 10.1073/pnas.0601463103. [DOI] [PMC free article] [PubMed] [Google Scholar]
- 40.Kimbrough CW, Khanal A, Zeiderman M, Khanal BR, Burton NC, McMasters KM, Vickers SM, Grizzle WE, McNally LR. Targeting Acidity in Pancreatic Adenocarcinoma: Multispectral Optoacoustic Tomography Detects pH-low Insertion Peptide Probes in vivo. Clinical cancer research. 2015 doi: 10.1158/1078-0432.ccr-15-0314. [DOI] [PMC free article] [PubMed] [Google Scholar]
- 41.Chen F, Zhu Y. Chitosan enclosed mesoporous silica nanoparticles as drug nano-carriers: Sensitive response to the narrow pH range. Microporous and Mesoporous Materials. 2012;150(0):83–89. DOI: http://dx.doi.org/10.1016/j.micromeso.2011.07.023. [Google Scholar]
- 42.Bhattarai N, Gunn J, Zhang M. Chitosan-based hydrogels for controlled, localized drug delivery. Advanced Drug Delivery Reviews. 2010;62(1):83–99. doi: 10.1016/j.addr.2009.07.019. DOI: http://dx.doi.org/10.1016/j.addr.2009.07.019. [DOI] [PubMed] [Google Scholar]
- 43.Hu X, Wang Y, Peng B. Chitosan-capped mesoporous silica nanoparticles as pH-responsive nanocarriers for controlled drug release. Chemistry, an Asian journal. 2014;9(1):319–27. doi: 10.1002/asia.201301105. [DOI] [PubMed] [Google Scholar]
- 44.Manzotti C, Audisio RA, Pratesi G. Importance of orthotopic implantation for human tumors as model systems: relevance to metastasis and invasion. Clinical & experimental metastasis. 1993;11(1):5–14. doi: 10.1007/BF00880061. [DOI] [PubMed] [Google Scholar]
- 45.Kerbel RS, Cornil I, Theodorescu D. Importance of orthotopic transplantation procedures in assessing the effects of transfected genes on human tumor growth and metastasis. Cancer metastasis reviews. 1991;10(3):201–15. doi: 10.1007/BF00050792. [DOI] [PubMed] [Google Scholar]
- 46.Shen S, Tang H, Zhang X, Ren J, Pang Z, Wang D, Gao H, Qian Y, Jiang X, Yang W. Targeting mesoporous silica-encapsulated gold nanorods for chemo-photothermal therapy with near-infrared radiation. Biomaterials. 2013;34(12):3150–8. doi: 10.1016/j.biomaterials.2013.01.051. [DOI] [PubMed] [Google Scholar]
- 47.Fidler IJ. Hum Vaccin Immunother. Vol. 8. United States: 2012. Biological heterogeneity of cancer: implication to therapy; pp. 1141–2. [DOI] [PMC free article] [PubMed] [Google Scholar]
- 48.McGranahan N, Swanton C. Biological and therapeutic impact of intratumor heterogeneity in cancer evolution. Cancer Cell. 2015;27(1):15–26. doi: 10.1016/j.ccell.2014.12.001. [DOI] [PubMed] [Google Scholar]
- 49.Gillies RJ, Verduzco D, Gatenby RA. Nature reviews. Cancer. Vol. 12. England: 2012. Evolutionary dynamics of carcinogenesis and why targeted therapy does not work; pp. 487–93. [DOI] [PMC free article] [PubMed] [Google Scholar]
- 50.Wijesinghe D, Arachchige MC, Lu A, Reshetnyak YK, Andreev OA. Sci Rep. Vol. 3. England: 2013. pH dependent transfer of nano-pores into membrane of cancer cells to induce apoptosis; p. 3560. [DOI] [PMC free article] [PubMed] [Google Scholar]
- 51.Mamaeva V, Sahlgren C, Lindén M. Mesoporous silica nanoparticles in medicine—Recent advances. Advanced Drug Delivery Reviews. 2013;65(5):689–702. doi: 10.1016/j.addr.2012.07.018. DOI: http://dx.doi.org/10.1016/j.addr.2012.07.018. [DOI] [PubMed] [Google Scholar]
- 52.Wang Y, Zhao Q, Han N, Bai L, Li J, Liu J, Che E, Hu L, Zhang Q, Jiang T, Wang S. Mesoporous silica nanoparticles in drug delivery and biomedical applications. Nanomedicine: nanotechnology, biology, and medicine. 2014 doi: 10.1016/j.nano.2014.09.014. [DOI] [PubMed] [Google Scholar]
- 53.Wu J, Sailor MJ. Chitosan Hydrogel-Capped Porous SiO2 as a pH Responsive Nano-Valve for Triggered Release of Insulin. Advanced Functional Materials. 2009;19(5):733–741. doi: 10.1002/adfm.200800921. [DOI] [Google Scholar]
- 54.Deng Z, Zhen Z, Hu X, Wu S, Xu Z, Chu PK. Biomaterials, 2011. Vol. 32. Elsevier Ltd; England: 2011. Hollow chitosan-silica nanospheres as pH-sensitive targeted delivery carriers in breast cancer therapy; pp. 4976–86. [DOI] [PubMed] [Google Scholar]
- 55.Berth G, Dautzenberg H, Peter MG. Physico-chemical characterization of chitosans varying in degree of acetylation. Carbohydrate polymers. 1998;36(2–3):205–216. DOI: http://dx.doi.org/10.1016/S0144-8617(98)00029-0. [Google Scholar]
- 56.De Jong WH, Hagens WI, Krystek P, Burger MC, Sips AJ, Geertsma RE. Particle size-dependent organ distribution of gold nanoparticles after intravenous administration. Biomaterials. 2008;29(12):1912–9. doi: 10.1016/j.biomaterials.2007.12.037. [DOI] [PubMed] [Google Scholar]
- 57.Sonavane G, Tomoda K, Makino K. Biodistribution of colloidal gold nanoparticles after intravenous administration: effect of particle size. Colloids and surfaces. B, Biointerfaces. 2008;66(2):274–80. doi: 10.1016/j.colsurfb.2008.07.004. [DOI] [PubMed] [Google Scholar]
- 58.Chiche J, Brahimi-Horn MC, Pouyssegur J. J Cell Mol Med. Vol. 14. England: 2010. Tumour hypoxia induces a metabolic shift causing acidosis: a common feature in cancer; pp. 771–94. [DOI] [PMC free article] [PubMed] [Google Scholar]
- 59.Bailey KM, Wojtkowiak JW, Hashim AI, Gillies RJ. Adv Pharmacol, 2012. Vol. 65. Elsevier Inc; United States: 2012. Targeting the metabolic microenvironment of tumors; pp. 63–107. [DOI] [PMC free article] [PubMed] [Google Scholar]
- 60.Andreev OA, Dupuy AD, Segala M, Sandugu S, Serra DA, Chichester CO, Engelman DM, Reshetnyak YK. Mechanism and uses of a membrane peptide that targets tumors and other acidic tissues in vivo. Proceedings of the National Academy of Sciences of the United States of America. 2007;104(19):7893–8. doi: 10.1073/pnas.0702439104. [DOI] [PMC free article] [PubMed] [Google Scholar]
- 61.Herter-Sprie GS, Kung AL, Wong K-K. New cast for a new era: preclinical cancer drug development revisited. The Journal of Clinical Investigation. 2013;123(9):3639–3645. doi: 10.1172/JCI68340. [DOI] [PMC free article] [PubMed] [Google Scholar]
- 62.Sykes EA, Chen J, Zheng G, Chan WC. Investigating the impact of nanoparticle size on active and passive tumor targeting efficiency. ACS nano. 2014;8(6):5696–706. doi: 10.1021/nn500299p. [DOI] [PubMed] [Google Scholar]
- 63.Slowing, Wu CW, Vivero-Escoto JL, Lin VS. Mesoporous silica nanoparticles for reducing hemolytic activity towards mammalian red blood cells. Small (Weinheim an der Bergstrasse, Germany) 2009;5(1):57–62. doi: 10.1002/smLl.200800926. [DOI] [PubMed] [Google Scholar]
- 64.Fadeel B, Garcia-Bennett AE. Better safe than sorry: Understanding the toxicological properties of inorganic nanoparticles manufactured for biomedical applications. Adv Drug Deliv Rev. 2010;62(3):362–74. doi: 10.1016/j.addr.2009.11.008. [DOI] [PubMed] [Google Scholar]
- 65.Zhao Y, Sun X, Zhang G, Trewyn BG, Slowing, Lin VS. Interaction of mesoporous silica nanoparticles with human red blood cell membranes: size and surface effects. ACS nano. 2011;5(2):1366–75. doi: 10.1021/nn103077k. [DOI] [PubMed] [Google Scholar]
- 66.Chen Y, Chen H, Shi J. In vivo bio-safety evaluations and diagnostic/therapeutic applications of chemically designed mesoporous silica nanoparticles. Advanced materials (Deerfield Beach, Fla) 2013;25(23):3144–76. doi: 10.1002/adma.201205292. [DOI] [PubMed] [Google Scholar]
- 67.Wu C, Xu QH. Stable and functionable mesoporous silica-coated gold nanorods as sensitive localized surface plasmon resonance (LSPR) nanosensors. Langmuir: the ACS journal of surfaces and colloids. 2009;25(16):9441–6. doi: 10.1021/la900646n. [DOI] [PubMed] [Google Scholar]
- 68.McNally LR, Welch DR, Beck BH, Stafford LJ, Long JW, Sellers JC, Huang ZQ, Grizzle WE, Stockard CR, Nash KT, Buchsbaum DJ. KISS1 over-expression suppresses metastasis of pancreatic adenocarcinoma in a xenograft mouse model. Clinical & experimental metastasis. 2010;27(8):591–600. doi: 10.1007/s10585-010-9349-5. [DOI] [PMC free article] [PubMed] [Google Scholar]
- 69.Tzoumas S, Deliolanis N, Morscher S, Ntziachristos V. Un-mixing Molecular Agents from Absorbing Tissue in Multispectral Optoacoustic Tomography. IEEE Trans Med Imaging. 2013 doi: 10.1109/tmi.2013.2279994. [DOI] [PubMed] [Google Scholar]
- 70.Morscher S, Driessen WH, Claussen J, Burton NC. Photoacoustics. Vol. 2. Germany: 2014. Semi-quantitative Multispectral Optoacoustic Tomography (MSOT) for volumetric PK imaging of gastric emptying; pp. 103–10. [DOI] [PMC free article] [PubMed] [Google Scholar]
Associated Data
This section collects any data citations, data availability statements, or supplementary materials included in this article.