

Abstract
Algorithm–based clinical decision support (CDS) systems associate patient-derived health data with outcomes of interest, such as in-hospital mortality. However, the quality of such associations often depends on the availability of site-specific training data. Without sufficient quantities of data, the underlying statistical apparatus cannot differentiate useful patterns from noise and, as a result, may underperform. This initial training data burden limits the widespread, out-of-the-box, use of machine learning–based risk scoring systems. In this study, we implement a statistical transfer learning technique, which uses a large “source” data set to drastically reduce the amount of data needed to perform well on a “target” site for which training data are scarce. We test this transfer technique with AutoTriage, a mortality prediction algorithm, on patient charts from the Beth Israel Deaconess Medical Center (the source) and a population of 48 249 adult inpatients from University of California San Francisco Medical Center (the target institution). We find that the amount of training data required to surpass 0.80 area under the receiver operating characteristic (AUROC) on the target set decreases from more than 4000 patients to fewer than 220. This performance is superior to the Modified Early Warning Score (AUROC: 0.76) and corresponds to a decrease in clinical data collection time from approximately 6 months to less than 10 days. Our results highlight the usefulness of transfer learning in the specialization of CDS systems to new hospital sites, without requiring expensive and time-consuming data collection efforts.
Keywords: Machine learning, mortality prediction, transfer learning, clinical decision support, AUROC
Introduction
The rapid rise in the collection of clinical data, made possible through the use of electronic health records (EHR), has unlocked the potential for machine learning techniques to provide warning of adverse patient events. One such opportunity is the prediction of in-hospital mortality. When equipped with early notice of high-risk patients, clinicians may be better able to allocate valuable hospital resources, provide appropriate care, and improve patient outcomes.
Increasingly, machine learning techniques are being used to detect adverse health events in hospital settings.1-9 Unlike risk scores developed on general populations, such as the Modified Early Warning Score (MEWS),10 the Sequential Organ Failure Assessment (SOFA),11 the Acute Physiologic Assessment and Chronic Health Evaluation II (APACHE II),12 the Medical Emergency Team (MET),13 and the systemic inflammatory response syndrome,14 machine learning–based predictors can be customized to distinct patient subpopulations or specialist care facilities by training on data from a “target” population. However, such training is often ineffective, given that minimal amounts of retrospective data are available to serve as the target training set at most institutions. This is an especially challenging problem for relatively rare outcomes of interest because there are few positive class examples in those cases. Target data scarcity presents a significant barrier to the development of predictors using data science techniques and the adaptability of these predictors into widespread clinical settings.
Data scarcity can be overcome by supplementing examples from the target population with a “source” population, for which data are more abundant, in a statistical process known as transfer learning.15 Previously, transfer learning has been applied in the health care setting for segmenting magnetic resonance images across multiple scanners and postprocessing modes,16 improving Clostridium difficile infection prediction performance using cross-institutional data,17 creating time-varying risk assessment methods from EHR data,18 and assessing the risk of adverse events in cardiac surgery.19 However, there has been limited work toward minimizing the data used in creating effective clinical decision support tools.19 In this study, we build on our prior machine learning work in developing AutoTriage, an end-to-end EHR-based algorithmic analysis system for forecasting patient mortality or predicting the results of intrahospital ward transfer and/patient discharge. For mortality prediction, we previously demonstrated that AutoTriage outperformed canonical risk scoring systems, SAPS II (the Simplified Acute Physiology Score20), SOFA, MEWS,6 and similarly outperformed MET and MEWS for discharge prediction.1 In this work, we use techniques from transfer learning to reduce the amount of data required to customize a predictor to an inpatient population (the target) at the University of California, San Francisco Medical Center, using the available Medical Information Mart for Intensive Care (MIMIC)-III21 data set (the source). Specifically, we demonstrate that this method greatly reduces the data collection burden on the target site while maintaining high predictive performance. In turn, this demonstrated capability lowers a major barrier to adoption for other target clinical facilities that have limited, non-standardized, or difficult-to-access clinical data archives.
Methods
In this section, we describe the source and target data sets, the means by which they were processed, and the definition of the mortality gold standard, which was used to assign a positive or negative class label to each patient. We also describe the machine learning model and training algorithm and the transfer learning method that we used in these experiments.
Data sets and preparation
The source data were drawn from the MIMIC-III database, version 1.3, which include more than 50 000 intensive care unit (ICU) stays (≥15 years of age) from Beth Israel Deaconess Medical Center in Boston, MA, between 2001 and 2012. The target data set used in these experiments, obtained from University of California San Francisco (UCSF), included 109 521 adult inpatient encounters (≥15 years of age) in the UCSF hospital system. We used admissions from June 2011 to March 2016, and the EHR-derived patient charts for these encounters included data recorded in multiple wards. The original MIMIC-III and UCSF data collection did not affect patient safety, and all data were de-identified in accordance with the Health Insurance Portability and Accountability Act Privacy Rule prior to commencement of this study. Hence, this study constitutes nonhuman subjects research which does not require Institutional Review Board approval.
These two data sets differ in a variety of ways, most notably the wards and departments from which they are drawn within the hospital. In principle, closely matched data sets should be more amenable to transfer learning. However, MIMIC-III is a large, well-curated, publicly available data set containing patients who have been the subjects of intense monitoring, such that it represents one of the best available source data sets, in terms of quality. Furthermore, in keeping with the motivation of this article, it will often be the case that potential source data sets are mismatched with the target data set in one or more ways, and that the range of patients over which the target site would like to use a predictive system (here, all wards of the hospital, including the emergency department) may be substantially greater than the directly comparable setting in the source collection (ICU only).
In both data sets, the outputs of database queries were processed with Dascena’s custom algorithms, implemented in MATLAB (Mathworks, Natick, MA, USA). All available measurements of a given type (eg, heart rate) were ordered and screened for anomalous outliers using physiological threshold values. The data were binned into hourly windows, and all measurements of each measurement type were averaged (or summed, if appropriate) within a window. Many windows contained no measurements for particular channels; we applied causal, carry-forward imputation (zero-order hold) to carry forward the most recent past bin’s value for averaged measurements. If there were no previous measurements in a channel, a NaN (“not-a-number”) value was retained for the channel. We used measurements of (1) Glasgow Coma Scale (GCS), (2 and 3) systolic and diastolic blood pressures, (4) heart rate, (5) body temperature, (6) respiratory rate, and (7) peripheral oxygen saturation (Spo2), (8) approximate 8-hour urine output, (9) Fio2, (10) blood pH, and binary (normal/abnormal) lab assessments for (11) total bilirubin, (12) creatinine, (13) platelets, and (14) white blood cell count. The final sequence of observations consisted of these hourly vital signs, lab results, and clinical measurements.
Gold standard
The clinical outcome of interest was in-hospital mortality. Each encounter was marked according to the following scheme: if the patient was recorded as dying in-hospital, and this death occurred during the present encounter, the encounter was marked as Class 1; otherwise, the encounter was marked as Class 0. Note that because the UCSF data set did not contain follow-up beyond the end of the encounter, some of the patients who expire marked as Class 0 may have expired after leaving the hospital. The prediction was made at a particular point in the timeline of the encounter, defined for the UCSF patients as 5 hours after the first time the patient has any one of the measurements (1-7) recorded (excluding GCS). The choice of prediction time was designed to ensure that the patient was physically present and under observation for a number of hours before the prediction was computed. For the MIMIC-III set, the prediction time was selected as 24 hours preceding the last instance of the measurements listed above. These choices were necessary because both the MIMIC-III and UCSF data sets included inexact recording of admission, discharge, and transfer times. The time of the encounter’s end-of-record event (death or discharge) may have been close or distant, relative to when the prediction was made (Figure 1).
Figure 1.
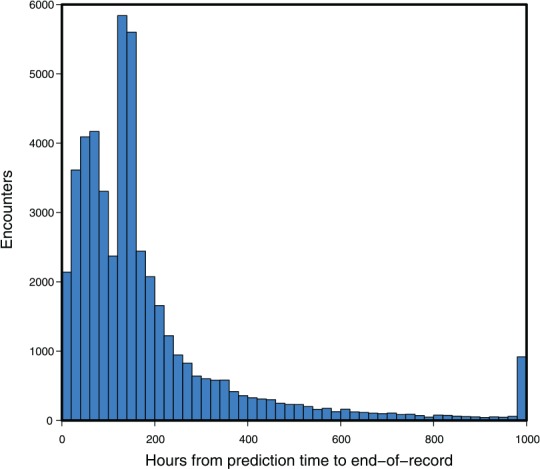
The time intervals between prediction time and the end-of-record event at University of California San Francisco (n = 48 249 with 1636 in-hospital mortality cases: 3.39% prevalence). As the record is discretized to 1000 hours at most, the end-of-record event in those cases beyond this limit was marked at 1000 hours. In such cases, the clinical outcome, death or discharge, still determined the gold standard label.
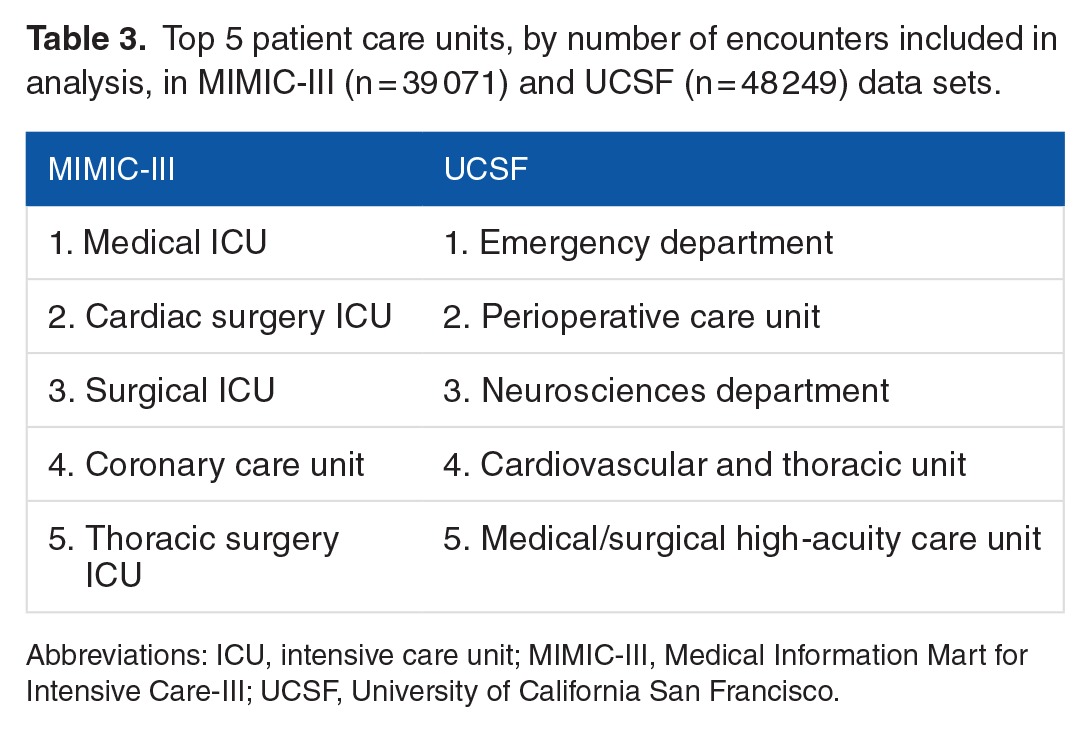
For both the MIMIC-III and UCSF data sets, we used the following procedures to determine which encounters should be excluded from further analysis. For UCSF, we first checked whether each patient had at least one of each of the measurements (1-7) at some point during the encounter. In total, 61 233 out of 109 521 encounters failed to have all of these measurements, leaving 48 288 UCSF encounters for further analysis. It was not required for patients to have measurements (8-14, laboratory test measurements) for inclusion; however, the data from these measurements were used when available (see Table 1). We next checked prediction time choices. In total, 13 929 of 53 000 MIMIC-III encounters and 39 of the remaining UCSF encounters were removed, as the prediction time either could not be determined or it was out of range (less than 5 or greater than 1000 encounter hours). This restriction was intended to ensure that only patients with sufficient encounter data for a prediction were included. For MIMIC-III encounters, when combined with the 24-hour pre-onset prediction time, this restriction also ensured that source set patients spent at least 29 hours in the ICU. The final data sets included 39 071 MIMIC-III encounters, of which 3570 were classified as class 1 (9.14% prevalence) and 48 249 UCSF patients, of which 1636 were classified as Class 1 (3.39% prevalence). We attribute the difference in prevalence to variance between the institutions and the corresponding patient populations. After the inclusion criteria were applied (see Figure 2), the UCSF and MIMIC-III patients had different age, length of stay, and sex distributions (see Table 2). In addition, MIMIC-III consisted of ICU patients exclusively, whereas the UCSF hospital system data consisted of patients across all hospital wards, which included ICUs, emergency departments, and general medical and surgical wards (see Table 3).
Table 1.
Mean per-hour observation frequencies with standard deviations among included patient stays in the MIMIC-III and UCSF data sets.

Figure 2.
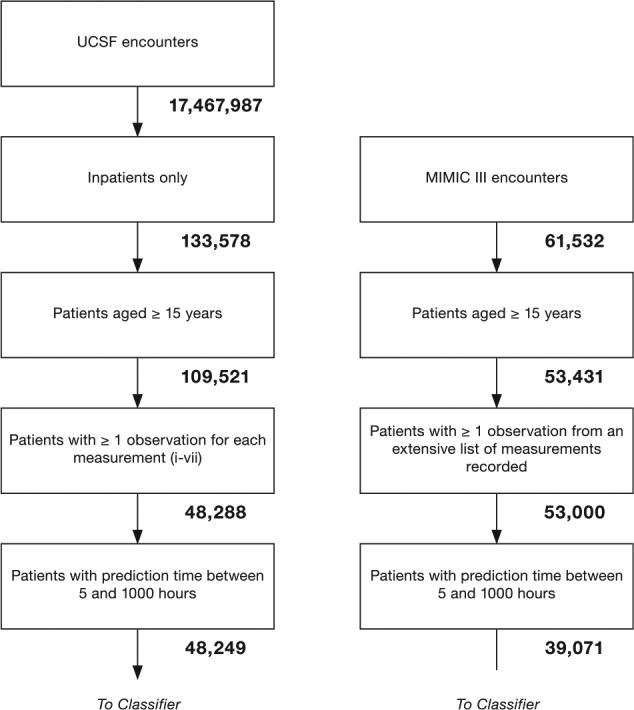
Inclusion flowcharts for UCSF target data (left) and MIMIC-III source data (right). These flowcharts illustrate the process used to obtain the final target and source data sets. The number of encounters remaining after each step is underneath the corresponding block. MIMIC-III indicates Medical Information Mart for Intensive Care-III; UCSF, University of California San Francisco.
Table 2.
Demographic comparison between MIMIC-III encounters (n = 39 071) and UCSF encounters (n = 48 249).
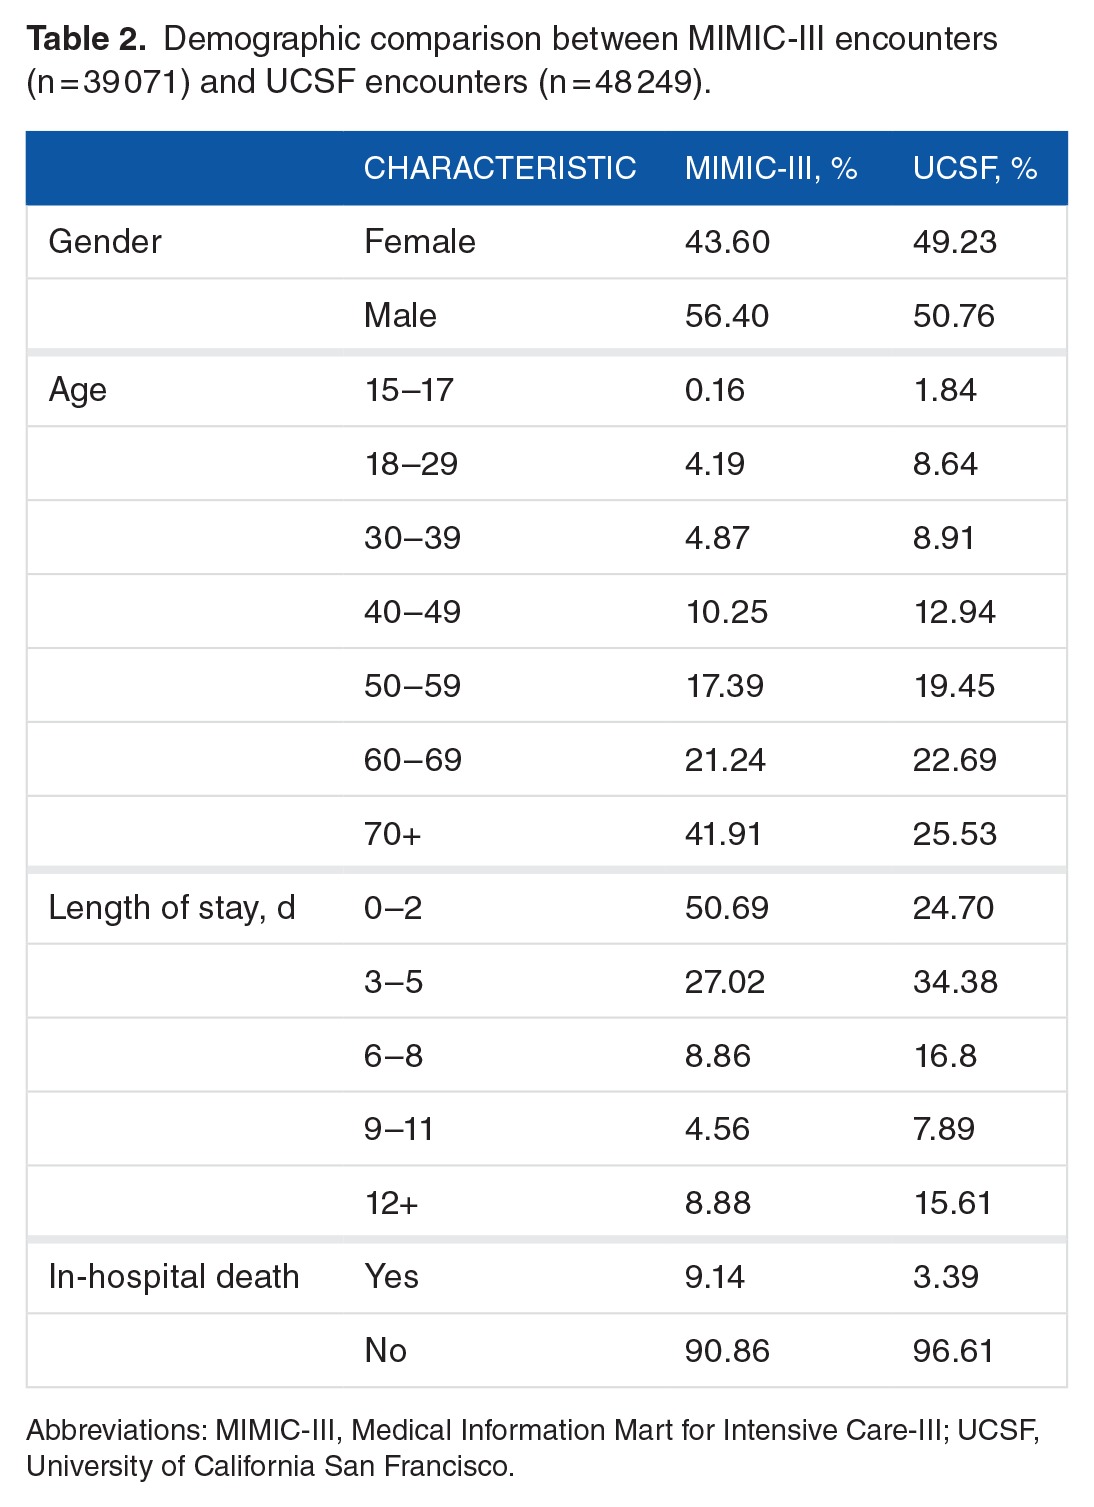
Table 3.
Top 5 patient care units, by number of encounters included in analysis, in MIMIC-III (n = 39 071) and UCSF (n = 48 249) data sets.
To create the training and testing inputs for the classifier, the patient’s discretized state was sampled over a 5-hour period from time of admission at 1-hour intervals, for each measurement present. When combined with the patient’s age, this yielded a 71-dimensional input vector, xi. The patient’s label, yi, was the binary outcome for the patient: 1 for mortality, 0 for survival. This process was executed for the source and target domains, producing source and target sets of examples, respectively, denoted and . Both of these sets were used in the classifier training scheme described below.
Model and training algorithm
For this work, we chose to use an ensemble of decision trees. Ensemble classifiers combine the output from many “weak” learners, each of which would be insufficient to solve the desired learning problem on its own. The decision trees used as the weak learners in this scheme were constructed as a series of binary conditions; for example, “Is heart rate in the current hour >100 beats per minute?” Depending on whether each of these conditions was true or false, further conditions may have been checked, and a risk score was eventually assigned. Within each tree, we limited the number of such logical “splits” to 8, in turn limiting the tree to at most 9 risk cohorts, such that each individual tree was a fairly weak predictor. However, by combining 200 such trees, the ensemble was able to produce a strong, flexible, and expressive classifier. We used a boosting algorithm22,23 to construct each ensemble, in which individual trees were created by splitting according to Gini diversity index.24
Transfer learning method
The transfer learning method provided the source (MIMIC-III) examples DS directly as additional training examples for the target, UCSF-domain classifier. To ensure that the classifier also reflected the (small) amount of UCSF data (a subset of DT), the target UCSF data were weighted more heavily than were the source domain data. The variable controlling the degree of this weighting was one of our experimental parameters of interest. Below, we denote this weight as w, the “mixture weight.” The individual examples were weighted such that the sum of all target example weights was w and the sum of all source example weights was (1 − w). Values 0⩽w⩽1 were used in the experiments; setting w = 0 corresponded to training the classifier entirely on the source domain data, and w = 1 corresponded to training entirely on the target domain data, whereas values in between smoothly transitioned between the two. This framework was analyzed theoretically by Ben-David et al.25
To simulate a new deployment to a small care facility, while employing the large UCSF set as the target, we restricted the number of target training examples used to train the classifier. By sweeping this value from very small (0.025% of the UCSF set, less than 110 encounters) to the full size of the target training data set (43 424 encounters, 90% of the UCSF set), the performance traced a learning curve. This learning curve allowed us to experimentally measure how effectively the transfer learning method decreased the amount of target training data required to reach a specified performance level.
Experimental procedures
In the experiments that follow, we studied how the amount of available target training data and their weightings control the performance of the resulting predictor. We performed 10-fold cross-validation (CV), where the entire UCSF data set was used to construct the testing folds (ie, 10 partitions into which the whole set is divided). The results in this article show CV folds constructed without explicit regarding the temporal order of the patient encounters. We also executed a similar experiment investigating contiguous blocks of patient data; although this resulted in a very small decrease in performance, the results and trends were qualitatively similar. For each testing fold, a subset of the remaining, nontesting data was used to construct a target training set. This target training set was concatenated with all labeled examples from the source data, and these 2 training subsets were weighted against one another, forming a final training set. The procedure for preparing the training and testing sets is shown diagrammatically in Figure 3. This final training set was passed to the routine which trains the classification ensemble. This routine included a nested CV procedure to select w, the key transfer parameter, from a discrete menu of values. We compared against fixed weighting schemes, with w = 0 and 1, as well as 2 other preset w values—one such that target examples were weighted approximately equally with source examples and the other so that they were weighted 5 times as heavily as source examples.
Figure 3.
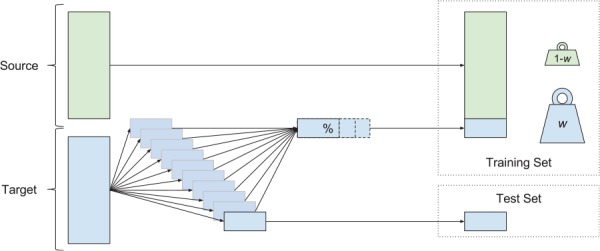
The construction of training and test sets for each cross-validation fold. Source data (green) and target data (blue) were both used in this procedure. For each of the 10 test folds, the corresponding training set was constructed using the whole source set and a variable portion of the remaining target data. During training, the examples from source and target sets received different weights. The performance of the resulting classifier was assessed on the test set.
The continuous-valued outputs which resulted when the ensemble was given the test examples (ie, the “scores” it gives, not binary labels) were then used, along with the ground truth labels on the test examples, to compute the receiver operating characteristic curve. The area under this curve (AUROC) was the key measure of classifier performance we assessed in this work. Statistical tests for AUROC comparison were conducted by pairwise t tests, where these pairs were the 2 methods compared on the same test CV fold. We also calculated test-fold Cox calibration coefficients α and β via logistic regression between the score outputs and the labels.26,27
Results
Learning curves for selected weighting choices (w’s) are shown in Figure 4. These learning curves show how the performance of the classifier improves on the target test set as the training scheme incorporates more target training data. The nested CV transfer method delivers AUROC of 0.7853 with 0.25% of the target training set and 0.8043 with 0.5% (≤220 encounters). Target-only training gives AUROCs of 0.4961 and 0.5510 for these same numbers of target training examples. For comparison, the canonical risk score MEWS28 achieves an AUROC of 0.7646, and training entirely on the source domain (w = 0) achieves AUROC 0.7831. The nested CV scheme achieves superior AUROC to each of source-only and target-only training at each training set size more than 0.25% and less than 30%, with P value ≤ .05 in all cases (fold-wise paired, 1-tailed t tests). Similarly, the fixed-w scheme in which each target example is weighted 5 times as heavily as source examples (5×) is also superior to source-only and target-only training for all training set sizes below 30% (P ≤ .05 in all cases). Target-only training is worse than MEWS until 10% of the training set is available (P < .05, all comparisons).
Figure 4.

Learning curves (mean AUROC) with increasing number of target training examples. Error bars are 1 SE. When data availability is low, target-only training exhibits lower AUROC values and high variability. AUROC indicates area under the receiver operating characteristic; CV, cross-validation. The maximum mean AUROC achieved by the nested cross validation method is 0.8498.
Figure 5 shows how Cox calibration coefficients α and β vary with the training set size. Although the bias coefficient α is typically far from the ideal value of 0, the measure of appropriate spread β is in 0 < β < 1 (indicating an over-responsive mortality predictor, relative to empirical risk) and approaches its ideal value of 1 for larger fractions of the training set and all weightings that include target data.
Figure 5.

Calibration curves giving mean regression coefficients α (offset) and β (slope) between predicted and empirical log odds for mortality, as a function of increasing number of target training examples. Error bars are 1 SE; the mean and SE are calculated using CV folds. Perfect calibration corresponds to (α, β) = (0, 1). CV indicates cross-validation.
Discussion
According to these experimental results, our implementation of transfer learning substantially improves mortality prediction over classical, target-only training, and also over the source domain classifier. The source domain classifier may be considered a reasonable choice because the mortality prediction problems in separate medical centers are expected to be similar, but there are performance improvements to be obtained by transfer learning, in part due to demographic and care practice variation. However, what is most instructive is how few data are needed for transfer learning to provide gains over the source classifier. Using the smallest target training sets tested, 0.25% of the target training set, or fewer than 110 UCSF patients, the fixed, 5 times weighted (5×) transfer scheme shows clear gains over the source domain classifier (P < .01, paired, 1-tailed t test). Furthermore, with as few as 220 patients, the AUROC of the nested CV training method is 0.8043, which is 0.02 higher than the source classifier (P < .01, paired, 1-tailed t test). Using the 5-year span of data collection for the UCSF data set as a reference, this number of patients corresponds to a period of less than 10 days. We also executed a similar experiment using a contiguous period of data from the UCSF set, where it took approximately 440 encounters to achieve the same result. This translates to a slightly longer but still a relatively short period of less than 2.5 weeks of data collection. Taking the classical, target set–only training approach, these performance levels are not attained until approximately 4000 patients are observed, an investment of approximately 6 months’ data collection. Thus, in the context of this experiment, transfer learning would substantially reduce the need for a lengthy data collection process. We note that collections such as MIMIC-III are now publicly available, and transfer learning techniques may allow hospitals to leverage these collections for their own particular prediction needs.
The comparison between the 5 times weighted (5×) scheme and the nested CV scheme is also instructive. These 2 methods achieve very similar generalization performance on this pair of data sets, and it would appear that, without running nested CV, a 5× weighting is a reasonable and robust choice. However, because there is no way of knowing a priori that 5× weighting is indeed appropriate for a new target data set, the nested CV scheme is in principle the better choice for a new deployment.
Assessing the Cox calibration coefficients of the classifiers indicated that they were typically substantially biased (α ≠ 0), although the high AUROC indicates that post hoc calibration could improve these values, and the spread of mortality probabilities appears appropriate as the amount of training data increases. We note that the classifier training scheme used in this work is not explicitly intended to produce accurate mortality probabilities, but instead to reduce classification error and improve AUROC.
One limitation of these experimental results is that they were obtained with a single classifier architecture and training algorithm. In particular, there is the possibility that using other methods of regularization or ensemble pruning could reduce the overfitting observed when giving heavy weight to a small collection of target data. This could result in improved target-only training performance, even without using transfer learning and could similarly reduce the number of target examples required to produce effective classifiers, providing an alternative means of reducing the burden of data collection. We do not claim that transfer learning is the only way to obtain good performance with small target training sets; rather, as demonstrated by these experiments, it is an effective way of doing so. Our main finding is that transfer learning is a useful tool for increasing prediction performance in clinical settings with limited data availability.
There are several important lines of work suggested by the present experiment. More sophisticated transfer learning methods29,30 might yield increased performance or be even more economical in terms of required target data. These methods may be critical for other clinical tasks; although the present methods appear sufficient for mortality prediction among inpatients, mortality is relatively frequent (9.14% and 3.39% prevalence in the final source and target sets, respectively). Even with the present methods, longer periods of clinical data acquisition will likely be necessary for predicting especially rare events. This work also only addresses unidirectional transfer between 1 source and 1 target. In practice, it may often be necessary to select the best source data set from among a library of several, to aggregate examples from sets within the library, to subselect a population from within a larger set, or to simultaneously use data from several clinical sites in a bidirectional, multitask framework. Future studies are needed to address other important practical questions, such as to how to verify that a performance specification has been achieved, estimate the remaining data which must be acquired to do so, or empirically answer the above design questions on a case-by-case basis.
Conclusions
We demonstrated the benefits of applying a simple transfer learning technique to our mortality prediction algorithm, AutoTriage, over the use of a classifier trained on the source domain or a target-only classifier. Using the MIMIC-III data set as the source data and the UCSF data as our target set, we customized our predictions to the UCSF patient population. By training the classifier using weighted combinations of source and target data, we demonstrated an increase in AUROC when as little as 0.25% of the target data were included, equivalent to 110 patients or less than 1 week of data collection. With transfer learning, we observed mortality prediction improvements for a new, target set with only a fraction of the target domain data required to train an equivalent classifier de novo (<10%). Based on this, we conclude that transfer learning techniques can substantially alleviate the burdensome, site-specific data collection requirements for producing effective clinical classifiers. Furthermore, the resulting classifier’s performance may be superior to that of the otherwise comparable, non–transfer-trained classifier.
Acknowledgments
The authors wish to acknowledge Hamid Mohamadlou, who contributed to the MATLAB code used to run these experiments; Nima Shajarian, who aided with the introduction; and Keegan Van Maanen, who assisted with figure design. They also thank the anonymous reviewers for their many helpful suggestions, which substantially improved the quality of the manuscript.
Footnotes
PEER REVIEW: Five peer reviewers contributed to the peer review report. Reviewers’ reports totaled 1738 words, excluding any confidential comments to the academic editor.
FUNDING: The author(s) disclosed receipt of the following financial support for the research, authorship, and/or publication of this article: Research reported in this publication was supported by the National Institute of Nursing Research, of the National Institutes of Health, under award number R43NR015945. The content is solely the responsibility of the authors and does not necessarily represent the official views of the National Institutes of Health.
DECLARATION OF CONFLICTING INTERESTS: The author(s) declared the following potential conflicts of interest with respect to the research, authorship, and/or publication of this article: All authors affiliated with Dascena report being employees of Dascena. Dr Chris Barton reports receiving consulting fees from Dascena. Dr Chris Barton and Dr Grant Fletcher report receiving grant funding from Dascena.
Author Contributions
TD, QM, and RD conceived and designed the study. TD, QM, and MJ prepared the requisite data and code tools. TD executed experiments and analyzed the data. TD, JH, JC, MJ, GF, YK, CB, UC, and RD interpreted the data. TD, JH, MJ, and JC wrote the first draft of the manuscript. TD, JH, JC, MJ, GF, YK, CB, UC, and RD redrafted the manuscript. All authors approved the final manuscript and assume joint responsibility for its content.
REFERENCES
- 1.Calvert JS, Price DA, Barton CW, Chettipally UK, Das R. Discharge recommendation based on a novel technique of homeostatic analysis. J Am Med Inform Assoc. 2016;24:24–29. doi: 10.1093/jamia/ocw014. [DOI] [PMC free article] [PubMed] [Google Scholar]
- 2.Calvert J, Desautels T, Chettipally U, et al. High-performance detection and early prediction of septic shock for alcohol-use disorder patients. Ann Med Surg (Lond) 2016;8:50–55. doi: 10.1016/j.amsu.2016.04.023. [DOI] [PMC free article] [PubMed] [Google Scholar]
- 3.Calvert JS, Price DA, Chettipally UK, et al. A computational approach to early sepsis detection. Comput Biol Med. 2016;74:69–73. doi: 10.1016/j.compbiomed.2016.05.003. [DOI] [PubMed] [Google Scholar]
- 4.Calvert J, Mao Q, Rogers AJ, et al. A computational approach to mortality prediction of alcohol use disorder inpatients. Comput Biol Med. 2016;75:74–79. doi: 10.1016/j.compbiomed.2016.05.015. [DOI] [PubMed] [Google Scholar]
- 5.Desautels T, Calvert J, Hoffman J, et al. Prediction of sepsis in the intensive care unit with minimal electronic health record data: a machine learning approach. JMIR Med Inform. 2016;4:e28. doi: 10.2196/medinform.5909. [DOI] [PMC free article] [PubMed] [Google Scholar]
- 6.Calvert J, Mao Q, Hoffman JL, et al. Using electronic health record collected clinical variables to predict medical intensive care unit mortality. Ann Med Surg (Lond) 2016;11:52–57. doi: 10.1016/j.amsu.2016.09.002. [DOI] [PMC free article] [PubMed] [Google Scholar]
- 7.Nachimuthu SK, Haug PJ. Early detection of sepsis in the emergency department using dynamic Bayesian networks. AMIA Annu Symp Proc. 2012;2012:653–662. [PMC free article] [PubMed] [Google Scholar]
- 8.Henry KE, Hager DN, Pronovost PJ, Saria S. A targeted real-time early warning score (TREWScore) for septic shock. Sci Transl Med. 2015;7:299ra122. doi: 10.1126/scitranslmed.aab3719. [DOI] [PubMed] [Google Scholar]
- 9.Celi LA, Galvin S, Davidzon G, Lee J, Scott D, Mark R. A database-driven decision support system: customized mortality prediction. J Pers Med. 2012;2:138–148. doi: 10.3390/jpm2040138. [DOI] [PMC free article] [PubMed] [Google Scholar]
- 10.Subbe C, Slater A, Menon D, Gemmell L. Validation of physiological scoring systems in the accident and emergency department. Emerg Med J. 2006;23:841–845. doi: 10.1136/emj.2006.035816. [DOI] [PMC free article] [PubMed] [Google Scholar]
- 11.Vincent J, Moreno R, Takala J, et al. The SOFA (Sepsis-related Organ Failure Assessment) score to describe organ dysfunction/failure. On behalf of the working group on sepsis-related problems of the European Society of Intensive Care Medicine. Intensive Care Med. 1996;22:707–710. doi: 10.1007/BF01709751. [DOI] [PubMed] [Google Scholar]
- 12.Knaus WA, Draper EA, Wagner DP, Zimmerman JE. APACHE II: a severity of disease classification system. Crit Care Med. 1985;13:818–829. [PubMed] [Google Scholar]
- 13.Lee A, Bishop G, Hillman K, et al. The medical emergency team. Anaesth Intensive Care. 1995;7:183–186. doi: 10.1177/0310057X9502300210. [DOI] [PubMed] [Google Scholar]
- 14.Bone RC. Toward an epidemiology and natural history of SIRS (systemic inflammatory response syndrome) JAMA. 1992;268:3452–3455. [PubMed] [Google Scholar]
- 15.Pan SJ, Yang Q. A survey on transfer learning. IEEE T Knowl Data En. 2010;22:1345–1359. [Google Scholar]
- 16.van Opbroek A, Vernooij MW, de Bruinje M. Transfer learning improves supervised image segmentation across imaging protocols. IEEE Trans Med Imaging. 2015;34:1018–1030. doi: 10.1109/TMI.2014.2366792. [DOI] [PubMed] [Google Scholar]
- 17.Wiens J, Guttag J, Horvitz E. A study in transfer learning: leveraging data from multiple hospitals to enhance hospital-specific predictions. J Am Med Inform Assoc. 2014;21:699–706. doi: 10.1136/amiajnl-2013-002162. [DOI] [PMC free article] [PubMed] [Google Scholar]
- 18.Wiens J, Guttag J, Horvitz E. Patient risk stratification with time-varying parameters: a multitask learning approach. J Mach Learn Res. 2016;17:1–23. [Google Scholar]
- 19.Gong JJ, Sundt TM, Rawn JD, Guttag JV. Instance weighting for patient-specific risk stratification models; Proceedings of the 21th ACM SIGKDD International Conference on Knowledge Discovery and Data Mining; Sydney, NSW. August 10-13, 2015; pp. 369–378. [Google Scholar]
- 20.Le Gall J-R, Lemeshow S, Salunier F. A new Simplified Acute Physiology Score (SAPS II) based on a European/North American multicenter study. JAMA. 1993;270:2957–2963. doi: 10.1001/jama.270.24.2957. [DOI] [PubMed] [Google Scholar]
- 21.Johnson AEW, Pollard TJ, Shen L. MIMIC-III a freely accessible critical care database [published online ahead of print May 24, 2016] Sci Data. doi: 10.1038/sdata.2016.35. [DOI] [PMC free article] [PubMed] [Google Scholar]
- 22.Freund Y, Schapire RE. A decision-theoretic generalization of on-line learning and an application to boosting. J Comput Syst Sci. 1997;55:119–139. [Google Scholar]
- 23.Luo Z, Schölkopf B, Vovk V. Chapter 5. Explaining AdaBoost. In: Schapire RE, editor. Empirical Inference: Festschrift in Honor of Vladimir N. Vapnik. Berlin, Germany: Springer; 2016. pp. 37–52. [Google Scholar]
- 24.Narsky I, Porter FC. Statistical Analysis Techniques in Particle Physics (Chapter 14) Hoboken, NJ: Wiley; 2014. [Google Scholar]
- 25.Ben-David S, Blitzer J, Crammer K, Kulesza A, Pereira F, Vaughan J. A theory of learning from different domains. Mach Learn. 2010;79:151–175. [Google Scholar]
- 26.Cox DR. Two further applications of a model for binary regression. Biometrica. 1958;45:562–565. [Google Scholar]
- 27.Miller ME, Hui SL, Tierney WM. Validation techniques for logistic regression models. Stat Med. 1991;10:1213–1226. doi: 10.1002/sim.4780100805. [DOI] [PubMed] [Google Scholar]
- 28.Subbe CP, Slater A, Menon D, Gemmell L. Validation of physiological scoring systems in the accident and emergency department. Emerg Med J. 2006;23:841–845. doi: 10.1136/emj.2006.035816. [DOI] [PMC free article] [PubMed] [Google Scholar]
- 29.Borgwardt KM, Gretton A, Rasch JM, Kriegel HP, Schölkopf B, Smola AJ. Integrating structured biological data by Kernel Maximum Mean Discrepancy. Bioinformatics. 2006;22:e49–e57. doi: 10.1093/bioinformatics/btl242. [DOI] [PubMed] [Google Scholar]
- 30.Gong M, Zhang K, Liu T, Tao D, Glymour C, Schölkopf B. Domain adaptation with conditional transferable components. JMLR Workshop Conf Proc. 2016;48:2839–2848. [PMC free article] [PubMed] [Google Scholar]