

Abstract
Background
Impaired glucose tolerance (IGT) is characterized by insulin resistance and causes atherosclerosis. Hyperhomocysteinemia is associated with insulin resistance and predicts cardiovascular diseases. In this study, we assessed the possible association between homocysteine and IGT.
Material/Methods
This was a cross-sectional study of 118 consecutive subjects with IGT (IGT group) and 128 consecutive subjects with normal glucose tolerance (NGT group). Homocysteine and clinical characteristics were measured.
Results
The IGT group had higher homocysteine than the NGT group [18.00 (14.00, 22.25) vs. 12.50 (9.00, 15.00) μmol/L, p<0.001]. Homocysteine was positively associated with body mass index (BMI) (r=0.178, p=0.005), triglycerides (r=0.306, p<0.001), fasting blood glucose (FBG) (r=0.312, p<0.001), 2-hour postchallenge glucose (2hPG) (r=0.363, p<0.001), fasting insulin (FINS) (r=0.655, p<0.001), and homeostasis model assessment for insulin resistance (HOMA-IR) (r=0.643, p<0.001), and was negatively correlated with high-density lipoprotein cholesterol (HDL-C) (r=−0.250, p<0.001). After controlling for confounders, hyperinsulinemia (β=7.430, p<0.001) was independently related to hyperhomocysteinemia. In a logistic regression analysis, high triglycerides (OR=1.177, p<0.001) and homocysteine (OR=1.508, p=0.007), and low HDL-C (OR=0.315, p=0.026) were associated with IGT.
Conclusions
Patients with IGT have higher homocysteine levels compared with subjects with normal glucose tolerance, and hyperhomocysteinemia might be correlated with IGT.
MeSH Keywords: Hyperhomocysteinemia, Hyperinsulinism, Prediabetic State
Background
Homocysteine (Hcy) is a sulfur-containing amino acid formed during the metabolism of methionine. Hyperhomocysteinemia (HHcy) has been widely considered as the major determinant of the various cardiovascular diseases [1]. Although endothelial dysfunction [2], oxidative damage [3], and inflammation [4] have been demonstrated to be involved in the detrimental effects of HHcy on the cardiovascular system, the mechanisms by which HHcy accelerates cardiovascular diseases still need further investigation.
Accumulating evidence has showed that HHcy is correlated with hyperinsulinemia and increased insulin resistance [5,6], although there has been a negative correlation or no association between Hcy and the insulin resistance or insulin levels reported in some research [7,8]. Insulin resistance and hyperinsulinemia are the predictors of cardiovascular diseases [9]. Thus, the correlation between HHcy and increased insulin resistance or hyperinsulinemia might be one of the major causes of the cardiovascular diseases induced by HHcy.
Diabetes increases cardiovascular risk. Based on previous research, increased concentrations of Hcy have been found in diabetes [10,11]. However, the relationship between HHcy and insulin resistance diseases is unclear. A number of studies have found that the HHcy promotes the development of insulin resistance diseases, such as metabolic syndrome and type 2 diabetes [12–14], although this effect has been questioned by some other studies [7].
Impaired glucose tolerance (IGT), an intermediate stage between normal glucose tolerance (NGT) and overt type 2 diabetes, may be induced by insulin resistance and can lead to the development of type 2 diabetes [15] and cardiovascular diseases [16]. However, the precise mechanisms have not yet been fully defined.
Therefore, it is of interest to assess the association between Hcy and IGT. However, to the best of our knowledge, whether Hcy is involved in the etiology of IGT has not been reported. In this cross-sectional study, we investigated the possible link between Hcy and the probability of being IGT.
Material and Methods
Participants
In this cross-sectional study, the sample sizes of IGT participants or NGT participants were calculated as more than 10 times of the number of variables which were adjusted in the logistic regression analysis to determine the parameters that were independently associated with IGT. These variables, verified from sex, age, body mass index (BMI), systolic blood pressure (SBP), diastolic blood pressure (DBP), total cholesterol (TC), high-density lipoprotein cholesterol (HDL-C), low-density lipoprotein cholesterol (LDL-C), triglycerides (TG), and Hcy, were significantly different between IGT patients and normal glucose tolerance (NGT) subjects. Thus, the sample size for each group was more than 100.
The 75-g oral glucose tolerance test (OGTT) was performed for each participant to identify their stage of glucose metabolism. There were 118 consecutive participants diagnosed with IGT (the IGT group) and 128 consecutive subjects with NGT (the NGT group), as defined by the American Diabetes Association criteria [17], eligible for the study from October 2015 to July 2016, from a group of outpatients at the Department of Endocrinology, Beijing Chao-Yang Hospital, Capital Medical University, Beijing, China.
All participants (males and females) included in the study ranged in age from 30 to 70 years, accepted to answer the questionnaire and donate blood samples, and provided written informed consent. Each person could participate only once in the study.
The following exclusion criteria for the IGT group were applied: diabetes, impaired fasting glucose, and normal glucose tolerance. None of the NGT group subjects had a history of prediabetes (including impaired fasting glucose and impaired glucose tolerance) or diabetes. People with hypertension, coronary artery disease, endocrine disease, systemic inflammatory disease, infectious disease, cancer, liver or renal function impairment were excluded from both groups. People taking vitamins or folic acid, using lipid-lowering agents, or being treated with drugs which could affect glycometabolism were also excluded from the study.
The study protocol was approved by the Medicine and Pharmacy Ethics Committee of Beijing Chao-Yang Hospital, Capital Medical University (no. 2014-ke-135). Written informed consent was obtained from each participant.
Data collection and laboratory tests
A complete medical history was obtained from each participant, including duration and treatment of any disease. Blood pressure was measured using a calibrated mercury sphygmomanometer. All readings were measured from the non-dominant arm after a 5-minute rest, with the patients in the sitting position. Weight and height were measured, without shoes and in light clothing, to the nearest 0.1 kg and 1×10⁻⁴ m, respectively, by the same trained group. BMI was computed by weight (kg)/[height (m)]2. Blood samples were collected in the morning after an 8-hour overnight fast. Blood samples of all participants were stored at −80°C.
TC, HDL-C, LDL-C, TG, fasting insulin (FINS), fasting blood glucose (FBG), 2-hour postchallenge glucose (2hPG), and Hcy were assessed in the central laboratory of Beijing Chao-Yang Hospital, Capital Medical University. Serum insulin levels were determined by the electrochemiluminescence method using an Elecsys-2010 Automatic Electrochemical Immuno-analyser (Roche Corporation). Hcy concentrations were determined by the clinical chemistry method. Blood glucose levels were detected using the glucose oxidase method. Blood lipids were detected as follows: TC was measured by an enzymatic cholesterol oxidase reaction, HDL-C and LDL-C were measured by the direct assay, and TG was measured by a glycerol lipase oxidase reaction. Serum glucose, lipid, and Hcy levels were analyzed using a Dade Behring Dimension RXL Max Chemistry Analyzer (Siemens, Germany). The insulin resistance was measured based on the following formula: the homeostasis model assessment for insulin resistance (HOMA-IR) was measured as FBG (mmol/L)×FINS (mIU/L)/22.5.
Statistical analysis
All analyses were performed using Statistical Package for Social Sciences version 19.0 (SPSS, Inc., Chicago, IL, USA). The normality of the data distribution was verified using the Kolmogorov-Smirnov test. Normally distributed data are expressed as means ± standard deviations. Non-normally distributed data are expressed as medians with 25th and 75th percentiles. Comparisons of the clinical and biochemical markers between the 2 groups were performed using the independent-samples t test and the Mann-Whitney U Test. Proportions were analyzed using the chi-squared test. The associations between Hcy and other parameters were examined using Pearson’s and Spearman’s correlation coefficient analyses. Hcy did not fit a normal distribution in our present study. However, the data were normally distributed after logarithmic transformation. Variables with a p value < 0.05 in Pearson’s and Spearman’s correlation coefficient analyses were retained for the multiple stepwise regression analysis of the association between the parameters and Hcy. Additionally, variables (except for parameters of glucose metabolism) which were statistically different between 2 groups were retained for the logistic regression analysis to determine the variables that were independently correlated with IGT. In all statistical tests, p values <0.05 were considered significant, and all tests were two-sided.
Results
Clinical characteristics of individuals in the IGT and NGT groups
The clinical characteristics of the participants are summarized in Table 1.
Table 1.
Baseline clinical characteristics of the study participants.
| Parameters | IGT group (n=118) | NGT group (n=128) | p Value |
|---|---|---|---|
| Sex (M/F) | 67/61 | 71/47 | 0.217 |
| Age (years) | 56.12±8.52 | 57.34±7.50 | 0.235 |
| BMI (kg/m2) | 26.47±4.68 | 24.43±3.55 | <0.001 |
| SBP (mmHg) | 127.76±6.82 | 126.55±7.23 | 0.177 |
| DBP (mmHg) | 75.50±6.49 | 74.30±7.57 | 0.181 |
| TC (mmol/L) | 5.13±1.04 | 4.89±0.92 | 0.057 |
| HDL-C (mmol/L) | 1.34±0.28 | 1.52±0.33 | <0.001 |
| LDL-C (mmol/L) | 3.10±0.74 | 2.88±0.75 | 0.018 |
| TG (mmol/L) | 2.32 (1.41, 2.79) | 1.35 (0.78, 2.32) | <0.001 |
| FBG (mmol/L) | 6.34±0.49 | 5.56±0.42 | <0.001 |
| 2hPG (mmol/L) | 9.35±0.88 | 5.96±1.21 | <0.001 |
| FINS (mIU/L) | 14.60 (10.30, 16.90) | 7.30 (5.27, 11.80) | <0.001 |
| HOMA-IR | 4.23 (2.91, 5.25) | 1.87 (1.38, 2.94) | <0.001 |
| Hcy (μmol/L) | 18.00 (14.00, 22.25) | 12.25 (9.00, 15.00) | <0.001 |
IGT group – subjects with impaired glucose tolerance; NGT group – subjects with normal glucose tolerance; BMI – body mass index; SBP – systolic blood pressure; DBP – diastolic blood pressure; TC – total cholesterol; HDL-C – high-density lipoprotein cholesterol; LDL-C – low-density lipoprotein cholesterol; TG – triglycerides; FBG – fasting blood glucose; 2hPG – 2-hour postchallenge glucose; FINS – fasting insulin; HOMA-IR – homeostasis model assessment for insulin resistance; Hcy – homocysteine.
Levels of Hcy in the IGT and NGT groups
The levels of Hcy were significantly higher in the IGT group than those in NGT group [18.00 (14.00, 22.25) μmol/L vs. 12.50 (9.00, 15.00) μmol/L, p<0.001] (Figure 1).
Figure 1.
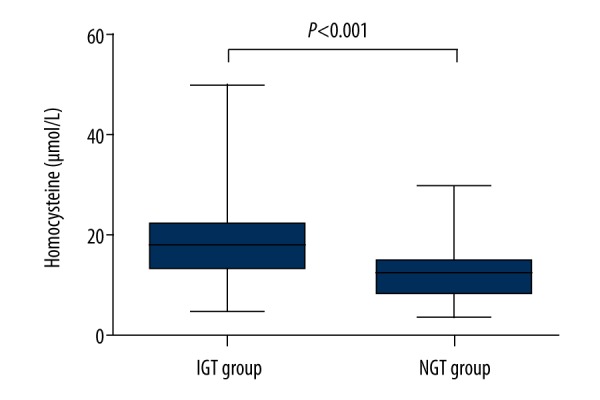
Homocysteine levels in the study participants. The values are expressed as medians (25th and 75th percentiles). IGT group, subjects with impaired glucose tolerance (n=118); NGT group, subjects with normal glucose tolerance (n=128).
Correlation between Hcy and other parameters
Hcy was positively associated with BMI (r=0.178, p=0.005), TG (r=0.306, p<0.001), FBG (r=0.312, p<0.001), 2hPG (r=0.363, p<0.001), FINS (r=0.655, p<0.001), and HOMA-IR (r=0.643, p<0.001), and was negatively correlated with HDL-C (r=−0.250, p<0.001) (Table 2).
Table 2.
Correlation analyses of the baseline parameters associated with homocysteine.
| Parameters | r | p Value |
|---|---|---|
| Age (years) | −0.088 | 0.171 |
| BMI (kg/m2) | 0.178 | 0.005 |
| SBP (mmHg) | 0.055 | 0.389 |
| DBP (mmHg) | 0.023 | 0.721 |
| TC (mmol/L) | −0.005 | 0.941 |
| HDL-C(mmol/L) | −0.250 | <0.001 |
| LDL-C (mmol/L) | 0.068 | 0.285 |
| TG (mmol/L) | 0.306 | <0.001 |
| FBG (mmol/L) | 0.312 | <0.001 |
| 2hPG (mmol/L) | 0.363 | <0.001 |
| FINS (mIU/L) | 0.655 | <0.001 |
| HOMA-IR | 0.643 | <0.001 |
BMI – body mass index; SBP – systolic blood pressure; DBP – diastolic blood pressure; TC – total cholesterol; HDL-C – high-density lipoprotein cholesterol; LDL-C – low-density lipoprotein cholesterol; TG – triglycerides; FBG – fasting blood glucose; 2hPG – 2-hour postchallenge glucose; FINS – fasting insulin; HOMA-IR – homeostasis model assessment for insulin resistance.
Multiple stepwise regression analysis was performed to determine which parameters were independently associated with Hcy. The results showed that after adjusting for the confounders, the increased FINS (β=0.050, p<0.001) was independently related to high Hcy (Table 3). The model had an adjusted R-squared value of 0.374 (F=147.085 and p<0.001).
Table 3.
Multiple regression analysis of the parameters associated with homocysteine.
| Parameters | β | SE | 95% CI | Standardized β | p value |
|---|---|---|---|---|---|
| Constant | 2.080 | 0.053 | 1.976~2.184 | <0.001 | |
| FINS (mIU/L) | 0.050 | 0.004 | 0.042~0.058 | 0.613 | <0.001 |
SE – standard error; CI – confidence interval; FINS – fasting insulin. Adjustment for the variables with a p value <0.05 in Pearson’s and Spearman’s correlation coefficient analyses: BMI – body mass index; HDL-C – high-density lipoprotein cholesterol; TG – triglycerides; FBG – fasting blood glucose, 2hPG – 2-hour postchallenge glucose; HOMA-IR – FINS, and homeostasis model assessment for insulin resistance.
Logistic regression analysis of the parameters associated with IGT
The adjusted results of the logistic regression analysis of the associations between the parameters and IGT are shown in Table 4. TG, Hcy, and HDL-C were independently associated with IGT: TG (OR=1.177, p<0.001) and Hcy (OR=1.508, p=0.007) were positively associated with IGT, and HDL-C (OR=0.315, p=0.026) was inversely associated with IGT.
Table 4.
Logistic regression of the parameters associated with IGT.
| β | SE | OR | 95% CI | p Value | |
|---|---|---|---|---|---|
| HDL-C (mmol/L) | −1.155 | 0.518 | 0.315 | 0.114~0.869 | 0.026 |
| Hcy (μmol/L) | 0.411 | 0.153 | 1.508 | 1.117~2.037 | 0.007 |
| TG (mmol/L) | 0.163 | 0.030 | 1.177 | 1.110~1.247 | <0.001 |
IGT – impaired glucose tolerance; SE – standard error; OR – odds ratio; CI – confidence interval; HDL-C – high-density lipoprotein cholesterol; Hcy – homocysteine; TG – triglycerides. Adjustment for BMI body mass index; HDL-C – high-density lipoprotein cholesterol; LDL-C – low-density lipoprotein cholesterol; TG – triglycerides; Hcy – homocysteine.
Discussion
In the present study, patients with IGT presented significantly higher levels of Hcy than subjects with NGT, similar to several previous studies reporting that the increased levels of Hcy were documented in patients with both type 1 and type 2 diabetes [10,11]. IGT is characterized by high postprandial blood glucose levels, which are frequently correlated with more damaging effects on the vasculature, including the activation of abnormal vasomotion, up-regulated inflammatory responses, increased oxidative stress, and an extensive procoagulant state [18]. However, the mechanism by which IGT interferes with the cardiovascular system has not been fully defined. A growing body of evidence shows the effects of nontraditional atherosclerotic risk factors, such as HHcy.
Hcy was positively associated with FINS and HOMA-IR in our study. These findings were in contrast to some studies suggesting that there was no relationship or a negative link between Hcy and the insulin levels or insulin resistance [7,8]. However, most recent studies indicated that HHcy was associated with hyperinsulinemia or high insulin resistance in patients with insulin resistance diseases [5,6]. In addition, the attenuation in Hcy has been demonstrated to be associated with the decrease in insulin resistance and the improvement in endothelial function in individuals with metabolic syndrome who take vitamin B12 and folic acid [19]. It is possible that these controversial data might be induced by the poly-pharmacotherapy and other confounding parameters of the study populations, such as age, sex, or race.
The positive association between HHcy and elevated insulin resistance or hyperinsulinemia might be caused by the insulin-mediated reduction in the activity of key enzymes which govern the remethylation pathway or control the transsulfuration pathway [20,21]. Additionally, Hcy thiolactone has been documented to repress insulin signaling through elevating oxidative stress [22]. Moreover, both interleukin (IL) -6 and insulin resistance have been reported to be independently related to Hcy values in type 2 diabetes [23]. HHcy has been found to promote IL-6 produced by monocytes and endothelial cells [24,25], and IL-6 is likely to suppress insulin signaling and increase insulin resistance [26]. Hence, the activation of IL-6 links HHcy to high insulin resistance and hyperinsulinemia. Furthermore, HHcy induces endoplasmic reticulum stress, activates c-Jun N-terminal kinase, promotes inflammatory cytokine production, and facilitates macrophage infiltration, which could lead to reducing insulin sensitivity in adipose tissue [27].
Insulin resistance and hyperinsulinemia have been proposed as the predictors of cardiovascular diseases [9]. Large prospective studies have shown that fasting insulin values and insulin resistance are positively correlated with the risk of atherosclerosis or the incidence of major cardiovascular events [28,29]. Numerous abnormalities have been documented as a probable explanation of atherosclerosis caused by increased insulin resistance or hyperinsulinemia, such as abnormal LDL-C particles, endothelial dysfunction, elevated oxidative stress, increased expression of adhesion molecules, and decreased fibrinolytic activity [30]. We found that HHcy was related to hyperinsulinemia, and insulin resistance linked HHcy to cardiovascular diseases.
In addition, obesity, hypertriglyceridemia, and low HDL-C levels predict high insulin resistance and are the main causes of atherosclerotic diseases. Our present results of the positive relation between Hcy and BMI and TG, and the finding of the inverse correlation between Hcy and HDL-C also show the correlation between HHcy and atherogenesis [1].
Importantly, we reported for the first time in the present cross-sectional study that HHcy might be independently associated with the probability of being IGT. HHcy has been proven in recent studies to promote the progression of metabolic syndrome [12,13] and type 2 diabetes [14], which are characterized by insulin resistance. However, it unclear whether HHcy portends the progression of insulin resistance diseases.
The results of the positive link between Hcy levels and insulin values and insulin resistance might partially explain the potential mechanism by which HHcy stimulates the earlier initiation of hyperglycemia. Recent studies have documented that insulin resistance is an independent risk factor for the progression of abnormal glucose metabolism [31]. Insulin resistance drives a compensatory elevation in insulin secretion during the compensatory stage of glucose metabolism and the early stage of abnormal glycometabolism [32]. However, if insulin resistance is sustained, the insulin secretion will eventually decrease, with the deterioration of β cell function due to the chronic overload of islet β cells. When insulin production is insufficient, overt hyperglycemia will appear. Hence, IGT might be the result of chronic exposure to severe insulin resistance and hyperinsulinemia, which is at least partly induced by HHcy. Therefore, patients with HHcy might be at high risk for IGT.
Oxidative stress might also be involved in the precise mechanism linking HHcy to abnormal glycometabolism. HHcy inhibits the synthesis of glutathione (GSH), the major intracellular antioxidant. The depletion of GSH is related to high oxidative stress [33]. Several studies have suggested that oxidative stress occurs in the context of type 2 diabetes pathology [34,35]. Thus, HHcy might also promote hyperglycemia partially through oxidative stress-mediated parthenogenesis.
Moreover, high TG [36], low HDL-C [37], and abdominal adiposity [38] have been demonstrated to predict the development of IGT in some prospective studies. In our previous study, apolipoprotein A-I, a major apolipoprotein constituent of HDL-C, was found to be independently correlated with IGT [39]. In our present study, Hcy levels were found to be positively associated with BMI and TG, and to be negatively correlated with HDL-C, which might also suggest that HHcy is the factor influencing the probability of being IGT.
The limitations of our study are as follows. First, our study population was limited to Chinese individuals. Therefore, our results may not be directly applicable to other populations. Second, our research was a single-center study, and our sample size was small; hence, our results were not powerful enough to account for potentially confounding factors in our analyses, and our findings might have been improperly affected by some outliers. Third, the cross-sectional design of the present study does not allow us to determine the existence of a causal relationship, but rather provides evidence for the association between HHcy and having impaired glucose tolerance. Our study certainly raises credible hypotheses to be confirmed and extended by future prospective cohort and mechanistic studies. A follow-up study will be necessary to evaluate whether HHcy independently promotes disease progression. Fourth, our study estimated insulin resistance based on HOMA-IR rather than by a more precise method, such as the hyperinsulinemic euglycemic clamp technique. Fifth, we did not detect vitamin B12 or folic acid concentrations, which might affect Hcy values [40]. However, individuals who had been treated with vitamins or folic acid were excluded from our research to limit their influences on Hcy.
Conclusions
We reported that there might be a significant increase of Hcy in patients with IGT compared with subjects with NGT, and found that there might be a positive correlation between Hcy values and fasting insulin levels. More importantly, we demonstrated that there might be an association between HHcy and the probability of having impaired glucose tolerance. These results indicate that Hcy might play a critical role in regulating glucose metabolism.
Footnotes
Source of support: This work was supported by grants from the Collaboration Project of Basic and Clinical Research of Capital Medical University (No. 17JL21), the Principal Research Project of Capital Medical University (No. 2016JYY130), and the Undergraduate Scientific Researching Innovation Project of Capital Medical University (No. XSKY2016143) to Xiaomeng Feng
Competing interests
The authors declare that they have no competing interests.
References
- 1.Mahalle N, Kulkarni MV, Garg MK, Naik SS. Vitamin B12 deficiency and hyperhomocysteinemia as correlates of cardiovascular risk factors in Indian subjects with coronary artery disease. J Cardiol. 2013;61(4):289–94. doi: 10.1016/j.jjcc.2012.11.009. [DOI] [PubMed] [Google Scholar]
- 2.Welch GN, Loscalzo J. Homocysteine and atherothrombosis. N Engl J Med. 1998;338(15):1042–50. doi: 10.1056/NEJM199804093381507. [DOI] [PubMed] [Google Scholar]
- 3.Starkebaum G, Harlan JM. Endothelial cell injury due to copper-catalyzed hydrogen peroxide generation from homocysteine. J Clin Invest. 1986;77(4):1370–76. doi: 10.1172/JCI112442. [DOI] [PMC free article] [PubMed] [Google Scholar]
- 4.Zeng X, Dai J, Remick DG, Wang X. Homocysteine-mediated expression and secretion of monocyte chemoattractant protein-1 and interleukin-8 in human monocytes. Circ Res. 2003;93(4):311–20. doi: 10.1161/01.RES.0000087642.01082.E4. [DOI] [PubMed] [Google Scholar]
- 5.Meigs JB, Jacques PF, Selhub J, et al. Fasting plasma homocysteine levels in the insulin resistance syndrome: The Framingham Offspring Study. Diabetes Care. 2001;24(8):1403–10. doi: 10.2337/diacare.24.8.1403. [DOI] [PubMed] [Google Scholar]
- 6.Surdacki A, Stochmal E, Szurkowska M, et al. Nontraditional atherosclerotic risk factors and extent of coronary atherosclerosis in patients with combined impaired fasting glucose and impaired glucose tolerance. Metabolism. 2007;56(1):77–86. doi: 10.1016/j.metabol.2006.08.023. [DOI] [PubMed] [Google Scholar]
- 7.Gillum R. Distribution of serum total homocysteine and its association with diabetes and cardiovascular risk factors of the insulin resistance syndrome in Mexican American men: the Third National Health and Nutrition Examination Survey. Nutr J. 2003;2:6. doi: 10.1186/1475-2891-2-6. [DOI] [PMC free article] [PubMed] [Google Scholar]
- 8.Bar-On H, Kidron M, Friedlander Y, et al. Plasma total homocysteine levels in subjects with hyperinsulinemia. J Intern Med. 2000;247(2):287–94. doi: 10.1046/j.1365-2796.2000.00592.x. [DOI] [PubMed] [Google Scholar]
- 9.Theuma P, Fonseca VA. Inflammation, insulin resistance, and atherosclerosis. Metab Syndr Relat D. 2004;2(2):105–13. doi: 10.1089/met.2004.2.105. [DOI] [PubMed] [Google Scholar]
- 10.Hofmann MA, Kohl B, Zumbach MS, et al. Hyperhomocyst(e)inemia and endothelial dysfunction in IDDM. Diabetes Care. 1997;20(12):1880–86. doi: 10.2337/diacare.20.12.1880. [DOI] [PubMed] [Google Scholar]
- 11.Munshi MN, Stone A, Fink L, Fonseca V. Hyperhomocysteinemia following a methionine load in patients with non-insulin-dependent diabetes mellitus and macrovascular disease. Metabolism. 1996;45(1):133–35. doi: 10.1016/s0026-0495(96)90211-5. [DOI] [PubMed] [Google Scholar]
- 12.Catena C, Colussi G, Nait F, et al. Elevated homocysteine levels are associated with the metabolic syndrome and cardiovascular events in hypertensive patients. Am J Hypertens. 2015;28(7):943–50. doi: 10.1093/ajh/hpu248. [DOI] [PubMed] [Google Scholar]
- 13.Yakub M, Schulze KJ, Khatry SK, et al. High plasma homocysteine increases risk of metabolic syndrome in 6-to-8-year-old children in rural Nepal. Nutrients. 2014;6(4):1649–61. doi: 10.3390/nu6041649. [DOI] [PMC free article] [PubMed] [Google Scholar]
- 14.Cho NH, Lim S, Jang HC, et al. Elevated homocysteine as a risk factor for the development of diabetes in women with a previous history of gestational diabetes mellitus. Diabetes Care. 2005;28(11):2750–55. doi: 10.2337/diacare.28.11.2750. [DOI] [PubMed] [Google Scholar]
- 15.Gerstein HC, Santaguida P, Raina P, et al. Annual incidence and relative risk of diabetes in people with various categories of dysglycemia: A systematic overview and meta-analysis of prospective studies. Diabetes Res Clin Pract. 2007;78(3):305–12. doi: 10.1016/j.diabres.2007.05.004. [DOI] [PubMed] [Google Scholar]
- 16.Tominaga M, Eguchi H, Manaka H, et al. Impaired glucose tolerance is a risk factor for cardiovascular disease, but not impaired fasting glucose. The Funagata Diabetes Study. Diabetes Care. 1999;22(6):920–24. doi: 10.2337/diacare.22.6.920. [DOI] [PubMed] [Google Scholar]
- 17.American Diabetes Association. Classification and diagnosis of diabetes. Diabetes Care. 2015;38(Suppl):S8–16. doi: 10.2337/dc15-S005. [DOI] [PubMed] [Google Scholar]
- 18.Ceriello A. Impaired glucose tolerance and cardiovascular disease: the possible role of post-prandial hyperglycemia. Am Heart J. 2004;147(5):803–7. doi: 10.1016/j.ahj.2003.11.020. [DOI] [PubMed] [Google Scholar]
- 19.Setola E, Monti LD, Galluccio E, et al. Insulin resistance and endothelial function are improved after folate and vitamin B12 therapy in patients with metabolic syndrome: Relationship between homocysteine levels and hyperinsulinemia. Eur J Endocrinol. 2004;151(4):483–89. doi: 10.1530/eje.0.1510483. [DOI] [PubMed] [Google Scholar]
- 20.Fonseca V, Keebler M, Dicker-Brown A, et al. The effect of troglitazone on plasma homocysteine, hepatic and red blood cell S-adenosyl methionine, and S-adenosyl homocysteine and enzymes in homocysteine metabolism in Zucker rats. Metabolism. 2002;51(6):783–86. doi: 10.1053/meta.2002.32731. [DOI] [PubMed] [Google Scholar]
- 21.Dicker-Brown A, Fonseca VA, Fink LM, Kern PA. The effect of glucose and insulin on the activity of methylene tetrahydrofolate reductase and cystathionine-b-synthase: Studies in hepatocytes. Atherosclerosis. 2001;158(2):297–301. doi: 10.1016/s0021-9150(01)00442-7. [DOI] [PubMed] [Google Scholar]
- 22.Najib S, Sanchez-Margalet V. Homocysteine thiolactone inhibits insulin signaling, and glutathione has a protective effect. J Mol Endocrinol. 2001;27(1):85–91. doi: 10.1677/jme.0.0270085. [DOI] [PubMed] [Google Scholar]
- 23.Araki A, Hosoi T, Orimo H, Ito H. Association of plasma homocysteine with serum interleukin-6 and C-peptide levels in patients with type 2 diabetes. Metabolism. 2005;54(6):809–14. doi: 10.1016/j.metabol.2005.02.001. [DOI] [PubMed] [Google Scholar]
- 24.van Aken BE, Jansen J, van Deventer SJ, Reitsma PH. Elevated levels of homocysteine increase IL-6 production in monocytic Mono Mac 6 cells. Blood Coagul Fibrinolysis. 2000;11(2):159–64. [PubMed] [Google Scholar]
- 25.Dalal S, Parkin SM, Homer-Vanniasinkam S, Nicolaou A. Effect of homocysteine on cytokine production by human endothelial cells and monocytes. Ann Clin Biochem. 2003;40(Pt 5):534–41. doi: 10.1258/000456303322326452. [DOI] [PubMed] [Google Scholar]
- 26.Cardellini M, Perego L, D’Adamo M, et al. C-174G polymorphism in the promoter of the interleukin-6 gene is associated with insulin resistance. Diabetes Care. 2005;28(8):2007–12. doi: 10.2337/diacare.28.8.2007. [DOI] [PubMed] [Google Scholar]
- 27.Li Y, Zhang H, Jiang C. Hyperhomocysteinemia promotes insulin resistance by inducing endoplasmic reticulum stress in adipose tissue. J Biol Chem. 2013;288(14):9583–92. doi: 10.1074/jbc.M112.431627. [DOI] [PMC free article] [PubMed] [Google Scholar]
- 28.Despres JP, Lamarche B, Mauriege P, et al. Hyperinsulinemia as an independent risk factor for ischemic heart disease. N Engl J Med. 1996;334(15):952–57. doi: 10.1056/NEJM199604113341504. [DOI] [PubMed] [Google Scholar]
- 29.Pyörälä M, Miettinen H, Laakso M, Pyörälä K. Hyperinsulinemia predicts coronary heart disease risk in healthy middle-aged men: The 22-year follow-up results of the Helsinki Policemen Study. Circulation. 1998;98(5):398–404. doi: 10.1161/01.cir.98.5.398. [DOI] [PubMed] [Google Scholar]
- 30.Reaven GM. Multiple CHD risk factors in type 2 diabetes: beyond hyperglycaemia. Diabetes Obes Metab. 2002;4(Suppl 1):S13–18. doi: 10.1046/j.1462-8902.2001.00037.x. [DOI] [PubMed] [Google Scholar]
- 31.Festa A, Williams K, D’Agostino R, Jr, et al. The natural course of beta-cell function in nondiabetic and diabetic individuals: The Insulin Resistance Atherosclerosis Study. Diabetes. 2006;55(4):1114–20. doi: 10.2337/diabetes.55.04.06.db05-1100. [DOI] [PubMed] [Google Scholar]
- 32.Tabak AG, Jokela M, Akbaraly TN, et al. Trajectories of glycaemia, insulin sensitivity, and insulin secretion before diagnosis of type 2 diabetes: An analysis from the Whitehall II study. Lancet. 2009;373(9682):2215–21. doi: 10.1016/S0140-6736(09)60619-X. [DOI] [PMC free article] [PubMed] [Google Scholar]
- 33.Al-Maskari MY, Waly MI, Ali A, et al. Folate and vitamin B12 deficiency and hyperhomocysteinemia promote oxidative stress in adult type 2 diabetes. Nutrition. 2012;28(7–8):e23–26. doi: 10.1016/j.nut.2012.01.005. [DOI] [PubMed] [Google Scholar]
- 34.Al-Maskari M, Al-Shukaili A, Al-Mammari A. Pro-inflammatory cytokines in Omani type 2 diabetic patients presenting anxiety and depression. Iran J Immunol. 2010;7(2):124–29. [PubMed] [Google Scholar]
- 35.Hayden MR, Tyagi SC. Homocysteine and reactive oxygen species in metabolic syndrome, type 2 diabetes mellitus, and atheroscleropathy: The pleiotropic effects of folate supplementation. Nutr J. 2004;3:4. doi: 10.1186/1475-2891-3-4. [DOI] [PMC free article] [PubMed] [Google Scholar]
- 36.Guerrero-Romero F, Rodríguez-Moran M. Hypertriglyceridemia is associated with development of metabolic glucose disorders, irrespective of glucose and insulin levels: A 15-year follow-up study. Eur J Intern Med. 2014;25(3):265–69. doi: 10.1016/j.ejim.2014.01.015. [DOI] [PubMed] [Google Scholar]
- 37.Waldman B, Jenkins AJ, Davis TM, et al. HDL-C and HDL-C/ApoA-I predict long-term progression of glycemia in established type 2 diabetes. Diabetes Care. 2014;37(8):2351–58. doi: 10.2337/dc13-2738. [DOI] [PubMed] [Google Scholar]
- 38.De Souza LR, Berger H, Retnakaran R. Hepatic fat and abdominal adiposity in early pregnancy together predict impaired glucose homeostasis in mid-pregnancy. Nutr Diabetes. 2016;6(9):e229. doi: 10.1038/nutd.2016.39. [DOI] [PMC free article] [PubMed] [Google Scholar]
- 39.Feng X, Gao X, Yao Z, Xu Y. Low apoA-I is associated with insulin resistance in patients with impaired glucose tolerance: A cross-sectional study. Lipids Health Dis. 2017;16(1):69. doi: 10.1186/s12944-017-0446-1. [DOI] [PMC free article] [PubMed] [Google Scholar]
- 40.Walker MC, Smith GN, Perkins SL, et al. Changes in homocysteine levels during normal pregnancy. Am J Obstet Gynecol. 1999;180(3 Pt 1):660–64. doi: 10.1016/s0002-9378(99)70269-3. [DOI] [PubMed] [Google Scholar]