Abstract
β Cells are formed in embryonic life by differentiation of endocrine progenitors and expand by replication during neonatal life, followed by transition into functional maturity. In this study, we addressed the potential contribution of neuropeptide Y (NPY) in pancreatic β cell development and maturation. We show that NPY expression is restricted from the progenitor populations during pancreatic development and marks functionally immature β cells in fetal and neonatal mice and humans. NPY expression is epigenetically downregulated in β cells upon maturation. Neonatal β cells that express NPY are more replicative, and knockdown of NPY expression in neonatal mouse islets reduces replication and enhances insulin secretion in response to high glucose. These data show that NPY expression likely promotes replication and contributes to impaired glucose responsiveness in neonatal β cells. We show that NPY expression reemerges in β cells in mice fed with high-fat diet as well as in diabetes in mice and humans, establishing a potential new mechanism to explain impaired β cell maturity in diabetes. Together, these studies highlight the contribution of NPY in the regulation of β cell differentiation and have potential applications for β cell supplementation for diabetes therapy.
Keywords: Development, Endocrinology
Neuropeptide Y marks functionally immature β cells during pancreatic development, is epigenetically downregulated as β cells mature, and reemerges in adult β cells in diabetes.
Introduction
Most of our current understanding of the early steps of β cell formation and functional maturation has been shaped by studies using rodent models, with few studies investigating human islet development (1). Neuronal input is an important regulatory contributor in islet development and function (2–4). Neurons and islet endocrine cells have many features in common, including shared developmental pathways and expression of several neuronal peptides that regulate islet function (5–8). It has been proposed that islet intrinsic expression of such neuronal peptides is required for the modulation of islet function, intraislet coordination, and energy homeostasis.
Neuropeptide Y (NPY) is one such neuronal peptide, which, besides being localized to the islet sympathetic nerve termini, is also expressed in the endocrine pancreas (2, 7, 8). NPY is a small peptide (36 amino acids) from the pancreatic polypeptide (PP) family, which includes PP and peptide YY (PYY) (9). NPY is an orexigenic agent that reduces energy expenditure and inhibits insulin secretion (2, 10). NPY-knockout mice show increased insulin secretion (10), while overexpression of NPY in β cells results in impaired insulin secretion in the context of obesity (11). NPY promotes proliferation in the postnatal neuronal precursors (12), and treatment of mouse islets with NPY induces β cell replication (13). The proliferative action of NPY is mediated via the ERK1/2 pathway (13), a well-characterized proreplicative pathway in mouse and human β cells (14). Previous studies have examined NPY expression in pancreatic development (7, 8). However, the relevance of NPY expression in the developing human pancreas has not been established. In addition, while NPY is known to be expressed in neonatal islets (15, 16), its role in postnatal β cell functional maturation and expansion is unclear.
In this study, we sought to understand the involvement of NPY in islet biogenesis and maturation, focusing also on establishing the human complement. Here, we show that NPY expression characterizes nascent β cells during differentiation in mice and humans but is absent from pancreatic and endocrine progenitors. We demonstrate that NPY expression marks a more replicative, functionally immature subtype of neonatal β cells and declines with postnatal β cell maturation. We also show that islet endogenous NPY directly contributes to the characteristic lack of glucose responsiveness in neonatal β cells. β Cell dysfunction in diabetes is driven in part by loss of mature β cell identity (17, 18). Our data show that NPY expression reemerges in β cells in diabetes, as a reflection of impaired functional maturity. Together, our study highlights a role for NPY in islet differentiation and maturation, with important ramifications for deriving functional human β cells from stem cells as well as for improving our understanding of β cell failure in diabetes.
Results
NPY is expressed in nascent β cells and restricted from progenitors during pancreatic development.
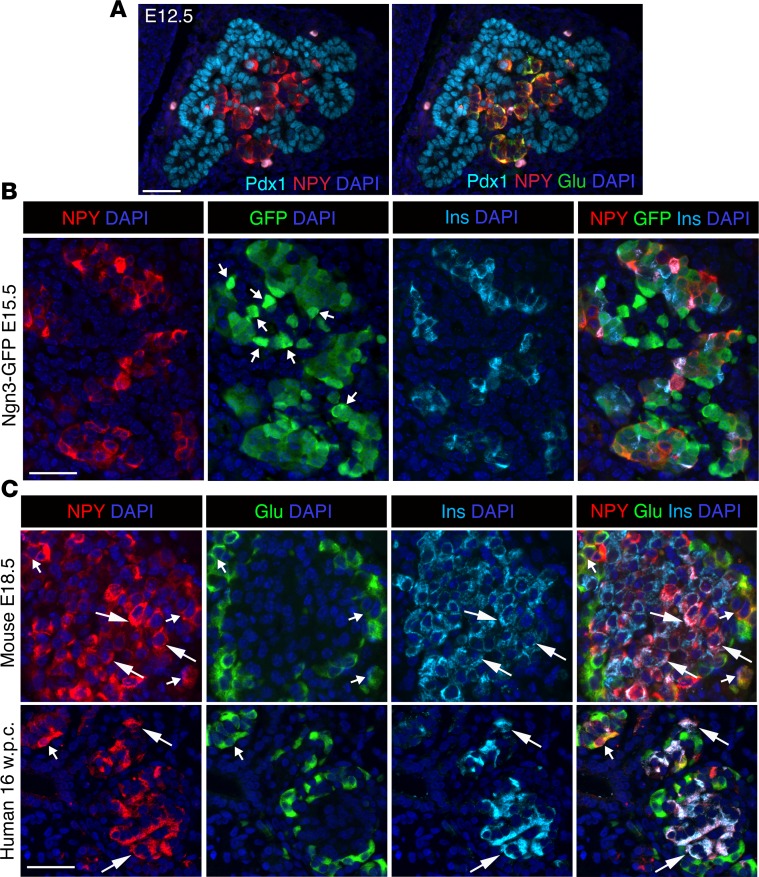
NPY is expressed in pancreatic islets in the embryonic and adult mouse, but the timing and endocrine lineage-specific distribution of NPY expression has not been resolved. Additionally, little is known about NPY expression during islet development in humans. Given the need to better understand steps in islet development to generate functionally mature islets from stem cells, we first sought to establish the pattern and timing of NPY expression in mouse β cell development and then examine how this pattern compares in humans. Given the homology of NPY and PYY, we used an anti-NPY antibody reported to specifically detect NPY in β cells (19). We first asked if NPY is expressed in the pancreatic and endocrine progenitors. At E12.5, NPY was mostly excluded from pancreatic progenitors marked by Pdx1 and colocalized with glucagon (Figure 1A and Supplemental Figure 1D; supplemental material available online with this article; https://doi.org/10.1172/jci.insight.94005DS1). Next, we used the Ngn3-EGFP direct reporter to determine if NPY is present in the Ngn3+ endocrine progenitors. In the heterozygous Ngn3-EGFP embryos, the progenitors are marked by bright EGFP fluorescence. The reporter expression ceases upon progenitor differentiation, with dim residual fluorescence lingering due to EGFP stability. Coimmunostaining of EGFP with NPY and insulin or glucagon at E15.5 revealed that NPY was mostly absent from bright EGFP+ cells and was instead restricted to differentiated endocrine cells (Figure 1B and Supplemental Figure 1E) and not the endocrine progenitors. NPY immunoreactivity was detectable in the majority of β cells (~70%–90%) as well as α and γ cells in the E18.5 embryonic mouse pancreata (Figure 1C and Supplemental Figure 1F). Analysis of pancreatic NPY expression during early (16 weeks) and late (39 weeks) human fetal development showed NPY immunoreactivity in most (~95%) β cells and a few α and γ cells (Figure 1C and Supplemental Figure 1G). These data reveal a conservation of NPY expression during murine and human β cell development.
Figure 1. NPY marks nascent β cells and is restricted from pancreatic and endocrine progenitors.
(A) Immunostaining of a representative pancreatic section from wild-type mouse embryos at E12.5 showing immunostaining for pancreatic progenitor marker Pdx1 and neuropeptide Y (NPY) or the same section overlaid with glucagon (Pdx1: cyan; NPY: red; glucagon: green), showing exclusion of NPY from pancreatic progenitors. (B) Immunostaining of representative pancreatic sections from Ngn3-EGFP (EGFP expression driven by Neurogenin3 promoter to mark endocrine progenitors) embryos at E15.5, showing NPY (red), GFP (green), insulin (Ins; cyan) and overlay with DAPI (to counterstain the nuclei; blue). Arrows indicate cells with high GFP expression defining endocrine progenitors. (C) Immunostaining for NPY (red), glucagon (Glu; green), and insulin (cyan), with DAPI (blue) in fetal mouse (E17.5) and human (16 weeks pc/gestation) pancreatic sections. Larger arrows mark overlap of NPY with insulin, while smaller arrows mark overlap of NPY with glucagon. Scale bar: 50 μm. For A and B and mouse data in C, n = 4 animals.
NPY marks neonatal β cells in mice and humans.
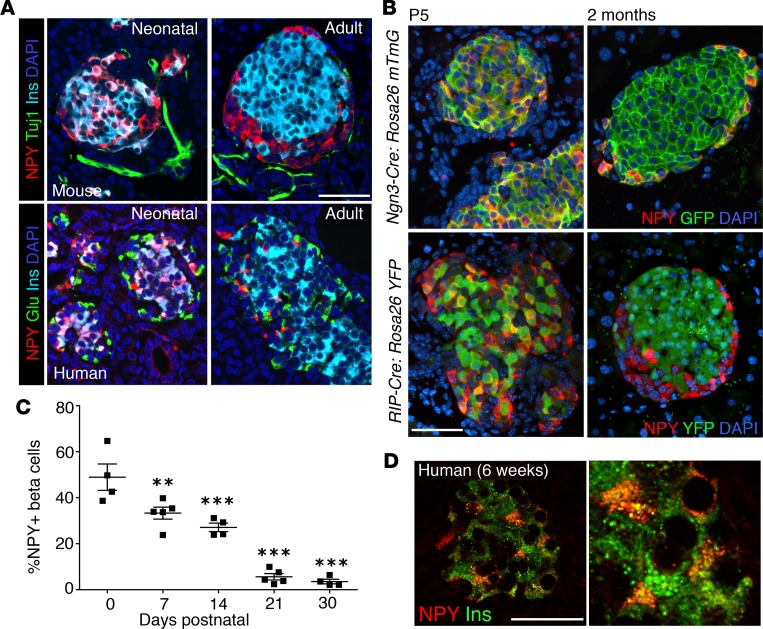
We next sought to establish the pattern of NPY expression during postnatal β cell maturation. NPY marked a large subset of the neonatal (P5) murine β cells but was absent in adult β cells (Figure 2A). NPY+ β cells did not express the canonical neuronal marker Tuj1 (Figure 2A), which was also absent in the embryonic NPY+ cells (Supplemental Figure 2A). The postnatal timeline and endocrine identity of the NPY-expressing β cells was further confirmed by using endocrine (Ngn3-Cre:mTmG) and β cell–specific (RIP-Cre:YFP) fluorescent lineage-tracing mice (Figure 2B). Neonatal (P5) pancreata from both lineage-tracing models showed several GFP/YFP+ cells that expressed NPY, while very few adult GFP/YFP+ cells expressed NPY (Figure 2B). Morphometric analysis of mouse pancreata at P0, P7, P14, P21, and P30 showed a progressive decline of NPY expression in postnatal β cell development in mice (48% ± 5.8% at P0 to 3.5% ± 1.1% at P30; Figure 2C), coinciding with functional β cell maturation (Supplemental Figure 2B). The pattern and timeline of NPY expression was conserved in humans, with a major proportion of neonatal β cells expressing NPY (Figure 2, A and D) and only a small number (~1%) of adult β cells marked by NPY (Supplemental Figure 2D). In mice, NPY immunoreactivity was also seen in a small proportion (~1%) of neonatal α cells (and was also seen in subsets of PP+ and ghrelin+ cells) but was absent in adults (Figure 2A and Supplemental Figure 2C). In humans, NPY immunoreactivity was absent in both neonatal and adult α cells (Figure 2A). NPY immunoreactivity was present in the majority of γ cells in neonatal humans and mice and was retained through adult life in both species (Supplemental Figure 2, C–E). Taken together, the postnatal pattern for NPY expression is conserved between mice and humans in β cells, and NPY marks immature neonatal but not adult β cells.
Figure 2. NPY expression declines in postnatal β cell maturation.
(A) Immunostaining of representative pancreatic sections from neonatal and adult mice (top) or humans (bottom) for NPY (red), Tuj1 or glucagon (Tuj1 or Glu; green), and insulin (Ins; cyan), with nuclei labeled by DAPI in blue. Neonatal mouse (P5), adult mouse (2 months), neonatal human (6 weeks; Mayo repository), adult human (6004, nPOD) samples are presented. (B) Representative pancreatic sections from Ngn3-Cre:Rosa26 mTmG (top) or RIP-Cre:Rosa26 YFP (bottom) mice at P5 (neonatal) and 2 months (adult) of age, stained for NPY (red) and YFP (green), overlaid with DAPI in blue. (C) Quantification of NPY expression in β cells shown as a percentage of β cells expressing NPY at different postnatal stages, namely P0, P7, P14, P21, and P30. P values shown mark the statistical significance of each sample compared with P0. (D) Immunostaining for insulin (green) and NPY (red) in neonatal human pancreatic section (6 weeks; Mayo repository), along with an image at higher magnification (original magnification, ×2.5). Scale bar: 50 μm. For A and B, n = 4 animals; for C, n = 5 animals. Error bars represent SEM of the mean. **P < 0.01, ***P < 0.005, 1-way ANOVA followed by Fisher’s LSD post-hoc test.
Fetal and neonatal β cells expressing NPY display immature β cell identity.
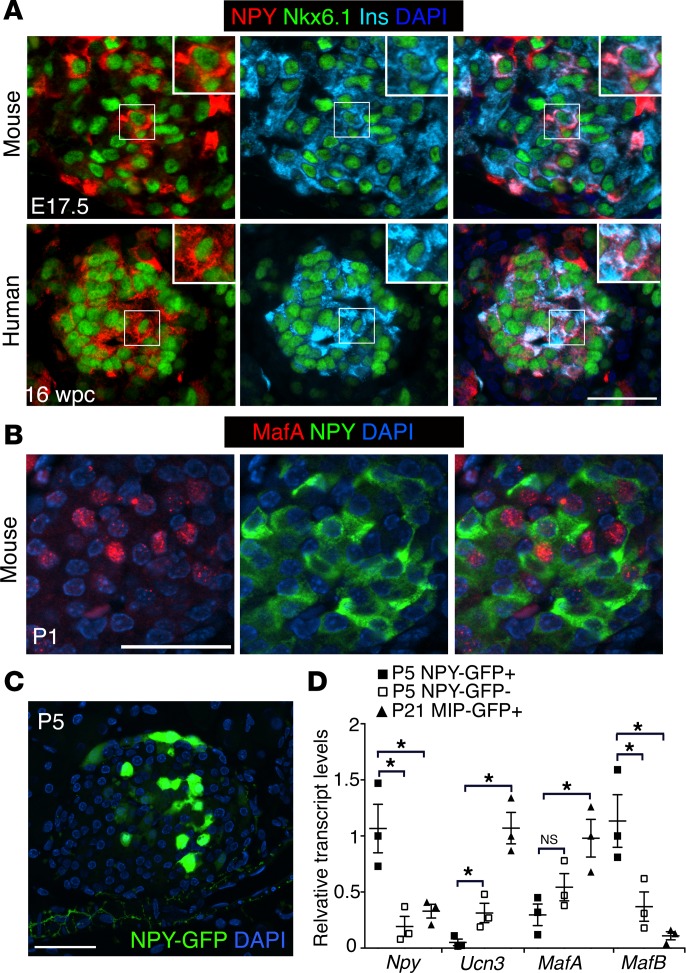
We next asked if the fetal and neonatal β cells expressing NPY in mice and humans distinguish themselves from non-NPY-expressing β cells in terms of β cell identity markers. The β cell transcription factors Nkx6.1 and Pdx1 were comparably expressed in NPY+ and NPY– β cell subpopulations in embryonic and neonatal mouse pancreata, with similar observations for Nkx6.1 expression in human tissue (Figure 3A and Supplemental Figure 3, A and B). Transcription factor MafA marks fully differentiated β cells and is lost in β cells undergoing dedifferentiation (17, 18, 20). To establish if the NPY+ β cells represent partially differentiated β cells, we examined the expression of MafA and NPY in neonatal (P1) pancreata. The majority of the NPY+ cells displayed very little MafA, likely indicating partial β cell differentiation (Figure 3B). To further establish if the NPY+ β cells represent an immature phenotype, we used the NPY-GFP direct reporter mice (Figure 3C). Islets were isolated from neonatal (P5) NPY-GFP mice and sorted into GFP+ (NPY-expressing) and control, GFP– (NPY–) cell fractions. These two fractions were compared with mature β cells obtained from P21 MIP-GFP+ mice for the maturity markers Ucn3 and MafA, as well as MafB, which is restricted to immature β cells. The NPY+ neonatal islets cells had very modest Ucn3 and MafA expression and were enriched for MafB, in contrast to the NPY– islet cells and the mature β cells (Figure 3D). Overall these data imply that NPY+ β cells are a subpopulation of the committed β cell lineage that likely represents one of the final steps in β cell maturation.
Figure 3. NPY+ β cells represent functionally immature cells.
(A) Immunostaining of representative pancreatic sections from embryonic mice (E17.5) and humans (16 weeks gestation sample: USC repository) for NPY (red), β cell transcription factor Nkx6.1 (green), and insulin (Ins; cyan). DAPI (blue) marks the nuclei. Scale bar: 50 μm. Insets show high-magnification images of the boxed regions (original magnification, ×2). (B) Immunostaining of a representative pancreatic section from wild-type neonatal mice at P1 showing NPY (green), β cell transcription factor MafA (red), and an overlay with DAPI (to counterstain the nuclei; blue). Scale bar: 40 μm. (C) A representative pancreatic section from a P5 NPY-GFP reporter mouse, showing humanized Renilla reniformis GFP (hrGFP) expression driven by the NPY promoter. hrGFP expression is shown in green, with DAPI in blue. Scale bar: 40 μm. (D) Transcript levels for indicated genes in the NPY-expressing, GFP+ (P5 NPY-GFP+) and NPY-non-expressing, GFP– (P5 NPY-GFP–) cell fractions sorted from neonatal (P5) NPY-GFP islets, in comparison with β cells sorted from P21 MIP-GFP+ mice. In the MIP-GFP mice GFP expression is driven by mouse insulin promoter (MIP) to label β cells. P values shown mark the statistical significance of each sample compared with neonatal NPY-expressing β cells (P5 NPY-GFP+). n = 4 animals. The error bars represent SEM of the mean. *P < 0.05, 1-way ANOVA followed by Bonferroni’s post-hoc test.
Epigenetically regulated expression of NPY during β cell maturation modulates β cell function and replication.
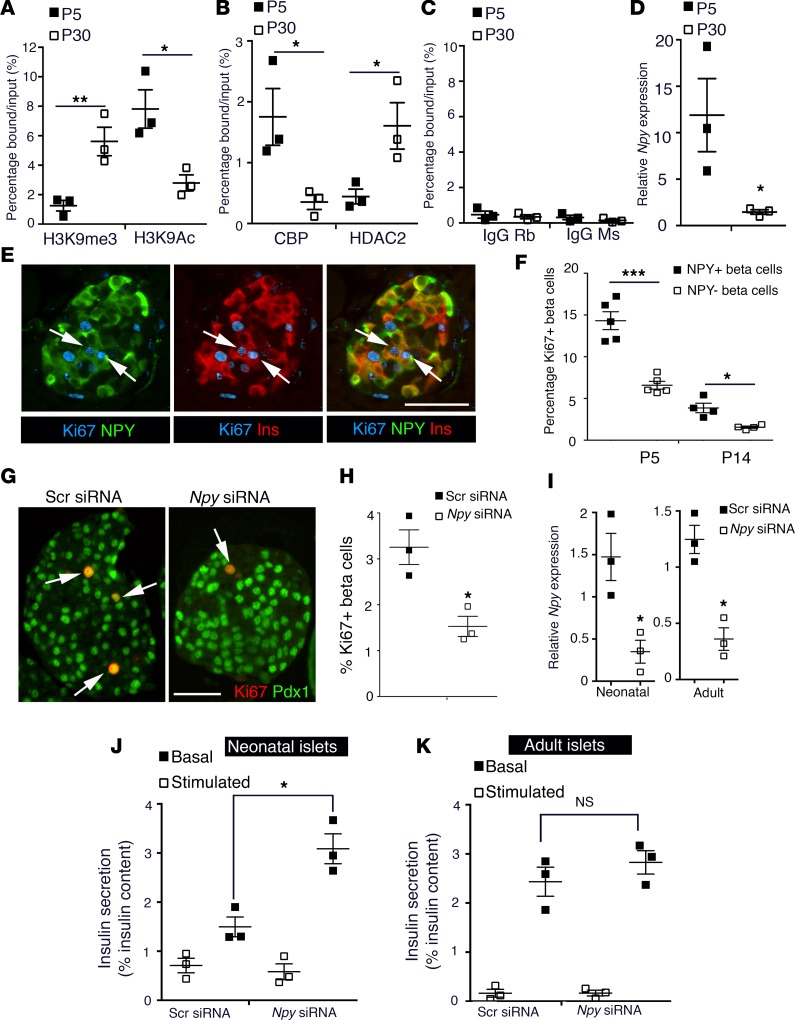
To determine the mechanism by which NPY is regulated during β cell maturation, we examined the chromatin structure of the Npy promoter. We performed ChIP for enrichment of various histone modifications in β cells sorted from MIP-GFP mice at P5 and P30, representing immature and mature β cells, respectively. We observed an enrichment of the repressive histone H3-lysine 9 trimethylation (H3K9me3) marks and loss of activating H3-lysine 9 acetylation (H3K9Ac) marks at the Npy promoter upon β cell maturation (Figure 4, A–C), coincident with reduced recruitment of histone acetyltransferase CBP and increased recruitment of histone deacetylase HDAC2. The repressive chromatin structure of the Npy locus reflected reduced NPY expression in mature β cells (Figure 4D). Thus, NPY expression is repressed epigenetically during β cell maturation.
Figure 4. NPY expression is epigenetically regulated and modulates β cell maturation.
(A–C) ChIP analysis showing the enrichment of histone modifications (A) H3K9me3 (histone H3-lysine 9 trimethylation; repressive) and H3K9Ac (histone H3 lysine 9 acetylation; activating), (B) histone acetyl transferase CBP (CREB-binding protein) and histone deacteylase HDAC2, (C) along with control rabbit and mouse IgGs, to the Npy promoter region in β cells sorted from MIP-GFP mice at P5 and P30. These data show the epigenetic repression of the Npy promoter as a function of maturation. (D) Npy mRNA expression levels, normalized to the housekeeping gene CyclophilinA in β cells sorted from MIP-GFP mice, in which GFP expression is driven by insulin promoter at P5 and P30, showing reduced expression as a function of maturation. (E) A representative pancreatic section from wild-type, neonatal (P5) mice showing immunostaining for NPY (green), insulin (Ins; red), and Ki67 (cyan). Arrows mark replicating NPY+ β cells. (F) Quantification of replication marker Ki67 in the NPY+ and NPY– subpopulations of β cells in wild-type neonatal mice at P5 and P14. (G) Immunohistochemistry and (H) quantification for replication of β cells in islets isolated from neonatal (P5) mice treated with an siRNA targeting Npy or a control, scrambled siRNA. Immunostaining for replication marker Ki67 (red) and β cell marker Pdx1 (green) was used to measure β cell replication. Arrows mark Ki67 Pdx1 double-positive cells. (I–K) Npy mRNA levels and static incubation glucose-stimulated insulin secretion (GSIS) assay in islets from (I) wild-type, (J) P5 pups, or (K) adult (2.5-month-old) mice, treated either with an siRNA targeting Npy or a scrambled (Scr) siRNA. Insulin secretion was measured at 2.8 mM glucose (basal) and 16.7 mM (stimulated) glucose and reported as a percentage of insulin content. Scale bar: 50 μm. For A–D, average of n = 3 independent sorts; each sort had 6–8 pups at P5 and 4 mice at P30. For E and F, n = 4 animals. For G–K, n = 3 independent experiments, with each replicate representing a pool of islets from 6–8 pups. The error bars represent SEM of the mean. *P < 0.05, **P < 0.01, ***P < 0.005. A 2-tailed Student’s t test was used for A–D, H, and I to determine statistical significance. For F, J, and K (which involved repeat measures), statistical significance was determined by 1-way ANOVA followed by Bonferroni’s post-hoc test.
During neonatal life, β cells rapidly expand by replication to establish β cell mass (21–23), becoming quiescent upon maturation (24, 25). We questioned whether the NPY+ and NPY– β cells differed in their replicative capacity. We performed morphometric analyses at P5 and P14 to quantify the NPY+ and NPY– β cells positive for replication markers Ki67 or Mcm2. NPY+ β cells displayed higher replication compared with the NPY– subset in both stages (Figure 4, E and F, and Supplemental Figure 4, A and B). No cell death was detected in either subset of β cells (0.2% ± 0.05% TUNEL in NPY+ cells vs. 0.2% ± 0.06% in NPY– β cells; Supplemental Figure 4C). In vitro knockdown of Npy using a specific siRNA in neonatal (P5) islets led to reduced replication (Figure 4, G–I). The inhibitory action of NPY on insulin secretion (10, 26, 27) led us to ask if the postnatal decline in NPY expression contributes to the establishment of glucose-stimulated insulin secretion (GSIS) during β cell maturation. Knockdown of Npy expression in immature, neonatal islets led to increased insulin secretion at 16.7 mM glucose (P = 0.036), while no effect was seen at basal glucose levels (2.8 mM) (Figure 4J) in a static incubation GSIS assay. Npy knockdown had no significant effect on either basal or GSIS in adult islets (Figure 4K). These data indicate that NPY expression in neonatal β cells likely promotes β cell replication and constrains glucose responsiveness.
NPY is reexpressed in β cells in diabetes.
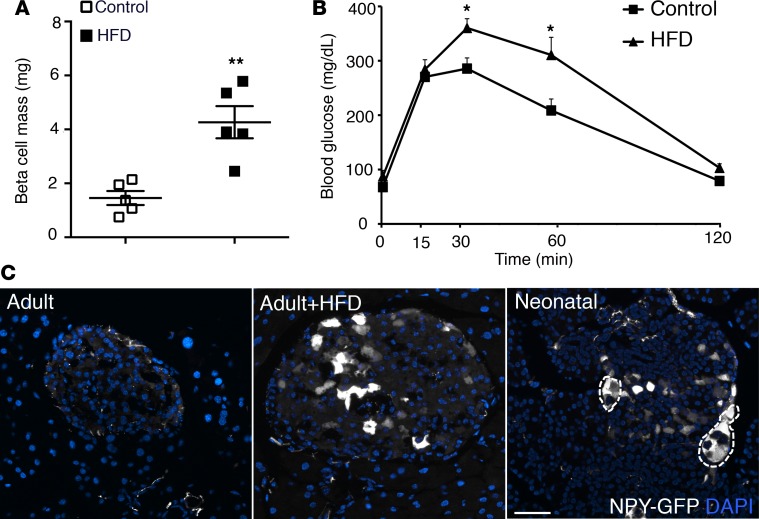
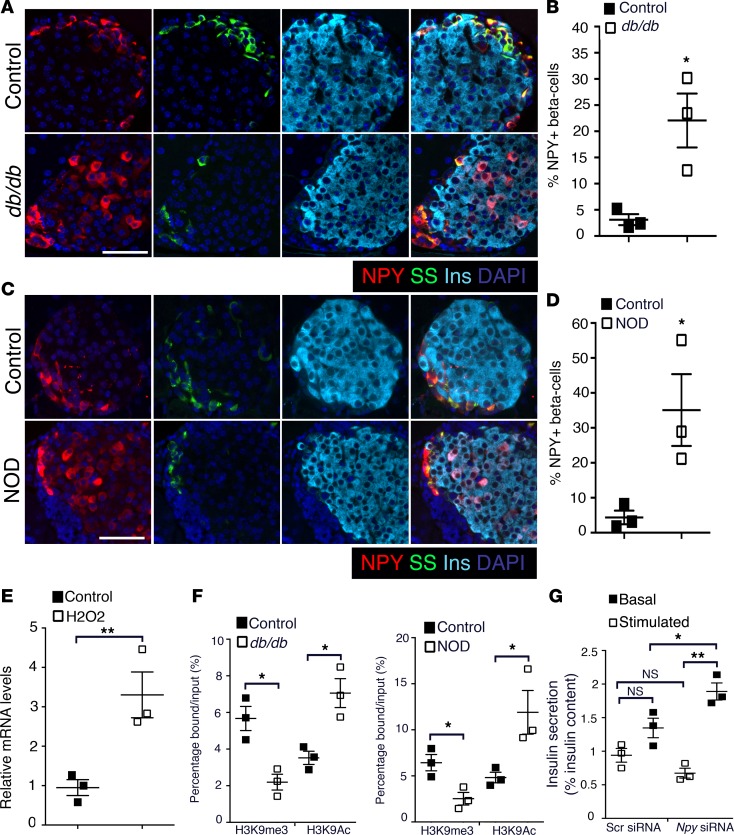
Given the present interest in the role of impaired β cell maturity in relationship to β cell failure in diabetes (17, 18), we asked if NPY expression reemerges in β cells upon high-fat diet–induced (HFD-induced) stress and diabetes. We first compared NPY expression in adult (2-month-old) NPY-GFP mice fed with HFD (55% fat) or control diet for 8 weeks. The few GFP+ cells present in islets of the adult NPY-GFP mice coexpressed insulin (Supplemental Figure 5A). HFD resulted in reduced insulin sensitivity (Supplemental Figure 5B) and an approximately 3-fold increase in β cell mass in these mice, compared with control diet (Figure 5A). The fasting blood glucose levels were similar in both groups, and the HFD group returned to baseline by 120 minutes in a glucose tolerance test (Figure 5B). While the NPY-GFP mice fed with control diet had very few GFP+ islets cells as expected, mice fed with HFD had multiple islets with abundant GFP+ cells (~2% vs. ~15% islet cells, P = 0.0011, control vs. HFD), resembling a profile similar to neonatal NPY-GFP islets (Figure 5C and Supplemental Figure 5C). Next, we tested pancreata from the leptin receptor–deficient db/db mice (type 2 diabetes [T2D] model) and NOD mice (type 1 diabetes [T1D] model) for NPY expression. A larger number of β cells in 6-week-old prediabetic db/db mice (fasting blood glucose 85.0 ± 5.2 mg/dl) expressed NPY, compared with age-matched controls (Figure 6, A and B). Similarly, pancreata from 8-week-old prediabetic NOD mice (fasting blood glucose 75.8 ± 5.7 mg/dl) revealed an increase in β cells marked by NPY expression, compared with age-matched controls (Figure 6, C and D). Islets with visible β cell loss in the NOD pancreata showed an overlap of NPY immunoreactivity with somatostatin (Supplemental Figure 6A). Based on these data, we hypothesized that cellular stress-induced NPY expression, preceding hyperglycemia. This was supported by increased Npy mRNA expression in islets from wild-type adult (2.5-month-old) mice treated for 12 hours with 5 μM H2O2, which induces oxidative stress (Figure 6E). ChIP analyses of Npy promoter in islets from the db/db and NOD mice revealed an enrichment of the activating histone H3K9Ac, and loss of the repressive H3K9me3 modifications, compared with age- and background-matched controls (Figure 6F and Supplemental Figure 6B). The changes in Npy chromatin reflected the changes in gene expression in islets from diabetic mice, reminiscent of immature β cells. To examine if NPY expression in the db/db islets had any physiological significance, we measured GSIS after treating the islets from prediabetic (6-week-old) db/db mice with an siRNA targeting Npy. Knockdown of Npy in db/db islets resulted in increased insulin secretion at 16.7 mM glucose in a static incubation GSIS assay. However, there was no significant change in the basal insulin secretion upon knocking down Npy (Figure 6G and Supplemental Figure 6D). These data indicate that the reemergence of NPY in db/db islets potentially contributes to loss of glucose responsiveness preceding diabetes.
Figure 5. Dietary stress induces NPY expression in functionally mature β cells.
(A) β Cell mass and (B) intraperitoneal glucose tolerance test in adult (2-month-old) NPY-GFP mice on control and high-fat diets (HFDs), showing that HFD induces β cell expansion and glucose intolerance in these mice. (C) NPY promoter–driven hrGFP (humanized Renilla reniformis GFP; shown in gray) expression in pancreatic sections from NPY-GFP adult (2-month-old) mice fed with control diet (adult) or HFD (adult+HFD) or in P5 NPY-GFP mice, showing that HFD results in reexpression of NPY in adult β cells. DAPI is shown in blue. Regions marked with dotted line show pancreatic ganglia, which also express NPY. Scale bar: 50 μm. For A–C, n = 5 animals. The error bars represent SEM of the mean. *P < 0.05, **P < 0.01, 1-way ANOVA followed by Fisher’s LSD post-hoc test.
Figure 6. NPY is reexpressed in the β cells preceding disease onset in mouse models of diabetes.
(A–D) Immunostaining and quantification of NPY expression in pancreatic sections from db/db (age: 6 weeks; A and B) and NOD (age: 8 weeks; C and D) mice, with age-matched controls. Representative pancreatic sections stained for NPY (red), somatostatin (SS; green), and insulin (Ins; cyan) are shown, with DAPI marking nuclei in blue. (E) Transcript levels for Npy in islets from wild-type adult (2.5-month-old) mice treated with H2O2 or vehicle control. (F) ChIP analysis showing the levels of histone modifications H3K9me3 (histone H3-lysine 9 trimethylation; repressive) and H3K9Ac (histone H3 lysine 9 acetylation; activating) at the Npy promoter region in islets from db/db (age = 6 weeks; left) and NOD (age: 8 weeks; right) mice compared with age-matched controls, showing that the Npy promoter is active in these diabetic models. (G) Static incubation glucose-stimulated insulin secretion (GSIS) assay in islets from 6-week-old db/db mice, treated either with an siRNA targeting Npy or a control scrambled (Scr) siRNA. Insulin secretion was measured at 2.8 mM glucose (basal) and 16.7 mM (stimulated) glucose and is reported as a percentage of insulin content. These data show an improvement of GSIS in islets from prediabetic db/db mice upon treatment with Npy siRNA. Scale bar: 50 μm. For A–D, n = 4 animals per group. For E–G, n = 3 independent experiments, with each replicate representing a pool of islets from 3 mice. The error bars represent SEM of the mean. *P < 0.05, **P < 0.01. A 2-tailed Student’s t test was used to determine the statistical significance of the data in B, D, E, and F, while 1-way ANOVA followed by Bonferroni’s post-hoc test was used to determine statistical significance of the data in G. *P < 0.05, **P < 0.01, ***P < 0.005.
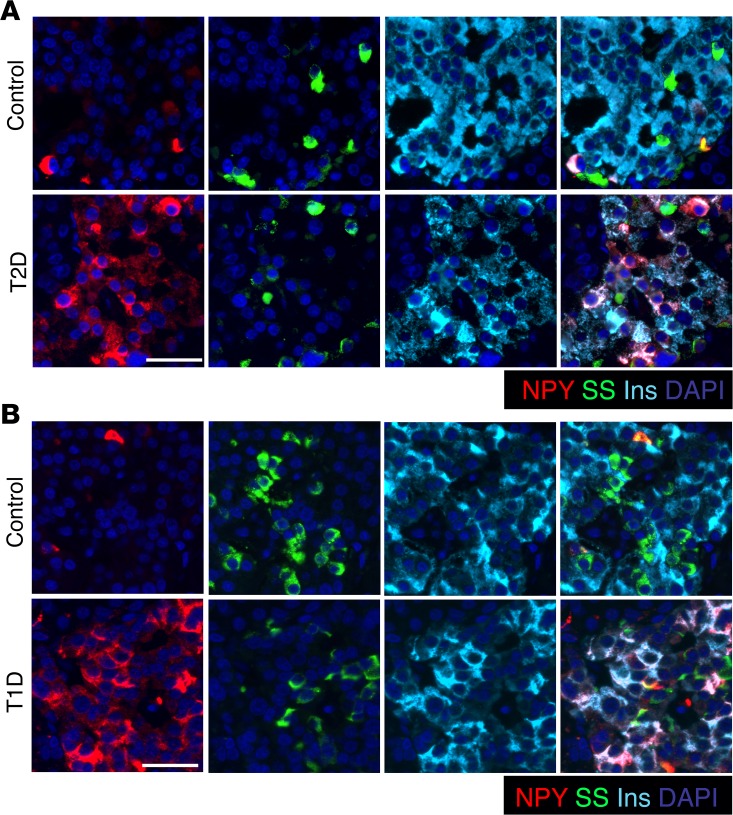
We next analyzed NPY expression in pancreatic tissue from human donor subjects with T1D and T2D and nondiabetic control subjects. Immunostaining showed an increase in β cells marked by NPY expression in T2D subjects as well as in pancreatic tissue from T1D subjects, with detectable residual β cells (Figure 7 and Supplemental Figure 7, A and B). In T1D subjects with no apparent insulin staining, scattered NPY+ cells were observed in the islets, with an occasional NPY cell coexpressing somatostatin (Supplemental Figure 7C). In either category of T1D pancreatic tissue, occasional clusters of NPY single-positive cells were observed, with interspersed α and γ cells (Supplemental Figure 7D). Together, these data show that NPY is reexpressed in a subset of β cells in both T1D and T2D.
Figure 7. NPY expression reemerges in β cells in humans with type 1 and type 2 diabetes.
(A) Pancreatic sections were immunostained from a human donor subject with type 2 diabetes (T2D; LT2-11, Mayo; ~60% β cells positive for NPY) and an age- and BMI-matched control human subject (LND-20, Mayo; ~12% β cells positive for NPY) for NPY (red), somatostatin (SS; green), and insulin (Ins; cyan), along with nuclear counterstaining with DAPI (blue). (B) Immunostaining for NPY (red), somatostatin (green), and insulin (cyan), with DAPI in blue, in pancreatic sections from a donor subject with type 1 diabetes (T1D; 6051, nPOD; ~80% β cells positive for NPY) displaying residual β cells, and an age- and BMI-matched control donor human subject (6057, nPOD; ~14% β cells positive for NPY). Scale bar: 50 μm.
Discussion
In this study, we show the temporal expression and epigenetic regulation of the neuronal peptide NPY in β cell development and functional maturation in rodents and humans, advancing previous studies on NPY expression in immature β cells (19, 28, 29). In addition, we establish that NPY expression reemerges in β cells as a component of altered β cell identity in diabetes. These data suggest that NPY is an indicator of immature β cell phenotype. However, NPY may not just be a mere marker of β cell immaturity during development and in metabolic stress. Our data suggest that NPY may serve a physiological role in β cell development and a potential proximal role in altered β cell function that precedes and contributes to diabetes onset. We show that NPY marks subsets of the newly derived β cells during embryonic development in mice and humans, while being restricted from progenitors. Our findings suggest that the establishment of endocrine identity in pancreatic development involves a progressive refinement of NPY expression toward terminal differentiation. We show that NPY is expressed in the majority of neonatal β cells in mice and humans and is downregulated epigenetically as β cells become functionally mature and quiescent. We report occasional NPY+ β cells in the adult human pancreas, concordant with the recent work on β cell diversity in humans, which described adult NPY-expressing β cell subpopulations (30). Neuronal peptides in islets are thought to play a regulatory role in coordinating the interaction of different islet endocrine cell types (2), making it likely that the islet endogenous expression of NPY may contribute to interislet- and islet-neuron communication to regulate islet development and function, especially given the importance of sympathetic innervation in these processes (2, 3).
Our data suggest that NPY expression in neonatal β cells inhibits glucose-sensitive insulin secretion and promotes replication, corroborating its proliferative effect on β cells (13) and postnatal neuronal precursors (12). These observations argue that NPY downregulation is critical for β cell maturation and entry into quiescence. However, given the large-scale regulatory molecular changes that accompany β cell maturation, including changes in insulin signaling, the transcription factor profile, and epigenetic landscape, the observed decline in NPY expression may alternatively be an outcome rather than a driver of maturation. The functional significance of NPY expression in islets gains support from models of NPY loss and gain of function. Genetic loss of NPY, or its neutralization by antibodies, enhances GSIS in rodent islets (10, 31), revealing that NPY regulates β cell function. β Cell–specific ectopic expression of NPY leads to impaired GSIS in the setting of obesity (11), and reexpression of NPY in β cells in rats treated with glucocorticoids partly drives the increased plasma insulin (31–33), highlighting a direct role for islet NPY in regulation of insulin secretion. Our experiments on the knockdown of Npy in isolated neonatal islets further suggest a direct role for NPY in regulating β cell replication and GSIS during maturation. However, these studies do not rule out the contribution of NPY expression in non–β islet cells, such as the α and γ cells. It is possible that loss of NPY in α and γ cells alters glucagon and somatostatin secretion, thus indirectly affecting GSIS. While NPY expression is repressed in adult β cells, it persists in the adult γ cells. Given that the knockdown of Npy in adult islets does not have a significant effect on GSIS, the contribution of non–β cell NPY in the regulation of GSIS is likely restricted to neonatal islets. Future work involving β cell–specific loss of NPY will be critical in elucidating a direct role of NPY in the establishment of β cell function and mass in neonatal life.
NPY is reexpressed in adult β cells in several rodent models of β cell functional impairment and dedifferentiation. Adult β cells lacking NeuroD1 reexpress NPY, coincident with altered metabolic and insulin secretion profiles that resemble immature β cells (15). NPY also marks a highly proliferative insulin– cell-type derived from β cells that contributes to compensatory β cell expansion upon partial pancreatectomy (34). Impairment of β cell maturity contributes to β cell dysfunction in diabetes (17, 18, 35). Increased NPY in β cells upon diet-induced expansion and preceding diabetes onset in the rodent models suggests that cellular stress rather than hyperglycemia induces loss of β cell maturity. This is supported by studies showing inactivation of β cell transcription factors under conditions of oxidative stress (17). Reemergence of NPY in diabetic islets is concordant with increased plasma NPY reported in T2D (36, 37). The relevance of NPY reexpression in diabetes pathogenesis is underscored by an increased risk for T2D associated with a SNP in the human NPY locus (38, 39) and a reported role for NPY as a minor autoantigen in T1D (40, 41).
Several studies have documented the reexpression of early developmental features and/or markers of related cell types (such as α cells) in diabetic β cells as a function of oxidative and ER stress (17, 18, 20). Our study provides another example of altered β cell identity in the context of diabetes and cellular stress. The reemergence of NPY expression in adult β cells undergoing cellular stress not only exemplifies reprogramming to resemble fetal β cell–like characteristics, but is also reminiscent of an evolutionary proximity of pancreatic endocrine cells to neurons. Diet-induced ER stress has also been shown to directly increase NPY expression in rat amygdala (42). Stress-induced changes in transcription factor profiles and loss of glucose responsiveness have also been documented in transplanted islets (43). Mutations in the ER stress–protective WFS1 gene cause Wolfram syndrome, a genetic disorder characterized by diabetes. Similarly, loss of Wfs1 in mouse β cells leads to ER stress, loss of GSIS, and eventual cell death (44, 45). Recent work on the expression of fetal hormone gastrin in diabetic β cells shows that unlike fetal development, gastrin reexpression in diabetes does not involve Neurogenin3 (46). Thus, while metabolic stress can alter adult β cell identity, such that these cells express fetal-like features, the molecular pathways utilized may be different from fetal development. Studies examining human β cell identity in the context of fetal development and in diabetes have important implications in improving stem cell differentiation protocols and providing mechanistic insights into diabetes pathogenesis. Future studies are warranted to identify specific pathways that regulate β cell identity in different developmental and metabolic contexts and will benefit from the development of time-sensitive lineage-tracing models.
Methods
Human subjects.
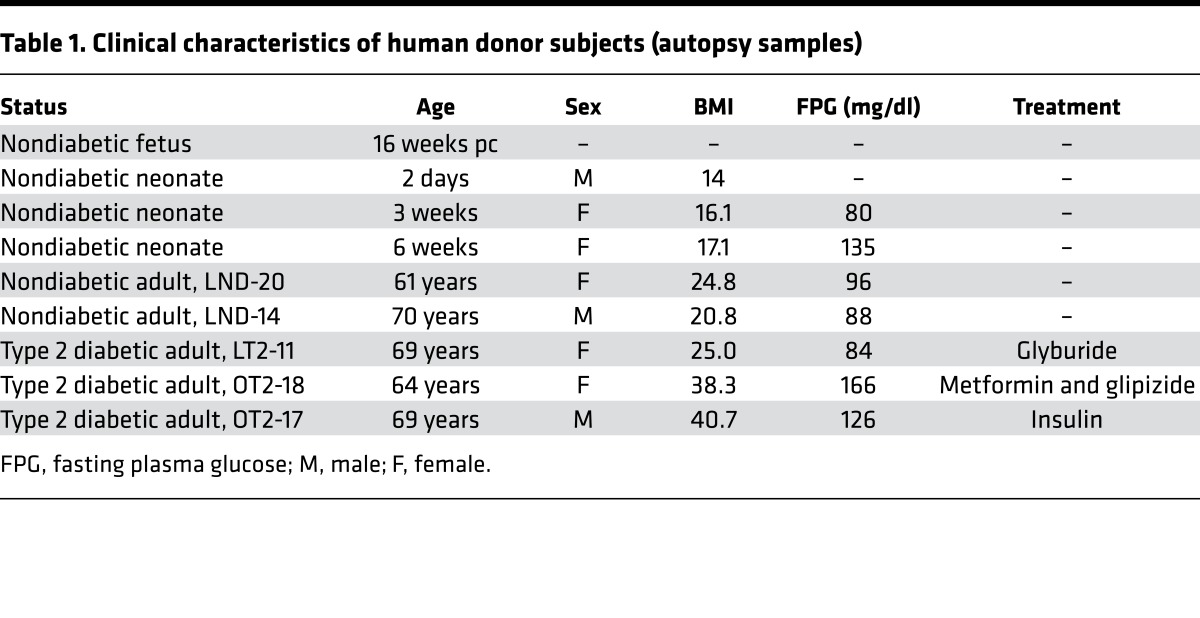
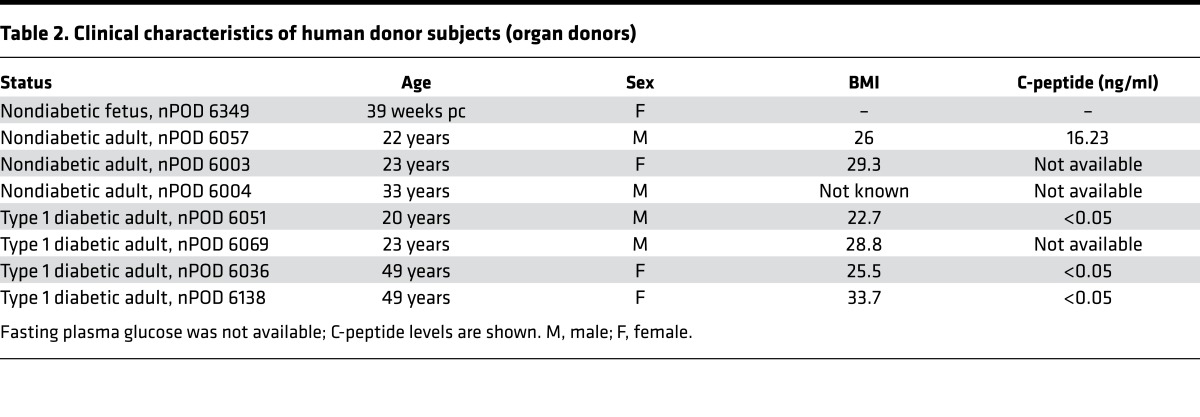
Pancreatic sections from subjects with T2D and age- and BMI-matched nondiabetic subjects (n = 2 per group) as well as neonatal human pancreatic sections were obtained from the Mayo Clinic autopsy archives. Sections from late-gestation human fetal pancreas (n = 2) as well as pancreatic tissue from the T1D and age- and BMI-matched nondiabetic donors (n = 3 per group) were procured from brain-dead organ donors by the JDRF Network for Pancreatic Organ Donors with Diabetes (nPOD), coordinated by the University of Florida at Gainesville (47). Human fetal pancreas (n = 1; 16 weeks pc) was obtained through the Terminal Tissue Bank at the USC. 4-μm sections of pancreas from the selected case subjects were obtained and made available to UCLA investigators by each entity in a manner coded to conceal the personal identity of the subjects. The case characteristics for each subject are described in Tables 1 and 2.
Table 1. Clinical characteristics of human donor subjects (autopsy samples).
Table 2. Clinical characteristics of human donor subjects (organ donors).
Animal maintenance and physiology.
Wild-type animals were maintained by mating males and females on C57BL/6J background. Ngn3-Cre (48) and RIP-Cre (49) mice were used to indelibly mark endocrine progenitor and β cell lineages in combination with the Rosa26R-YFP or Rosa26R-mTmG mice (The Jackson Laboratory) (50). Transgenic mice expressing GFP under the control of NPY (NPY-GFP; ref. 51) or mouse insulin 1 promoter (MIP-GFP; ref. 52) were used to sort NPY-expressing and insulin-expressing cells. Heterozygotic Ngn3-EGFP mouse embryos, where the coding region of Neurogenin3 is replaced by EGFP (53), were used for marking endocrine progenitors. The db/db (JAX 000642; KsJ background) and NOD (JAX 001976) mice were purchased from The Jackson Laboratory. Mice were fed ad libitum and kept under a 12-hour-light/dark cycle. Glucose and insulin tolerance tests were performed as previously described (54). For HFD studies, 1.5-month-old male NPY-GFP mice were fed with control diet (4.4% calories from fat; Envigo) or HFD (55% calories from fat, Envigo TD.93075) for 8 weeks.
Immunostaining and morphometric analyses.
Standard immunofluorescence protocol was used for the detection of various proteins in pancreatic sections as previously described (54). Primary antibodies were diluted in the blocking solution at the following dilutions: rabbit anti-NPY (1:2,000, Peninsula Laboratories T-4070); rabbit anti-PYY (1:5,000; Abcam ab131246); mouse anti-glucagon (1:1,000, Sigma-Aldrich G2654-.2ML); rabbit anti-glucagon (1:500, Immunostar 20076); guinea pig anti-insulin (1:200, Dako A0564); rat anti-somatostatin (1:300, EMD Millipore MAB354); goat anti-PP (1:150, Everest Biotech EB06805); rat anti-ghrelin (1:50, R&D Systems MAB8200); mouse anti-Nkx6.1 (1:50, Developmental Studies Hybridoma Bank F55A1-0S); mouse anti-Pdx1(1:200, Developmental Studies Hybridoma Bank F109-D12-S); rabbit anti-MafA (1:500, Bethyl Laboratories A300-611A); mouse anti-Ki67 (1:50, BD Biosciences 550609); Mcm2 (1:500, BD Biosciences 610701); and chicken anti-GFP (1:250, Aves Labs Inc. 1020). Donkey- and goat-derived secondary antibodies conjugated to FITC, Cy3, Cy5, Alexa 448, and Alexa 647 were diluted 1:200 (Jackson ImmunoResearch). MafA and NPY coimmunostaining was performed by using a protocol for using two antibodies raised in the same species (55).
Slides were viewed using a Leica DM6000 microscope (Leica Microsystems), and images were acquired using Openlab software (Improvision). To measure NPY+ β cells, all islets were imaged across pancreatic sections immunostained for insulin and NPY. The total number of insulin+ and NPY+ cells was manually counted, along with cells positive for both NPY and insulin. The data are expressed as the percentage of total β cells. Ki67 and Mcm2 were used as markers of replication in NPY+ and NPY– β cells. Pancreatic sections immunostained for insulin, NPY, and Ki67 or Mcm2 were imaged (3–5 animals per group; 3 sections per animal; all β cells counted). The number of β cells positive or negative for NPY expression was quantified. The number of Ki67+ or Mcm2+ and Ki67– or Mcm2– cells in both these β cell subpopulations was then determined by manually counting. The data for NPY+Ins+Ki67+ or Mcm2+ and NPY–Ins+Ki67+ or Mcm2+ cells was expressed as a percentage of NPY+ and NPY– β cells, respectively. β Cell mass was measured according to published protocols (54).
Islet isolation, cell sorting, and GSIS.
Islets were isolated from mouse pancreata using perfusion with the Liberase enzyme blend (Roche Diagnostics) as described previously (54). For isolation of islets from the neonatal mice, pancreata were collected from 5–8 pups at appropriate stages without perfusion through the bile duct and pooled and processed for islet isolation as above. For β cell sorting, islets from the MIP-GFP– or NPY-GFP–transgenic mice at appropriate developmental stages were digested into single cells and sorted for GFP by FACS to an average percentage purity of 85%–95%. Cells from wild-type islets were used as a negative control for FACS gating. GSIS was assessed using a static incubation assay as previously described (25).
siRNA knockdown and expression analysis.
Knockdown of Npy in neonatal islets was performed by transfection with a pool of specific targeting small inhibitory RNAs (siRNAs) or scrambled controls (Dharmacon GE HealthCare). Transfections were performed in OPTI-MEM medium using Lipofectamine-RNAiMAX (ThermoFisher), according to the manufacturer’s instructions. Islets were transfected with appropriate targeting or scrambled siRNAs in suspension culture and harvested 2 days after transfection for subsequent applications. RNA was isolated from islets using the RNeasyPlus Micro Kit (Qiagen) and digested with RNase-free DNase (Fermentas) to eliminate DNA. 0.5–1.0 μg RNA was used for preparation of cDNA using Superscript III Reverse Transcriptase (Life Technologies) using oligodT priming. Real-time RT-PCRs were performed using the 1X FastSybrGreen Mix (Applied Biosystems) in the QuantStudio6 Flex system (Applied Biosystems). The expression of each transcript was normalized to Cyclophilin. RT-PCR primers are listed in Supplemental Table 1.
ChIP.
ChIP analyses on sorted β cells and islets were carried out using a modified micro-ChIP protocol as described before (25). The following antibodies were used: H3K9me3 (EMD Millipore 07-442), H3K9Ac (Abcam AB12179), CBP (Diagenode C15410224-25), HDAC2 (Abcam AB12169), and control mouse and rabbit IgGs (Diagenode; KCH-819-015 and KCH-504-250, respectively). The primers used to amplify the Npy locus are listed in Supplemental Table 2.
Statistics.
All data are expressed as mean ± SEM. Mean and SEM values were calculated from triplicates, at least, of a representative experiment. The statistical significance of differences was measured by unpaired, 2-tailed Student’s t test for experiments with two groups and a continuous outcome or using 1-way ANOVA for studies with repeat measures, with Bonferroni or Fisher’s LSD post-hoc tests. A P value of less than 0.05 indicated statistical significance.
Study approval.
Mayo Clinic autopsy archive samples were obtained with IRB permission (IRB 15-004992) from both the Mayo Clinic and UCLA. Samples obtained from nPOD were procured in accordance with federal guidelines for organ donation and the University of Florida IRB. Samples obtained from the Terminal Tissue Bank at the USC were procured according to the protocols approved by the USC and CHLA IRBs (IRB CHLA-15-00344). All animal experiments were performed in accordance with NIH policies on the use of laboratory animals and approved by the Animal Research Committee of the Office for the Protection of Research Subjects at UCLA.
Author contributions
SD, PR, MR, and ASMM performed the experiments. SD, PR, MR, ASMM, and AEB performed the analyses. SD and AEB conceived and planned the experiments. SD, AEB, and SKG interpreted data. SD, AEB, and SKG wrote the manuscript. SD is the guarantor of this work and, as such, had full access to all of the data in the study and takes responsibility for the integrity of the data and the accuracy of the data analysis.
Supplementary Material
Acknowledgments
We thank Peter C. Butler (UCLA) for helpful discussions, critical input, and support and Anil Bhushan (UCSF) for the gift of RIP-Cre mice. We are grateful to Robert Rizza (Mayo Clinic) for providing autopsy pancreas samples from the Mayo Clinic Repository and for helpful comments. We thank Tatyana Gurlo (UCLA) for helpful discussions. We also thank Jalaal Abdul and Megan Cory (UCLA) for technical support. We would like to thank Rachel Steward and the Family Planning Associates for the (fetal) tissue donation (CHLA tissue repository). SKG is supported by a Larry L. Hillblom Foundation grant (2015-D-006-SUP). This work was supported by grants from the Juvenile Diabetes Research Foundation (1-FAC-2015-10-A-N) and the Larry L. Hillblom Foundation (2012-D-006-SUP), UCLA Department of Medicine start-up support to SD, and a pilot grant from the Helmsley Charitable Trust George S. Eisenbarth nPOD Award for Team Science (2015PG-T1D052), subaward 664215 to AEB and SD.
Footnotes
Conflict of interest: The authors have declared that no conflict of interest exists.
Reference information:JCI Insight. 2017;2(12):e94005. https://doi.org/10.1172/jci.insight.94005.
Contributor Information
Pope Rodnoi, Email: prodnoi@mednet.ucla.edu.
Mohan Rajkumar, Email: memohansingh@gmail.com.
Sangeeta Dhawan, Email: sdhawan@mednet.ucla.edu.
References
- 1.Nair G, Hebrok M. Islet formation in mice and men: lessons for the generation of functional insulin-producing β-cells from human pluripotent stem cells. Curr Opin Genet Dev. 2015;32:171–180. doi: 10.1016/j.gde.2015.03.004. [DOI] [PMC free article] [PubMed] [Google Scholar]
- 2.Ahrén B. Autonomic regulation of islet hormone secretion--implications for health and disease. Diabetologia. 2000;43(4):393–410. doi: 10.1007/s001250051322. [DOI] [PubMed] [Google Scholar]
- 3.Borden P, Houtz J, Leach SD, Kuruvilla R. Sympathetic innervation during development is necessary for pancreatic islet architecture and functional maturation. Cell Rep. 2013;4(2):287–301. doi: 10.1016/j.celrep.2013.06.019. [DOI] [PMC free article] [PubMed] [Google Scholar]
- 4.Arntfield ME, van der Kooy D. β-Cell evolution: How the pancreas borrowed from the brain: The shared toolbox of genes expressed by neural and pancreatic endocrine cells may reflect their evolutionary relationship. Bioessays. 2011;33(8):582–587. doi: 10.1002/bies.201100015. [DOI] [PubMed] [Google Scholar]
- 5.Ohta Y, et al. Convergence of the insulin and serotonin programs in the pancreatic β-cell. Diabetes. 2011;60(12):3208–3216. doi: 10.2337/db10-1192. [DOI] [PMC free article] [PubMed] [Google Scholar]
- 6.Atouf F, Czernichow P, Scharfmann R. Expression of neuronal traits in pancreatic beta cells. Implication of neuron-restrictive silencing factor/repressor element silencing transcription factor, a neuron-restrictive silencer. J Biol Chem. 1997;272(3):1929–1934. doi: 10.1074/jbc.272.3.1929. [DOI] [PubMed] [Google Scholar]
- 7.Mulder H, Myrsén-Axcrona U, Gebre-Medhin S, Ekblad E, Sundler F. Expression of non-classical islet hormone-like peptides during the embryonic development of the pancreas. Microsc Res Tech. 1998;43(4):313–321. doi: 10.1002/(SICI)1097-0029(19981115)43:4<313::AID-JEMT5>3.0.CO;2-C. [DOI] [PubMed] [Google Scholar]
- 8.Teitelman G, Alpert S, Polak JM, Martinez A, Hanahan D. Precursor cells of mouse endocrine pancreas coexpress insulin, glucagon and the neuronal proteins tyrosine hydroxylase and neuropeptide Y, but not pancreatic polypeptide. Development. 1993;118(4):1031–1039. doi: 10.1242/dev.118.4.1031. [DOI] [PubMed] [Google Scholar]
- 9.Tatemoto K, Carlquist M, Mutt V. Neuropeptide Y--a novel brain peptide with structural similarities to peptide YY and pancreatic polypeptide. Nature. 1982;296(5858):659–660. doi: 10.1038/296659a0. [DOI] [PubMed] [Google Scholar]
- 10.Imai Y, Patel HR, Hawkins EJ, Doliba NM, Matschinsky FM, Ahima RS. Insulin secretion is increased in pancreatic islets of neuropeptide Y-deficient mice. Endocrinology. 2007;148(12):5716–5723. doi: 10.1210/en.2007-0404. [DOI] [PubMed] [Google Scholar]
- 11.Machida Y, et al. Pancreatic islet neuropeptide Y overexpression has minimal effect on islet morphology and β-cell adaptation to high-fat diet. Endocrinology. 2014;155(12):4634–4640. doi: 10.1210/en.2014-1537. [DOI] [PMC free article] [PubMed] [Google Scholar]
- 12.Hansel DE, Eipper BA, Ronnett GV. Neuropeptide Y functions as a neuroproliferative factor. Nature. 2001;410(6831):940–944. doi: 10.1038/35073601. [DOI] [PubMed] [Google Scholar]
- 13.Cho YR, Kim CW. Neuropeptide Y promotes beta-cell replication via extracellular signal-regulated kinase activation. Biochem Biophys Res Commun. 2004;314(3):773–780. doi: 10.1016/j.bbrc.2003.12.170. [DOI] [PubMed] [Google Scholar]
- 14.Bernal-Mizrachi E, Kulkarni RN, Scott DK, Mauvais-Jarvis F, Stewart AF, Garcia-Ocaña A. Human β-cell proliferation and intracellular signaling part 2: still driving in the dark without a road map. Diabetes. 2014;63(3):819–831. doi: 10.2337/db13-1146. [DOI] [PMC free article] [PubMed] [Google Scholar]
- 15.Gu C, et al. Pancreatic beta cells require NeuroD to achieve and maintain functional maturity. Cell Metab. 2010;11(4):298–310. doi: 10.1016/j.cmet.2010.03.006. [DOI] [PMC free article] [PubMed] [Google Scholar]
- 16.Martens GA, et al. Functional characteristics of neonatal rat β cells with distinct markers. J Mol Endocrinol. 2014;52(1):11–28. doi: 10.1530/JME-13-0106. [DOI] [PubMed] [Google Scholar]
- 17.Guo S, et al. Inactivation of specific β cell transcription factors in type 2 diabetes. J Clin Invest. 2013;123(8):3305–3316. doi: 10.1172/JCI65390. [DOI] [PMC free article] [PubMed] [Google Scholar]
- 18.Talchai C, Xuan S, Lin HV, Sussel L, Accili D. Pancreatic β cell dedifferentiation as a mechanism of diabetic β cell failure. Cell. 2012;150(6):1223–1234. doi: 10.1016/j.cell.2012.07.029. [DOI] [PMC free article] [PubMed] [Google Scholar]
- 19.Whim MD. Pancreatic beta cells synthesize neuropeptide Y and can rapidly release peptide co-transmitters. PLoS ONE. 2011;6(4):e19478. doi: 10.1371/journal.pone.0019478. [DOI] [PMC free article] [PubMed] [Google Scholar]
- 20.Butler AE, Robertson RP, Hernandez R, Matveyenko AV, Gurlo T, Butler PC. Beta cell nuclear musculoaponeurotic fibrosarcoma oncogene family A (MafA) is deficient in type 2 diabetes. Diabetologia. 2012;55(11):2985–2988. doi: 10.1007/s00125-012-2666-2. [DOI] [PMC free article] [PubMed] [Google Scholar]
- 21.Dor Y, Brown J, Martinez OI, Melton DA. Adult pancreatic beta-cells are formed by self-duplication rather than stem-cell differentiation. Nature. 2004;429(6987):41–46. doi: 10.1038/nature02520. [DOI] [PubMed] [Google Scholar]
- 22.Georgia S, Bhushan A. Beta cell replication is the primary mechanism for maintaining postnatal beta cell mass. J Clin Invest. 2004;114(7):963–968. doi: 10.1172/JCI22098. [DOI] [PMC free article] [PubMed] [Google Scholar]
- 23.Meier JJ, et al. Beta-cell replication is the primary mechanism subserving the postnatal expansion of beta-cell mass in humans. Diabetes. 2008;57(6):1584–1594. doi: 10.2337/db07-1369. [DOI] [PMC free article] [PubMed] [Google Scholar]
- 24.Blum B, Hrvatin SS, Schuetz C, Bonal C, Rezania A, Melton DA. Functional beta-cell maturation is marked by an increased glucose threshold and by expression of urocortin 3. Nat Biotechnol. 2012;30(3):261–264. doi: 10.1038/nbt.2141. [DOI] [PMC free article] [PubMed] [Google Scholar]
- 25.Dhawan S, et al. DNA methylation directs functional maturation of pancreatic β cells. J Clin Invest. 2015;125(7):2851–2860. doi: 10.1172/JCI79956. [DOI] [PMC free article] [PubMed] [Google Scholar]
- 26.Opara EC, Burch WM, Taylor IL, Akwari OE. Pancreatic hormone response to neuropeptide Y (NPY) perifusion in vitro. Regul Pept. 1991;34(3):225–233. doi: 10.1016/0167-0115(91)90181-F. [DOI] [PubMed] [Google Scholar]
- 27.Schwetz TA, Ustione A, Piston DW. Neuropeptide Y and somatostatin inhibit insulin secretion through different mechanisms. Am J Physiol Endocrinol Metab. 2013;304(2):E211–E221. doi: 10.1152/ajpendo.00374.2012. [DOI] [PMC free article] [PubMed] [Google Scholar]
- 28.Jackerott M, Oster A, Larsson LI. PYY in developing murine islet cells: comparisons to development of islet hormones, NPY, and BrdU incorporation. J Histochem Cytochem. 1996;44(8):809–817. doi: 10.1177/44.8.8756753. [DOI] [PubMed] [Google Scholar]
- 29.Waeber G, Hurlimann J, Nicod P, Grouzmann E. Immunolocalization of neuropeptide Y in human pancreatic endocrine tumors. Peptides. 1995;16(5):921–926. doi: 10.1016/0196-9781(95)00057-Q. [DOI] [PubMed] [Google Scholar]
- 30.Dorrell C, et al. Human islets contain four distinct subtypes of β cells. Nat Commun. 2016;7:11756. doi: 10.1038/ncomms11756. [DOI] [PMC free article] [PubMed] [Google Scholar]
- 31.Wang ZL, Bennet WM, Wang RM, Ghatei MA, Bloom SR. Evidence of a paracrine role of neuropeptide-Y in the regulation of insulin release from pancreatic islets of normal and dexamethasone-treated rats. Endocrinology. 1994;135(1):200–206. doi: 10.1210/endo.135.1.8013354. [DOI] [PubMed] [Google Scholar]
- 32.Myrsén U, Ahrén B, Sundler F. Neuropeptide Y is expressed in subpopulations of insulin- and non-insulin-producing islet cells in the rat after dexamethasone treatment: a combined immunocytochemical and in situ hybridisation study. Regul Pept. 1995;60(1):19–31. doi: 10.1016/0167-0115(95)00114-5. [DOI] [PubMed] [Google Scholar]
- 33.Ogawa A, et al. Roles of insulin resistance and beta-cell dysfunction in dexamethasone-induced diabetes. J Clin Invest. 1992;90(2):497–504. doi: 10.1172/JCI115886. [DOI] [PMC free article] [PubMed] [Google Scholar]
- 34.El-Gohary Y, et al. A smad signaling network regulates islet cell proliferation. Diabetes. 2014;63(1):224–236. doi: 10.2337/db13-0432. [DOI] [PMC free article] [PubMed] [Google Scholar]
- 35.Butler AE, et al. β-Cell deficit in obese type 2 diabetes, a minor role of β-cell dedifferentiation and degranulation. J Clin Endocrinol Metab. 2016;101(2):523–532. doi: 10.1210/jc.2015-3566. [DOI] [PMC free article] [PubMed] [Google Scholar]
- 36.Ilhan A, et al. Plasma neuropeptide Y levels differ in distinct diabetic conditions. Neuropeptides. 2010;44(6):485–489. doi: 10.1016/j.npep.2010.08.001. [DOI] [PubMed] [Google Scholar]
- 37.Milewicz A, Mikulski E, Bidzińska B. Plasma insulin, cholecystokinin, galanin, neuropeptide Y and leptin levels in obese women with and without type 2 diabetes mellitus. Int J Obes Relat Metab Disord. 2000;24 Suppl 2:S152–S153. doi: 10.1038/sj.ijo.0801310. [DOI] [PubMed] [Google Scholar]
- 38.Nordman S, et al. Leu7Pro polymorphism in the neuropeptide Y (NPY) gene is associated with impaired glucose tolerance and type 2 diabetes in Swedish men. Exp Clin Endocrinol Diabetes. 2005;113(5):282–287. doi: 10.1055/s-2005-865650. [DOI] [PubMed] [Google Scholar]
- 39.Ukkola O, Kesäniemi YA. Leu7Pro polymorphism of PreproNPY associated with an increased risk for type II diabetes in middle-aged subjects. Eur J Clin Nutr. 2007;61(9):1102–1105. doi: 10.1038/sj.ejcn.1602621. [DOI] [PubMed] [Google Scholar]
- 40.Hirai H, et al. Selective screening of secretory vesicle-associated proteins for autoantigens in type 1 diabetes: VAMP2 and NPY are new minor autoantigens. Clin Immunol. 2008;127(3):366–374. doi: 10.1016/j.clim.2008.01.018. [DOI] [PMC free article] [PubMed] [Google Scholar]
- 41.Skärstrand H, et al. Neuropeptide Y is a minor autoantigen in newly diagnosed type 1 diabetes patients. Pediatr Diabetes. 2015;16(8):621–628. doi: 10.1111/pedi.12222. [DOI] [PubMed] [Google Scholar]
- 42.Castro G, et al. Diet-induced obesity induces endoplasmic reticulum stress and insulin resistance in the amygdala of rats. FEBS Open Bio. 2013;3:443–449. doi: 10.1016/j.fob.2013.09.002. [DOI] [PMC free article] [PubMed] [Google Scholar]
- 43.Dai C, et al. Stress-impaired transcription factor expression and insulin secretion in transplanted human islets. J Clin Invest. 2016;126(5):1857–1870. doi: 10.1172/JCI83657. [DOI] [PMC free article] [PubMed] [Google Scholar]
- 44.Fonseca SG, et al. Wolfram syndrome 1 gene negatively regulates ER stress signaling in rodent and human cells. J Clin Invest. 2010;120(3):744–755. doi: 10.1172/JCI39678. [DOI] [PMC free article] [PubMed] [Google Scholar]
- 45.Ishihara H, et al. Disruption of the WFS1 gene in mice causes progressive beta-cell loss and impaired stimulus-secretion coupling in insulin secretion. Hum Mol Genet. 2004;13(11):1159–1170. doi: 10.1093/hmg/ddh125. [DOI] [PubMed] [Google Scholar]
- 46.Dahan T, et al. Pancreatic β-cells express the fetal islet hormone gastrin in rodent and human diabetes. Diabetes. 2017;66(2):426–436. doi: 10.2337/db16-0641. [DOI] [PMC free article] [PubMed] [Google Scholar]
- 47.Campbell-Thompson M, et al. Network for Pancreatic Organ Donors with Diabetes (nPOD): developing a tissue biobank for type 1 diabetes. Diabetes Metab Res Rev. 2012;28(7):608–617. doi: 10.1002/dmrr.2316. [DOI] [PMC free article] [PubMed] [Google Scholar]
- 48.Schonhoff SE, Giel-Moloney M, Leiter AB. Neurogenin 3-expressing progenitor cells in the gastrointestinal tract differentiate into both endocrine and non-endocrine cell types. Dev Biol. 2004;270(2):443–454. doi: 10.1016/j.ydbio.2004.03.013. [DOI] [PubMed] [Google Scholar]
- 49.Herrera PL. Adult insulin- and glucagon-producing cells differentiate from two independent cell lineages. Development. 2000;127(11):2317–2322. doi: 10.1242/dev.127.11.2317. [DOI] [PubMed] [Google Scholar]
- 50.Soriano P. Generalized lacZ expression with the ROSA26 Cre reporter strain. Nat Genet. 1999;21(1):70–71. doi: 10.1038/5007. [DOI] [PubMed] [Google Scholar]
- 51.van den Pol AN, et al. Neuromedin B and gastrin-releasing peptide excite arcuate nucleus neuropeptide Y neurons in a novel transgenic mouse expressing strong Renilla green fluorescent protein in NPY neurons. J Neurosci. 2009;29(14):4622–4639. doi: 10.1523/JNEUROSCI.3249-08.2009. [DOI] [PMC free article] [PubMed] [Google Scholar]
- 52.Hara M, et al. Transgenic mice with green fluorescent protein-labeled pancreatic beta -cells. Am J Physiol Endocrinol Metab. 2003;284(1):E177–E183. doi: 10.1152/ajpendo.00321.2002. [DOI] [PubMed] [Google Scholar]
- 53.Lee CS, Perreault N, Brestelli JE, Kaestner KH. Neurogenin 3 is essential for the proper specification of gastric enteroendocrine cells and the maintenance of gastric epithelial cell identity. Genes Dev. 2002;16(12):1488–1497. doi: 10.1101/gad.985002. [DOI] [PMC free article] [PubMed] [Google Scholar]
- 54.Tschen SI, Dhawan S, Gurlo T, Bhushan A. Age-dependent decline in beta-cell proliferation restricts the capacity of beta-cell regeneration in mice. Diabetes. 2009;58(6):1312–1320. doi: 10.2337/db08-1651. [DOI] [PMC free article] [PubMed] [Google Scholar]
- 55.Md Moin AS, Dhawan S, Shieh C, Butler PC, Cory M, Butler AE. Increased hormone-negative endocrine cells in the pancreas in type 1 diabetes. J Clin Endocrinol Metab. 2016;101(9):3487–3496. doi: 10.1210/jc.2016-1350. [DOI] [PMC free article] [PubMed] [Google Scholar]
Associated Data
This section collects any data citations, data availability statements, or supplementary materials included in this article.


