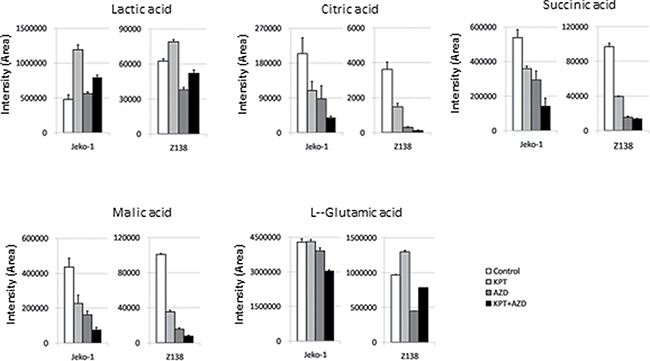
Figure 4. Quantification of metabolites affected by KPT-185, AZD-2014, or KPT-185+AZD-2014.

The metabolites indicated were quantified inJeko-1 and Z138 cells treated with KPT-185, AZD-2014, or KPT-185+AZD-2014 (combination) for 18 hours (Jeko1:KPT-185 50 nM, AZD-2014 50 nM; Z138:KPT-185 25 nM, AZD-2014 50 nM) by CE-TOF-MS analysis. Graphs show the means ± SD of results in two independent experiments.
