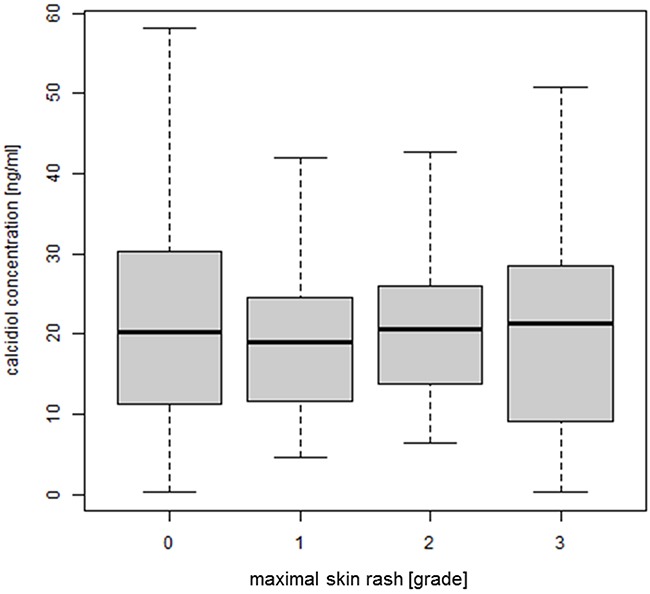
Figure 5. Correlation between plasma concentration of calcidiol and EGFRI-induced skin rash.

The concentration of calcidiol was determined by ELISA (n = 211) and plotted against the maximal grade of skin rash developed during observation period; ANOVA, p-value = 0.415. Abbreviations: ANOVA, analysis of variance; ELISA, enzyme-linked immunosorbent assay; EGFRI, epidermal growth factor receptor inhibitor.
