

Abstract
Metastasis is the leading cause of cancer-related deaths; metastatic lesions develop from disseminated cancer cells (DCCs) that can remain dormant1. Metastasis-initiating cells are thought to originate from a subpopulation present in progressed, invasive tumours2. However, DCCs detected in patients before the manifestation of breast-cancer metastasis contain fewer genetic abnormalities than primary tumours or than DCCs from patients with metastases3–5. These findings, and those in pancreatic cancer6 and melanoma7 models, indicate that dissemination might occur during the early stages of tumour evolution3,8,9. However, the mechanisms that might allow early disseminated cancer cells (eDCCs) to complete all steps of metastasis are unknown8. Here we show that, in early lesions in mice and before any apparent primary tumour masses are detected, there is a sub-population of Her2+p-p38lop-Atf2loTwist1hiE-cadlo early cancer cells that is invasive and can spread to target organs. Intra-vital imaging and organoid studies of early lesions showed that Her2+ eDCC precursors invaded locally, intravasated and lodged in target organs. Her2+ eDCCs activated a Wnt-dependent epithelial–mesenchymal transition (EMT)-like dissemination program but without complete loss of the epithelial phenotype, which was reversed by Her2 or Wnt inhibition. Notably, although the majority of eDCCs were Twist1hiE-cadlo and dormant, they eventually initiated metastasis. Our work identifies a mechanism for early dissemination in which Her2 aberrantly activates a program similar to mammary ductal branching that generates eDCCs that are capable of forming metastasis after a dormancy phase.
We investigated whether the loss of tumour-suppressive p38 signalling and gain of oncogenic Her2 upregulation, which induce resistance to anoikis (apoptosis induced by lack of correct cell–extracellular matrix attachment) in early cancer cells10, might activate a disseminating phenotype. eDCCs were defined as those originating at times when the MMTV–Her2 (Her2 under the control of mouse mammary tumour virus) mice had normal ductal architecture, hyperplasia and mammary intraepithelial neoplasia, as confirmed by histopathology11, but no detectable tumours8 (Extended Data Fig. 1a–c). Her2 causes E-cadherin (E-cad, also known as cadherin 1) downregulation12, whereas p38 can maintain E-cadherin expression13. We found that more than 85% of Her2+ cells were E-cadlo (Fig. 1a), and in Her2+ (wild-type gene) and Her2-T+ (mutant active gene) tissues of early lesions, E-cadhi early cancer cells were more frequently phosphorylated (70–75%) (p-) ATF2hi (Fig. 1b and Extended Data Fig. 1d, e). In each duct, 60–70% of all cells from early lesions were positive for membrane β-catenin (the inactive form) (Extended Data Fig. 2a). However, when analysing Her2+ cells alone, only 30% of cells showed membrane localization for β-catenin (Fig. 1c). Overall, these results suggest that Her2+ cells display a loss of E-cadherin- and β-catenin-based junctions and are p-ATF2lo.
Figure 1. E-cadherin, Her2 and p-ATF2 levels and function in early lesion cells.

a, Top, MMTV–Her2 early lesion tissue sections co-stained for the indicated antigens. Bottom, intra-ductal heterogeneity of Her2hiE-cadlo cells. Inset, magnified view of the boxed region. Arrowheads, Her2hiE-cadlo cells; arrows, Her2loE-cadhi cells. Right, percentage of Her2hi cells that were E-cadlow or E-cadhigh (n =20 ducts; n =2 mice). ***P <0.0001. b, Representative images of E-cadhip-ATF2hi (top) and E-cadlop-ATF2lo (bottom) ducts in MMTV–Her2 early lesion tissues. Arrowhead, p-ATF2hiE-cadhi cell, arrow, p-ATF2loE-cadlo cell. Scale bars, 25 μm and 10 μm (inset) (a and b). c, MMTV–Her2 early lesion tissue sections stained for Her2 and β-catenin. Arrow, Her2+ cells with low membrane-associated β-catenin (β-catMEM-lo); arrowhead, Her2−β-catMEM-hi cells. Scale bar, 10 μm. Graph, percentage of early lesion cells with β-catMEM that were Her2− or Her2+ (Her2, *P =0.035 and Her2-T, *P =0.0008). MMTV–Her2 n = 30 ducts per mouse, n =3 mice; MMTV–Her2-T n = 10 ducts per mouse, n =2 mice. d, MMTV–Her2 early lesion organoids treated for 48 h with DMSO or 5 μM SB203580. BF, bright field. Bottom imagees indicate magnified, boxed regions. Scale bars, 15 μm (left), 40 μm (right). e, MMTV–Her2 organoids stained for the indicated antigens. Arrowheads, invasive cells; arrow, intact laminin-V layer. Scale bars, 25 μm (e), 10 μm (insets 1 and 2). f, MMTV–Her2 early lesion sections co-stained for the indicated antigens. Arrows, Her2+E-cadlo invading cells. Top numbers, percentage of Her2+ E-cadlo invading cells in early lesion sections, n = 58 cells per section, n = 2 mice. Graph, percentage E-cadlo invading cells in MCF10A-HER2 (10A-Her2; see also Extended Data Fig. 3a) or MMTV–Her2 organoids. n = 20 MCF10A-HER2 organoids. a, c, one-sided Mann–Whitney U-test. Data are median ±s.e.m.
Overt MMTV–Her2 tumours showed low levels of E-cadherin, phosphorylated p38 (p-p38) and p-ATF2, while maintaining high p-ERK1/2 (p-ERK1 and p-ERK2) levels (Extended Data Fig. 2b–d), suggesting that a Her2+p-ATF2loE-cadlo profile is present in early lesions and primary tumours. We found that only HER2− human ductal carcinoma in situ (DCIS) lesions retained both high p-ATF2 expression levels and organized E-cadherin junctions, whereas HER2+ DCIS lesions showed low expression levels for p-ATF2 and E-cadherin (Extended Data Fig. 2e, f). The HER2+p-p38lop-ATF2lo profile was also present in larger human HER2+ breast carcinomas, whereas only HER2− tumours showed strong nuclear staining for p-p38 and p-ATF2 compared to HER2+ lesions (Extended Data Fig. 2g). We conclude that, in early human and mouse cancer cells, HER2 upregulation is associated with a p-p38lop-ATF2loE-cadlo profile that persists in large primary tumours.
The above data suggest that p38 might prevent an invasive phenotype and therefore Her2+E-cadlop-p38lop-ATF2lo cells from early lesions might be able to disseminate. MMTV–Her2 early lesions and MCF10A (a human mammary gland cell line) cells overexpressing HER2 (denoted as MCF10A-HER2) grown in 3D-organoid cultures show misshapen architecture and occasional single-cell invasion from the organoids (Extended Data Fig. 3a, b). Treatment of MCF10A-HER2 cells (Extended Data Fig. 3c, d) or MMTV–Her2 organoids (Extended Data Fig. 3e) with lapatinib, which reduced p-S6 levels through inhibition of epidermal growth factor receptor (EGFR) and Her2 (Extended Data Fig. 3d), or with HER2 (also known as ERBB2) short interfering RNAs (siRNAs) restored E-cadherin junctions and increased p-ATF2 levels (Extended Data Fig. 3c, e). Inhibition of EGFR signalling to AKT using AG1478 also increased the number of E-cadherin junctions and ATF2 phosphorylation (Extended Data Fig. 3c–e). Further, a pan-PI3K inhibitor (GDC-0941) or an AKT inhibitor (MK2266) that reduced p-S6 levels also increased p-ATF2 levels (Extended Data Fig. 3d, e). Basal and lapatinib-stimulated nuclear p-ATF2 levels were completely eliminated by treatment with SB203580 (Extended Data Fig. 3f) in MCF10A-HER2 cells. We conclude that Her2 and EGFR signalling through PI3K and AKT inhibit p38 activity in cells from early lesions, and that increased p-ATF2 levels after HER2 and EGFR inhibition depend on p38α and p38β (p38α/αβ (Extended Data Fig. 3a–f).
MMTV–Her2 and MCF10A-HER2 organoids showed outward invading single cells as observed using live microscopy (Supplementary Video 1 and Fig. 1d, e), which displayed projections rich in F-actin, loss of E-cadherin junctions and focalized loss of laminin-V deposition (Fig. 1e and Extended Data Fig. 3g). Her2+ invading cells from MMTV–Her2 early lesions also showed downregulated E-cadherin in vivo (Fig. 1f). Notably, approximately 80% of E-cadlo invading cells were Her2+ and positive for cytokeratin 8 and 18 (CK8/18+), suggesting that epithelial identity was retained despite E-cadherin junction loss; only about 20% of CK8/18+ invading cells were negative for Her2 (Extended Data Fig. 3h). When we inhibited p38α/β activity in MMTV–Her2+ and MCF10A-HER2 organoids using SB203580, we found that it stimulated an invasive phenotype (Fig. 1d, e and Extended Data Fig. 3g). We conclude that Her2+E-cadlop-p38lo early cancer cells display an invasive phenotype without the loss of CK8/18 expression.
We next monitored early dissemination using high-resolution intra-vital imaging14 of MMTV–Her2–cyan fluorescent protein (CFP) transgenic mice (Fig. 2). Using a new mammary imaging window and two-photon imaging in vehicle-treated Her2–CFP mice, we found that although no invasion was detected at 10 weeks (normal ductal structure) (Fig. 2a, left and Supplementary Video 2), at 15 and 18 weeks local invasive CFP+ cells were detected invading into the stroma (Fig. 2a, middle, right and Supplementary Videos 3, 4). CFP reports faithfully for Her2-overexpressing cells, which were confirmed using double Her2 and CFP immunofluorescence (more than 90% of Her2+ cells were CFP+; Extended Data Fig. 4a). p38α/β inhibition with SB203580 stimulated invasion and CFP+ cells were now found intravasating (Fig. 2b–d and Supplementary Videos 5–7). 3D reconstruction of the videos showed unambiguously how individual cells from the ductal early lesion tissues entered the lumen of blood vessels (Fig. 2b (inset), c, d and Supplementary Videos 7, 8).
Figure 2. Intra-vital imaging of eDCC precursor intravasation.
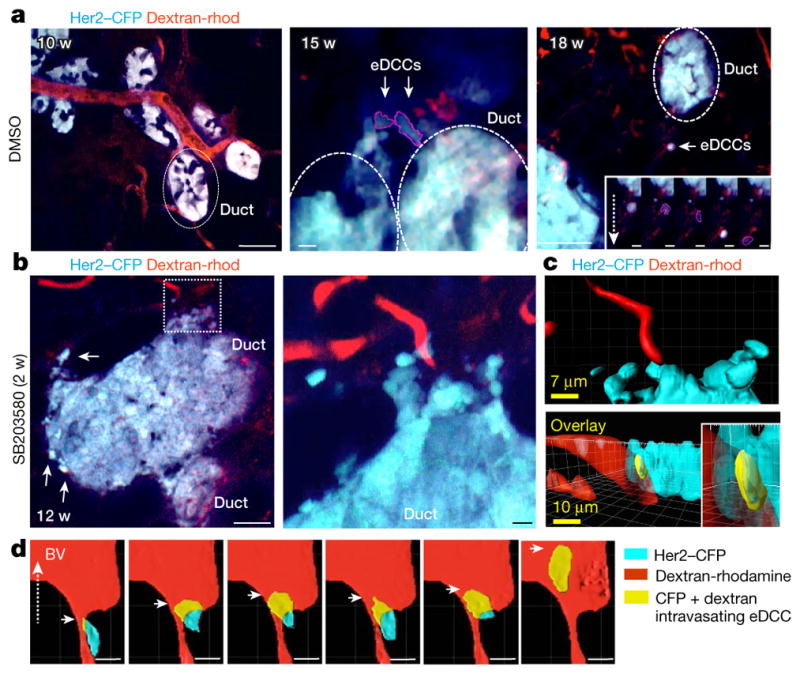
a, Her2–CFP (blue) ducts from 10- (left, Supplementary Video 2), 15- (middle, Supplementary Video 3) and 18- (right, Supplementary Video 4) week-old early lesions; scale bars, 38, 5 and 56 μm, respectively. Red, rhodamine-dextran-labelled vasculature. Dotted ellipses, ducts. Right inset: direction of movement of an eDCC at 5 time points (2 min per panel). Dotted arrow, direction of movement; scale bars in insets, 7.8 μm. b, Her2–CFP early lesion ducts from Supplementary Video 5 and Supplementary Video 6 (inset) treated with SB203580 for 2 weeks. Middle image, Higher resolution intra-vital video of the area boxed in the left image. Scale bar, 25.5 μm and 5.2 μm (boxed area). c, Top, 3D computer reconstruction of the video in b (boxed area). Bottom, rotated projection showing invasion (yellow) of early lesion cells (CFP, cyan) into blood vessels (red) (Supplementary Video 7). Scale bars, 7 μm (top) and 10 μm (bottom). d, Sequence following an early lesion cell (Supplementary Video 8) as it intravasates in mice treated with SB203580 for 4 weeks (yellow cell inside the red blood vessel (BV); 2.2 min per panel).
The intravasation documented in the videos led to successful dissemination, since we found Her2+CK8/18+ eDCCs in the blood, bone marrow and Her2+ eDCCs in lungs of 14–18-week-old mice (Extended Data Fig. 4b–j and Extended Data Table 1). Her2 detection by immunohistochemistry or immunofluorescence microscopy using two independent antibodies (mouse and rabbit) showed similar patterns of Her2 staining that were absent with the pre-immune IgG or non-oncogene expressing FVB mice (Extended Data Fig. 4c–g). Systemic inhibition of p38α/β for 2 weeks also substantially increased the numbers of early circulating cancer cells in blood (Extended Data Fig. 4h) and eDCCs in bone marrow and lungs (Extended Data Fig. 4i, j).
Treatment of MMTV–Her2 or MCF10A-HER2 early lesion organoids with SB203580 or siRNAs targeting p38α caused a loss of E-cadherin junctions (Fig. 3a, h (top) and Extended Data Fig. 5a–c). Genetic and pharmacological p38 inhibition reduced total membrane-localized inactive β-catenin and increased active-β-catenin (unphosphorylated β-catenin, detected with a conformation-specific antibody15) (Fig. 3b and Extended Data Fig. 5a, b, d, e). Inhibition of p38α/β in MCF10A-HER2 cells led to AXIN2 mRNA upregulation, a canonical target of β-catenin16 (Extended Data Fig. 5f). SNAI1 (also known as SNAIL) and TWIST1 were also upregulated in MCF10A-HER2 3D organoids treated with siRNAs targeting p38a (also known as MAPK14) or ATF2 (Extended Data Fig. 5g). Notably, systemic p38α/β inhibition in MMTV–Her2 mice induced a strong loss of E-cadherin junctions, a concomitant increase of nuclear β-catenin and a strong induction of Twist1 in early lesion tissues as detected by immunohistochemistry and quantitative PCR (Fig. 3c–f, Extended Data Fig. 5h, i). In wild-type FvB mice or MCF10A organoids treated with or without SB203580 or in wild-type compared to Mkk3−/− Mkk6+/− (also known as Map2k3−/− Map2k6+/−) C57BL/6 mice (Mkk3 and Mkk6 activate all p38 isoforms), p38 inhibition caused a loss of E-cadherin junctions (Extended Data Fig. 5j–l), but did not cause a loss of membrane β-catenin, CK8/18 expression or α-smooth-muscle-actin-positive myoepithelial cell organization (Extended Data Fig. 5m). Our data suggest that p38α and ATF2 inhibit the activity of β-catenin, preventing successful dissemination of Her2+ early lesion cells. Our data also suggest that in the absence of Her2 expression, p38 inhibition was insufficient to change β-catenin localization.
Figure 3. An EMT-like program in Her2+ early lesion cells.
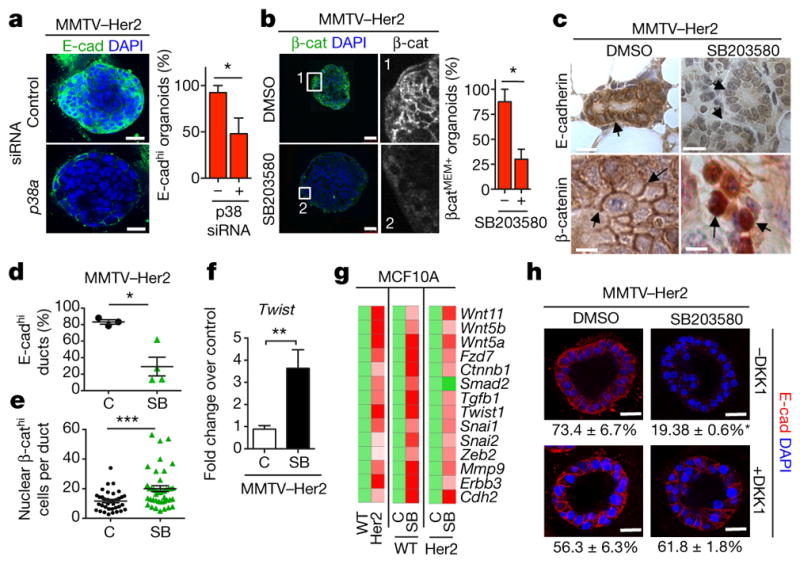
a, E-cadherin staining in early lesion MMTV–Her2 organoids transfected with control or p38a-targeting siRNA. Scale bars, 25 μm. Graph, percentage E-cadhi organoids; n = 30 organoids per treatment; *P =0.038. b, Early lesion MMTV–Her2 organoids treated for 48 h with SB203580 and stained for total β-catenin and the nuclei were counterstained with DAPI. Grey-scale panels (1, 2) denote zoomed images of boxed areas showing membrane- and cytosolic-localized β-catenin. Scale bars, 50 μm. Graph, percentage β-catMEM+ organoids; n = 10 organoids per treatment; *P =0.034. c, Early lesion tissue sections from MMTV–Her2 mice treated for 2 weeks with SB203580 stained for E-cadherin and β-catenin. Scale bars, 20 μm (top) and 10 μm (bottom). Arrows, E-cadherin (top left) and lack of signal (top right), membrane-bound β-catenin (bottom, left, arrows) or nuclear β-catenin (bottom, right, arrows). d, e, Quantification of images in c. C, control. SB, SB203580. d, Percentage of E-cadhi ducts. n =3 animals; *P =0.028. e, Percentage of nuclear β-cathi cells per duct. n = 36 ducts per 3 animals; ***P =0.0002. f, Twist1 mRNA levels in MMTV–Her2 early lesion tissues obtained from mice treated as in c. Values, fold change over control (DMSO) normalized to Gapdh. n = 3 mice per treatment; **P =0.0042. g, Heat map of EMT-related genes upregulated >2-fold (biological triplicate) in MCF10A and MCF10A-HER2 organoids treated for 6 days with or without SB203580 (5 μM). Green, control values set to 1; red, fold change over control. h, Early lesion MMTV–Her2 organoids were treated for 2 days with SB203580 (5 μM) as well as 500 ng ml−1 DKK1 and stained for E-cadherin. Bottom numbers, percentage of E-cadhi organoids; n = 10 organoids per treatment, biological duplicates. *P <0.01 (DMSO −DKK versus SB203580 −DKK and SB203580 −DKK1 versus SB203580 +DKK1); not significant (DMSO −DKK1 versus DMSO +DKK1; DMSO +DKK1 versus +DKK1 and SB203580). Scale bars, 25 μm. a, b, f, h, One-sided unpaired t-test; d, e, One-sided Mann–Whitney U-test. Data are mean ±s.e.m.
HER2 expression or p38α/β inhibition alone induced a 14-gene EMT signature that included non-canonical WNT ligands and EMT transcription factors and was further upregulated by p38 inhibition in MCF10A-HER2 cells (Fig. 3g and Extended Data Fig. 6a, b). CDH1 mRNA was also downregulated by p38 inhibition in MCF10A-HER2 organoids (Extended Data Fig. 6c). When we determined whether WNT ligands were functionally linked to the HER2-driven EMT-like program, we found that MCF10A-HER2 cells treated with SB203580 displayed AXIN2 mRNA induction, which was reversed by overexpression of the WNT-ligand antagonist SFRP1 (Extended Data Fig. 6d, e). Recombinant soluble WNT3A (ref. 17 and Methods) also stimulated expression of AXIN2 in MCF10A-HER2 cells, and this induction was substantially inhibited by expression of a constitutively active p38α kinase (p38α D176A,F327S mutant) cDNA10 (Extended Data Fig. 6f). Increased invasion, loss of E-cadherin junctions and membrane-localized β-catenin after p38α/β inhibition were reversed in SFRP1-expressing cells (Extended Data Fig. 6g, h). In addition, the canonical Wnt inhibitor DKK1 also reversed the loss of E-cadherin induced by p38 inhibition in MMTV–Her2 primary organoids (Fig. 3h). Twist1 was also readily detected as a nuclear-cluster signal using immunofluorescence microscopy in both early lesions and primary tissue from primary tumours in the MMTV–Her2 model (Extended Data Fig. 6i). Analysis of these tissues showed that Twist1 was expressed in the majority of early lesion cells and that no major changes in the expression of Twist1 occurred with progression to primary tumours. Overall, our data suggest that Her2 and p38 operate antagonistically and that Her2+p-p38lo cells from early lesions may rely on both canonical and non-canonical Wnt ligands to induce an EMT-like program associated with TWIST1 upregulation.
The majority of solitary Her2+ eDCCs (1–5 cells) in lungs were negative or weakly stained for the G1 exit marker p-Rb (p-retinoblastoma protein) compared to growing micro and macro-metastases in mice carrying primary tumours (Fig. 4a, b, d). Detection of p-Ser10 histone-H3 (a G2/M marker) also showed that most eDCCs were non-proliferative (Fig. 4d and Extended Data Fig. 6j). DCCs found in animals bearing overt tumours were termed DCCs because we could not distinguish their early lesion or primary tumour origin. Animals with overt tumours that were p-Rbstrong (Extended Data Fig. 6k) and lungs bearing proliferative (p-Rbstrong) micro- (6–50 Her2+ cells) and macro- (more than 50 Her2+ cells) metastases (Fig. 4b) still had numerous quiescent p-Rb−Her2+ DCCs (Fig. 4a, d). We conclude that eDCCs are primarily p-Rb−p-H3− and that even in animals bearing metastases, more than 60% of single or less than 5-cell clusters are non-proliferative. Notably, the vast majority of solitary Her2+ eDCCs in lungs were negative for E-cadherin (Fig. 4e). However, Her2+ DCCs (in animals with overt primary tumours) were positive for E-cadherin in approximately 48% of the population (Fig. 4e). Also, close to 100% of the solitary Her2+ eDCCs showed high Twist1 expression, whereas only 30% of solitary Her2+ DCCs in animals with primary tumours were positive for Twist1 (Fig. 4f and Extended Data Fig. 6l). We conclude that most Her2+ eDCCs are quiescent and upregulate Twist1, whereas more than half of the DCCs during primary tumour stages downregulate Twist1 expression, suggesting that reactivation might be linked to a mesenchymal–epithelial transition18.
Figure 4. eDCC characterization and metastatic potential.
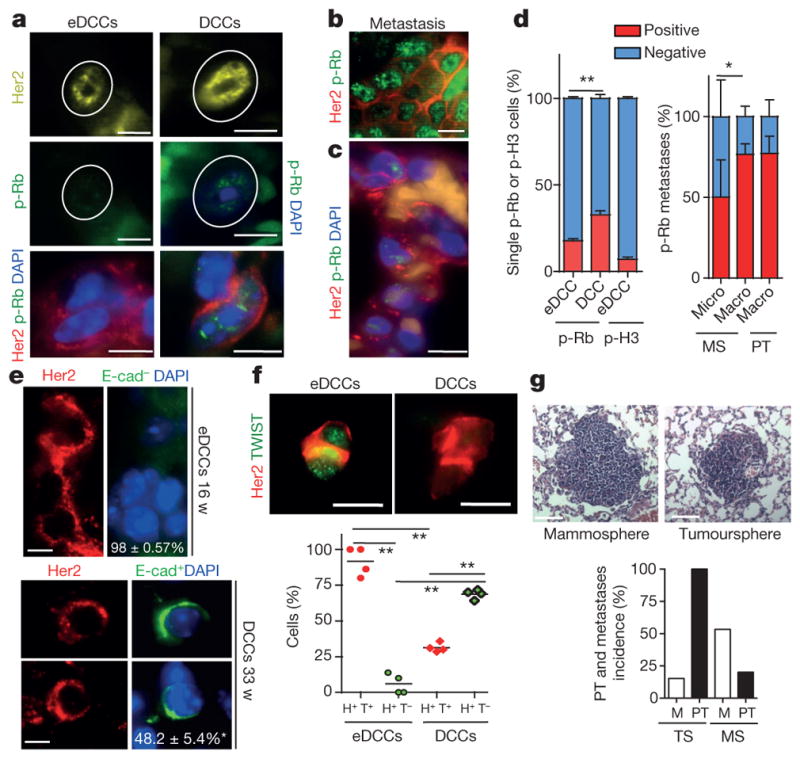
a, Her2, p-Rb and DAPI immunofluorescence detection in eDCCs and DCCs in lung sections from MMTV–Her2 mice. Scale bars, 10 μm. b, Her2 and p-Rb levels in spontaneous metastasis in MMTV–Her2 mice carrying autochthonous primary tumours. Scale bars, 10 μm. c, Her2, p-Rb and DAPI detection in micro-metastasis generated from early lesion mammospheres. Scale bars, 10 μm. d, Left, percentage of positive or negative p-Rb or p-Ser10 histone 3(H3) and Her2+ solitary eDCCs or DCCs; n = 3 animals per group; mean ±s.e.m.; **P =0.0087; one-sided, unpaired t-test. Right, Percentage of positive or negative p-Rb cells within spontaneous macro-metastases (n = 3 lesions) in Her2 mice carrying overt autochthonous primary tumours (PT) or in metastases derived from MMTV–Her2 early lesions mammospheres (MS) (n =9 micro-, n =3 macro-metastasis). *P = 0.021, one-sided, unpaired t-test; mean ± s.d. from technical replicates. e, Her2, E-cadherin and DAPI signal in eDCCs or DCCs; bottom numbers, percentage of E-cad− (top) or E-cad+ (bottom) DCCs, n ≥ 100 DCCs from 3 mice. Scale bars, 5 μm. f, Left, Her2+ (H+) and Twist1+ (T+) eDCCs; right, Her2+Twist1− (T−) DCCs. Graph, percentage of cells with the indicated profiles. n =500 cells; 4 animals per group; **P < 0.05; one-sided Mann–Whitney U-test; median and values from individual animals. Scale bars, 10 μm. g, Haematoxylin and eosin staining of lung macro-metastasis produced by MMTV–Her2 mammospheres (MS) or tumourspheres (TS). Scale bars, 150 μm. Graph, primary tumour (PT) and metastasis (M) percentage incidence of early lesions, mammospheres and primary tumourspheres. n = 15 (MS) and 13 (TS) animals.
The treatment of MMTV–HER2 mice with p38 inhibitors during early lesion stages for 2 weeks did not stimulate the dormant eDCCs to proliferate in the lungs as measured by p-Rb staining (Extended Data Fig. 6m). However, if p38 was inhibited for 2 weeks during overt primary tumour stages, DCCs responded to the p38 inhibitor and the proportion of p-Rb+ cells was increased (Extended Data Fig. 6m). These data suggest that, in agreement with Twist1 upregulation in response to p38 inhibition, the non-proliferative state of Twist1hi eDCCs is independent of p38α/β activation. However, DCCs in animals with overt tumours regain sensitivity to p38α/β inhibition as observed in other models19.
We next analysed the tumour- and metastasis-initiating capacity of pure cancer cells from early lesions. We prepared sphere cultures from MMTV–Her2 early lesions or from overt primary tumour tissues (Extended Data Fig. 7a) and found that early lesion mammospheres were more efficient at generating secondary spheres than primary tumoursphere cells (Extended Data Fig. 7b). However, after orthotopic injection into nude mouse mammary fat pads (approximately 300 spheres per site), 100% of primary tumourspheres formed primary tumours within 4–12 weeks (Fig. 4g), whereas Her2+ early lesion mammospheres did not produce obvious growing tumours (Fig. 4g and Extended Data Fig. 8); in three animals Her2+ early lesion mammospheres formed small nodules at two months but these entered stasis. The tumorigenic capacity of primary tumours over early lesion spheres correlated with enhanced p-ERK1/2 and p-S6 levels in the former (Extended Data Figs 7d, 8). Notably, Her2+ early lesion mammospheres produced lung metastases that were Her2+ and p-Rbstrong, confirming their early lesion MMTV–Her2 origin and that they can proliferate (Fig. 4c, d, g and Extended Data Fig. 7c). Spontaneous macro-metastases in MMTV–Her2 mice bearing autochthonous tumours were Her2+ and p-Rb+ (Fig. 4b, d) and macro-metastases derived from MMTV–Her2 early lesion mammospheres were also positive for p-Rb (Fig. 4c, d). Her2+ tumourspheres produced Her2+ DCCs (Extended Data Fig. 7c) and also showed macro-metastasis but with a lower incidence (around 16%) (Fig. 4g).
Mammospheres, which were re-implanted in 3D matrices and subsequently imaged, were substantially more invasive than tumour-spheres that remained globular (Extended Data Fig. 7e). We also found that experimental metastasis incidence from single-cell suspensions was 100% in both groups and no significant difference was found in the ability of early lesion or primary tumour cancer cells to produce metastatic nodules (Extended Data Fig. 7f). Our data suggest that Her2+ early lesion cells that downregulate p38 signalling and activate an EMT-like response while largely non-tumorigenic in orthotopic sites, successfully activate invasive programs that allow for efficient dissemination and metastasis formation. The latter does not seem to only depend on the ability to colonize lungs (Fig. 4c, g and Extended Data Fig. 7c, f).
Our findings identify a molecular mechanism of early dissemination. We propose that a subpopulation of Her2+CK8/18+Wnthip-p38loTwist1hiE-cadlo early cancer cells can disseminate and metastasize (Extended Data Fig. 9). Early lesion cells are more invasive than primary-tumour-derived cells, display more stemness and can intravasate and lodge in secondary organs. Notably, in addition to the work presented here, Hosseini et al.31 also show that eDCCs have metastasis-initiating capacity, which was not associated with high tumorigenic capacity or enhanced lung-colonizing potential. Analysis of ERK1/2 and AKT–mTOR pathways showed low activation of these pathways in early lesion cancer cells, suggesting they are not in a ‘growth mode’ yet. This suggests a new function for Her2, in which, prior to stimulating growth in early lesions, it activates programs of stemness, motility and invasion similar to those observed during branching morphogenesis20 that support early dissemination and metastasis.
A few studies have shown that early dissemination occurs in mammary-cancer8, pancreatic-cancer6 and melanoma7 models and in patients3,21, suggesting that our findings are not a rarity of the Her2 model. The majority (around 98%) of Her2+ single eDCCs, once in the lungs, were Her2+Twist1hi but E-cadlo and predominantly dormant. This suggests that eDCC dormancy might be linked to an EMT program, as proposed by others22,23. However, eDCCs still expressed CK8/18+, suggesting that a partial EMT is sufficient for early dissemination, dormancy and metastasis formation. This EMT program in eDCCs may allow cells to interconvert between dormant and proliferative states as transient Twist1 expression induces stem-cell programs24 while a full EMT may block metastasis24,25. Whether changes in Twist1 and E-cadherin expression control the reactivation in lungs remains unknown.
Our work also reveals an unexpected role for p38α/β kinases26 and ATF2 (ref. 27) in antagonizing Her2 signalling early in cancer progression. E-cadherin junction regulation by p38-mediated13 and/or ATF2-mediated blockade of β-catenin activity28, may explain how these proteins block early dissemination. eDCC precursors showed low p38 activation and eDCCs were not stimulated to proliferate after systemic p38α/β inhibition, which stimulated expansion of DCCs in other models1. Thus, eDCC dormancy seems to be p38α/β independent. By contrast, p38 appeared to regulate DCC dormancy during late stages of progression as shown in other models1. The mechanism behind this p38 switch between eDCCs and DCCs remains unknown. The data in the study by Hosseini et al.31, using genetic lineage analysis, showed that a large proportion of metastases are derived from eDCC ancestors. Thus, understanding the differences between eDCCs and DCCs is important to better adapt the targeting of these different DCC populations.
Our findings change our understanding of how certain oncogenes may initiate dissemination before triggering aggressive proliferation and how tumour-suppressor pathways might suppress metastasis, a function that has been attributed to p38 (ref. 1), but was never linked to the early dissemination process. The related study31 and our work may also open doors to explain phenomena like metastases in cancer of unknown primary origin29 and in patients with DCIS that never developed any local recurrence30. We may also be able to understand how eDCCs found metastasis directly and/or through the preparation of eDCC-mediated pre-metastatic niches for later arriving DCCs to colonize target organs. These findings might inform on better ways to target DCCs in all their forms to prevent metastasis.
METHODS
Cells and cell culture
MCF10A cells were obtained from J. Brugge and ATCC (MCF10A; ATCC CRL-10317) for verification of phenotype. MCF10A cells were authenticated by cultures in 3D matrigel as reported previously10. MCF10A-HER2 cells were transfected with HER2 plasmids obtained from L. Petty and the identity of the vectors was confirmed by sequencing. HER2-expressing cells were selected for by the addition of G418. MCF10A cells expressing SFRP1 were generated using SFRP1 lentiviral vectors. WNT3A- and DKK1-conditioned media was prepared from WNT3A-expressing L-cells and DKK1-expressing 293T cells. Vectors and SFRP1 plasmids were a gift from S. Aaronson. Conditioned media was prepared from cells cultured with serum-free medium (DMEM with 1% penicillin and streptomycin) for 24 h and then concentrated using Vivaspin 20 Centrifugal Concentrating tubes (Sartorius, VS2021) at 3,000g for up to 3 h until the desired concentration (10×) was reached.
Mammospheres and tumourspheres assays
Animal procedures were approved by the Institutional Animal Care and Use Committee (IACUC) of Icahn School of Medicine at Mount Sinai, protocol 08-0366. MMTV–Her2 mice were euthanized using CO2 at 14–18 weeks of age or when overt tumours had formed (primary tumours). For mammosphere preparations, all 5 pairs of glands in mice were checked for the presence of any visible small lesions or palpable tumours when processed for early cancer cells and none were found. Even when other mammary glands were inspected microscopically in whole mounts we could not detect small tumours. Whole mammary glands or tumours were digested in collagenase and bovine serum albumin (BSA) at 37 °C for 45–60 min. Red-blood-cell lysis buffer was used to remove blood cells from cultures and cells were then plated for 10–15 min in DMEM containing 10% fetal bovine serum in 35-mm dishes at 37 °C for fibroblast removal. Cells were then incubated in 2 mM PBS–EDTA for 15 min at 37 °C and passed through a 25-gauge needle. Cell suspensions were then filtered through a 70-μm filter before counting. Cells were seeded in 6-well ultra-low-adhesion plates at a density >5.0×10⁵ cells per well in 1 ml mammosphere media (DMEM/F12 (Gibco 11320-082), 1:50 B27 (Invitrogen 17504-044), 20 ng ml−1 EGF (Peprotech AF-100-15-A), 1:100 penicillin and streptomycin).
Animal experiments
Animal procedures were approved by the Institutional Animal Care and Use Committee (IACUC) of Icahn School of Medicine at Mount Sinai protocol 08-0366. Tumours were not allowed to grow beyond the IACUC allowed limit of 1,000 mm3 per animal. Animals were randomized and assigned to a group when they reached a certain age, so there is no prior knowledge or assumption when assigning the mice to treatments. Approximately 300 spheres from early lesions or primary tumours were injected per site into nude mice (BALB/cnu/nu, Charles River). Suspension cultures were spun at 300 r.p.m. for 4 min and then suspended in 150 μl PBS Ca2+ and Mg2+ per 300 spheres. Matrigel (Corning 356231) was then added in a 1:1 ratio. Spheres were injected into the two fourth inguinal gland fat pad using a 27-gauge needle. In the case of mice injected with tumour-derived spheres, mice were euthanized when the tumour reached 1,000 mm3 according to IAUCU regulations. Incidence measured at 1, 3 and 12 months was calculated. The 12-month time point was not assessed for the tumour-sphere group. Micro-metastases, 3–20 cell clusters. Macro-metastases, clusters with more than 20 cells per cluster.
3D mammary primary epithelial cell and MCF-10A organoid cultures
MMTV–Her2 mice were euthanized using CO2 at 14–18 weeks of age and mammary epithelial cells (MECs) were isolated using the same protocol used for mammosphere preparation. Similar to mammosphere preparations, all 5 pairs of glands in mice were checked for the presence of any visible or palpable tumours when processed for early cancer cells and none were found, even in whole mounts prepared from mammary glands from the same mouse processed for mammoprsphere preparation. 5.0 × 10⁴ MECs were seeded in 400 μl assay medium (DMEM/F12, 5% horse serum, 1% penicillin and streptomycin, and 20 ng ml−1 EGF plus 2% Matrigel) in 8-well chamber slides with 40 μl of Matrigel. Organoids formed at an efficiency of around 30 organoids per 1.0 × 10⁴ MECs plated. MCF10A-HER2 cells were cultured in three-dimensional cultures as previously described32,33. In brief, cells were seeded in 400 μl assay medium consisting of DMEM/F12, 5% horse serum, 1% penicillin and streptomycin, and EGF plus 2% Matrigel on 40 μl Matrigel (Corning) in 8-well chamber slides (Falcon 354108).
Treatments of organoids cultures
Cultures were treated every 24 h starting at day 6 with 5 μM SB203580 (Calbiochem, 559395). 6 × 10³ cells were seeded for immunofluorescence studies and were fixed at day 12 with 4% paraformaldehyde (PFA) or 10% formalin with phosphatase and protease inhibitors (NaVO3, NaF, pepstatin A, leupeptin and aproptinin). To measure mRNA changes in 3D cultures, 5.0 × 10⁴ cells were seeded in 1 ml Matrigel in a 24-well plate and RNA was extracted from cultures at day 12 using 1 ml Trizol (Ambion 15596018) followed by RNA extraction. Cultures were treated every 24 h with 5 μM DMSO or SB203580 and 500 ng ml−1 DKK1 for 48 h following organoids formation and fixed for immunofluorescence with 4% PFA or 10% formalin with phosphatase and protease inhibitors. In some cases spheres growing in suspension conditions were seeded in assay medium plus 2% of Matrigel directly in 40 μl of Matrigel and 3 days later the number of invasive spheres was counted.
Differential interference contrast microscopy
3D matrigel organoids were time-lapse imaged using a Zeiss LSM 880 Confocal with Airyscan microscope 10×/0.45 objective lens with 4× zoom. We recorded four positions per condition in parallel for 2 h with 20 min interval varying with the depth of the cell. Temperature was maintained at 37 °C and CO2 at 5%. Zen 2.1 software was used to acquire and export images as an uncompressed AVI. Videos were made by using either Zen 2.1 or ImageJ software. This was done using the services of the Microscopy Facility at Ichan School of Medicine at Mount Sinai.
Immunofluorescence
3D cultures were fixed with 4% PFA for 20 min at room temperature in the presence of phosphatase and protease inhibitors. Staining was performed as previously described for MCF10A 3D cultures32. In brief, cells were permeabilized using 0.1% Triton X-100 in PBS for 20 min. Blocking was done using 1× immunofluorescence PBS wash buffer (130 mM NaCl; 7 mM Na2HPO4; 3.5 mM NaH2PO4; 7.7 mM NaN3; 0.1 %BSA; 0.2% Triton X-100; 0.05% Tween-20) containing 10% normal goat serum (Gibco, PCN5000) for 1h. Primary antibodies used were: E-cadherin (BD Biosciences 610181); β-catenin (BD Biosciences 610153); laminin V (Progen 10765); F-Actin (Life Technologies A12380); α-smooth muscle actin (Sigma-Aldrich C6198); active β-catenin (Millipore 05-665); CK8/18 (ProGen GP11). The following secondary antibodies were used: AlexaFluor goat-anti-mouse 488, AlexaFluor goat-anti-rabbit 568. Chambers were removed from slides and wells were fixed and mounted with ProLong Gold Antifade reagent with DAPI (Invitrogen P36931). 2D cultures were fixed with 4% PFA for 20 min at 4 °C. Cells were permeabilized in 0.1% TritonX-100 and then blocked in 3% normal goat serum for 30 min at room temperature. Primary antibodies were left 1 h at room temperature in 0.1% BSA in PBS followed by an additional blocking step. Secondary antibodies were left for 1 h at room temperature in 0.1% BSA in PBS. Cover slips were fixed using ProLong Antifade mounting media with DAPI (Molecular Probes P36930). Primary antibodies used were: E-cadherin (BD Biosciences, 610181) and p-ATF2 (Cell Signaling, 9226). Imaging of 3D organoids was done using confocal microscopy. Images were obtained using Leica Software on a Leica SP5 confocal microscope. Mammary gland section imaging was done using a Leica DM550 fluorescence microscope using Leica Software. Dye separation analysis was done using Leica Software. Two-photon imaging was performed following the reported protocols14.
Immunohistochemistry
Tissues were fixed in 10% formalin, paraffin-embedded and cut into 4–6 μm sections. Following dehydration of the slides, antigen retrieval was done in 10 mM citrate buffer pH 6.0 (Na3H6H5O7). Blocking was done using 0.1% BSA in PBS with 10% normal goat serum for 30 min. Primary antibodies were left overnight at 4 °C. The following primary antibodies were used to perform staining: E-cadherin (BD Biosciences, 610181); β-catenin (BD biosciences, 610153); Her2 (Abcam, ab2428). VectaStain Elite ABC Rabbit IgG (PK-6101) and Mouse IgG (PK-6102) kits from Vector Laboratories were used for secondary antibodies. Secondary antibodies were left for 1 h at room temperature. The DAB substrate kit (Vector Laboratories, SK-4100) was used for enzymatic substrate. Mounting was done using Vectashield mounting media (Vector Laboratories, H-1400). Tissues were fixed in 10% formalin, paraffin-embedded and cut in 4–6 μm sections. For BALB-Her2-T staining, paraffin embedded BALB/c and BALB-Her2-T mammary gland and tumours sections were a gift from C. Klein. Following dehydration of the slides, antigen retrieval was done in 10 mM citrate buffer (Na3H6H5O7). Triton X-100 was used to permeabilize cells and blocking was done using 0.1% BSA in PBS with 10% normal goat serum or normal donkey serum (Sigma-Aldrich D9663). Primary antibodies were left overnight at 4 °C and secondary antibodies were left for 1 h at room temperature. The following primary antibodies were used: E-cadherin (BD Biosciences, 610182); for β-catenin (BD biosciences, 610153); Her2 (Abcam, ab2428); p-Atf2 (Cell Signaling, 9226); p-Rb ((Ser249/Thr252), Santa Cruz, sc-16671); CK8/18 (Progen 412121); and p-p38 (BD Biosciences, 612281). The following secondary antibodies were used: AlexaFluor 488 goat-anti-mouse, AlexaFluor 568 goat-anti-rabbit, AlexaFluor 488 donkey-anti-goat, AlexaFluor 547 donkey-anti-rabbit. Slides were mounted using Prolong Antifade mounting media with DAPI (Molecular Probes P36930).
Western blot
Samples were collected in 1× RIPA buffer and centrifuged at 4 °C, 15,000g to clarify the lysate. Protein concentrations were calculated using the BioRad Protein Assay Dye Reagent (BioRad 500-0006) and a standard BSA curve. Samples were then boiled for 5 min at 95 °C in sample buffer (0.04 M Tris-HCl pH 6.8, 1% SDS, 1% β-mercaptoethanol and 10% glycerol). 6–10% SDS–PAGE gradient gels were run in running buffer (25 mM Tris, 190 mM glycine, 0.1% SDS) and transferred to PVDF membranes in transfer buffer (25 mM Tris, 190 mM glycine, 20% methanol). Membranes were then blocked in 5% milk in TBST (Tris-buffered saline containing Tween-20) buffer. Primary antibodies were left overnight at 4 °C. Following washing with TBST buffer HRP-conjugated secondary antibodies were left at room temperature for 1 h. Western blot development was done using Amersham ECL Western Blot Detection (GE, RPN 2106) and GE ImageQuant LAS 4010. Primary antibodies used were: p-p38 (BD Biosciences, 612281); p38 (BD Biosciences, 612169); p-ERK1/2 (Cell Signaling, 9101); ERK (BD Biosciences, 610031); and Gapdh (Calbiochem, CB1001). Secondary antibodies used were peroxidase horse-anti-mouse IgG (Vector Laboratories, PI2000); biotinylated goat-anti-rabbit IgG (Vector Laboratories, BA-1000).
EMT qPCR array
RNA was extracted from 3D cultures using TriZol extraction as per the manufacturer’s recommendations. cDNA was synthesized using the Qiagen RT2 First Strand Kit (Qiagen 330401). Expression of EMT genes was measured using the Qiagen human Epithelial to Mesenchymal Transition PCR array(Qiagen PAHS-090Z) and RT2 qPCR Master Mixes (Qiagen 330521). Plates were run in an ABI PRISM 7900HT sequence detection system. Results were analysed using web-based PCR-array data-analysis software provided by Qiagen. Heat maps were generated based on triplicate runs of the array using GENE-E software (Brode Institute).
Quantitative PCR
RNA was extracted from 2D- and 3D-cell cultures using TriZol following the provider’s recommendation. For pre-malignant mammary gland tissue, RNA was extracted using Qiagen’s RNeasy Lipid Tissue Midi Kit (Qiagen 74804). 2 μg RNA was reverse transcribed into cDNA using MMuLV Reverse Transcriptase (New England Biolabs, M0253L), MMuLV buffer (NEB, B0253S) and RNase inhibitor (Ambion, AM2682). Quantitative real time-PCR (qRT–PCR) was performed using a Sybr Green Powder PCR Master Mix (Bio-Rad, 170-8882) or by preparing a master mix using Sybr Green (Sigma-Aldrich, S9430), MgCl2 (NEB, B9021S), dNTPs (NEB N0447L) and Taq DNA polymerase (Sigma-Aldrich D6558) in a Biorad thermocycler. Gapdh was used as a housekeeping control for all plates.
qPCR primers
Human primers; GAPDH forward: 5′-GGTGAAGGTCGG AGTCAACGG-3′, GAPDH reverse: 5′-ATGAAGGGGTCATTGATGG CAACAA-3′; CDH1 forward: 5′-ATGGGGTCTTGCTATGTTGC-3′, CDH1 reverse: 5′-AAGGCAGAAGGATTGCTTGA-3′; TWIST1 forward: 5′-GTCC GCAGTCTTACGAGGAG-3′, TWIST1 reverse: 5′-CCAGCTTGAGGGTCT GAATC-3′; SNAI1 forward: 5′-AGAGCTGACCTCCCTGTCA-3′, SNAI1 reverse: 5′-TGAAGTAGAGGAGAAGGACGAA-3′; WNT11 forward: 5′-CATGGAGCTCTGCTTGTGAA-3′, WNT11 reverse: 5′-GCTTCCAAGTGAA GGCAAAG-3′; WNT5A forward: 5′-GAAATGCGTGTTGGGTTGA-3′, WNT5A reverse: 5′-AGGCATGGGTTTCCATTCT-3′; WNT5B forward: 5′-CCAAAGGA TCAGAGGAGCAG-3′, WNT5B reverse: 5′-CTCGTTGTTTTGCAGGTTCA-3′; ERBB3 forward: 5′-GGCGGCACTTTTCTCTACTG-3′, ERBB3 reverse: 5′-CGTTCCAAGTATCGCCTCAT-3′; FZD7 forward: 5′-TGGGTTAATTTC CAFFTCA-3′, FZD7 reverse: 5′-GCAGTACGGGAGGAAAAACA-3′; AXIN2 forward: 5′-CTGGTGCAAAGACATAGCCA-3′, AXIN2 reverse: 5′-GTCCAGCAAAACTCTGAGGG-3′. Mouse primers; Gapdh forward: 5′-AACTTTGGCATTGTGGAAGGGCTC-3′, Gapdh reverse: 5′-TGGAAGA GTGGGAGTTGCTGTTGA-3′; Twist1 forward: 5′-AACTGGCCT GCAAAATCATA-3′, Twist1 reverse: 5′-ACACCGGATCTATTTGCATT-3′.
Two-photon intra-vital microscopy of mammary glands
For this work a single laser source tuned to 880 nm provided excitation for both the CFP tumour cells and the 155 kDa TRITC-dextran vascular label, in addition to producing a second harmonic generation signal from collagen fibres. Imaging was done with a 25× 1.05 NA (XLPL25XWMP2, Olympus) water-immersion objective lens so as to bridge between low-magnification visualization of the ductal tree and high resolution single-cell imaging. For each mouse, a large 25–100 field mosaic was acquired to ascertain the ductal tree structure, from which three separate fields were selected for time lapse imaging, using 5 μm z steps to a depth of approximately 50 μm, with each stack taken approximately every 2 min, for 4–6 h. Images were reconstructed and analysed either in ImageJ34, using the custom written ImageJ plugin, ROI_Tracker14 or with Imaris (Bitplane). Mice were anaesthetized using 0.75–2.5% isofluorane, depilated and a skin flap surgery performed exposing the 2nd and 3rd mammary fat pad. The absence of a solid tumour necessitated the development of a custom fixturing technique wherein the exposed fat pad was affixed with cyanoacrylate glue to the edge of a 15-mm window fitted with a 12-mm diameter cover glass. The window was captured on a fixturing plate placed on the microscope xy stage and imaging was performed in the centre of the window away from the glue. Animals were maintained at physiological temperatures throughout imaging with an AirTherm ATX forced-air heater (WPI Inc.) and supplemented intravenously with 50–100 μl of PBS per hour. Intravital imaging was performed using a custom-built two-laser multiphoton microscope following previously reported imaging protocols17. All procedures were conducted in accordance with the National Institutes of Health regulations and approved by the Albert Einstein College of Medicine animal use committee. For computational rendering of the videos in Supplementary Video 5 and 8, the signals within the segmented vessel and the manually outlined cell were separately extracted into a sequence of tiff images and then imported into Imaris. A colocalization algorithm was performed on the two signals to identify overlapping pixels. Intensity based surface reconstructions of the vessel (red), tumour cells (cyan) and the colocalization signal (yellow) were created and then animated. Any residual xy drift not eliminated by the fixturing window was removed with post-processing using the StackReg plugin35 for ImageJ.
Experimental metastasis assays
Mammary epithelial cells derived from early lesions (16-week-old MMTV–Her2 females) or tumour-derived cells were intravenously injected (10,000 cells per animal) into nude mice. One month later, mice were euthanized and the number of metastatic foci were counted by histology.
Sphere-forming assays
Mammary epithelial cells from early lesions or from tumours were isolated and seeded in low attachment 24-well plates in 1 ml sphere medium plus 1% methylcellulose (1,000 cells per well, n = 2 animals per group, sextuple). The number of spheres (clusters of more than 5 cells) per group was counted one week later. These spheres were then dissociated with trypsin and re-plated and the number of spheres per group was counted one week later.
Patient samples
Paraffin-embedded sections from tumours of patients with DCIS or invasive breast cancer were obtained from the Cancer Biorepository at Icahn School of Medicine at Mount Sinai, New York, New York. Samples were de-identified and obtained with Institutional Review Board approval, which indicated that this work does not meet the definition of human subject research according to the 45 CFR 46 and the Office of Human Subject Research. Immunofluorescence and immunohistochemistry analysis was done using samples from 10 DCIS and 20 invasive breast-cancer patients. Invasive breast cancer samples included luminal A, B and HER2-positive subtypes.
Circulating Cancer Cells and DCCs detection
16-week-old MMTV–Her2 mice were treated with SB203580 (10 mg kg−1) or DMSO for 2 weeks and blood (approximately 500 μl per mouse) was drawn by cardiac puncture following IACUC protocols. Circulating cancer cells (CCCs) were purified using a negative lineage cell-depletion kit (130-090-858, Miltenyi Biotec), fixed and stained with anti-CK8/18 antibody in cytospin preparations. CCCs were counted per ml of blood. Bone-marrow cells from 4 long bones (2 tibiae and 2 femurs per mouse) were flushed out with Minimum Essential Medium Eagle (MEME) (Sigma-Aldrich) using a 26-gauge needle and 1 ml syringe. Tumour cells were enriched by Ficoll-Paque plus (GE Healthcare) density gradient separation and filtered through a 70-μm nylon mesh to remove large aggregates. Cells were fixed with 3% PFA for 20 min on ice and cytospin preparations were carried out by centrifugation of bone-marrow cells at 500 r.p.m. for 3 min using poly-L-lysine-coated slides (Sigma-Aldrich). Bone-marrow-derived DCCs were stained with anti-CK8/18 and anti-Her2 antibodies and cytospin preparations were analysed. We screened 0.5–2.0 ×10⁶ bone-marrow cells, which represents 20% of the total bone-marrow cells obtained from 2 tibiae and 2 femurs per mouse after Ficoll gradient separation and then normalized to the total volume in which each bone-marrow DCC sample was resuspended (approximately 1 ml). Similar to mammosphere preparations, all 5 pairs of glands in mice were checked for the presence of any visible or palpable tumours when processed for early cancer cells and none were found as described above.
Statistical analysis
Statistical analysis was done using Prism Software. Differences were considered significant if P < 0.05. For most cell culture experiments, one-tailed Student’s t-tests were performed unless specified. For mouse experiments one-tailed Mann–Whitney U-tests were used. Sample sizes were chosen empirically and no exclusion criteria were applied. The investigators were not blinded to allocation during experiments and outcome assessment.
Data availability
The datasets generated during and/or analysed during the current study are available within the paper (and its Supplementary Information) and/or from the corresponding author on reasonable request.
Extended Data
Extended Data Figure 1. Progression and staging of MMTV–Her2 mouse models.

a, Cartoons depicting the three MMTV–Her2 models used in this study and the different time frames for early lesions (EL) and overt primary tumour (PT) development. HP, hyperplasia; MIN, mammary intraepithelial neoplasia. b, Haematoxylin and eosin staining for sections of normal FVB mouse mammary tissue, and FVB MMTV–Her2 early lesions or primary tumours. c, Whole mounts from mammary glands of FVB MMTV–Her2 mice at the time early lesions were studied. LN, lymph node. d, Representative images of E-cadhip-ATF2hi (left and inset) and E-cadlop-ATF2lo (right) ducts in the MMTV–Her2-T model. Scale bar, 10 μm. Arrow in left image, intact E-cadherin junction; arrow in right image, dismantled E-cadherin junction. e, Quantification of the percentage of E-cadhi cells per duct that showed high or low p-ATF2 expression in MMTV–Her2 and MMTV–Her2-T models. *P <0.01; one-sided, unpaired t-test; mean ±s.e.m. (Her2, n = 30 ducts; Her2-T, n =10 ducts).
Extended Data Figure 2. p38 signalling in MMTV–Her2 models and DCIS patient samples.

a, Early stage MMTV–Her2-T (BALB-NeuT 15 weeks of age ) early lesion sections stained for Her2 and β-catenin. Arrows, Her2+β-catMEM-lo early lesion cells; arrowheads, Her2−β-catMEM-hi cells. Scale bars, 10 μm. The digital dye separation module (Leica) was used on the images. Graph, quantification of the percentage of cells per duct with β-catMEM for both MMTV–Her2 and MMTV–Her2-T models. (n =7 ducts). b, Immunohistochemistry for p-ATF2 and E-cadherin in MMTV–Her2 early lesion tissues (age, 14–18 weeks) and primary tumour sections. Boxed regions are magnified in the bottom right panel. Note the loss of both p-ATF2 and E-cadherin in primary tumour samples. Scale bar, 25 μm. c, Western blot for the indicated antigens in lysates of mammary epithelial cells isolated from normal mammary glands (FVB) and tumour cells isolated from MMTV–Her2 overt primary tumours (Her2). GAPDH was used as a loading control. For gel source data, see Supplementary Fig. 1. d, Immunohistochemistry for p-p38 in normal epithelium (BALB/c), early lesion tissues (BALB-NeuT early lesions, 7 weeks) and overt primary tumours (BALB-NeuT primary tumours). Graph, percentage of p-p38 positive cells in each stage. n = 11–15 ducts, 5 tumours. Scale bars, 20 μm (inset) and 50 μm; **P <0.01; ***P < 0.0001; one-tailed Mann–Whitney U-test. e, Representative images of parallel sections from DCIS patient samples stained for p-ATF2 (red), Her2 (green in insets lower row), or E-cadherin (green in large panels and insets upper row). Samples were Her2-positive (n = 5) or -negative (n = 5) by immunofluorescence microscopy analysis for Her2 (insets top and bottom row left, green). Inset right column, detail of E-cadherin junctions in Her2+ and Her2− samples. Arrowhead, strong E-cadherin junctions; arrow, weak E-cadherin staining. Scale bars, 25 μm and 10 μm (inset). f, Metamorph software was used to quantify Her2, E-cadherin and p-ATF2 fluorescence signal intensity in 10 DCIS samples shown in panel e. Mean fluorescence intensity (m.f.i.) ± s.e.m. per cell per field from Her2+ (black bars, n = 5) compared to Her2− (grey bars, n = 5) samples from patients with DCIS. ***P < 0.05; two-way ANOVA. g, Immunohistochemistry for p-p38α and p-ATF2 performed on invasive breast cancer (IBC) tumours from patients (n = 20). Samples were classified as Her2+ (n = 10) or Her2− (n = 10) by the pathology service. Note the significant reduction in both p-p38α and p-ATF2 in Her2+ tumours. Insets show additional patient samples for each group. Graph, metamorph was used to determine the mean signal intensity ±s.e.m. per field for p-p38 and p-ATF2. p-p38 intensity, left axis and first two columns of the graph. p-ATF2 intensity, right axis and last two columns of the graph. **P <0.05; unpaired t-test. Scale bars, 25 μm.
Extended Data Figure 3. Characterization of invasive and signalling properties of Her2+ early lesions.

a, MCF10A-HER2 organoids stained for E-cadherin (green) and DAPI (blue). Left, a representative organoid. Scale bar, 25 μm. Right, details of invading E-cadlo cells (top and bottom). Arrowheads, outward invading E-cadlo cells. Scale bar, 10 μm. Approximately 35–40% of MCF10A-HER2 organoids show outward invasion of one cell per organoid in equatorial sections; 92 ± 8.3% of those invading cells are E-cadlo. b, MCF10A-HER2 organoids were stained for F-actin (red) and DAPI (blue). Note the extensions of F-actin from invading cells (boxed areas and right top and bottom insets) still in contact with the organoid. Scale bars, 20 μm. c, Detection of E-cadherin and p-ATF2 in MCF10A-HER2 cells treated with or without lapatinib (100 nM), AG1478 (5 μM) and siRNA targeting HER2 (40 nM) for 24 h; E-cadherin (green), pATF2 (red). Graph, fold change of the percentage of p-ATF2+ cells. Data are mean ±s.e.m.; **P <0.01; ***P < 0.001; one-sided, unpaired t-test; n =3 experimental replicates, 10 images per treatment. d, MCF10A-Her2 cells were treated for 24 h with AG1478 (1 μM) left, or with the AKT inhibitor MK2266 (5 μM), pan-PI3K inhibitor GDC-0941 (1 μM) or lapatinib (1 μM), right. Western blots for p-AKT and total AKT (T-AKT) (left) or p-S6 and β-tubulin (right). Gel source data in Supplementary Fig. 1. Graph, control for Her2 knockdown in MCF10A-HER2 cells; one-sided, unpaired t-test; median and range are shown. e, MMTV–Her2 early lesion organoids were treated with GDC-0941 (1 μM), lapatinib (1 μM) or MK2266 (5 μM) for 24 h. Organoids were fixed and stained for p-ATF2. Graph, percentage of p-ATF2+ cells per organoid. Scale bars, 25 μm. Median ± s.e.m.; one-sided, unpaired t-test. f, Left, quantification of the percentage of nuclear p-ATF2+ MCF10A-HER2 cells treated for 24 h with vehicle (CRTL), 5 μM SB203580 (SB), 100 nM lapatinib (LAP) or the combination of the two drugs. Right, representative immunofluorescence images of the p-ATF2 signal (red); DAPI (blue) was used to count total cell numbers. Insets and arrows show a detail of nuclear p-ATF2 levels in the respective groups. One-sided Mann–Whitney U-test at 95% confidence; median and range are shown, n = 2 independent wells per condition; n > 150 cells scored per condition. Scale bars, 25 μm. g, MCF10A-HER2 organoids treated for 6 days with SB203580 or DMSO and stained for F-actin (red). Bottom left graph, percentage ± s.e.m. of MCF10A-HER2 organoids with outward invasion (DMSO n =109; SB203580 n =87) ***P < 0.001; one-sided, unpaired t-test. Scale bars, 10 μm. Bottom right graph, percentage of invasive MMTV–Her2 organoids (DMSO n =11; SB203580 n =9). P = 0.01; one-sided, unpaired t-test; mean ±s.d. Representative of 3 biological replicates. h, MMTV–Her2 early lesion sections (age, 14–18 weeks) stained for CK8/18 (red), Her2 (green) and nuclei (DAPI, blue). Top image, a duct is outlined. The boxed region and bottom images showCK8/18+ and Her2+ singlets or doublets within the stroma near ducts. Graph, percentage of stroma-invading cells that were either double positive for both CK8/18 and Her2 or single CK8/18+. Mean ±s.e.m.; **P < 0.01; one-sided Mann–Whitney U-test; n =4 mice, 60–80 cells per mouse. Scale bars, 10 μm.
Extended Data Figure 4. Quantification of early dissemination by Her2+ early cancer cells.

a, MMTV–Her2–NDL5–CFP early lesion mammary gland tissues (seven-week-old females) co-stained for CFP (green) and Her2 (red). Arrows, co-distribution of Her2 and CFP. Graph, percentage of positive cells for the single Her2 staining (white bars) or double co-staining for Her2 and CFP (black bars) per field. Approximately 88% of early lesion cells are positive for Her2 and CFP. Scale bars, 10 μm. b, Early circulating cancer cells (eCCCs) were detected in cytospin preparations by staining for CK8/18 (green) and nuclei with DAPI (blue) after a Ficoll gradient and negative selection (see Methods). Scale bar, 10 μm. c, Detection of eDCCs in lung sections from MMTV–Her2 mice by immunohistochemistry for Her2 (rabbit anti-Her2 antibody (Abcam, ab2428)). Scale bar, 25 μm. Right, augmented images from additional sections. Red arrowheads, Her2-positive DTCs; red asterix, host Her2-negative cells. Scale bars, 10 μm. Staining controls are shown in e. d, eDCCs in the bone marrow of MMTV–Her2 mice detected in cytospin preparations of whole bone-marrow samples after a Ficoll gradient and staining for CK8/18 (green), Her2 (red) and DAPI (blue). CK8/18+, Her2+ or double-positive cells were considered eDCCs. Right, individual channel signals. Left, merged channels on the right detecting a bone-marrow CK8/18+Her2+ DCC (arrow) next to a CK8/18−Her2− bone-marrow cell (asterix). Scale bars, 10 μm. e, Top, Immunohistochemistry for Her2 in non-transgenic FVB lung sections. Her2+ cells were undetectable in FVB lung sections. Bottom, IgG isotype for the Her2 antibody used in c in lungs of MMTV–Her2 mice. Scale bars, 50 μm. f, g, Top, IgG control images for eDCC detection in MMTV–Her2 lung sections. Bottom, example of Her2+ (red) staining using the Calbiochem (OP15L) (f) and Abcam (ab2428) (g) anti-Her2 antibodies. M, mouse; R, rabbit. Scale bars, 10 μm. h, eCCCs detected by CK8/18+ as in b in blood of MMTV–Her2 mice (age, 14–18 w) treated for 2 weeks with DMSO (C) or the p38α/β inhibitor SB203580 (DMSO n =4; SB n =5 mice). i, eDCCs detected by CK8/18+ as in d in bone marrow of MMTV–Her2 mice treated as in h (n = 5 mice per group). j, eDCCs detected in the lung of MMTV–Her2 mice carrying only early lesions as in c and treated as in h. Graph, percentage of Her2+ eDCCs per field in each group (n = 30 fields, 3 mice per treatment). For h–j, median and individual fields (j) or mice (h, i); *P <0.05; ***P <0.001; one-sided Mann–Whitney U-test.
Extended Data Figure 5. EMT markers in Her2+ early lesion cells.

a, MCF10A-HER2 organoids treated for 6 days with SB203580 or control (DMSO) were stained for E-cadherin (green) and β-catenin (red) or DAPI (blue); MCF10A-HER2, n = 20 organoids per treatment. Scale bars, 10 μm (top), 20 μm (bottom). b, MCF10A-HER2 organoids treated with siRNAs targeting p38a or a non-targeting control (siCTL); n = 20 organoids per treatment. Scale bars, 10 μm (top), 20 μm (bottom). c, Quantification of a and b. *P < 0.048; NS, not significant; one-sided, unpaired t-test. d, Graph, percentage ±s.e.m. β-cateninMEM in MCF10A-HER2 with/without SB203580 and with/without p38a siRNA. *P =0.0047; one-sided, unpaired t-test. e, MMTV–Her2 organoids treated with p38a or control siRNA (48 h) and stained to detect active β-catenin (see Methods). Graph, percentage ± s.e.m. of organoids stained for active β-catenin (n = 10 organoids per treatment). Scale bars, 25 μm. P =0.0059; one-sided, unpaired t-test. f, AXIN2 mRNA expression in MCF10A-HER2 cultures treated for 24 h with DMSO control (C) or SB203580 (5 μM). Technical triplicate determinations were normalized to GAPDH and fold change (FC) over control was determined for five biological replicates. P <0.05; one-sided, unpaired t-test, mean ±s.e.m. g, mRNA levels for SNAI1 and TWIST1 normalized to GAPDH in MCF10A-HER2 3D cultures treated with siRNA targeting the p38α isoform or ATF2 from day 6–12. Graph, fold change over control in three biological replicates. **P <0.01; ***P < 0.0001; one-sided, unpaired t-test; mean ±s.e.m. h, Sections of MMTV–Her2 early lesions in mice treated for 2 weeks with SB203580 (see Methods) stained for E-cadherin (top) and β-catenin (bottom). Scale bars, 15 μm. Arrows, membrane E-cadherin, or β-catenin (bottom left) or nuclear β-catenin (bottom right). Boxed area is shown in Fig. 3c. i, Isotype-matched mouse IgG control immunohistochemistry for β-catenin and E-cadherin in mammary intraepithelial neoplasia and a primary tumour. Scale bars, 25 μm. j, E-cadherin immunohistochemistry in C57BL/6 (WT) and Mkk3−/− Mkk6+/− mice10 or FVB mice treated with SB203580 (see Methods). k, Quantification of j. Mean ±s.e.m.; *P < 0.01; one-sided, unpaired t-test. l, MCF10A organoids were treated for 6 days with control (DMSO) or SB203580 (5 μM), and fixed and stained for E-cadherin (green). Graph, percentage of E-cadhi organoids in two experiments; 15 organoids per treatment per trial. Scale bars, 10 μm. Mean ±s.e.m.; *P < 0.01; one-sided, unpaired t-test. m, Top, immunofluorescence for β-catenin (red) on mammary gland sections of DMSO- or SB203580-treated FVB mice(see Methods). Scale bars, 25 μm. Bottom, immunofluorescence for α-smooth muscle actin (SMA, red), CK8/18 (green) and DAPI (blue) on the same tissues. Scale bars, 20 μm.
Extended Data Figure 6. Wnt signalling in Her2+ organoids and eDCC characterization.

a, qPCR confirmation of EMT genes identified in Fig. 3g comparing MCF10A and MCF10A-HER2 organoids. Mean ±s.e.m. shown as fold change over control. Values normalized to GAPDH from triplicate samples. *P < 0.05; one-sided, unpaired t-test. b, qPCR confirmation of genes identified in Fig. 3g in MCF10A-HER2 organoids treated with DMSO or SB203580. Mean ± s.e.m. shown as fold change over control. Values normalized to GAPDH from triplicate samples. *P <0.05; one-sided, unpaired t-test. c, qPCR for CDH1 mRNA in MCF10A-HER2 organoids treated for 6 days with SB203580 (5 μM) or p38a siRNA (20 nM). Fold change over control for biological triplicates. DMSO, control for SB203580 and scrambled siRNA, control for p38a siRNA. Mean ±s.e.m.; *P < 0.05; one-sided, unpaired t-test. d, Western blot for haemagglutinin (HA)-tagged SFRP1 constructs in MCF10A-HER2-SFRP1 cell lines. Gel source data, see Supplementary Fig. 1. e, Axin2 mRNA levels in MCF10A-HER2 and MCF10A-HER2-SFRP1 cells treated with or without SB203580 (5 μM) for 24 h. Fold change over control; error bars denote s.e.m. for biological sextuplicates. *P <0.05; one-sided, unpaired t-test. f, Axin2 mRNA levels measured in MCF10A cultures transfected with pcDNA3 (empty vector) or CA-p38α (D176A and F372S mutant) plasmids and then treated with or without WNT3A for 24 h. Fold change over control is shown; error bars denote s.e.m. for biological triplicates. *P < 0.02; one-sided, unpaired t-test. g, Percentage of outward-invading cells from MCF10A-HER2 and MCF10A-HER2-SFRP1 organoids treated for 6 days with DMSO or SB203580 (5 μM). n =20 organoids per treatment, biological duplicates; data are shown as mean ±s.e.m.; *P < 0.05; one-sided, unpaired t-test. h, Left, E-cadherin (green) in MCF10A-HER2 and MCF10A-HER2-SFRP1 organoids treated for 6 days with SB203580 (5 μM). Right, β-catenin (red) in organoids treated as on the left. Insets (h1–h4) show magnified boxed regions. Graph, percentage of E-cadhi (green bars, left axis) and β-cateninMEM (red bars, right axis) organoids. Error bars denote s.e.m.; NS, not significant; *P <0.003; **P < 0.02; one-sided, unpaired t-test; n =20 organoids per treatment, biological duplicates. Scale bars, 10 μm. i, Quantification of early-lesion or primary-tumour cancer cells with the indicated profiles; 4 animals per group. **P < 0.01; one-sided Mann–Whitney U-test; mean ± s.e.m. Bottom, immunofluorescence for Twist1hi (T+) protein in HER2+ (H+) cancer cells in early lesions (n =883 cells) or primary tumours (n ≥3,000 cells). j, Immunofluorescence for p-H3 (green) and Her2 (red) in eDCCs from MMTV–Her2 lung sections. Scale bars, 10 μm. k, Immunofluorescence for Her2 (red) and p-Rb (green) in spontaneous primary MMTV–Her2 tumours. Scale bar, 10 μm. l, Representative image of Her2+Twist1+ lung DCCs from 33-week-old MMTV–Neu mice. n = 500 cells, 4 animals per group. Quantification shown in Fig. 4f. Scale bar, 10 μm. m, Percentage of Her2+ and p-Rb+ cells per field of view (FOV) in MMTV–Her2 mice treated as in Fig. 3c. Lungs sections from 3 animals. *P <0.02; ***P < 0.0001; one-sided, unpaired t-test; error bars represent ±s.e.m.
Extended Data Figure 7. Metastasis-initiating potential of HER2+ early lesion cells.

a, Experimental approach for testing tumorigenic and metastatic potential. Early lesions cells from mouse mammary glands (age, 12–18 weeks) and primary tumour cells were seeded in mammosphere medium (see representative images). Approximately 300 mammospheres were injected into the fat pad of nude mice. Primary tumour formation and metastasis was monitored for 1, 3 and 12 months (mammospheres group) or for 3 months (tumourspheres group). Primary tumour and metastasis incidence are shown in Fig. 4g. b, Sphere-forming efficiency for early lesion cancer cells (age, 16 weeks) and primary tumour cancer cells. After one week (1) in culture, spheres were disaggregated and replated to test self-renewal capacity for another week (2). n =6 replicates; one-sided, unpaired t-test; data are mean ±s.d. Representative of 3 biological replicates. c, Left, haematoxylin and eosin staining of lung macro-metastasis in nude mice injected with MMTV–Her2 early lesion mammospheres. Scale bar, 200 μm. Right, immunohistochemistry for Her2+ DCCs in mice injected with tumourspheres. Scale bar, 10 μm. Arrows, Her2+ DCCs; asterisks, Her2− cells. d, Left, immunofluorescence detection of p-ERK1/2 and p-S6 in organoids produced by MMTV–Her2 early lesion or primary tumour cells. Right, percentage of p-S6 or p-ERK+ organoids per well. n = triplicates; one-sided, unpaired t-test; mean ±s.e.m. e, Mammosphere from early lesion cells or tumourspheres from primary tumour cells were directly embedded in 3D Matrigel to monitor organoid behaviour for 3 days. Top, percentage of invasive organoids in each group. EL, early lesion; PT, primary tumour. Bottom, representative images used to quantify the invasive nature of early lesion mammospheres (left) compared to primary tumour tumourspheres (right). P < 0.0021; one-sided, unpaired t-test; mean ±s.e.m. f, Early lesion and primary tumour single-cell suspensions were injected intravenously (tail vein) in nude mice (50,000 cells per animal). Lungs were collected (after 4 weeks) and processed for haematoxylin and eosin, and immunofluorescence for Her2 detection (right). Graph, number of metastatic nodules per section per animal lung (n = 3 mice in each group). NS, not significant; Mann–Whitney U-test; median and range are shown.
Extended Data Figure 8. Final tumour volume of early lesions or primary spheres after orthotopic injection into nude mouse mammary fat pads.
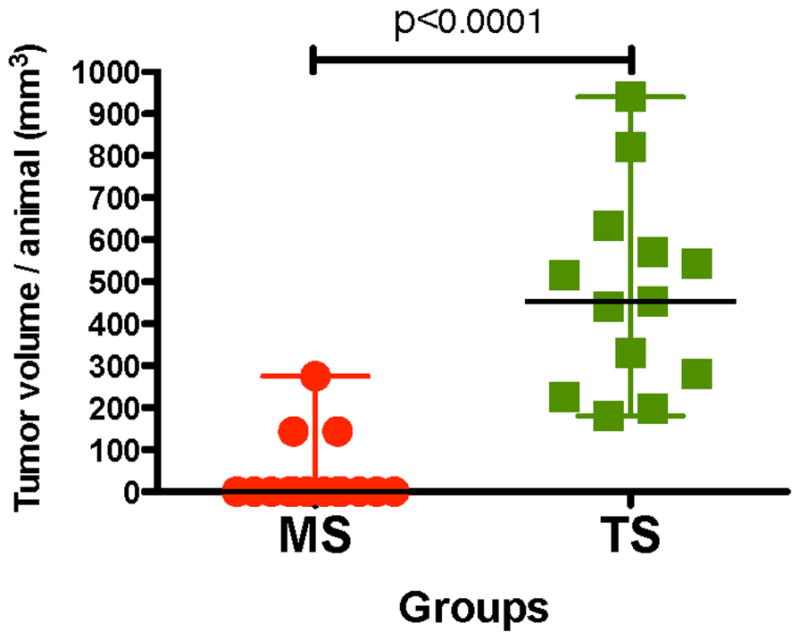
Animals were randomized and approximately 300 spheres from early lesions or primary tumours were injected per site into nude mice (BALB/cnu/nu, Charles River) with Matrigel (Corning 356231) at a 1:1 ratio. Spheres were injected into the both fourth inguinal gland fat pads using a 27-gauge needle. In the case of mice injected with tumour-derived spheres, mice were euthanized when tumours reached 1,000 mm3, according to IAUCU regulations. Tumour volumes were measured at 3 months. Mammospheres, n = 15 animals, tumourspheres, n = 13 animals. One-sided Mann–Whitney U-test with 95% confidence intervals.
Extended Data Figure 9. Cartoon depicting the mechanism of early dissemination by Her2+ early lesion cells.

a, Early Her2+ early lesion cancer cells (red) turn on Wnt, PI3K and AKT signalling, inhibit p38 activation and E-cadherin-junction formation allowing for a Twist1hi EMT-like invasive program; p38 and E-cadherin inhibit the Wnt- and β-catenin-driven EMT-like program and invasion (grey inhibitory symbols). b, Her2+p-p38loTwist1hiE-cadlo early lesion cancer cells, which retain CK8/18 expression can intravasate and disseminate. c, In lungs more than 85% of eDCCs (red) were Her2+E-cadlo(p-Rb or p-H3)lo, suggesting a large population of dormant cells. Most eDCCs are also Twist1hiE-cadlo. Nevertheless, eDCCs can initiate metastasis, which correlated with the acquisition of a Twist1loE-cadmed–hi phenotype. In the bone marrow, eDCCs were Her2+CK8/18+ and remain dormant for the duration of the experiments, as bone lesions were never observed.
Extended Data Table 1.
Quantification of eCCCs and eDCCs in MMTV–Her2 mice
| Disseminating population | Incidence | MMTV-Her2 Median (Min-Max) |
|---|---|---|
| eCCC | 100% | 20 (20–120) CCCs/ml |
| eDCC BM | 100% | 86.54 (28–350)/BM (4 hind limb long bones) |
| eDCC lung | 100% | 8.1 (3.5–17.4) %DCCs/field |
eCCCs, as well as lung and bone-marrow eDCCs, could be detected in 100% of mice (column two) (n = 4) (for images, see Extended Data Fig. 4h–j). The median number of CK8/18+ eCCC per ml of blood from cytospin preparations of whole blood samples is shown with range (n = 4). Bone-marrow eDCCs were detected as CK8/18+, Her2+ and co-stained for both markers in cytospin preparations from 4 hindlimb long bones (2 tibias, 2 femurs) and the number of eDCCs along with minimum and maximum values in the whole bone marrow is shown (n = 5). The median percentage of lung eDCCs per field detected by immunohistochemistry of lungs is shown with minimum and maximum number of DCCs (n =30 fields, n = 3 animals). The median number of eDCCs in the bone-marrow compartment is equivalent to approximately 20.2 eDCCs per 106 bone-marrow host cells in control groups and approximately 46 eDCCs per 106 bone-marrow host cells in SB203580-treated animals.
Acknowledgments
We thank R. Parsons and P. Polulikakos for PI3K and AKT inhibitors, S. Aaronson and H.-C. Wen for WNT3A, SFRP1 and DKK1 reagents and expertise. Grant support:. HHMI (R.J.D.). SWCRF (J.A.A.-G. and E.F.F.), CA109182, CA196521 (J.A.A.-G.), CA163131 (J.A.A-G and J.C.), CA100324 (J.C), F31CA183185 (K.H.), BC132674 (J.A.A.-G and J.C.), BC112380 (M.S.S.). NIH 1S10RR024745. Microscopy CoRE at ISMMS. DFG KL 1233/10-1 and the ERC (322602) (C.A.K.).
Footnotes
Online Content Methods, along with any additional Extended Data display items and Source Data, are available in the online version of the paper; references unique to these sections appear only in the online paper.
Supplementary Information is available in the online version of the paper.
Author Contributions K.L.H. designed, performed experiments, analysed data and co-wrote the manuscript; M.S.S. designed experimental approach, performed experiments, executed intravital imaging, provided oversight, analysed data and co-wrote the manuscript; D.E. designed and executed intravital imaging, analysed data and co-wrote the manuscript; H.H. provided materials and analysed data; A.A.V. performed experiments; C.N. provided materials and histopathological analysis; J.F.C. managed mouse colonies and performed experiments; R.N. performed experiments and analysed data; N.G. maintained the Mkk3/Mkk6 wild-type and knockout mice and provided materials; R.J.D. provided materials and co-wrote manuscript; C.A.K. provided input for the writing of the manuscript; J.C. designed intra-vital experiments, analysed data and co-wrote the manuscript; E.F.F. provided expertise and analysed data; J.A.A.-G. designed and optimized experimental approach, provided general oversight, collected microscopy data, analysed data and co-wrote the manuscript.
The authors declare competing financial interests: details are available in the online version of the paper. Readers are welcome to comment on the online version of the paper.
Reviewer Information Nature thanks M. Bissell, C. Ghajar and the other anonymous reviewer(s) for their contribution to the peer review of this work.
References
- 1.Sosa MS, Bragado P, Aguirre-Ghiso JA. Mechanisms of disseminated cancer cell dormancy: an awakening field. Nat Rev Cancer. 2014;14:611–622. doi: 10.1038/nrc3793. [DOI] [PMC free article] [PubMed] [Google Scholar]
- 2.Hanahan D, Weinberg RA. Hallmarks of cancer: the next generation. Cell. 2011;144:646–674. doi: 10.1016/j.cell.2011.02.013. [DOI] [PubMed] [Google Scholar]
- 3.Schardt JA, et al. Genomic analysis of single cytokeratin-positive cells from bone marrow reveals early mutational events in breast cancer. Cancer Cell. 2005;8:227–239. doi: 10.1016/j.ccr.2005.08.003. [DOI] [PubMed] [Google Scholar]
- 4.Klein CA, et al. Comparative genomic hybridization, loss of heterozygosity, and DNA sequence analysis of single cells. Proc Natl Acad Sci USA. 1999;96:4494–4499. doi: 10.1073/pnas.96.8.4494. [DOI] [PMC free article] [PubMed] [Google Scholar]
- 5.Schmidt-Kittler O, et al. From latent disseminated cells to overt metastasis: genetic analysis of systemic breast cancer progression. Proc Natl Acad Sci USA. 2003;100:7737–7742. doi: 10.1073/pnas.1331931100. [DOI] [PMC free article] [PubMed] [Google Scholar]
- 6.Rhim AD, et al. EMT and dissemination precede pancreatic tumor formation. Cell. 2012;148:349–361. doi: 10.1016/j.cell.2011.11.025. [DOI] [PMC free article] [PubMed] [Google Scholar]
- 7.Eyles J, et al. Tumor cells disseminate early, but immunosurveillance limits metastatic outgrowth, in a mouse model of melanoma. J Clin Invest. 2010;120:2030–2039. doi: 10.1172/JCI42002. [DOI] [PMC free article] [PubMed] [Google Scholar]
- 8.Hüsemann Y, et al. Systemic spread is an early step in breast cancer. Cancer Cell. 2008;13:58–68. doi: 10.1016/j.ccr.2007.12.003. [DOI] [PubMed] [Google Scholar]
- 9.Sänger N, et al. Disseminated tumor cells in the bone marrow of patients with ductal carcinoma in situ. Int J Cancer. 2011;129:2522–2526. doi: 10.1002/ijc.25895. [DOI] [PubMed] [Google Scholar]
- 10.Wen HC, et al. p38α signaling induces anoikis and lumen formation during mammary morphogenesis. Sci Signal. 2011;4:ra34. doi: 10.1126/scisignal.2001684. [DOI] [PMC free article] [PubMed] [Google Scholar]
- 11.Cardiff RD. Validity of mouse mammary tumour models for human breast cancer: comparative pathology. Microsc Res Tech. 2001;52:224–230. doi: 10.1002/1097-0029(20010115)52:2<224::AID-JEMT1007>3.0.CO;2-A. [DOI] [PubMed] [Google Scholar]
- 12.Lu J, et al. 14-3-3ζ cooperates with ErbB2 to promote ductal carcinoma in situ progression to invasive breast cancer by inducing epithelial–mesenchymal transition. Cancer Cell. 2009;16:195–207. doi: 10.1016/j.ccr.2009.08.010. [DOI] [PMC free article] [PubMed] [Google Scholar]
- 13.Strippoli R, et al. p38 maintains E-cadherin expression by modulating TAK1-NF-κB during epithelial-to-mesenchymal transition. J Cell Sci. 2010;123:4321–4331. doi: 10.1242/jcs.071647. [DOI] [PubMed] [Google Scholar]
- 14.Entenberg D, et al. Setup and use of a two-laser multiphoton microscope for multichannel intravital fluorescence imaging. Nat Protocols. 2011;6:1500–1520. doi: 10.1038/nprot.2011.376. [DOI] [PMC free article] [PubMed] [Google Scholar]
- 15.Malladi S, et al. Metastatic latency and immune evasion through autocrine inhibition of WNT. Cell. 2016;165:45–60. doi: 10.1016/j.cell.2016.02.025. [DOI] [PMC free article] [PubMed] [Google Scholar]
- 16.Leung JY, et al. Activation of AXIN2 expression by β-catenin-T cell factor. A feedback repressor pathway regulating Wnt signaling. J Biol Chem. 2002;277:21657–21665. doi: 10.1074/jbc.M200139200. [DOI] [PubMed] [Google Scholar]
- 17.Grumolato L, et al. Canonical and noncanonical Wnts use a common mechanism to activate completely unrelated coreceptors. Genes Dev. 2010;24:2517–2530. doi: 10.1101/gad.1957710. [DOI] [PMC free article] [PubMed] [Google Scholar]
- 18.Nieto MA, Huang RY, Jackson RA, Thiery JP. Emt: 2016. Cell. 2016;166:21–45. doi: 10.1016/j.cell.2016.06.028. [DOI] [PubMed] [Google Scholar]
- 19.Bragado P, et al. TGF-β2 dictates disseminated tumour cell fate in target organs through TGF-β-RIII and p38α/β signalling. Nat Cell Biol. 2013;15:1351–1361. doi: 10.1038/ncb2861. [DOI] [PMC free article] [PubMed] [Google Scholar]
- 20.Brisken C, et al. Essential function of Wnt-4 in mammary gland development downstream of progesterone signaling. Genes Dev. 2000;14:650–654. [PMC free article] [PubMed] [Google Scholar]
- 21.Rhim AD, et al. Detection of circulating pancreas epithelial cells in patients with pancreatic cystic lesions. Gastroenterology. 2014;146:647–651. doi: 10.1053/j.gastro.2013.12.007. [DOI] [PMC free article] [PubMed] [Google Scholar]
- 22.Ocaña OH, et al. Metastatic colonization requires the repression of the epithelial–mesenchymal transition inducer Prrx1. Cancer Cell. 2012;22:709–724. doi: 10.1016/j.ccr.2012.10.012. [DOI] [PubMed] [Google Scholar]
- 23.Brabletz T. To differentiate or not – routes towards metastasis. Nat Rev Cancer. 2012;12:425–436. doi: 10.1038/nrc3265. [DOI] [PubMed] [Google Scholar]
- 24.Schmidt JM, et al. Stem-cell-like properties and epithelial plasticity arise as stable traits after transient Twist1 activation. Cell Reports. 2015;10:131–139. doi: 10.1016/j.celrep.2014.12.032. [DOI] [PubMed] [Google Scholar]
- 25.Fischer KR, et al. Epithelial-to-mesenchymal transition is not required for lung metastasis but contributes to chemoresistance. Nature. 2015;527:472–476. doi: 10.1038/nature15748. [DOI] [PMC free article] [PubMed] [Google Scholar]
- 26.Hui L, et al. p38α suppresses normal and cancer cell proliferation by antagonizing the JNK–c-Jun pathway. Nat Genet. 2007;39:741–749. doi: 10.1038/ng2033. [DOI] [PubMed] [Google Scholar]
- 27.Gozdecka M, et al. JNK suppresses tumor formation via a gene-expression program mediated by ATF2. Cell Reports. 2014;9:1361–1374. doi: 10.1016/j.celrep.2014.10.043. [DOI] [PubMed] [Google Scholar]
- 28.Bhoumik A, et al. Suppressor role of activating transcription factor 2 (ATF2) in skin cancer. Proc Natl Acad Sci USA. 2008;105:1674–1679. doi: 10.1073/pnas.0706057105. [DOI] [PMC free article] [PubMed] [Google Scholar]
- 29.Fizazi K, et al. Cancers of unknown primary site: ESMO clinical practice guidelines for diagnosis, treatment and follow-up. Annals Oncol. 2015;26:v133–v138. doi: 10.1093/annonc/mdv305. [DOI] [PubMed] [Google Scholar]
- 30.Narod SA, Iqbal J, Giannakeas V, Sopik V, Sun P. Breast cancer mortality after a diagnosis of ductal carcinoma in situ. JAMA Oncol. 2015;1:888–896. doi: 10.1001/jamaoncol.2015.2510. [DOI] [PubMed] [Google Scholar]
- 31.Hosseini H, et al. Early dissemination seeds metastasis in breast cancer. Nature. 2016 doi: 10.1038/nature20785. [DOI] [PMC free article] [PubMed]
- 32.Debnath J, Muthuswarmy SK, Brugge JS. Morphogenesis and oncogenesis of MCF-10A mammary epithelial acini grown in three-dimensional basement membrane cultures. Methods. 2013;3:256–268. doi: 10.1016/s1046-2023(03)00032-x. [DOI] [PubMed] [Google Scholar]
- 33.Debnath J, Brugge JS. Modelling glandular epithelial cancers in three-dimensional cultures. Nat Rev Cancer. 2015;5:675–688. doi: 10.1038/nrc1695. [DOI] [PubMed] [Google Scholar]
- 34.Schneider CA, Rasband WS, Eliceiri KW. NIH Image to ImageJ: 25 years of image analysis. Nat Methods. 2012;9:671–675. doi: 10.1038/nmeth.2089. [DOI] [PMC free article] [PubMed] [Google Scholar]
- 35.Thévenaz P, Ruttimann UE, Unser M. A pyramid approach to subpixel registration based on intensity. IEEE Trans Image Process. 1998;7:27–41. doi: 10.1109/83.650848. [DOI] [PubMed] [Google Scholar]
Associated Data
This section collects any data citations, data availability statements, or supplementary materials included in this article.
Data Availability Statement
The datasets generated during and/or analysed during the current study are available within the paper (and its Supplementary Information) and/or from the corresponding author on reasonable request.