

Abstract
Tumor phenotypes captured in computed tomography (CT) images can be described qualitatively and quantitatively using radiologist-defined “semantic” and computer-derived “radiomic” features, respectively. While both types of features have shown to be promising predictors of prognosis, the association between these groups of features remains unclear. We investigated the associations between semantic and radiomic features in CT images of 258 non-small cell lung adenocarcinomas. The tumor imaging phenotypes were described using 9 qualitative semantic features that were scored by radiologists, and 57 quantitative radiomic features that were automatically calculated using mathematical algorithms. Of the 9 semantic features, 3 were rated on a binary scale (cavitation, air bronchogram, and calcification) and 6 were rated on a categorical scale (texture, border definition, contour, lobulation, spiculation, and concavity). 32–41 radiomic features were associated with the binary semantic features (AUC = 0.56–0.76). The relationship between all radiomic features and the categorical semantic features ranged from weak to moderate (|Spearmen’s correlation| = 0.002–0.65). There are associations between semantic and radiomic features, however the associations were not strong despite being significant. Our results indicate that radiomic features may capture distinct tumor phenotypes that fail to be perceived by naked eye that semantic features do not describe and vice versa.
Introduction
Medical imaging is an indispensable clinical tool for cancer diagnosis, staging, and therapeutic assessment. In particular, computed tomography (CT) is the most widely used imaging modality and is the standard of care for lung cancer management1, 2. Lung cancer is the deadliest cancer type with a 5-year overall survival rate of only about 15% and affects over 1.5 million patients worldwide3. Several studies have indicated that the identification of unique characteristics of individual lung tumors may provide clinicians with crucial information to personalize treatments for patients4, 5. These unique characteristics can be qualitative CT-based descriptors, termed semantic features, that describe a tumor’s shape and internal structure that are scored by radiologists to characterize lung lesions5–8. Semantic features have been shown to predict prognosis9–13, therapeutic response14, 15, and genetic mutations16–18 in patients with lung cancer. For example, a tumor with cavitation has been shown to be an indicator of high aggressiveness and poor prognosis, based on the rationale that fast growing tumors may exceed the growth of their blood supply resulting in air-filled cavities arising from central necrosis9. Semantic features are considered qualitative since they are scored according to the visual assessment of radiologists, which limits the extent of the tumor description to what is observable by the eye.
The quantitative nature of CT allows numerous imaging features to be defined using advanced mathematical algorithms to describe tumor shape, image intensity distribution, and the relationship between image voxels in great detail that may fail to be perceived by the naked eye of physicians–even experienced radiologists19–22. Radiomics is a field that extracts these imaging features to quantitatively characterize the tumor phenotype with high-throughput23, 24. Many groups have reported that radiomic features may predict overall survival19, 25–27, distant metastasis28–30, treatment response31–33, and somatic mutations34–36 in lung cancer patients, as well as other malignancies.
While both semantic and radiomic features have been investigated for their promise in characterizing tumors for personalized therapy, the associations between the two feature types has yet to be investigated. Understanding the association between these two types of features may shed light on their complementary nature in outcome and genetic prediction. Furthermore, radiomic features are known as agnostic features as they are difficult to intuitively interpret or describe37, however, understanding their association with semantic features may help interpret some of the radiomic features, based on their highly correlated semantic counterparts. In this study, we investigated the relationship between various semantic and radiomic features in 258 patients with lung adenocarcinoma.
Results
Our study cohort consisted of 183 early stage (Stage I and II) and 75 advanced stage (stage III and IV) patients with non-small cell lung adenocarcinoma (Table 1). This study investigated the association between 9 semantic and 57 radiomic features. Although 296 radiomic features were initially extracted from CT images, only 57 features (10 unfiltered and 47 filtered features) with |ρ| ≤ 0.85 were included to evaluate their relationship with semantic features. Cavities, tube-like or branched air structures (air bronchogram) were found in over 50% of the tumors, while only 11% of the tumors were calcified (Table 1). The majority of the tumors had a solid texture with somewhat irregular contours and slight concavity (Table 1).
Table 1.
Patient characteristics. Distribution of patient tumor characteristics and radiologists’ scoring for semantic features.
| Number of Patients | Total |
|---|---|
| 258 | |
| Sex | |
| Male/Female | 146 (57%)/112 (43%) |
| Median age (year) | 59 (range 30–81) |
| Smoking history | |
| Current or Former/Never | 117 (45%)/141 (55%) |
| Clinical stage | |
| I/II/III/IV | 160 (62%)/23 (9%)/66 (26%)/9 (3%) |
| Histology subtype | |
| Minimally invasive adenocarcinoma | 3 (1%) |
| Acinar predominant | 109 (42%) |
| Lepidic predominant | 60 (23%) |
| Papillary predominant | 20 (8%) |
| Micropapillary predominant | 12 (5%) |
| Solid predominant | 49 (19%) |
| Variants of invasive adenocarcinomas | 5 (2%) |
| Tumor grade | |
| Low/Intermediate/High | 3 (1%)/189 (73%)/66 (26%) |
| CT Scanners | |
| Siemens | |
| Somatom Sensation 64 | 30 (12%) |
| GE scanner | |
| Lightspeed 16/Discovery CT750 HD | 35 (14%)/193(75%) |
| Binary semantic features | |
| Cavitation (score: 0/1) | 106 (41%)/152 (59%) |
| Air Bronchogram (score: 0/1) | 116 (45%)/142 (55%) |
| Calcification (score: 0/1) | 229 (89%)/29(11%) |
| Categorical Semantic features | |
| Texture (score: 1/2/3) | 6 (2%)/68 (26%)/184 (71%) |
| Border definition (score: 1/2/3) | 13 (5%)/178 (69%)/67 (26%) |
| Contour (score: 1/2/3/4) | 17 (7%)/26 (10%)/166 (64%)/49 (19%) |
| Lobulation (score: 1/2/3/4) | 10 (4%)/115 (45%)/102 (40%)/31 (12%) |
| Spiculation (score: 1/2/3) | 63 (24%)/85 (33%)/110 (43%) |
| Concavity (score: 1/2/3) | 9 (4%) /156 (61%)/93 (36%) |
Binary semantic features
The area under the receiver operating characteristic curve (AUC) was used to quantify the association between binary semantic and radiomic features. Tumors with cavitation, tube-like or air branched structures (air bronchogram) were associated with low values of shape-based sphericity and had lower values for features that described homogeneity (e.g. gray level co-occurrence matrix derived (GLCM) energy), but greater values for features that described heterogeneity (e.g. gray level size zone matrix derived (GLSZM) size-zone-variability) (Fig. 1). For instance, as observed in Fig. 2, tumors with cavitation were less spherical and more heterogeneous than those without cavitation. 41, 32, and 10 radiomic features were significantly related to cavitation (AUCprop = 0.59–0.76, AUCinv-prop = 0.56–0.75), air bronchogram (AUCprop = 0.59–0.64, AUCinv-prop = 0.57–0.66), and calcification (AUCprop = 0.60–0.68, AUCinv-prop = 0.62), respectively. In particular, GLCM-Cluster Prominence (AUCprop = 0.76), Wavelet high-high-low pass filtered (HHL) GLCM-inverse Variability (AUCinv-prop = 0.66), and Kurtosis (AUCprop = 0.68) were most strongly associated with cavitation, air bronchogram, and calcification, respectively (Figs 1 and 3). Supplementary Table S2 and S3 show the AUC and q-values for all the features. However, tumor volume, statistic-based skewness, 5 Laplacian of Gaussian (LoG) and 8 wavelet filtered features were not significantly associated with any of the binary features (AUCprop = 0.51–0.59, AUCinv-prop = 0.50–0.63; q-value ≥ 0.70).
Figure 1.
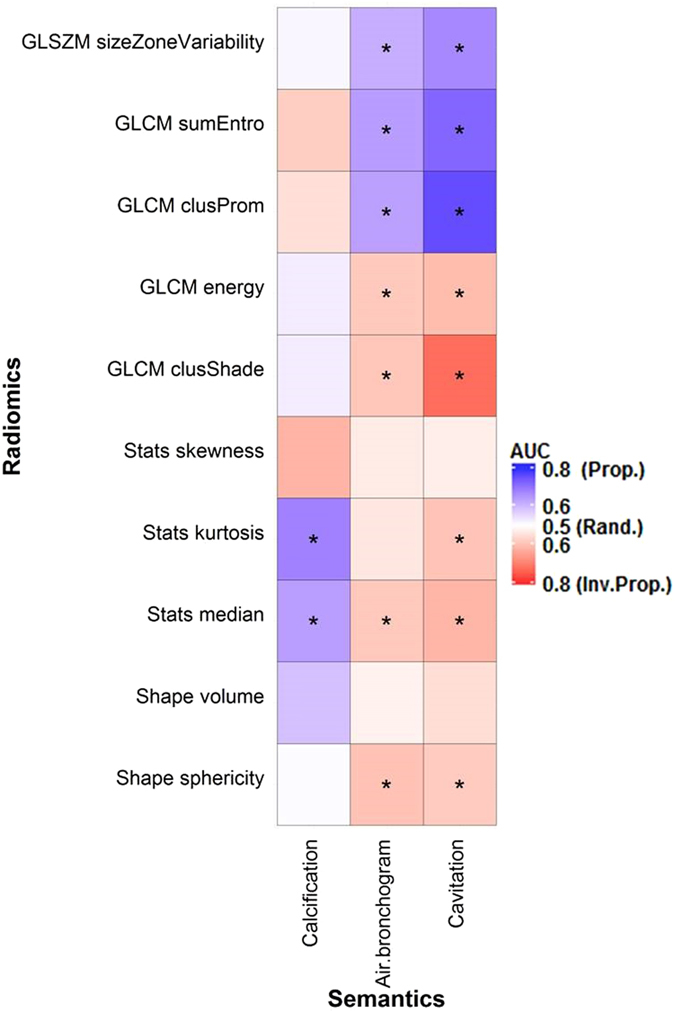
Association between the binary semantic and unfiltered radiomic features assessed with the area under the ROC curve (AUC). *Indicates a significant association (q-value ≤ 0.05). “Rand.” = random association (AUC = 0.50). “Prop.” and “Inv. Prop.” indicate direct and inverse proportionality, respectively.
Figure 2.
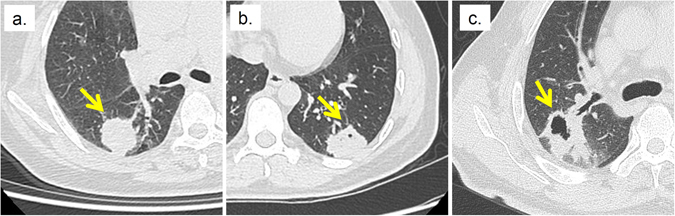
Tumors with and without cavitation. (a) Tumor without cavitation (b) Tumor with minor Cavitation (c) Tumor with major Cavitation. The arrow indicates the location of the tumor.
Figure 3.
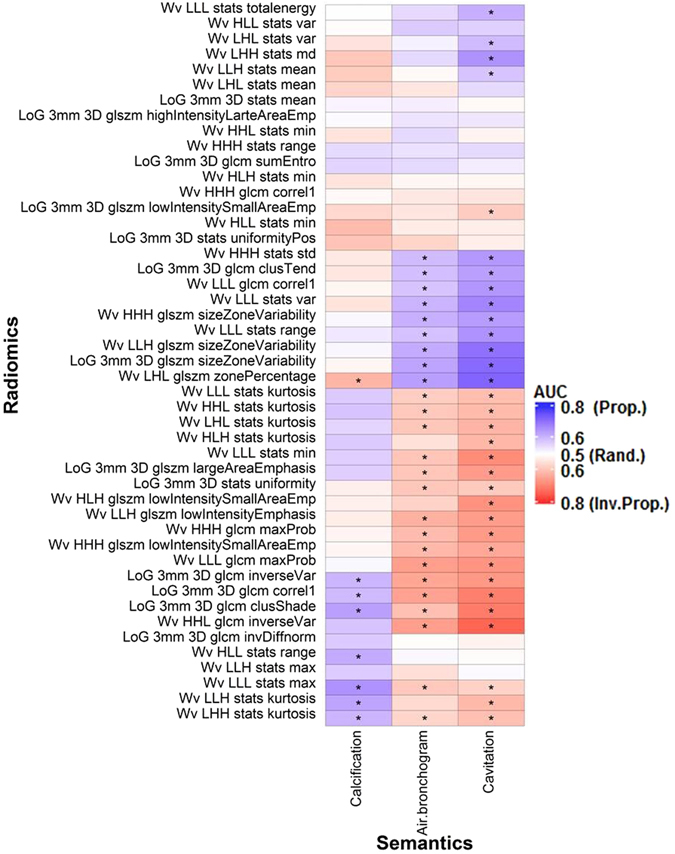
Associations between the binary semantic and unfiltered radiomic features assessed with the area under the ROC curve (AUC). *Indicates a significant association (q-value ≤ 0.05). “Rand.” = random association (AUC = 0.50). “Prop.” And “Inv. Prop.” indicate direct and inverse proportionality, respectively. Wv = Wavelet. LoG = Laplacian of Gaussian.
Categorical semantic features
Radiomic features were also associated with categorical semantic features. Over 30 radiomic features were significantly related to texture (51 radiomic features), border definition (41 radiomic features), contour (35 radiomic features), lobulation (33 radiomic features), and spiculation (32 radiomic features) as evaluated with the Kruskal Wallis test (Figs 4 and 5). Only four radiomic features were found to have a significantly association with concavity (Figs 4 and 5).
Figure 4.
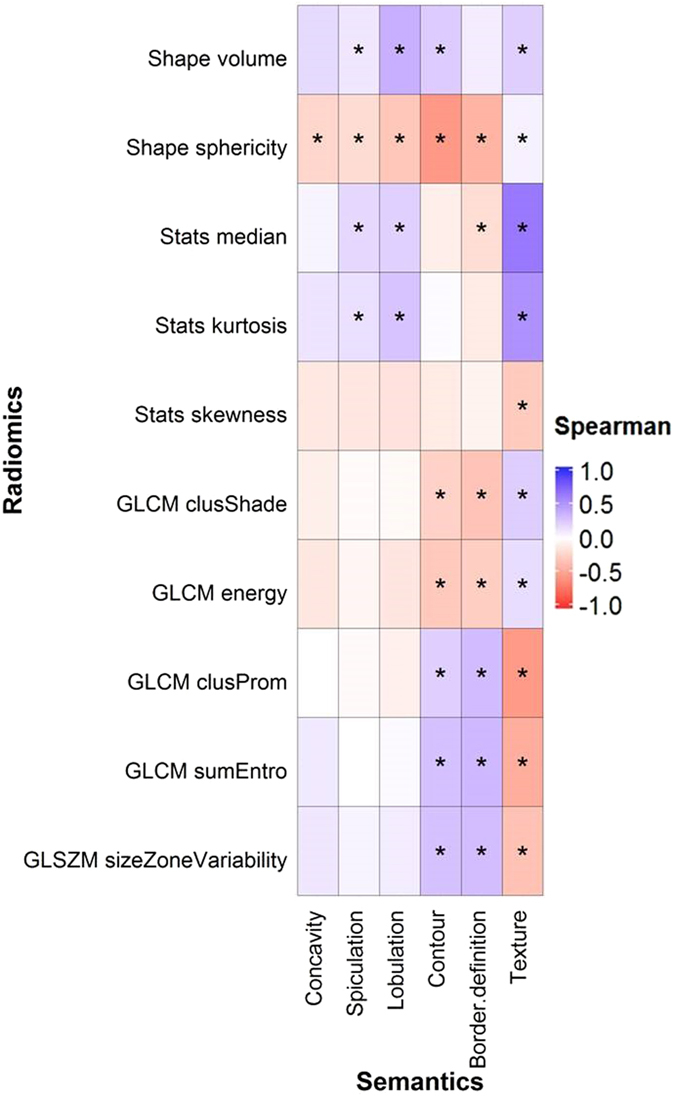
Association between the six categorical semantic and ten unfiltered radiomic features assessed with Spearman coefficient correlation. *Indicates that the association was significant (q-value ≤ 0.05).
Figure 5.
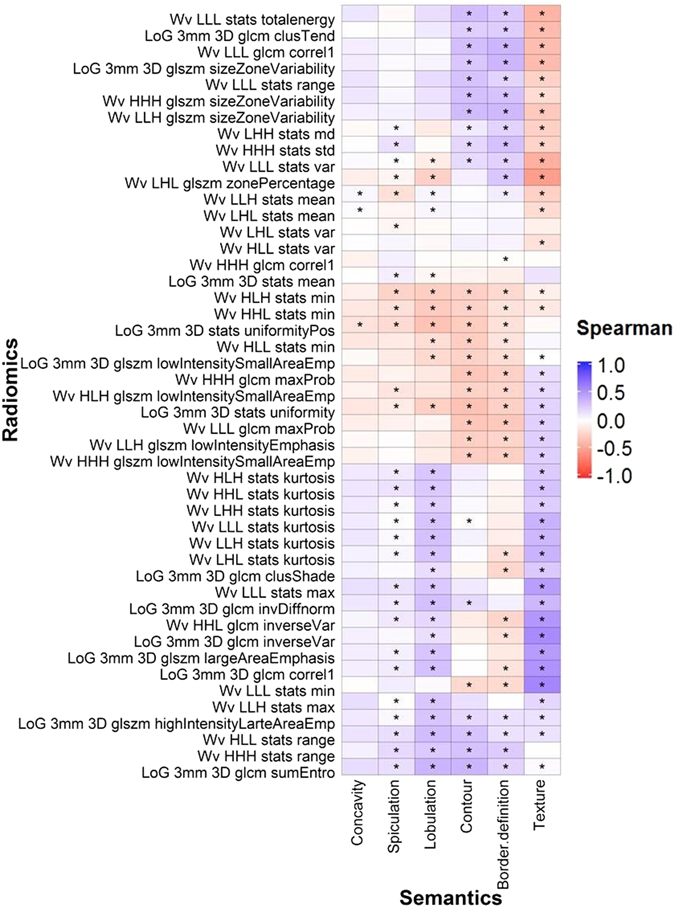
Associations between the categorical semantic and unfiltered radiomic features assessed with Spearman coefficient correlation. *Indicates a statistically significant association (q-value ≤ 0.05). Wv = Wavelet. LoG = Laplacian of Gaussian.
Tumors with non-solid or poorly defined boundaries generally had higher values in features that quantified heterogeneity (e.g. GLSZM size zone variability) (Fig. 4). Tumors with strong lobulation and spiculation, deep concavity, or poorly-defined borders were inversely correlated with shaped-based sphericity (Figs 4 and 6). For example, Fig. 6 shows that tumors with well-defined borders are more spherical and homogeneous than tumors with irregular and poorly-defined borders. The absolute correlations (|ρ|) between these radiomic features and texture, border definition, contour, lobulation, spiculation, and concavity were 0.002–0.65 (median = 0.26), 0.01–0.42 (median = 0.24), 0.01–0.57 (median = 0.28), 0.05–0.38 (median = 0.27), 0.003–0.25 (median = 0.11), and 0.02–0.23 (median = 0.10), respectively (Fig. 4). Shape-based sphericity was significantly associated with all categorical features and was most correlated with border definition, contour, and concavity. The median value of the tumor image intensity (Hounsfield Unit), Wavelet HLH statistics-based minimum, and tumor volume was most associated with texture, spiculation, and lobulation, respectively. Supplementary Table S4 and S5 show the ρ and Kruskal-Wallis test q-values for all the features.
Figure 6.
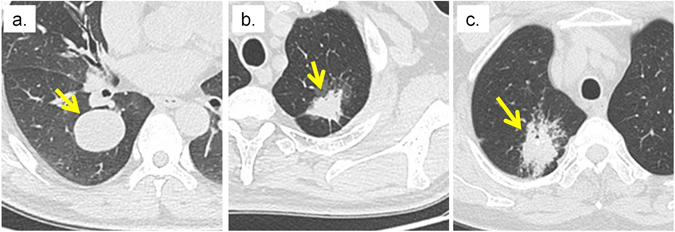
Tumors with different border definitions. (a) Tumor with a well-defined border (score = 1). (b) Tumor with neither a well- or poorly-defined border (score = 2). (c) Tumor with a poorly-defined border (score = 3). The arrow indicates the location of the tumor.
Discussion
Semantic features are qualitative imaging features that are defined by experienced radiologists and have shown to be promising predictors of the aggressiveness of lung adenocarcinoma5, 24, 37. Radiomic features are automatically and quantitatively extracted from CT images using advanced mathematical algorithms that have also shown great potential to predict clinical outcomes and describe tumor heterogeneity23. Assessing the relationship between both types of features may help understand their complementary nature for outcome prediction and may allow a better and more intuitive interpretation of radiomic features. We investigated the relationship between 9 semantic and 57 radiomic features in lung adenocarcinoma patients.
When describing tumor characteristics, global qualitative features of tumors (e.g. border, roundness, and interior texture) are most noticeable to radiologists. However, radiomic features are based on mathematical algorithms that describe tumor phenotypes that may not be noticeable to radiologists. Since both types of features aim to describe the tumor appearance captured on CT images, it is not surprising that all semantic features were associated with at least four radiomic features (Figs 1, 3, 4 and 5). In particular, shape-based sphericity was significantly related to all semantic features, except calcification (Figs 1 and 4). Sphericity quantifies the roundness of a tumor and is considered as a dominate feature of the tumor which may relate to the semantic features which also have some dependence on roundness.
Round tumors with a smooth border may tend to be more indolent. Lobulation and spiculation describe the undulating patterns and spikes on the tumor borders. Shape-based sphericity was negatively correlated with lobulation and spiculation, thus indicating that round tumors have fewer undulations and spikes. Indeed, tumors with no spiculation, no lobulation are less likely to be associated with local and distant metastasis and poor survival7, 12, 38, 39. Furthermore, the surrounding bronchus and blood vessels may hamper isotropic enlargement of the tumor leading to the “notch” appearance (or concave cuts) in its boundary. We also observed that irregular and non-spherical tumors often had higher concavity (Fig. 6 and Supplementary Figure S2). Tumors with high concavity are often an indicator of poorly differentiated adenocarcinoma and outcomes40–42. Our observations were thus consistent with the previous studies that tumors with irregular and non-spherical shape are more aggressive, and thus are poor prognostic indicators12, 43, 44.
Tumors with a high median intensity were more likely to be calcified or solid. Single to multiple calcium “spots” can be observed on the calcified tumors. These spots were usually small and did not distort or contribute to the overall structure of the tumor (Supplemental Figure S1). This may explain why the relationship between shape-based Sphericity and calcification was not significant. Studies have reported that calcium layers generally have higher image intensity than tumor tissues45–47. We also found in this study that calcified tumors were significantly associated with higher median image intensity. Ground glass opacity (GGO) lesions refer to hazy regions with slightly increased CT attenuation in the lung without obscuring the visibility of normal lung parenchyma, airways, and vessels48 (Supplemental Figure S2). While partly solid tumors only partially obscure the bronchial and vascular structures, solid tumors completely obscured these structures (Supplemental Figure S2). Due to the hazy appearance of GGO (non-solid) tumors, their median image intensity was less than partly solid and solid tumors (Fig. 4). In addition, since GGO and partly solid tumors do not completely obscure the bronchi and vessels, they often appear to be more heterogeneous than solid tumors. Non- or partly solid tumors often had lower values in homogenous features (e.g. GLCM-Energy), but higher values in heterogeneous features (e.g. GLSZM-Size Zone Variability) than solid tumors (Fig. 4). Furthermore, GGO and partly solid tumors can be further described by radiologists as well-defined/coarse interface, the proportion of consolidation, or bronchus cut-off, etc49, 50. However, our radiologists only classified the textures of tumors into GGO, partly solid, and solid lesions. In the future, it would be interesting to investigate the relationship between these sub-semantic categories and radiomic features, specific to GGO or partly solid tumors.
Radiomic features that quantify the spatial relationship between image voxels (textural features) may be useful to measure the tumor cavitation and air bronochogram. Tumor cavitation and air bronchogram were significantly and moderately associated with all textual radiomic features (Fig. 1). GLCM-Cluster Shade and GLCM-Cluster Prominence emulate human perception and measure asymmetry and intensity variation within the tumors51. Textural features, for instance GLCM-Energy and GLSZM-Size Zone Variability, measure the degree of spatial intensity variability in a tumor52. Cavitation is often observed in rapidly growing tumors as they can outgrow the blood supply resulting in air-filled cavities8, 53, 54. Tumors with air bronchogram contain tube-like structures and are highly metastatic40, 44. Cavities and tube-like structures give tumors heterogeneous appearance (Fig. 2).
The binary and categorical scales employed to rate semantic features may be insufficient to describe subtle tumor characteristics. However, radiomic features have values on a continuous scale which can provide greater detail for changes in tumor characteristics. Despite the significant relationships between semantic and radiomic features, such relationships only ranged from weak to moderate. For example, although the contour semantic feature and the shape-based sphericity radiomic feature both measure the roundness of the tumor, they were only moderately correlated (ρ = −0.57, Fig. 4). Notably, shape-based Sphericity is a continuous feature whereas contour was rated on a categorical scale. Another example is cavitation. As observed in Fig. 2, tumors can exhibit various degrees of cavitation. However, tumors are only rated either with or without cavitation and make no differentiation between high or low degrees of cavitation.
Furthermore, while GLCM-Cluster Prominence‒a intensity variability measure‒can be used to detect small intensity differences between image voxels51, radiologists may fail to identify such variations. It is assumed that radiomic features are able to capture tumor characteristics fail to be identified by radiologists22, 23. The weak to moderate relationship between semantic and radiomic features may thus be due to the fact that radiologists cannot detect the subtle change in tumors using the categorical scales. Additionally, it has been reported that radiologists may overlook salient features on CT and chest X-ray, even around regions with lung abnormalities55, 56. Since objective radiomic features are continuous, they may have advantage over subjective semantic features in identifying imaging phenotypes, which may fail to be perceived by the naked eye, for tumor characterization20, 57.
Thus far, our discussion has focused on unfiltered features, such as shape-based sphericity and GLCM-based energy, because filtered features are more difficult to interpret. A LoG filter involves applying the Gaussian filter to an image to remove random noise while a Laplacian filter is employed to enhance strong features on the image. A wavelet transformation decomposes the low (coarse feature) and high (fine feature) frequency regions of an image58, 59. Both Coroller et al.28 and Huynh et al.29 found that the Wavelet LLH stats range was significantly predictive of distant metastasis in lung cancer in both their datasets. Wavelet LLH stats range and Wavelet LLH stats max were highly correlated in our dataset (ρ = 0.95, results not shown). Wavelet LLH stats max may also be correlated to lung tumor metastatic potential. It is not surprising that Wavelet LLH stats max was significantly associated with spiculation and lobulation (Fig. 4) since tumors with coarse spiculation and lobulation are likely to be invasive.
In our study, all of the patients had non-contrast-enhanced CT images. A recent study by He et al.60 investigated the impact of various CT acquisition parameters (i.e. contrast-enhancement, slice thickness, and convolution kernel) on the diagnostic performance of radiomic features in pulmonary nodules. Although contrast agents may obscure imaging features that reflect the underlying intra-tumoral heterogeneity, features computed with different types of CT images were both predictive of the nodule malignant status with <5% difference in the AUCs (i.e. AUCnon-contrast = 0.86 vs AUCcontrast = 0.82 in the training and AUCnon-contrast = 0.75 and AUCcontrast = 0.74 in the validation cohort). Therefore, the association between semantic and radiomic features based on the contrast enhanced CT should still range from weak to moderate as observed in our current study.
Conclusion
A number of radiomic features were significantly associated with semantic features. However, the associations only ranged from weak to moderate, suggesting that both types of feature can potentially provide information that captures tumor phenotypes differently. As both semantic and radiomic features have shown promise in identifying aggressive tumors, their complementary roles in outcome prediction needs to be further investigated.
Materials and Methods
Patient and CT imaging
In this retrospective study, all experimental and imaging protocols were approved by an Institutional Review Board at the Tianjin Medical University Cancer Institute and Hospital (Tianjin, PR China) and informed consent was waived for all the participants. All methods were also performed in accordance with relevant guidelines and regulations. The cohort consisted of 258 Asian patients with pathological confirmation of lung adenocarcinoma either by surgical specimens or biopsy sample between November 2012 and March 2014. Table 1 shows the patient characteristics.
Chest CT images were acquired on one of the three multiple detector CT scanners: Somatom Senation 64 (Siemens AG, Erlangen, Germany), Lightspeed 16, or Discovery CT750HD (GE Healthcare, Waukesha, WI) prior to any treatments. The CT images acquired on the 64-detector Siemens scanner were scanned with a tube voltage of 120 kVp, automatically adjusted current, pitch of 0.969, and were reconstructed with a 1.5 mm slice thickness. The image acquisition parameters for both GE scanners were 120 kVp and 150–200 mA with a pitch of 0.969. The reconstructed images acquired on the GE scanners had a slice thickness of 1.25 mm.
Semantic features
Three experienced thoracic radiologists (Y.L., F.Q., and S.L.) independently reviewed all CT images and assigned scores to each tumor for nine semantic imaging features. All radiologists were blinded to the scores assigned by the other radiologists. The score that was chosen by the majority of the radiologists was recorded for that semantic feature. If none of the radiologists had the same score, they reviewed the CT images together and any discrepancies were resolved by discussion until consensus was reached. Three semantic features (cavitation, air bronchogram, and calcification) were scored on a binary scale and rated as having the presence (score = 1) or absence (score = 0) of characteristic. The following semantic features were scored on categorical scales, ranging from 1 to 4: texture, border definition, contour, lobulation, spiculation, and concavity. The semantic features that were scored on the binary or categorical scales are hereafter referred to as binary or categorical features, respectively. The definitions and scoring scale of each semantic feature is shown in Table 2. Visual examples of tumors with different semantic features are shown in the Supplementary Information (Supplementary Figures S1 and S2 in Supplemental).
Table 2.
Definition of the CT-based semantic features for lung tumor. Visual examples of tumors with different semantic features are shown in the supplemental materials.
| Semantic feature type | Semantic feature | Definition | Scoring |
|---|---|---|---|
| Binary Features | |||
| Cavitation | Gas-filled space (cavity) within the tumor due to central necrosis | 1 = presence, 0 = absence | |
| Air Bronchogram | Tubular line or branched air structure within the tumor | 1 = presence, 0 = absence | |
| Calcification | Display layer(s) of calcium in any patterns | 1 = presence, 0 = absence | |
| Categorical Features | |||
| Texture | Non-solid/GGO, part-solid or solid tumor | 1 = non-solid/GGO; 2 = part-solid; 3 = solid | |
| Border definition | Appearance of the edge of the tumor | 1 = well defined; 2 = tumor border is neither poor nor well defined; 3, poorly defined | |
| Contour | Roundness of the tumor | 1 = round; 2 = oval; 3 = somewhat irregular; 4 = irregular | |
| Lobulation | Tumor with undulating border | 1 = not lobulated; 2 to 4 = lobulated tumor with increasing degree | |
| Spiculation | Tumor with spikes its edge | 1 = no spiculation; 2 = fine spiculation; 3 = coarse spiculation | |
| Concavity | Notches (or concave cut) on the tumor surface | 1 = no concavity; 2 = slight concavity; 3 = deep concavity | |
Tumor volume segmentation and radiomic feature extraction
Tumor volume segmentation were performed on the Definiens Developer XD© (Munich, Germany) imaging platform. Tumor volumes were segmented using the single-click ensemble segmentation (SCES) algorithm61 and a region growing algorithm62. Briefly, two radiologists (Y.L. and Q.L.) identified tumor regions for automatic seed point generation using SCES. A region growing algorithm was then performed on each seed point to create the tumor volume. The segmented tumor volumes were then reviewed slice-by-slice and manually adjusted by the radiologists (Y.L. and Q.L.). A detailed description of the tumor segmentation process can be found in our previous studies61, 63, 64. All tumor segmentations were performed on the chest CT images based on the lung window settings.
All radiomic features were computed using an in-house software based on MATLAB (The Mathworks Inc, Natick, MA, U.S.A.). Within the segmented tumor volumes, 13 shape features, 12 statistics features, and 23 textural features were extracted from the CT images. The textural features included 17 gray level co-occurrence matrix (GLCM), 1 gray level size zone matrix (GLSZM), and 5 run length gray level (RLGL) features.
Laplacian of Gaussian (LoG) and wavelet filters are often applied to medical images prior to textural feature extraction19, 28, 65. LoG and wavelet filters were applied to the CT images and an additional 247 radiomic features were extracted. In total, 294 radiomic features (47 unfiltered and 247 filtered features) were computed.
Radiomic feature selection
Spearman’s correlation coefficient (ρ) was used to assess the correlation between all radiomic features. Feature pairs with |ρ| ≥ 0.85 were considered to be strongly correlated and likely to provide redundant information about the tumor phenotype. In these strongly correlated pairs, feature with the highest average |ρ| was excluded. After the exclusion, 10 unfiltered radiomic features (two shape (volume and sphericity), three statistics (kurtosis, median, and skewness), four GLCM (cluster-shade, cluster-prominence, energy, and sum-entropy), and one GLSZM size-zone-variability), and 47 filtered radiomic features remained and were included in the analysis. A brief description of the unfiltered and filtered features is shown in Supplementary Table S1.
Data analysis
All analysis was performed using R software (version 3.2) with the “caret”66, Bioconductor “pROC” and “survcomp” packages67.
The association between radiomic features and binary semantic features was assessed using the area under the receiver operating curve (AUC). An AUC > 0.5 suggests direct proportionality between the radiomic and binary semantic features (i.e. a higher radiomic feature value corresponds to the presence of a binary semantic feature) and was defined as AUCprop. An AUC < 0.5 indicates inverse proportionality; that is, the presence of a binary semantic feature is associated with a low radiomic feature value. For AUC < 0.5, AUCinv-prop was defined as 1-AUC. Both AUCprop and AUCinv-prop ranged from 0.50 to 1.00. We adapted the interpretation of the AUC from previous studies with 0.50 < AUCs ≤ 0.70, 0.70 < AUCs ≤ 0.90, and 0.90 < AUCs ≤ 1.00 to indicate weak, moderate, and excellent association68, 69. Noether’s test was used to determine the significance of the AUC from a random relationship (AUC = 0.5).
For the semantic features that were scored on the categorical scale, the strength and direction of their association with radiomic features were evaluated using the Spearman’s correlation coefficient (ρ). The cutoffs of |ρ| for weak, moderate, high, and excellent correlations was ≤0.50, 0.50 < |ρ| ≤ 0.70, 0.70 < |ρ| ≤ 0.90, and |ρ| > 0.90, respectively70. The Kruskal-Wallis test was used to assess the significance of the association.
All p-values were corrected for multiple hypothesis testing by adjusting the false discovery rate according to the Benjamini and Hochberg procedure71, where a q-value < 0.05 suggested statistical significance.
Electronic supplementary material
Acknowledgements
The authors would like to acknowledge support from the National Institute of Health Award Numbers U01CA190234, U24CA194354 (to H.J.W.L.A.), and U01CA143062 (to R.J.G.), and research seed funding grant from the American Association of Physicists in Medicine. The authors would also like to thank Dr. Elizabeth Huynh for editorial assistance.
Author Contributions
S.S.F.Y., H.J.W.L.A., and C.P. conceived of the project and analyzed the data. S.S.F.Y., Y.L., and C.P. wrote the paper. Y.L., Q.L., S.L., F.Q., Z.Y., and R.J.G. curated and processed all the data. H.J.W.L.A., Y.L., Q.L., S.L., F.Q., Z.Y., and R.J.G. provided expert guidance as well as data and image analysis tools. All authors reviewed and edited the manuscript.
Competing Interests
The authors declare that they have no competing interests.
Footnotes
Stephen S. F. Yip and Ying Liu contributed equally to this work.
Electronic supplementary material
Supplementary information accompanies this paper at doi:10.1038/s41598-017-02425-5
Publisher's note: Springer Nature remains neutral with regard to jurisdictional claims in published maps and institutional affiliations.
References
- 1.Gould MK, et al. Evaluation of Individuals With Pulmonary Nodules: When Is It Lung Cancer?: Diagnosis and Management of Lung Cancer, 3rd ed: American College of Chest Physicians Evidence-Based Clinical Practice Guidelines. Chest. 2013;143:e93S–e120S. doi: 10.1378/chest.12-2351. [DOI] [PMC free article] [PubMed] [Google Scholar]
- 2.Hicks RJ, Lau E, Alam NZ, Chen RY. Imaging in the diagnosis and treatment of non-small cell lung cancer. Respirology. 2007;12:165–172. doi: 10.1111/j.1440-1843.2006.01012.x. [DOI] [PubMed] [Google Scholar]
- 3.Torre LA, et al. Global cancer statistics, 2012. CA: A Cancer Journal for Clinicians. 2015;65:87–108. doi: 10.3322/caac.21262. [DOI] [PubMed] [Google Scholar]
- 4.Hensing, T., Chawla, A., Batra, R. & Salgia, R. In Systems Analysis of Human Multigene Disorders (eds Natalia Maltsev, Andrey Rzhetsky & T. Conrad Gilliam) 85–117 (Springer New York, 2014). [DOI] [PubMed]
- 5.Wang H, et al. Semiquantitative Computed Tomography Characteristics for Lung Adenocarcinoma and Their Association With Lung Cancer Survival. Clinical Lung Cancer. 2015;16:e141–e163. doi: 10.1016/j.cllc.2015.05.007. [DOI] [PMC free article] [PubMed] [Google Scholar]
- 6.Kuriyama K, et al. CT-pathologic correlation in small peripheral lung cancers. American Journal of Roentgenology. 1987;149:1139–1143. doi: 10.2214/ajr.149.6.1139. [DOI] [PubMed] [Google Scholar]
- 7.Zwirewich CV, Vedal S, Miller RR, Müller NL. Solitary pulmonary nodule: high-resolution CT and radiologic-pathologic correlation. Radiology. 1991;179:469–476. doi: 10.1148/radiology.179.2.2014294. [DOI] [PubMed] [Google Scholar]
- 8.Winer-Muram HT. The Solitary Pulmonary Nodule. Radiology. 2006;239:34–49. doi: 10.1148/radiol.2391050343. [DOI] [PubMed] [Google Scholar]
- 9.Onn A, et al. Tumor Cavitation in Stage I Non–Small Cell Lung Cancer: Epidermal Growth Factor Receptor Expression and Prediction of Poor Outcome. Radiology. 2005;237:342–347. doi: 10.1148/radiol.2371041650. [DOI] [PubMed] [Google Scholar]
- 10.Lee HY, Lee KS. Ground-glass Opacity Nodules: Histopathology, Imaging Evaluation, and Clinical Implications. Journal of Thoracic Imaging. 2011;26:106–118. doi: 10.1097/RTI.0b013e3181fbaa64. [DOI] [PubMed] [Google Scholar]
- 11.Wang H, et al. Association Between Computed Tomographic Features and Kirsten Rat Sarcoma Viral Oncogene Mutations in Patients With Stage I Lung Adenocarcinoma and Their Prognostic Value. Clinical Lung Cancer. 2016;17:271–278. doi: 10.1016/j.cllc.2015.11.002. [DOI] [PMC free article] [PubMed] [Google Scholar]
- 12.Jeong YJ, et al. Does CT of Thymic Epithelial Tumors Enable Us to Differentiate Histologic Subtypes and Predict Prognosis? American Journal of Roentgenology. 2004;183:283–289. doi: 10.2214/ajr.183.2.1830283. [DOI] [PubMed] [Google Scholar]
- 13.Takashima S, et al. Prognostic significance of high-resolution CT findings in small peripheral adenocarcinoma of the lung: a retrospective study on 64 patients. Lung Cancer. 2002;36:289–295. doi: 10.1016/S0169-5002(01)00489-5. [DOI] [PubMed] [Google Scholar]
- 14.Park J, et al. Anaplastic lymphoma kinase gene rearrangements in patients with advanced-stage non-small-cell lung cancer: CT characteristics and response to chemotherapy. Cancer Medicine. 2014;3:118–123. doi: 10.1002/cam4.172. [DOI] [PMC free article] [PubMed] [Google Scholar]
- 15.Nishino M, Hatabu H, Johnson BE, McLoud TC. State of the Art: Response Assessment in Lung Cancer in the Era of Genomic Medicine. Radiology. 2014;271:6–27. doi: 10.1148/radiol.14122524. [DOI] [PMC free article] [PubMed] [Google Scholar]
- 16.Lee H-J, et al. Epidermal Growth Factor Receptor Mutation in Lung Adenocarcinomas: Relationship with CT Characteristics and Histologic Subtypes. Radiology. 2013;268:254–264. doi: 10.1148/radiol.13112553. [DOI] [PubMed] [Google Scholar]
- 17.Wang H, et al. Clinical and CT characteristics of surgically resected lung adenocarcinomas harboring ALK rearrangements or EGFR mutations. European Journal of Radiology. 2016;85:1934–1940. doi: 10.1016/j.ejrad.2016.08.023. [DOI] [PMC free article] [PubMed] [Google Scholar]
- 18.Liu Y, et al. CT Features Associated with Epidermal Growth Factor Receptor Mutation Status in Patients with Lung Adenocarcinoma. Radiology. 2016;280:271–280. doi: 10.1148/radiol.2016151455. [DOI] [PMC free article] [PubMed] [Google Scholar]
- 19.Aerts HJWL, et al. Decoding tumour phenotype by noninvasive imaging using a quantitative radiomics approach. Nat Commun. 2014;5:4006. doi: 10.1038/ncomms5006. [DOI] [PMC free article] [PubMed] [Google Scholar]
- 20.Cook GR, et al. Radiomics in PET: principles and applications. Clinical and Translational Imaging. 2014;2:269–276. doi: 10.1007/s40336-014-0064-0. [DOI] [Google Scholar]
- 21.Chicklore S, et al. Quantifying tumour heterogeneity in 18F-FDG PET/CT imaging by texture analysis. European Journal of Nuclear Medicine and Molecular Imaging. 2013;40:133–140. doi: 10.1007/s00259-012-2247-0. [DOI] [PubMed] [Google Scholar]
- 22.Hatt, M. et al. Characterization of PET/CT images using texture analysis: the past, the present… any future? European Journal of Nuclear Medicine and Molecular Imaging 1–15, doi:10.1007/s00259-016-3427-0 (2016). [DOI] [PMC free article] [PubMed]
- 23.Yip SFS, Aerts JWLH. Applications and limitations of radiomics. Physics in Medicine and Biology. 2016;61:R150. doi: 10.1088/0031-9155/61/13/R150. [DOI] [PMC free article] [PubMed] [Google Scholar]
- 24.Aerts, H. L. The potential of radiomic-based phenotyping in precision medicine: A review. JAMA Oncology, doi:10.1001/jamaoncol.2016.2631 (2016). [DOI] [PubMed]
- 25.Parmar, C. et al. Radiomic feature clusters and Prognostic Signatures specific for Lung and Head & Neck cancer. Scientific Reports5, 11044, doi:10.1038/srep11044, http://www.nature.com/articles/srep11044#supplementary-information (2015). [DOI] [PMC free article] [PubMed]
- 26.Cook GJR, et al. Are Pretreatment 18F-FDG PET Tumor Textural Features in Non–Small Cell Lung Cancer Associated with Response and Survival After Chemoradiotherapy? Journal of Nuclear Medicine. 2013;54:19–26. doi: 10.2967/jnumed.112.107375. [DOI] [PubMed] [Google Scholar]
- 27.Ng F, Ganeshan B, Kozarski R, Miles KA, Goh V. Assessment of Primary Colorectal Cancer Heterogeneity by Using Whole-Tumor Texture Analysis: Contrast-enhanced CT Texture as a Biomarker of 5-year Survival. Radiology. 2013;266:177–184. doi: 10.1148/radiol.12120254. [DOI] [PubMed] [Google Scholar]
- 28.Coroller TP, et al. CT-based radiomic signature predicts distant metastasis in lung adenocarcinoma. Radiotherapy and Oncology. 2015;114:345–350. doi: 10.1016/j.radonc.2015.02.015. [DOI] [PMC free article] [PubMed] [Google Scholar]
- 29.Huynh, E. et al. CT-based radiomic analysis of stereotactic body radiation therapy patients with lung cancer. Radiotherapy and Oncology in press, doi:10.1016/j.radonc.2016.05.024 (2016). [DOI] [PubMed]
- 30.Wu, J. et al. Early-Stage Non–Small Cell Lung Cancer: Quantitative Imaging Characteristics of 18F Fluorodeoxyglucose PET/CT Allow Prediction of Distant Metastasis. Radiology0, 151829, doi:10.1148/radiol.2016151829. [DOI] [PMC free article] [PubMed]
- 31.Coroller TP, et al. Radiomic phenotype features predict pathological response in non-small cell lung cancer. Radiotherapy and Oncology. 2016;119:480–486. doi: 10.1016/j.radonc.2016.04.004. [DOI] [PMC free article] [PubMed] [Google Scholar]
- 32.Goh V, et al. Assessment of Response to Tyrosine Kinase Inhibitors in Metastatic Renal Cell Cancer: CT Texture as a Predictive Biomarker. Radiology. 2011;261:165–171. doi: 10.1148/radiol.11110264. [DOI] [PubMed] [Google Scholar]
- 33.Yip, S. S. F. et al. Relationship between the Temporal Changes in Positron-Emission-Tomography-Imaging-Based Textural Features and Pathologic Response and Survival in Esophageal Cancer Patients. Frontiers in Oncology6, doi:10.3389/fonc.2016.00072 (2016). [DOI] [PMC free article] [PubMed]
- 34.Liu Y, et al. Radiomic Features Are Associated With EGFR Mutation Status in Lung Adenocarcinomas. Clinical Lung Cancer. 2016;17:441–448. doi: 10.1016/j.cllc.2016.02.001. [DOI] [PMC free article] [PubMed] [Google Scholar]
- 35.Yoon HJ, et al. Decoding Tumor Phenotypes for ALK, ROS1, and RET Fusions in Lung Adenocarcinoma Using a Radiomics Approach. Medicine. 2015;94:e1753. doi: 10.1097/MD.0000000000001753. [DOI] [PMC free article] [PubMed] [Google Scholar]
- 36.Yip, S. S. F. et al. Associations between somatic mutations and metabolic imaging phenotypes in non-small cell lung cancer. Journal of Nuclear Medicine (2016). [DOI] [PMC free article] [PubMed]
- 37.Gillies RJ, Kinahan PE, Hricak H. Radiomics: Images Are More than Pictures, They Are Data. Radiology. 2016;278:563–577. doi: 10.1148/radiol.2015151169. [DOI] [PMC free article] [PubMed] [Google Scholar]
- 38.Aoki T, et al. Peripheral Lung Adenocarcinoma: Correlation of Thin-Section CT Findings with Histologic Prognostic Factors and Survival. Radiology. 2001;220:803–809. doi: 10.1148/radiol.2203001701. [DOI] [PubMed] [Google Scholar]
- 39.Lee SM, et al. Invasive Pulmonary Adenocarcinomas versus Preinvasive Lesions Appearing as Ground-Glass Nodules: Differentiation by Using CT Features. Radiology. 2013;268:265–273. doi: 10.1148/radiol.13120949. [DOI] [PubMed] [Google Scholar]
- 40.Gardiner N, Jogai S, Wallis A. The revised lung adenocarcinoma classification—an imaging guide. Journal of Thoracic Disease. 2014;6:S537–S546. doi: 10.3978/j.issn.2072-1439.2014.04.05. [DOI] [PMC free article] [PubMed] [Google Scholar]
- 41.Tang ER, Schreiner AM, Pua BB. Advances in lung adenocarcinoma classification: a summary of the new international multidisciplinary classification system (IASLC/ATS/ERS) Journal of Thoracic Disease. 2014;6:S489–S501. doi: 10.3978/j.issn.2072-1439.2014.09.12. [DOI] [PMC free article] [PubMed] [Google Scholar]
- 42.Lederlin M, et al. Correlation of radio- and histomorphological pattern of pulmonary adenocarcinoma. European Respiratory Journal. 2013;41:943–951. doi: 10.1183/09031936.00056612. [DOI] [PubMed] [Google Scholar]
- 43.Kojima Y, et al. Correlations of Thin-Section Computed Tomographic, Histopathological, and Clinical Findings of Adenocarcinoma With a Bubblelike Appearance. Journal of Computer Assisted Tomography. 2010;34:413–417. doi: 10.1097/RCT.0b013e3181d275b6. [DOI] [PubMed] [Google Scholar]
- 44.Honda T, et al. Radiographic and pathological analysis of small lung adenocarcinoma using the new IASLC classification. Clinical Radiology. 2013;68:e21–e26. doi: 10.1016/j.crad.2012.09.002. [DOI] [PubMed] [Google Scholar]
- 45.Wu Z, et al. Identification of Calcification with Magnetic Resonance Imaging Using Susceptibility-Weighted Imaging: A Case Study. Journal of magnetic resonance imaging: JMRI. 2009;29:177–182. doi: 10.1002/jmri.21617. [DOI] [PMC free article] [PubMed] [Google Scholar]
- 46.Go JL, Zee CS. Unique CT imaging advantages. Hemorrhage and calcification. Neuroimaging clinics of North America. 1998;8:541–558. [PubMed] [Google Scholar]
- 47.Xu DM, et al. Limited value of shape, margin and CT density in the discrimination between benign and malignant screen detected solid pulmonary nodules of the NELSON trial. European Journal of Radiology. 2008;68:347–352. doi: 10.1016/j.ejrad.2007.08.027. [DOI] [PubMed] [Google Scholar]
- 48.Austin JH, et al. Glossary of terms for CT of the lungs: recommendations of the Nomenclature Committee of the Fleischner Society. Radiology. 1996;200:327–331. doi: 10.1148/radiology.200.2.8685321. [DOI] [PubMed] [Google Scholar]
- 49.Fan L, Liu SY, Li QC, Yu H, Xiao XS. Multidetector CT features of pulmonary focal ground-glass opacity: differences between benign and malignant. The British Journal of Radiology. 2012;85:897–904. doi: 10.1259/bjr/33150223. [DOI] [PMC free article] [PubMed] [Google Scholar]
- 50.Ohde Y, et al. The proportion of consolidation to ground-glass opacity on high resolution CT is a good predictor for distinguishing the population of non-invasive peripheral adenocarcinoma. Lung Cancer. 2003;42:303–310. doi: 10.1016/j.lungcan.2003.07.001. [DOI] [PubMed] [Google Scholar]
- 51.Soh LK, Tsatsoulis C. Texture analysis of SAR sea ice imagery using gray level co-occurrence matrices. IEEE Transactions on Geoscience and Remote Sensing. 1999;37:780–795. doi: 10.1109/36.752194. [DOI] [Google Scholar]
- 52.Albregtsen, F. Statistical texture measures computed from gray level coocurrence matrices. Image processing laboratory, department of informatics, university of oslo5 (2008).
- 53.Gill RR, Matsusoka S, Hatabu H. Cavities in the lung in oncology patients: imaging overview and differential diagnoses. Applied Radiology. 2010;39:10. [Google Scholar]
- 54.Chaudhuri MR. Primary pulmonary cavitating carcinomas. Thorax. 1973;28:354–366. doi: 10.1136/thx.28.3.354. [DOI] [PMC free article] [PubMed] [Google Scholar]
- 55.Drew T, Vo MLH, Wolfe JM. “The invisible gorilla strikes again: Sustained inattentional blindness in expert observers”. Psychological science. 2013;24:1848–1853. doi: 10.1177/0956797613479386. [DOI] [PMC free article] [PubMed] [Google Scholar]
- 56.Lum TE, Fairbanks RJ, Pennington EC, Zwemer FL. Profiles in Patient Safety: Misplaced Femoral Line Guidewire and Multiple Failures to Detect the Foreign Body on Chest Radiography. Academic Emergency Medicine. 2005;12:658–662. doi: 10.1111/j.1553-2712.2005.tb00924.x. [DOI] [PubMed] [Google Scholar]
- 57.Davnall F, et al. Assessment of tumor heterogeneity: an emerging imaging tool for clinical practice? Insights into Imaging. 2012;3:573–589. doi: 10.1007/s13244-012-0196-6. [DOI] [PMC free article] [PubMed] [Google Scholar]
- 58.Castellano G, Bonilha L, Li LM, Cendes F. Texture analysis of medical images. Clinical Radiology. 2004;59:1061–1069. doi: 10.1016/j.crad.2004.07.008. [DOI] [PubMed] [Google Scholar]
- 59.Kassner A, Thornhill RE. Texture Analysis: A Review of Neurologic MR Imaging Applications. American Journal of Neuroradiology. 2010;31:809–816. doi: 10.3174/ajnr.A2061. [DOI] [PMC free article] [PubMed] [Google Scholar]
- 60.He, L. et al. Effects of contrast-enhancement, reconstruction slice thickness and convolution kernel on the diagnostic performance of radiomics signature in solitary pulmonary nodule. Scientific Reports6, 34921, doi:10.1038/srep34921, http://www.nature.com/articles/srep34921#supplementary-information (2016). [DOI] [PMC free article] [PubMed]
- 61.Gu Y, et al. Automated delineation of lung tumors from CT images using a single click ensemble segmentation approach. Pattern Recognition. 2013;46:692–702. doi: 10.1016/j.patcog.2012.10.005. [DOI] [PMC free article] [PubMed] [Google Scholar]
- 62.Bendtsen C, et al. X-Ray Computed Tomography: Semiautomated Volumetric Analysis of Late-Stage Lung Tumors as a Basis for Response Assessments. International Journal of Biomedical Imaging. 2011;2011:11. doi: 10.1155/2011/361589. [DOI] [PMC free article] [PubMed] [Google Scholar]
- 63.Rios Velazquez E, et al. A semiautomatic CT-based ensemble segmentation of lung tumors: Comparison with oncologists’ delineations and with the surgical specimen. Radiotherapy and Oncology. 2012;105:167–173. doi: 10.1016/j.radonc.2012.09.023. [DOI] [PMC free article] [PubMed] [Google Scholar]
- 64.Martin B, Johannes Z, Colin GB. Automated Analysis and Detailed Quantification of Biomedical Images Using Definiens Cognition Network Technology®. Combinatorial Chemistry & High Throughput Screening. 2009;12:908–916. doi: 10.2174/138620709789383196. [DOI] [PubMed] [Google Scholar]
- 65.Ganeshan, B. & Miles, K. A. Quantifying tumour heterogeneity with CT. Cancer imaging: the official publication of the International Cancer Imaging Society13, 140–149, http://europepmc.org/abstract/MED/23545171; http://europepmc.org/articles/PMC3613789?pdf=render; http://europepmc.org/articles/PMC3613789; doi:10.1102/1470-7330.2013.0015 (2013). [DOI] [PMC free article] [PubMed]
- 66.Kuhn, M. A Short Introduction to the caret Package (2015).
- 67.Gentleman RC, et al. Bioconductor: open software development for computational biology and bioinformatics. Genome Biology. 2004;5:R80–R80. doi: 10.1186/gb-2004-5-10-r80. [DOI] [PMC free article] [PubMed] [Google Scholar]
- 68.Vanagas G. Receiver operating characteristic curves and comparison of cardiac surgery risk stratification systems. Interactive CardioVascular and Thoracic Surgery. 2004;3:319–322. doi: 10.1016/j.icvts.2004.01.008. [DOI] [PubMed] [Google Scholar]
- 69.Amaral JLM, Lopes AJ, Jansen JM, Faria ACD, Melo PL. An improved method of early diagnosis of smoking-induced respiratory changes using machine learning algorithms. Computer Methods and Programs in Biomedicine. 2013;112:441–454. doi: 10.1016/j.cmpb.2013.08.004. [DOI] [PubMed] [Google Scholar]
- 70.Mukaka MM. A guide to appropriate use of Correlation coefficient in medical research. Malawi Medical Journal: The Journal of Medical Association of Malawi. 2012;24:69–71. [PMC free article] [PubMed] [Google Scholar]
- 71.Benjamini Y, Hochberg Y. Controlling the False Discovery Rate: A Practical and Powerful Approach to Multiple Testing. Journal of the Royal Statistical Society. Series B (Methodological) 1995;57:11. [Google Scholar]
Associated Data
This section collects any data citations, data availability statements, or supplementary materials included in this article.