Abstract
Key points
At the cellular level cardiac hypertrophy causes remodelling, leading to changes in ionic channel, pump and exchanger densities and kinetics.
Previous studies have focused on quantifying changes in channels, pumps and exchangers without quantitatively linking these changes with emergent cellular scale functionality.
Two biophysical cardiac cell models were created, parameterized and validated and are able to simulate electrophysiology and calcium dynamics in myocytes from control sham operated rats and aortic‐banded rats exhibiting diastolic dysfunction.
The contribution of each ionic pathway to the calcium kinetics was calculated, identifying the L‐type Ca2+ channel and sarco/endoplasmic reticulum Ca2+ATPase as the principal regulators of systolic and diastolic Ca2+, respectively.
Results show that the ability to dynamically change systolic Ca2+, through changes in expression of key Ca2+ modelling protein densities, is drastically reduced following the aortic banding procedure; however the cells are able to compensate Ca2+ homeostasis in an efficient way to minimize systolic dysfunction.
Abstract
Elevated left ventricular afterload leads to myocardial hypertrophy, diastolic dysfunction, cellular remodelling and compromised calcium dynamics. At the cellular scale this remodelling of the ionic channels, pumps and exchangers gives rise to changes in the Ca2+ transient. However, the relative roles of the underlying subcellular processes and the positive or negative impact of each remodelling mechanism are not fully understood. Biophysical cardiac cell models were created to simulate electrophysiology and calcium dynamics in myocytes from control rats (SHAM) and aortic‐banded rats exhibiting diastolic dysfunction. The model parameters and framework were validated and the fitted parameters demonstrated to be unique for explaining our experimental data. The contribution of each ionic pathway to the calcium kinetics was calculated, identifying the L‐type Ca2+ channel (LCC) and the sarco/endoplasmic reticulum Ca2+‐ATPase (SERCA) as the principal regulators of systolic and diastolic Ca2+, respectively. In the aortic banding model, the sensitivity of systolic Ca2+ to LCC density and diastolic Ca2+ to SERCA density decreased by 16‐fold and increased by 23%, respectively, relative to the SHAM model. The energy cost of ionic homeostasis is maintained across the two models. The models predict that changes in ionic pathway densities in compensated aortic banding rats maintain Ca2+ function and efficiency. The ability to dynamically alter systolic function is significantly diminished, while the capacity to maintain diastolic Ca2+ is moderately increased.
Keywords: calcium dynamics, cardiac electrophysiology, cell biology, computational modelling, diastolic dysfunction, gene expression, hypertrophy, rat
Key points
At the cellular level cardiac hypertrophy causes remodelling, leading to changes in ionic channel, pump and exchanger densities and kinetics.
Previous studies have focused on quantifying changes in channels, pumps and exchangers without quantitatively linking these changes with emergent cellular scale functionality.
Two biophysical cardiac cell models were created, parameterized and validated and are able to simulate electrophysiology and calcium dynamics in myocytes from control sham operated rats and aortic‐banded rats exhibiting diastolic dysfunction.
The contribution of each ionic pathway to the calcium kinetics was calculated, identifying the L‐type Ca2+ channel and sarco/endoplasmic reticulum Ca2+ATPase as the principal regulators of systolic and diastolic Ca2+, respectively.
Results show that the ability to dynamically change systolic Ca2+, through changes in expression of key Ca2+ modelling protein densities, is drastically reduced following the aortic banding procedure; however the cells are able to compensate Ca2+ homeostasis in an efficient way to minimize systolic dysfunction.
Abbreviations
- AB
aortic banding
- AP
action potential
- Caamp
Calcium amplitude
- CaB
background Ca2+
- DCa
diastolic Ca2+ concentration
- HF
heart failure
- LCC
L‐type Ca2+ channel
- NCX
Na+/Ca2+ exchanger
- PCa
peak Ca2+ concentration
- PMCa
plasma membrane Ca2+‐ATPase
- RyR
ryanodine receptor
- SERCA
sarco/endoplasmic reticulum Ca2+‐ATPase
- SR
sarcoplasmic reticulum
Introduction
Heart failure (HF) due to left ventricular pressure overload following aortic stenosis or hypertension, remains a serious public health problem, associated with high morbidity and mortality (Drazner, 2011). It is commonly believed that cardiac hypertrophy develops in response to increased left ventricular afterload. This increased pressure, in turn, generates increased load on the myocardial wall and leads to tissue and cellular remodelling. In hypertensive patients these changes initially manifest as diastolic dysfunction, proceeding the development of hypertrophy (Aeschbacher et al. 2001) and are associated with increased systolic function in hypertensive animal models (Cingolani et al. 2003). At the cellular scale, elevated pressure results in changes in the excitation–contraction system, perturbing the pathways central to the transduction of the electrical signal into mechanical function.
In the heart, the role of Ca2+ is fundamentally important for transmitting this electrical timing signal into mechanic contraction. During each heartbeat, an electrical wave of depolarization spreads rapidly through the myocardium inducing an intracellular Ca2+ influx through the voltage dependent L‐type Ca2+ channels (LCCs) (Hobai & Levi, 1999) triggering the release of more Ca2+ from ryanodine receptors (RyRs) in the sarcoplasmic reticulum (SR) (Fabiato & Fabiato, 1979; Sham et al. 1995). This resultant increase in cytosolic Ca2+ concentration induces contraction at the level of the myofilaments. During relaxation, the diastolic Ca2+ level is restored by the sarco/endoplasmic reticulum Ca2+‐ATPase (SERCA), driving Ca2+ back to the SR and the Na2+/Ca2+ exchanger (NCX) and the sarcolemma Ca2+‐ATPase (PMCa) extruding Ca2+ out of the cell.
The use of experimental animal models of left ventricular pressure overload, such as the aortic banding (AB) procedure (Litwin et al. 1995; deAlmeida et al. 2010), has allowed us to quantitatively characterize changes in Ca2+ channels, exchangers and pumps during the development of cardiac hypertrophy in rats. In particular, previous studies have reported the L‐type Ca2+ channel flux (Keung, 1989; Xiao & Mcardle, 1994; Momtaz et al. 1996; Shorofsky et al. 1999), the SERCA Ca2+ uptake (Feldman et al. 1993; Studer et al. 1994; Movsesian & Schwinger, 1998; Miyamoto et al. 2000), the SR function (Hasenfuss, 1998; Movsesian & Schwinger, 1998), the peak and amplitude of the calcium transients (Bing et al. 1991; Siri et al. 1991; Bailey & Houser, 1992; Beuckelmann et al. 1992) and the duration of the electrical action potential (AP) (Scamps et al. 1990; Beuckelmann et al. 1992; Meszaros et al. 1996; Wickenden et al. 1998; Tomaselli, 1999) to be altered during the progression of hypertrophy. However, instead of investigating integrated cardiac function, these studies have typically focused on the expression of single proteins in isolation by recording measurements from cellular phenotypes without making a direct link to the integrated physiology. These measurements are further confounded by the variation in duration and degree of pressure overload resulting in a spectrum of compensated and decompensated response and limiting comparison across studies. Furthermore, despite this work the complex role of changes in Ca2+ handling in cardiac hypertrophy remains poorly understood. Specifically, investigations to date have not sought to distinguish between changes that could be considered to be beneficial (compensatory) or detrimental (decompensatory) for maintaining cardiac function. This is essential for identifying the proteins that derive detrimental mechanisms and manipulate them to maintain their regular levels.
To address these issues, this study adopts a computational modelling based approach to quantify the relative role of each of the key changes in protein density and kinetics in cardiac myocyte Ca2+ phenotypes. To study compensation under elevated ventricular pressure, models are based on experimental recordings from Røe et al. (2017), conducted in a focused selection of animals that exhibit maintained systolic function yet diastolic dysfunction 6 weeks post‐AB. A full description of the in vivo phenotype including representative MRI pictures and echocardiographic M‐mode recordings is provided in Fig. 1 and Table 1 of Røe et al. (2017). Røe et al. highlight the role of elevated collagen content and post‐translational modifications in titin that result in increased passive stiffness and organ‐scale diastolic dysfunction. Here we focus on changes in Ca2+ that explain the maintenance of Ca2+ homeostasis. Firstly, an integrated model of the rat calcium dynamics, fitted to consistent experimental data in both SHAM and AB rats at physiological frequency and temperature is derived. Secondly, to demonstrate that it provides an efficient framework for analysing the mechanisms controlling Ca2+ handling in both the SHAM and the AB rat cardiac myocytes, the model parameters and framework are validated. Lastly, a sensitivity analysis is performed to show that the ability of the system to dynamically change systolic Ca2+ is drastically reduced in the compensated AB case compared with the SHAM case and the principal compensatory mechanism is an increase in the SERCA protein, which operates to maintain low diastolic Ca2+ levels (DCa) at the expenses of systolic Ca2+.
Figure 1. Calcium fitting results.
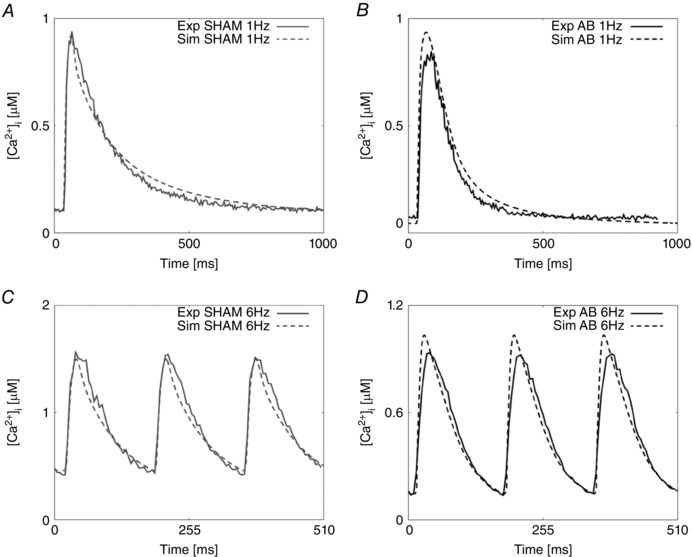
A, experimental representative Ca2+ transient for the SHAM case at 1 Hz (continuous grey line) and Ca2+ fitted transient (dashed grey line). B, experimental representative Ca2+ transient for the AB case at 1 Hz (continuous black line) and Ca2+ fitted transient (dashed black line). C, experimental representative Ca2+ transient for the SHAM case at 6 Hz (continuous grey line) and Ca2+ fitted transient (dashed grey line). D, experimental representative Ca2+ transient for the AB case at 6 Hz (continuous black line) and Ca2+ fitted transient (dashed black line).
Table 1.
Experimentally measured, representative traces (Rep) and simulated Ca2+ metrics in both the SHAM and AB cases at 1 and 6 Hz
| Metric | Unit | Type | Frequency | Mean | σ | Rep trace | Simulated |
|---|---|---|---|---|---|---|---|
| PCa | μm | SHAM | 1 Hz | 1.000 | 0.065 | 0.940 | 0.915 |
| 6 Hz | 1.595 | 0.111 | 1.562 | 1.498 | |||
| AB | 1 Hz | 0.765 | 0.065 | 0.8468 | 0.940 | ||
| 6 Hz | 0.828 | 0.077 | 0.9345 | 1.048 | |||
| RT50 | ms | SHAM | 1 Hz | 137 | 28.8 | 135 | 130 |
| 6 Hz | 63 | 6.4 | 70 | 63 | |||
| AB | 1 Hz | 87 | 15.9 | 112 | 121 | ||
| 6 Hz | 57 | 6.9 | 80 | 63 | |||
| DCa | μm | SHAM | 1 Hz | 0.100 | 0 | 0.096 | 0.110 |
| 6 Hz | 0.374 | 0.033 | 0.419 | 0.458 | |||
| AB | 1 Hz | 0.064 | 0 | 0.056 | 0.045 | ||
| 6 Hz | 0.140 | 0.011 | 0.139 | 0.147 | |||
| Caamp | μm | SHAM | 1 Hz | 0.900 | 0.065 | 0.844 | 0.805 |
| 6 Hz | 1.221 | 0.111 | 1.143 | 1.490 | |||
| AB | 1 Hz | 0.701 | 0.065 | 0.791 | 0.895 | ||
| 6 Hz | 0.688 | 0.077 | 0.795 | 0.901 | |||
| APD90 | ms | SHAM | 1 Hz | 75 | 10 | 72 | 56 |
| 6 Hz | 55 | 14 | 63 | 47 | |||
| AB | 1 Hz | 143 | 13 | 147 | 166 | ||
| 6 Hz | 84 | 35 | 126 | 93 |
Caamp is the amplitude of the calcium transient.
Methods
Model structure and parameter fitting procedure
The model re‐fitting procedure is described in detail in the Appendix. Briefly, using the rat specific framework developed by Gattoni et al. (2016), we parameterized two models representing the SHAM and AB rat cardiomyocytes at both 1 and 6 Hz frequencies at 37°C. In the calcium system we refitted the Na+/Ca2+ exchanger (NCX), Ca2+ pump (PMCa), sarcoplasmic reticulum Ca2+‐ATPase (SERCA), L‐type channel (LCC) and background Ca2+ channel (CaB). NCX and PMCa densities were constrained by Ca2+ transients induced by caffeine exposure following 1 and 6 Hz pacing. These results were then combined with Ca2+ transient measurements at 1 and 6 Hz to fit SERCA to the decay of the field stimulated Ca2+ transients at 1 and 6 Hz. The Ca2+ influx into the cell from the LCCs was fitted using the current–voltage relationship curve. The background Ca2+ current was modified to reproduce the peak of the Ca2+ transients at 1 and 6 Hz. The remaining Na+ and K+ currents were constrained using literature data to achieve a prolonged action potential duration commonly found in both human heart failure and in animal models of cardiac hypertrophy. The effect of EGTA in patched pipettes was modelled by setting [EGTA] = 0 mm and 0.6 mm in Ca2+ transient and AP experiment simulations, respectively.
Validation
To test the resulting parameters for both the SHAM and AB rat models we performed a comprehensive model validation study. A schematic representation of the validation process is shown in Fig. 9 of the Appendix. As outlined in ‘Model structure and parameter fitting procedure’ above, we created parameter sets that represent the kinetics of SERCA, LCC and NCX in the SHAM and the AB state. To validate these parameter sets we made nine test models starting with the SHAM model. The test models were developed to observe the effects of single or groups of protein changes on the Ca2+ dynamics. In three test models we introduced the AB NCX, LCC or SERCA model with all other parameters kept at the SHAM values (LCC, NCX, SERCA). In three additional models we introduced pairs of LCC, NCX and SERCA AB models into the SHAM rat model (LCC–SERCA, NCX–SERCA, LCC–NCX) and finally we introduced NCX, LCC and SERCA AB models into the SHAM model (LCC–SERCA–NCX). We created two further models. The first started with the SHAM model and included SERCA, NCX and LCC AB models with the changes in K+ and Na+ channels from the AB model (LCC–SERCA–NCX–K–Na). The second was the same as the previous model but also included the background Ca2+ current parameters from the parameters used in the AB model. These nine models were simulated at 1 and 6 Hz giving a total of 18 simulated Ca2+ and AP transients. For each of these 18 models we performed graded changes in 17 of the main protein parameters regulating the electrophysiology currents: g SERCA: conductivity of the SERCA pump; K SERCA: half‐inactivation constant of the SERCA pump; J L: permeability of the L‐type channel; J R: permeability of the RyR; g CaB: conductivity of the background Ca2+ current; g SRl: conductivity of the SR leak; g t: conductivity of the transient outward potassium current; g NCX: conductivity of the Na+/Ca2+ exchanger; g pCa: conductivity of the Ca2+ pump; g BK: conductivity of the background K+ current; g BNa: conductivity of the background Na+ current; g K1: conductivity of the inward potassium current; g Na: conductivity of the Na+ current; g ss: conductivity of the steady state potassium current; NaKmax: conductivity of the Na+/K+ exchanger; B CMDN: calmodulin concentration; and B TRPN: troponin concentration. Each parameter x was perturbed in the range log10(x new) ∈ [−1,1], where x new is the parameter value used for a generic simulation and x Base is the fitted parameter value (in this way −1 corresponds to 10% of the control parameter and 1 corresponds to a 10‐fold increase). All developed models, representing 5814 parameter combinations were run to their limit cycle. For each model we identified how many of experimental phenotypes (peak calcium concentration (PCa), DCa, relaxation time at 50% decay (RT50) and time to peak Ca2+ (T peak)) the model matched and we ranked models based on this number (1–4). A parameter combination is defined ‘viable’ if the considered simulated phenotype value falls within a 20% range of the experimental phenotype value (see Appendix, ‘Validation method and tables’).
Figure 9. Schematic representation of the validation method.
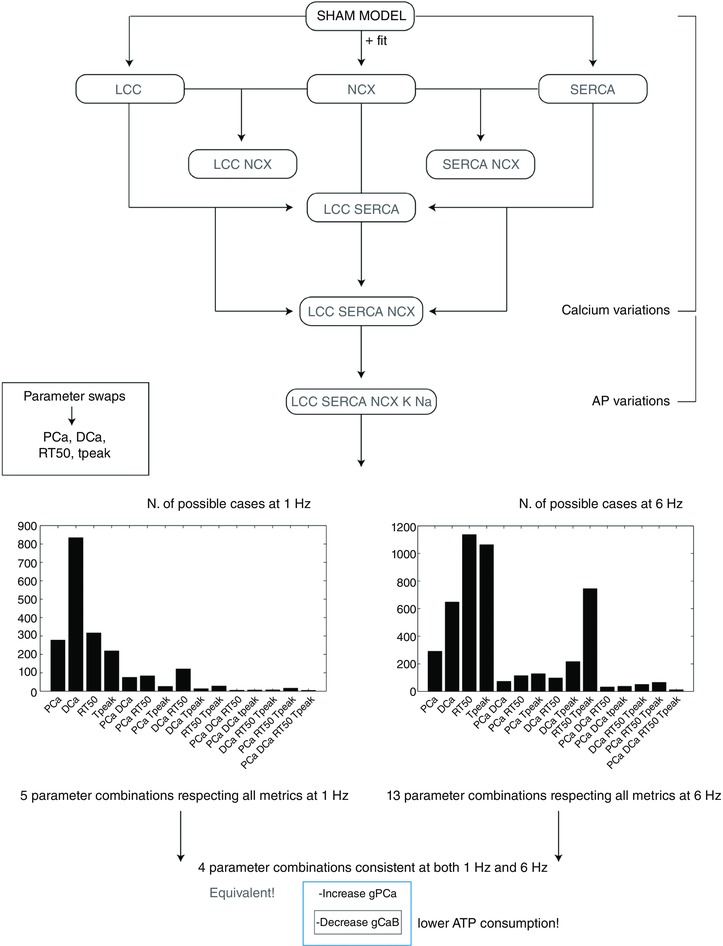
Starting from the SHAM model at 1 Hz we have developed nine models by introducing single fittings for LCC, SERCA and NCX (3 models), combination of those (4 models) and all the fittings plus changes in K+ and Na+ channels (1 model) and K+, Na+ and CaB channels (1 model). For each of the nine models we have then performed parameter swaps of the most important protein parameters: g SERCA, K SERCA, J L, J R, g CaB, g SRl, g t, g NCX, g pCa, g BK, g BNa, g K1, g Na, g ss, NaKmax, B CMDN and B TRPN. The same process was repeated at 6 Hz. All developed models, representing 5814 parameter combinations (18 models × 17 parameters × 19 values) were run to steady state. For each model we have recorded PCa, DCa, RT50 and T peak. Ultimately, we have observed the number of combinations for which simulated PCa, DCa, RT50 and DCa fall within 20% variability of those four experimentally measured metrics. [Color figure can be viewed at wileyonlinelibrary.com]
Sensitivity analysis
The sensitivity of four calcium transient phenotypes, PCa, DCa, RT50 and T peak, were calculated for 11 protein densities: g SERCA, K SERCA, g CaB, g t, g K1, g Na, g ss, V L (potential when half LCC channels are open), K L (concentration at LCC inactivation), J L, and g NCX. The sensitivity values were calculated with a 1% change in the protein density for both the SHAM and AB models’ proteins at 6 Hz, using the equation:
where p 1 is the new parameter (increased by 1% from the fitted parameter), p 0 is the fitted parameter, is the tested phenotype value evaluated in the new parameter p 1, and is the tested phenotype value evaluated in the fitted parameter p 0.
Results
Fitting models of SHAM and AB at 1 and 6 Hz
Fig. 1 and 2 show the experimental and simulated Ca2+ and AP traces for the SHAM and AB models at 1 and 6 Hz. At 1 Hz, simulated DCa and RT50 in the AB model were reduced by 59% and 7%, respectively, compared with the DCa and RT50 simulated values in the SHAM model and consistent with a decrease of 42% and 17%, respectively, observed experimentally. At the same frequency, simulated PCa was increased by 3% although experimental measurement revealed a 7% decrease. Simulated SR Ca2+ content in the AB model at 1 Hz was increased by 28% compared with the simulated value in the SHAM case and compatible with increased SERCA activity in both experimental and simulated measurements.
Figure 2. AP fitting results.
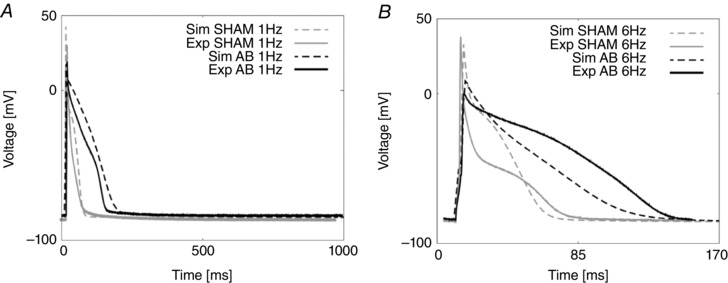
A, experimental and simulated AP traces for the SHAM case (grey) and the AB case (black) at 1 Hz. B, experimental and simulated AP traces for the SHAM case (grey) and the AB case (black) at 6 Hz.
At 6 Hz, simulated DCa in the AB model decreased by 68%, consistent with the experimentally observed 67% decrease. Simulated RT50 in the SHAM model remained unchanged in the AB model with a value of 63 ms, falling within mean experimental measurements of 63 ± 6.4 and 57 ± 7 ms in the SHAM and AB cases, respectively. At the same frequency, simulated PCa in the AB model was decreased by 30% with respect to the simulated value in SHAM model, comparable to a 40% decrease in the experimental data. Simulated SR Ca2+ content in the AB model at 6 Hz was increased by 61% compared with the simulated value in the SHAM model, due to increased SERCA activity. Key Ca2+ characteristics are summarized in Table 1.
We predicted the proportion of Ca2+ extrusion through SERCA, NCX and PCA by evaluating their simulated integrals during one cycle. Results in the SHAM case reveal a ratio of 86.6%, 10% and 3.4%, respectively, at 1 Hz, and 94%, 5% and 1%, respectively, at 6 Hz. Results in the AB case reveal a proportion of 92%, 6.3% and 1.7%, respectively, at 1 Hz and 96.4%, 2.8% and 0.8%, respectively, at 6 Hz. Prolonged duration of the electrical AP is shown in Fig. 2. At the lower pacing frequency of 1 Hz, we predicted pronounced prolongation in late repolarization in the AB model compared with the SHAM model, with the time to 90% repolarization (APD90) increased by 66%, comparable to an increase of 50% in the experimental data. At the higher pacing frequency of 6 Hz, repolarization was faster compared with the same model at 1 Hz and we predicted APD90 to be increased by 50%, comparable with a 50% increase in the experimental data.
Validation
Our model validation tables are represented in Figs 10, 11, 12, 13, 14, 15, 16 in the Appendix. Without considering the trivial viable AB cases, our simulations reveal approximately 28% and 54% viable parameter combinations, respectively, at 1 and 6 Hz, when considering a single calcium phenotype, 6% and 24% when considering two calcium phenotypes and less than 1% (38 combinations) and 3% when considering three calcium phenotypes. When considering all four calcium phenotypes in Fig. 16 of the Appendix, less than 1% (5 combinations) and less than 1% (13 combinations) of the viable parameter combinations are able to match the experimental recordings, respectively, at 1 and 6 Hz. Among these combinations, only four parameter combinations are able to match all four phenotypes at both pacing frequencies and correspond to an increase in Ca2+ pump conductivity g PCa and a decrease in the background current conductivity g CaB . The resulting simulated PCa, DCa, RT50, T peak and Calcium amplitude (Caamp) values for those four parameter combinations produce very similar results, as shown in Table 2. The value we chose for the background Ca2+ conductivity parameter g CaB = falls within the acceptable range.
Figure 10. Single metrics at 1 Hz.
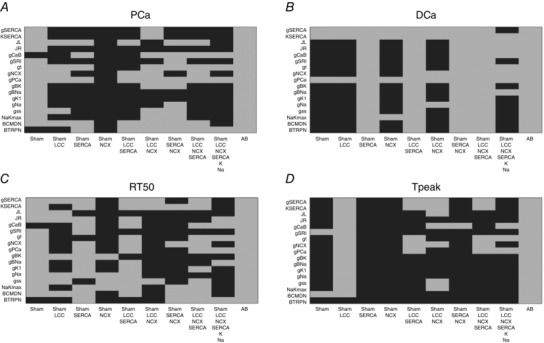
Parameters combinations falling inside (grey) and outside (black) single metrics experimental ranges. A, possible combinations of parameters falling inside a 20% variability range from PCa experimental measurements (grey). B, possible combinations of parameters falling inside a 20% variability range from DCa experimental measurements (grey). C, possible combinations of parameters falling inside a 20% variability range from RT50 experimental measurements (grey). D, possible combinations of parameters falling inside a 20% variability range from T peak experimental measurements (grey).
Figure 11. Metric couples at 1 Hz.
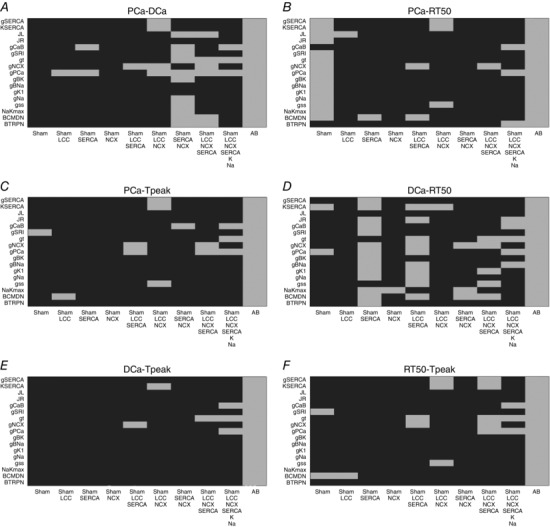
Parameters combinations falling inside (grey) and outside (black) experimental ranges for two metrics. A, possible combinations of parameters falling inside a 20% variability range from PCa and DCa experimental measurements (grey). B, possible combinations of parameters falling inside a 20% variability range from PCa and RT50 experimental measurements (grey). C, possible combinations of parameters falling inside a 20% variability range from PCa and T peak experimental measurements (grey). D, possible combinations of parameters falling inside a 20% variability range from DCa and RT50 experimental measurements (grey). E, possible combinations of parameters falling inside a 20% variability range from DCa and T peak experimental measurements (grey). F, possible combinations of parameters falling inside a 20% variability range from RT50 and T experimental measurements (grey).
Figure 12. Metric triplets at 1 Hz.
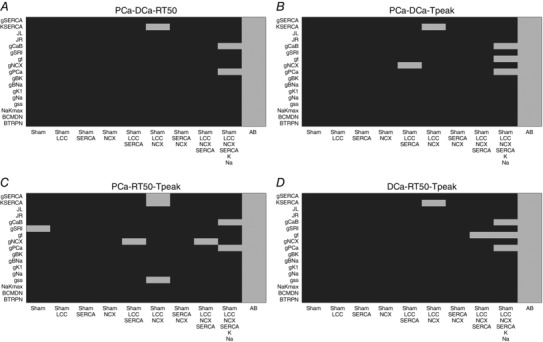
Parameters combinations falling inside (grey) and outside (black) experimental ranges for three metrics. A, possible combinations of parameters falling inside a 20% variability range from PCa, DCa and RT50 experimental measurements (grey). B, possible combinations of parameters falling inside a 20% variability range from PCa DCa and T peak experimental measurements (grey). C, possible combinations of parameters falling inside a 20% variability range from PCa, RT50 and T peak experimental measurements (grey). D, possible combinations of parameters falling inside a 20% variability range from DCa, RT50 and T peak experimental measurements (grey).
Figure 13. Single metrics at 6 Hz.
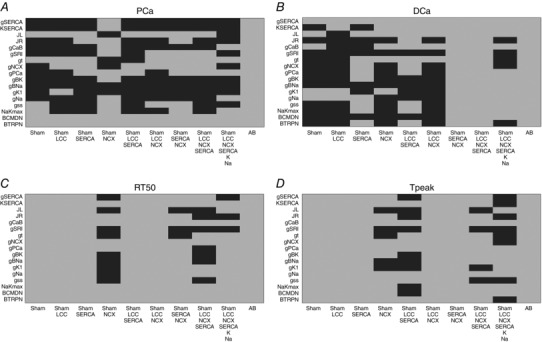
Parameters combinations falling inside (grey) and outside (black) single metrics experimental ranges. A, possible combinations of parameters falling inside a 20% variability range from PCa experimental measurements (grey). B, possible combinations of parameters falling inside a 20% variability range from DCa experimental measurements (grey). C, possible combinations of parameters falling inside a 20% variability range from RT50 experimental measurements (grey). D, possible combinations of parameters falling inside a 20% variability range from T peak experimental measurements (grey).
Figure 14. Metric couples at 6 Hz.
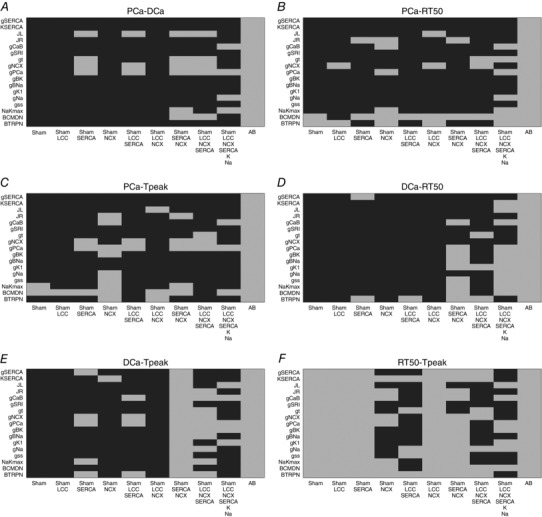
Parameters combinations falling inside (grey) and outside (black) experimental ranges for two metrics. A, possible combinations of parameters falling inside a 20% variability range from PCa and DCa experimental measurements (grey). B, possible combinations of parameters falling inside a 20% variability range from PCa and RT50 experimental measurements (grey). C, possible combinations of parameters falling inside a 20% variability range from PCa and T peak experimental measurements (grey). D, possible combinations of parameters falling inside a 20% variability range from DCa and RT50 experimental measurements (grey). E, possible combinations of parameters falling inside a 20% variability range from DCa and T peak experimental measurements (grey). F, possible combinations of parameters falling inside a 20% variability range from RT50 and T peak experimental measurements (grey).
Figure 15. Metric triplets at 6 Hz.
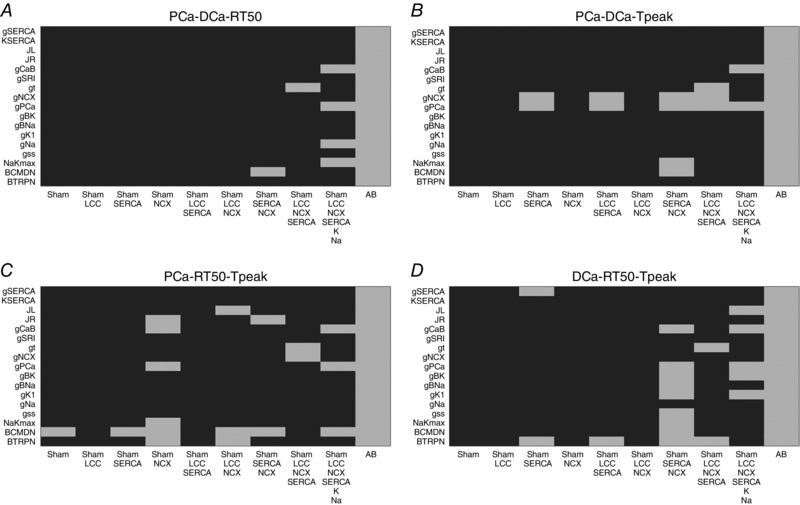
Parameters combinations falling inside (grey) and outside (black) experimental ranges for three metrics. A, possible combinations of parameters falling inside a 20% variability range from PCa, DCa and RT50 experimental measurements (grey). B, possible combinations of parameters falling inside a 20% variability range from PCa DCa and T peak experimental measurements (grey). C, possible combinations of parameters falling inside a 20% variability range from PCa, RT50 and T peak experimental measurements (grey). D, possible combinations of parameters falling inside a 20% variability range from DCa, RT50 and T peak experimental measurements (grey).
Figure 16. All metrics at 6 Hz.

Parameters combinations falling inside (grey) and outside (black) all metrics experimental ranges. A, possible combinations of parameters falling inside a 20% variability range from PCa, DCa, RT50 and T peak experimental measurements at 1 Hz (grey). B, possible combinations of parameters falling inside a 20% variability range from PCa, DCa, RT50 and T peak experimental measurements at 6 Hz (grey).
Table 2.
PCa, DCa, RT50, T peak and Caamp values obtained for the four acceptable parameter combinations
| PCa (μm) | RT50 (ms) | DCa (μm) | T peak (ms) | Caamp (μm) | |||
|---|---|---|---|---|---|---|---|
|
|
1 Hz | 0.998 | 111 | 0.052 | 14 | 0.946 | |
| 6 Hz | 1.014 | 62 | 0.136 | 21 | 0.878 | ||
|
|
1 Hz | 0.845 | 115 | 0.047 | 41 | 0.798 | |
| 6 Hz | 0.923 | 61 | 0.125 | 26 | 0.798 | ||
|
|
1 Hz | 0.920 | 124 | 0.044 | 38 | 0.876 | |
| 6 Hz | 1.042 | 67 | 0.146 | 21 | 0.896 | ||
|
|
1 Hz | 1.014 | 121 | 0.049 | 34 | 0.964 | |
| 6 Hz | 1.071 | 68 | 0.151 | 20 | 0.919 |
Energy cost
To determine if the changes in Ca2+ kinetics are associated with a change in the energetic cost of maintaining ionic homeostasis, we calculated the ATP consumption over one cardiac cycle. For each ion transporter, taking into account its specific stoichiometry (SERCA: 2 Ca2+ : 1 ATP; PMCa: 1 Ca2+ : 1 ATP; and Na+/K+: 3 Na+ : 1 ATP), we calculated the ATP consumption per cardiac cycle as the integral of the rate of ATP consumption over each cardiac cycle.
Comparison of ATP consumption per cardiac cycle showed no relevant changes, with total values of 31.15 and 32.55 μm per beat respectively in the SHAM and AB cases at 6 Hz. ATP consumption by SERCA, Na+/K+ and PMCa at 6 Hz shows values of 24.1, 4.15 and 2.9 μm, respectively, in the SHAM case and 27.4, 2.92 and 2.23 μm, respectively, in the AB case.
Sensitivity analysis
To estimate the importance of different proteins during the progression from SHAM to AB and to distinguish between compensatory and decompensatory mechanisms, a sensitivity analysis was performed. The sensitivity values are shown in Table 3 for both the SHAM and AB cases. In Figs 3 and 4, we compared the effects of the sensitivity analysis in the SHAM model with that in the AB model.
Table 3.
Sensitivity analysis for the SHAM and AB models
| PCa | DCa | RT50 | T peak | ||||||
|---|---|---|---|---|---|---|---|---|---|
| Parameter | Description | SHAM | AB | SHAM | AB | SHAM | AB | SHAM | AB |
| g SERCA | Maximum pump rate of SERCA | −0.301 | 0.138 | −1.217 | −1.588 | −1.515 | −1.493 | 0 | 0 |
| K SERCA | Half saturation of SERCA | 0.351 | −0.029 | 1.246 | 1.173 | 0 | 0 | 0 | 0 |
| g CaB | Conductance of background Ca2+ | 0.050 | 0.024 | 0.0014 | 0.0357 | 0 | 0 | 0 | 0 |
| g t | Conductance of transient outward K+ | −3.355 | 0.280 | −3.563 | 0.1959 | −4.545 | 0 | −3.846 | 0 |
| g K1 | Conductance inward rectifying K+ | −0.304 | 0.080 | −0.352 | −0.0211 | 0 | 0 | 0 | 0 |
| g Na | Conductance of inward Na+ | −0.157 | −0.027 | 8.7 × 10⁻⁵ | −0.098 | 0 | 0 | 0 | 0 |
| g ss | Conductance of steady state K+ | −0.664 | 0.004 | −0.744 | −0.003 | −1.515 | 0 | 0 | 0 |
| V L | Potential when half LCC channels are open | −0.664 | −0.087 | 3.242 | −0.217 | 4.546 | 0 | 3.846 | 0 |
| K L | Concentration at LCC inactivation | 3.111 | 0.481 | 1.061 | 1.299 | 1.515 | 1.492 | 0 | 0 |
| J L | Permeability of a single LCC | 5.706 | 0.342 | 5.777 | −0.132 | 7.576 | −1.492 | 7.692 | 0 |
| g NCX | Pump rate of NCX | −0.151 | −0.335 | −0.169 | −0.302 | 0 | 0 | 0 | 0 |
Sensitivity values Si,j, where i are the phenotypes and j are the tested parameters. In the case of the sensitivity being positive, an increase in the parameter will lead to an increase in the output. In the case of the sensitivity being negative, an increase in the parameter will lead to a decrease in the output.
Figure 3. Sensitivity analysis on PCa and DCa at 1%.
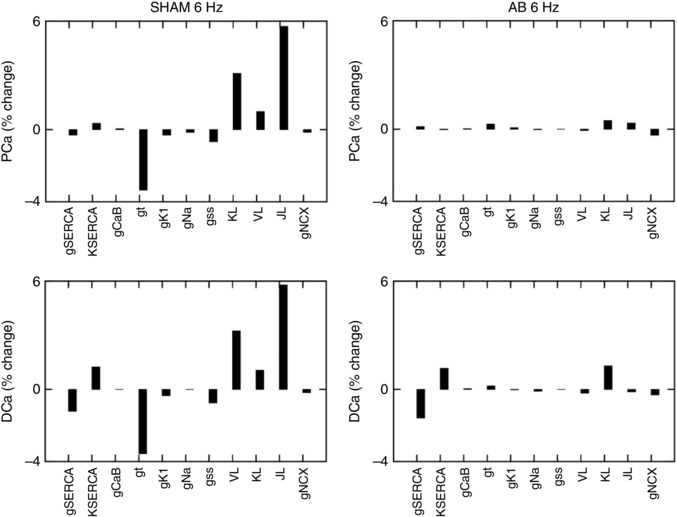
Percentage changes in peak [Ca2+]i (PCa) and diastolic [Ca2+]i (DCa) in the SHAM case (left panels) and AB case (right panels). Sensitivity was studied by performing a 1% increase of the most important protein parameters changing from SHAM to AB: g SERCA, K SERCA, g CaB, g t, g K1, g Na, g ss, J L and g NCX. In the case of the sensitivity value being positive, an increase in the parameter will lead to an increase in the output. In the case of the sensitivity value being negative, an increase in the parameter will lead to a decrease in the output.
Figure 4. Sensitivity analysis on RT50 and T peak at 1%.
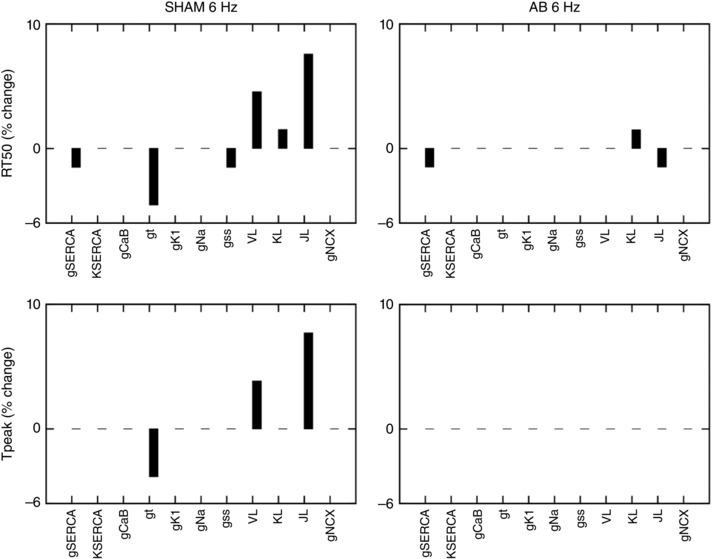
Percentage change in relaxation time at 50% (RT50) and time to peak [Ca2+]i (T PEAK) in the SHAM case (left panels) and AB case (right panels). Sensitivity was studied by performing a 1% increase of the most important protein parameters changing from SHAM to AB: g SERCA, K SERCA, g CaB, g t, g K1, g Na, g ss, J L and g NCX. In the case of the sensitivity value being positive, an increase in the parameter will lead to an increase in the output. In the case of the sensitivity value being negative, an increase in the parameter will lead to a decrease in the output.
The sensitivity analysis for the SHAM model at 6 Hz in Fig. 3, reveals the dominant role of the L‐type channel and transient outward K+ current parameter changes on all the studied Ca2+ phenotypes. In Table 3 we show that in the SHAM case a 1% increase in J L (LCC permeability) leads to a 5.7% increase in PCa, 5.8% increase in DCa, 7.6% increase in RT50 and 7.7% increase in T peak. Conversely, a 1% increase in g t (I to conductance) leads to a 3.3% decrease in PCa, 3.6% decrease in DCa, 4.5% decrease in RT50 and 3.8% decrease in T peak.
In the AB model at 6 Hz in Fig. 4 we see a reduced magnitude in the sensitivity for almost all parameters. In Table 3 we show that none of the tested parameters has a dominant role on PCa or T peak in the AB model. A 1% increase in all tested parameters leads to less than 0.5% change in PCa and no change in T peak. A dominant role of g SERCA is visible on DCa where a 1% increase in this parameters produces a 1.6% decrease in DCa. J L and g SERCA have major effects on RT50 where a 1% increase in both those parameters leads to a 1.5% decrease in RT50.
Backward and forward projections
To observe the joint effect of all altered subcellular proteins during the transition from SHAM to the final AB state, in Fig. 5 we simulated backward and forward projections on the Ca2+ transient and AP. Starting from the AB model, we performed a 10% backward linear change in all parameters (towards the SHAM case) and a 10%, 20% and 50% linear change in all parameters forward towards the AB case. In Fig. 5, starting from the AB case and moving forward we see a significantly reduced PCa for only minor changes in DCa, suggesting that the system as a whole is compensating by reducing DCa at the expenses of PCa.
Figure 5. Backward and forward projections.
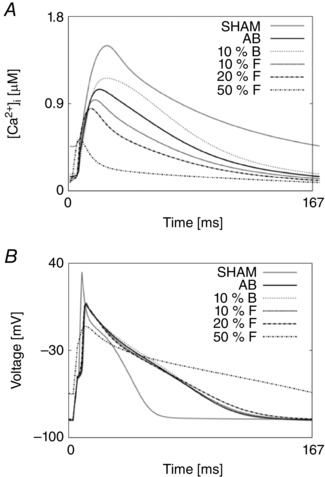
Starting from the AB model, we performed a 10% backward change in all parameters (towards the SHAM case) and a 10%, 20% and 50% forward change in all parameters (towards the AB case). A, simulated changes in the calcium transient. B, simulated changes in the AP.
Discussion
Alterations of excitation–contraction coupling, resulting from altered proteins in calcium homeostasis, are thought to play a critical role in heart failure (Balke & Shorofsky, 1998; Hasenfuss, 1998; Wasserstrom et al. 2009; Luo & Anderson, 2013). As many of the cellular mechanisms responsible for the development of hypertrophy and its progression to HF have not yet been identified, a better understanding of the primary mechanisms involved in this process has the potential to facilitate the development of new therapeutic techniques and ultimately guide prevention.
We have developed a biophysical model of rat ventricular cardiac myocyte electrophysiology and Ca2+ dynamics, parameterized at physiological temperature and pacing frequency and capable of capturing Ca2+ and AP responses in both the SHAM and AB conditions. To both test the relevance of our model and underpin the conclusions derived from it, we also performed a comprehensive validation exercise. To reveal the main Ca2+ pathways responsible for the changes in the transition from SHAM to AB and distinguish between compensatory and decompensatory mechanisms, we have performed a sensitivity analysis of the responses of Ca2+ phenotypes to changes in the key [Ca2+]i proteins during the progression of diastolic dysfunction, 6 weeks post‐AB, in rats. Experimentally, the animals do not show signs of HF. These results show that the ability to dynamically change systolic Ca2+, through changes in expression of key Ca2+ modelling protein densities, is drastically reduced following the AB procedure. However the cells are able to compensate Ca2+ homeostasis and efficiently minimize diastolic dysfunction caused by passive stiffening of the myocardium (Røe et al. 2017).
Phenotype and current changes following AB
Our model‐based findings are consistent with the major part of the experimental literature. In the AB model we reported a decrease in PCa and Ca2+ amplitude compared with the SHAM case at 6 Hz. This finding is consistent with both the experimental data in this study and the work done by Moore et al. (1991) who showed the peak and amplitude of the Ca2+ transient to decrease in rat hypertrophied cardiac myocytes following occlusion of the left renal artery. Both our experimental measurements and our simulations showed reduced DCa at 6 Hz in the AB case compared with the SHAM, consistent with results of Bing et al. (1991) in spontaneously hypertensive rats. Following the AB procedure, the RT50 value was shown to decrease in both our experimental and our simulated results at 6 Hz.
In our experiments we reported an increase in the L‐type Ca2+, SERCA and NCX channels following the AB procedure. Consistent with the experimental measurements and the work by Xiao & Mcardle (1994) and Keung (1989), who reported an increase in the L‐type Ca2+ channel density for moderate hypertrophy cases, in the AB model we showed an increase in L‐type Ca2+ channel density.
We simulated an increase in SERCA activity following AB, concordant with the experimental measurements in this work. Many studies have reported decreased SERCA activity or gene expression in hypertrophy and HF (Studer et al. 1994; Miyamoto et al. 2000), an observation that is not replicated in our work. Decreased SERCA expression and function are a consistent finding in severe HF and are thought to be responsible for prolonged relaxation leading to failure. Movsesian & Schwinger (1998) found that the levels of SERCA and phospholamban are comparable in normal and failing human myocardium and Feldman et al. (1993) reported decreased Ca2+‐ATPase mRNA in rats 20 weeks after AB with no change in the early stages (8 weeks after AB) suggesting that the decrease in Ca2+‐ATPase mRNA levels may be a marker of the transition from compensatory hypertrophy to failure in rats.
In our simulation study, we reported increased NCX activity following AB, consistent with the experimental data in our work and the majority of results in the literature (Studer et al. 1994; Reinecke et al. 1996) while others showed decreased NCX activity (Hanf et al. 1988). In the AB experiments we showed a prolongation of the electrical AP compared with the SHAM case. Human and animal models of hypertrophy and failure previously showed a prolongation of the electrical AP (Scamps et al. 1990; Beuckelmann et al. 1992; Meszaros et al. 1996; Wickenden et al. 1998; Tomaselli, 1999), thought to be caused by a significantly reduced density of the transient outward potassium current (I to) (Tomita et al. 1994; Meszaros et al. 1996; Wickenden et al. 1998; Tomaselli, 1999), an observation that is captured by the model. Despite these changes, in the AB model we predicted no change in the ATP consumption at 6 Hz, compared with the SHAM model. Consistent with these findings, previous work in mice developed by Li et al. (2012) showed the ATP consumption per cardiac cycle to be maintained in the early stages of HF. Overall results in Fig. 5, suggest that the model is acting to reduce DCa although PCa is drastically reduced.
Validation
In our work, we have implemented our validation method by exploring 5814 permutations of parameters to show that model components, in combination with parameters in our model, provide a robust representation of the effects of AB in cardiac myocytes. In Figs. 10 and 13 of the Appendix we observe a very large number of parameter combinations falling inside a 20% variability of single metrics in both the 1 Hz and the 6 Hz cases (positive cases in grey). Positive cases are spread among different models in the PCa, RT50 and T peak tables at 1 Hz while we see clustered columns of positive cases in the DCa table, corresponding to all models that include SERCA changes and thus suggesting that SERCA is the principle mechanism responsible for decreased DCa in the AB model at 1 Hz frequency. The same analysis can be done for the single metrics at 6 Hz although we report mainly positive cases in the RT50 and T peak tables and the DCa table shows clustered positive cases only when SERCA changes are coupled with NCX changes, thus suggesting a possible secondary role of NCX in decreasing DCa in the AB model.
When looking at metric couples and triplets in Figs 11, 12, 14 and 15 in the Appendix, we see a drastically reduced number of positive cases. In particular, when observing the effects of changes in all metrics together in Fig. 16, removing the AB cases that clearly fall in the 20% ranges, we see only three grey boxes at 1 Hz and four grey boxes at 6 Hz. Among these combinations, only four parameter combinations are able to match all four phenotypes at both pacing frequencies. This method demonstrates that our choice of parameters provides a robust representation of the effects of AB in cardiac myocytes, validating the parameter set. Furthermore, as none of the parameter combinations gave positive results for all Ca2+ metrics at 1 and 6 Hz, when only including the data‐driven Ca2+ changes of LCC, NCX and SERCA, we conclude that reduced Na+ and K+ currents are not solely responsible for the increased APD; however, they are implicated in Ca2+ changes in the AB models.
Reduced ability to dynamically change Ca2+ following AB
The sensitivity analysis shows that the L‐type channel (J L) and transient outward K+ (g t) conductivities are important in the SHAM model in that increased J L leads to increased PCa, DCa, RT50 and T peak while increased g t leads to decreased PCa, DCa, RT50 and T peak. The magnitude of this sensitivity is drastically reduced following AB. The ability to dynamically change systolic Ca2+ is an important property of cardiac myocytes in so much that it enables regulation of the strength of cardiac contraction and thus plays a role in the regulation of blood supply throughout the body across a wide range of different conditions, including exercise. In this context, reduced magnitude of the sensitivity following AB is a clear sign of diminishing function, in the sense that the system is less responsive to changes in the AB state compared with the SHAM state. Despite numerous investigations, the role of L‐type Ca2+ channels in the pathogenesis of cardiac hypertrophy and HF remains controversial (Shorofsky et al. 1998). Studies in rats have reported unchanged (Scamps et al. 1990; Shorofsky et al. 1998) increased (Keung, 1989; Xiao & Mcardle, 1994) or decreased L‐type channel density (Santos et al. 1995). In particular, the effects of cardiac hypertrophy on cardiac L‐type Ca2+ currents seem to depend on the progression of the disease. Xiao & Mcardle (1994) observed an increase in L‐type Ca2+ current density in spontaneously hypertensive rat myocytes at 10 weeks, whereas other investigators predicted no change in current density in rat cells at a later age (Brooksby et al. 1993; Cerbai et al. 1994). Our sensitivity analysis shows a drastic reduction in systolic Ca2+ sensitivity to L‐type Ca2+ from SHAM to AB, consistent with the idea of a change in the L‐type channel behaviour during disease progression (Santos et al. 1995). Effects of protein changes on DCa are also potential markers of diminishing function. It is worth noting that SERCA is an exception to this trend, being the only mechanism able to reduce DCa and amplify its effect following AB. This result not only confirms the importance of SERCA in maintaining the DCa level at the expenses of systolic Ca2+ but highlights its unique role as a possible marker of the transition from compensatory hypertrophy to failure in rats, as postulated previously by Feldman et al. (1993). In this context it is particularly interesting to observe the direction of the effects. Specifically, if a protein continues to increase (or decrease) the question is, will its effect on a given Ca2+ phenotype reverse? Assuming that changes in phenotypes are monotonic when increasing or decreasing parameters, compensatory effects will be concordant in the SHAM and AB cases (both positive and negative) while decompensatory effects will be discordant in the SHAM and AB cases (one positive, one negative). In this way, we assume that there is a protein direction of change at SHAM that will improve function. However, if the sensitivity is discordant then this means that this given protein is having the opposite effect on Ca2+ function in AB compared with SHAM animals, thereby indicating a transition where changes in a protein that were initially beneficial are now detrimental. In our sensitivity analysis, all the SERCA, inward rectifying K+ current, steady state K+ current and transient outward K+ current parameters show decompensatory effects on peak Ca2+ while the L‐type Ca2+ current, the inward Na+ current and the transient outward K+ current parameters show decompensatory effects on diastolic Ca2+. Focusing on the magnitude of the sensitivity, the L‐type Ca2+ channel and the transient outward K+ channel are the most significant pathways regulating PCa while SERCA is the most significant pathway regulating DCa. The transient outward K+ channel shows decompensatory effects on both PCa and DCa while the L‐type Ca2+ current reveals a compensatory effect on PCa and a decompensatory effect on DCa. SERCA changes reveal a compensatory effect on DCa and a decompensatory effect on PCa. Overall, results following AB reveal the major compensatory effect of SERCA on DCa at the expenses of PCa, highlighting the trend of the system to reduce DCa in order to maintain a physiological Ca2+ balance as a response to AB (see Fig. 5). Furthermore, Fig. 5 reveals non‐significant changes in AP with the backward and forward projections at 10% and 20% levels, suggesting that the AP is not affecting the calcium transient. An increase in the resting membrane potential and a prolongation of the AP is observed at a 50% forward change in parameters.
Conclusions
In our work we have concluded that in rats where the systolic properties of the ventricle are not altered 6 weeks after the AB procedure, the cellular system reveals the first signs of disease as its ability to dynamically change systolic and diastolic Ca2+ is drastically reduced. Following compensated AB, SERCA is the only major Ca2+ handling protein that maintains its principal role in ensuring low DCa levels, confirming its unique role as a possible marker of the transition from compensatory hypertrophy to failure in rats.
Appendix
In our work we have re‐parameterized the electrophysiology model developed by Gattoni et al. (2016). Here we describe the model parameter re‐fitting procedure for all the fitted channels within the control (SHAM) model and the aortic‐banding (AB) model, we show the validation procedure and results, and we highlight the main limitations of the work.
Parameter refitting procedure
The parameter fitting procedure adopted to re‐parameterize the electrophysiology framework developed in Gattoni et al. (2016) is described in detail. A summary of all the fitted parameters within the SHAM and AB models is shown in Tables 4 and 5, respectively.
Table 4.
Summary of all the fitted parameters in the SHAM model
| Parameter | Unit | Definition | |
|---|---|---|---|
|
|
μm 3 ms–1 | Pump rate of NCX | |
|
|
μm 3 ms–1 | Maximum pump rate of sarcolemmal pump | |
|
|
mm | Half saturation of sarcolemmal pump | |
|
|
μm 3 ms–1 | Maximum pump rate of SERCA at 1 Hz | |
|
|
mm | Half saturation of SERCA at 1 Hz | |
|
|
μm 3 ms–1 | Maximum pump rate of SERCA at 6 Hz | |
|
|
mm | Half saturation of SERCA at 6 Hz | |
|
|
μm 3 ms–1 | Permeability of single LCC | |
|
|
mm | Concentration at inactivation LCC | |
|
|
mV | Potential when half LCC open | |
|
|
mV | Width of opening potential | |
|
|
Unitless | Proportion of time closed in open mode LCC | |
|
|
ms | Inactivation time | |
|
|
μm 3 ms–1 | Permeability of the leak current from the dyadic space | |
|
|
ms–1 | Rate of leak from the SR to the cytosol | |
|
|
mm mV–1 ms–1 | Background Ca2+ current rate | |
|
|
mS | Permeability of the transient outward potassium current | |
|
|
mS | Permeability of the steady state potassium current | |
|
|
mS | Permeability of the inward rectifying current | |
|
|
mS | Permeability of the inward sodium current |
Table 5.
Summary of all the fitted parameters in the AB model
| AB fitted parameters | |||
|---|---|---|---|
| Parameter | Unit | Definition | |
|
|
μm 3 ms–1 | Pump rate of NCX | |
|
|
μm 3 ms–1 | Maximum pump rate of sarcolemmal pump | |
|
|
mm | Half‐saturation of sarcolemmal pump | |
|
|
μm 3 ms–1 | Maximum pump rate of SERCA at 1 Hz | |
|
|
mm | Half‐saturation of SERCA at 1 Hz | |
|
|
μm 3 ms–1 | Maximum pump rate of SERCA at 6 Hz | |
|
|
mm | Half saturation of SERCA at 6 Hz | |
|
|
μm 3 ms–1 | Permeability of single LCC | |
|
|
mm | Concentration at inactivation LCC | |
|
|
mV | Potential when half LCC open | |
|
|
mV | Width of opening potential | |
|
|
Unitless | Proportion of time closed in open mode LCC | |
|
|
ms | Inactivation time | |
|
|
μm 3 ms–1 | Permeability of the leak current from the dyadic space | |
|
|
ms–1 | Rate of leak from the SR to the cytosol | |
|
|
mm mV–1 ms–1 | Background Ca2+ current rate | |
|
|
mS | Permeability of the transient outward potassium current | |
|
|
mS | Permeability of the steady state potassium current | |
|
|
mS | Permeability of the inward rectifying current | |
|
|
mS | Permeability of the inward sodium current | |
Temperature was set to 310 K or 37°C to reflect experimental conditions that mimicked physiological temperatures. The parameters for capacitance, volumes, buffering parameters and intracellular and extracellular concentrations were kept constant from the model of a healthy myocyte (Gattoni et al. 2016), as these were not measured directly and there were no reports indicating that these values change under AB conditions.
Parameters for NCX, PMCa, SERCA, LCC and background Ca2+ were refitted as in Gattoni et al. (2016) with fitted results for NCX, SERCA and LCC shown in Figs 6, 7 and 8, respectively.
Figure 6. Caffeine transients and NCX fitting results.
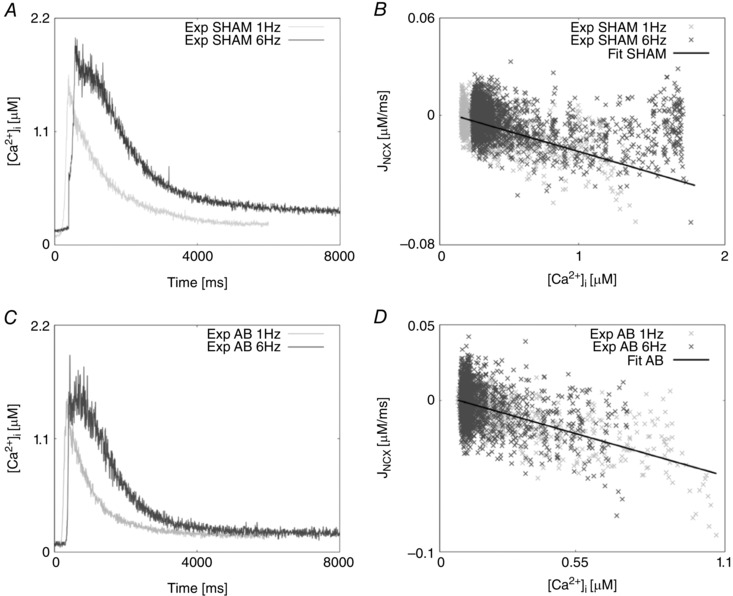
A, experimentally measured caffeine‐induced transients for the SHAM case recorded at 1 Hz (light grey) and 6 Hz (dark grey). B, NCX flux (J NCX) as a function of internal Ca2+ in the SHAM case at 1 Hz (light grey) and 6 Hz (dark grey). The fitting is represented by a straight line (black). C, experimentally measured caffeine‐induced transients for the AB case recorded at 1 Hz (light grey) and 6 Hz (dark grey). D, NCX flux (J NCX) as a function of internal Ca2+ in the AB case at 1 Hz (light grey) and 6 Hz (dark grey). The fitting is represented by a straight line (black).
Figure 7. Calcium transients and SERCA fitting results.
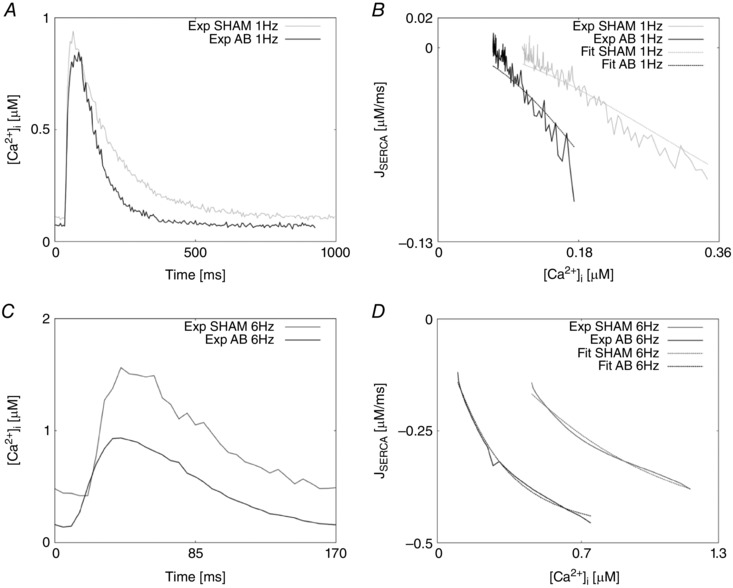
A, experimentally measured Ca2+ transients recorded at 1 Hz in the SHAM case (grey) and AB case (black). B, SERCA flux (J SERCA) as a function of internal Ca2+ at 1 Hz in the SHAM case (continuous grey line) and AB case (continuous black line). Fittings at 1 Hz are represented in the SHAM case (dashed grey line) and AB case (dashed black line). C, experimentally measured Ca2+ transients recorded at 6 Hz in the SHAM case (grey) and AB case (black). D, SERCA flux (J SERCA) as a function of internal Ca2+ at 6 Hz in the SHAM case (continuous grey line) and AB case (continuous black line). Fittings at 6 Hz are represented in the SHAM case (dashed grey line) and AB case (dashed black line).
Figure 8. LCC fitting procedure and results.
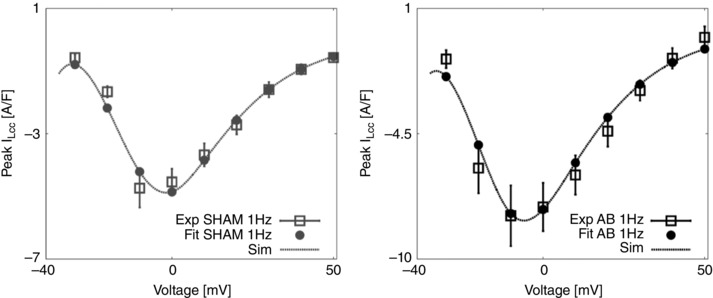
Left, bell shaped peak I LCC–V relationship, experiments for the SHAM case at 1 Hz are represented as mean ± standard deviation (grey boxes) and fit (grey circles and dashed grey line). Right, bell shaped peak I LCC–V relationship, experiments for the AB case at 1 Hz are represented as mean ± standard deviation (black boxes) and fit (black circles and dashed black line).
Specific fittings of I to, I K1, I ss and I Na to account for AB AP phenotypes are described below.
K+ currents (I to, I K1, I ss)
Prolongation of the cardiac action potential is a feature of cardiac hypertrophy and has been previously reported in many studies including rat left ventricular myocardium following infarction (Qin et al. 1996; Rozanski et al. 1998), catecholamine‐induced rat hypertrophy (Meszaros et al. 1996), rat hypertrophy following aortic banding (Scamps et al. 1990) and human heart failure (Beuckelmann et al. 1992). The experimental studies we have performed in rats at 37°C revealed a major increase in APD in the AB case compared with the SHAM case at both 1 Hz and 6 Hz frequencies (as seen in Fig. 3 in the main text). Changes in Ca2+ dynamics alone did not allow such a degree of APD increase at either frequency suggesting that major changes in Na+ and K+ current could be responsible for this behaviour. Potential contributors to increased APD duration are the transient outward K+ current (), the inwardly rectifying K+ current () and the steady state K+ current (), all playing a significant role in rat repolarization (Amin et al. 2010; Chae et al. 2012). A decrease in repolarizing K+ currents has been previously reported in cells from failing human hearts (Beuckelmann et al. 1992) and rat models of heart disease (Scamps et al. 1990; Meszaros et al. 1996; Qin et al. 1996; Wickenden et al. 1997; Rozanski et al. 1998). Kaprielian et al. (Kaprielian et al. 1999) showed a decrease in current of about 45% in rats myocytes following aortic banding compared with myocytes from sham‐operated rats. A similar result was obtained by Benitah et al. (Bénitah et al. 1993) and Tomita et al. (Tomita et al. 1994) in rats following AB. A reduction in current was also shown by Qin et al. in rats following coronary artery ligation (Qin et al. 1996) and Meszaros et al. (Meszaros et al. 1996) who performed studies in rat with catecholamine‐induced cardiac hypertrophy and showed unchanged kinetics but 50% decrease in current, thought to be responsible for prolonged APD. A reduction of the current during the development of hypertrophy and HF was reported in many animal studies. Among those, Kaprielian et al. (Kaprielian et al. 1999) showed a decrease in current of about 25% in rats with aortic banding and the same finding was supported by Qin et al. (Qin et al. 1996). Fauconnier et al. (Fauconnier et al. 2005) showed a reduction of the current in rats with HF. Reduced activity was also shown in failing human hearts (Beuckelmann et al. 1992) and in rabbits with hypertrophy where Pogwidz et al. measured a 49% decrease in the current. The steady‐state K+ current was also reported to be slightly decreased in rats following aortic banding (Kaprielian et al. 1999). Following the results reported in the literature, in our model we have decreased the , and currents by reducing the correspondent conductivities (see Table 5), in order to obtain prolonged APD and simulated Ca2+ transient as close as possible to the experimental Ca2+ transients.
Intracellular Na+ current (I Na)
Previous studies reported a reduction in the intracellular Na+ current in rats (Nand & Doggrell, 2000), dogs (Maltsev et al. 2002) and human (Hasenfuss et al. 1999; Pieske, 2002). We reduced the conductivity parameter in the AB model to achieve the peak of the AP at 1 Hz (see Table 5).
Validation method and tables
We have developed a validation method by exploring nine model variants (LCC, NCX, SERCA, LCC–SERCA, NCX–SERCA, LCC–NCX, LCC–SERCA–NCX, LCC–SERCA–NCX–K–Na and AB), obtained through permutation of parameters. For each simulation we have evaluated four metrics: peak Ca2+ (PCa), diastolic Ca2+ (DCa), relaxation time of the Ca2+ transient at 50% decay (RT50) and time to peak of the Ca2+ transient (T peak). For each box in the tables we have performed 19 different simulations (reproducing the 19 perturbed values for each parameter). The box is coloured in grey if at least one of those 19 simulations falls inside a 20% variability of the metric AB experimental range. For example, if we focus on the top left table in Fig. 10, we are looking at the results for one singe metric PCa. The top left box of this table is grey. In this specific case we have run 19 different simulations starting from the SHAM model (column) by perturbing the parameter g SERCA (row) and in at least one of these 19 simulations we have found a PCa value falling inside a 20% variability of the PCa metric AB experimental range. Trivially, all the boxes for the AB model will be grey, as we already know that there is at least one PCa value falling inside a 20% variability of the PCa metric AB experimental range and that corresponds with the parameter value chosen in our AB model. It must be noted that, when considering more than one Ca2+ phenotype in Figs 11, 12, 14, 15 and 16, the box is coloured in grey if at least one of the 19 simulations falls inside a 20% variability of the considered phenotypes AB experimental range at the same parameter value. In this way, Fig. 16 shows that the AB models are able to replicate all four key phenotypes used to characterize cellular Ca2+ handling at both 1 Hz and 6 Hz.
Among the 5814 combinations tested in the validation process only four parameter combinations are able to match all four phenotypes at both pacing frequencies and correspond to an increase in Ca2+ pump conductivity g PCa and a decrease in the background current conductivity g CaB . In Table 2 we show the resulting PCa, DCa, RT50, T peak and Caamp values for those four parameter combinations.
Limitations and future directions
The developed model reveals a number of limitations that were already discussed in Gattoni et al. (2016). No experimental data were available regarding the behaviour of the Na+ and K+ channels in both the SHAM and AB conditions. Collection of new experimental data on Na+ and K+ channels and their changes with frequency and temperature will certainly help to make the model more reliable.
Alternative Ca2+ regulators and pathways may also be important. In particular late Na+, store‐operated calcium entry (SOCE) and transient receptor potential (TRP) channels might influence both systolic and diastolic calcium concentrations, and we did not have sufficient data to constrain these potential contributors to Ca2+ regulation. However, recent studies have shown that SOCE only appears in about 30% of hypertrophied rat myocytes and are absent from adult cardiomyocytes (Luo et al. 2012) while TRP channels are indicated as having a role in Ca2+ dynamics but through manipulating Ca2+ regulation as opposed to acting as a Ca2+ pathway (Eder & Molkentin, 2011). Furthermore, the model we developed is not a classic systolic heart failure model, being based on data acquired during concentric hypertrophy, a condition under which there is much less known about the influence of late Na+, SOCE and TRP channels. The current data available are unable to quantify the possible effect by these alternative Ca2+ regulators and pathways and their role under conditions of concentric hypertrophy cannot be ruled out. It is also worth noting that, due to the significant differences in calcium handling between rats and mice compared with other mammalian species, the model predictions about the roles of LCC and SERCA may not hold true in other species.
The model was fitted to representative traces. In Table 1 the peak Ca2+ at 1 Hz in the representative traces decreased by 10% between the control and the AB rats, while the model predicts an increase of 2.7%. This is caused by an elevated prediction of the peak Ca2+ in the AB model. While the model does not capture the small decrease at 1 Hz, the much larger (40%) decrease in peak Ca2+ at the more physiological 6 Hz is captured and the model replicates the overall Ca2+ transient shape, as shown in Fig. 1.
Furthermore, in our model we have reported an increase in the SR load in the AB case compared with the SHAM case, consistent with an increase in SERCA activity reported both experimentally and in our simulations. In their paper, Røe et al. (2017) reported a decreased magnitude of the caffeine‐induced Ca2+ transient suggesting a decreased SR load. A decrease in SR load, despite an increase in SERCA, could be explained by a sustained elevated leak from the SR. However, we had no recordings to support this.
Although the choice of 20% variability ranges in the validation process can also be seen as a limitation in our model, it was made due to the high variability of data and our Ca2+ results were shown to be good approximations of the experimental results.
In our work, the effects of AB were only assessed 6 weeks after ligation of the aorta. As a feature work, it will be interesting to observe the temporal changes during the development of diastolic dysfunction following AB. In particular, the results of our work have highlighted SERCA as a possible marker of the transition from a compensatory to a decompensatory state; experimental data at 12 weeks will be helpful to confirm or reject this hypothesis.
Additional information
Competing interests
The authors declare there are no competing interests.
Author contributions
S.G. re‐fitted the model, performed the analyses and wrote the manuscript. A.T.R, J.M.A. and W.L. acquired the data and assisted in the writing of the manuscript. S.A.N. and N.P.S. contributed to the conception and motivation of the analysis and to the interpretation of the results, and assisted in the writing of the manuscript. All authors approved the final version of the manuscript. All authors agree to be accountable for all aspects of the work in ensuring that questions related to the accuracy or integrity of any part of the work are appropriately investigated and resolved. All persons designated as authors qualify for authorship.
Funding
This work was supported by the Virtual Physiological Rat Project (NIH 1 P50 GM094503‐01). The project has also received funding from the European Union's Horizon 2020 research and innovation programme (Consolidator grant, WEL) under grant agreement No 647714, South‐Eastern Norway Regional Health Authority, Anders Jahre's Fund for the Promotion of Science, the Norwegian Institute of Public Health, Oslo University Hospital Ullevål, and the University of Oslo. The authors acknowledge financial support from the Department of Health via the National Institute for Health Research (NIHR) comprehensive Biomedical Research Centre award to Guy's and St Thomas’ NHS Foundation Trust in partnership with King's College London and King's College Hospital NHS Foundation Trust.
References
- Aeschbacher BC, Hutter D, Fuhrer J, Weidmann P, Delacrétaz E & Allemann Y (2001). Diastolic dysfunction precedes myocardial hypertrophy in the development of hypertension. Am J Hypertens 14, 106–113. [DOI] [PubMed] [Google Scholar]
- Amin AS, Tan HL & Wilde AAM (2010). Cardiac ion channels in health and disease. Hear Rhythm 7, 117–126. [DOI] [PubMed] [Google Scholar]
- Bailey BA & Houser SR (1992). Calcium transients in feline left ventricular myocytes with hypertrophy induced by slow progressive pressure overload. J Mol Cell Cardiol 24, 365–373. [DOI] [PubMed] [Google Scholar]
- Balke CW & Shorofsky SR (1998). Alterations in calcium handling in cardiac hypertrophy and heart failure. Cardiovasc Res 37, 290–299. [DOI] [PubMed] [Google Scholar]
- Bénitah JP, Gomez AM, Bailly P, Da Ponte JP, Berson G, Delgado C & Lorente P (1993). Heterogeneity of the early outward current in ventricular cells isolated from normal and hypertrophied rat hearts. J Physiol 469, 111–138. [DOI] [PMC free article] [PubMed] [Google Scholar]
- Beuckelmann DJ, Näbauer M & Erdmann E (1992). Intracellular calcium handling in isolated ventricular myocytes from patients with terminal heart failure. Circulation 85, 1046–1055. [DOI] [PubMed] [Google Scholar]
- Bing OH, Brooks WW, Conrad CH, Sen S, Perreault CL & Morgan JP (1991). Intracellular calcium transients in myocardium from spontaneously hypertensive rats during the transition to heart failure. Circ Res 68, 1390–1400. [DOI] [PubMed] [Google Scholar]
- Brooksby P, Levi AJ & Jones JV (1993). The electrophysiological characteristics of hypertrophied ventricular myocytes from the spontaneously hypertensive rat. J Hypertens 11, 611–622. [DOI] [PubMed] [Google Scholar]
- Cerbai E, Barbieri M & Mugelli A (1994). Characterization of the hyperpolarization‐activated current, I f, in ventricular myocytes isolated from hypertensive rats. J Physiol 481, 585–591. [DOI] [PMC free article] [PubMed] [Google Scholar]
- Chae JE, Kim HS, Ahn DS & Park WK (2012). Ionic mechanisms of desflurane on prolongation of action potential duration in rat ventricular myocytes. Yonsei Med J 53, 204–212. [DOI] [PMC free article] [PubMed] [Google Scholar]
- Cingolani OH, Yang X‐P, Cavasin MA & Carretero OA (2003). Increased systolic performance with diastolic dysfunction in adult spontaneously hypertensive rats. Hypertension 41, 249–254. [DOI] [PubMed] [Google Scholar]
- deAlmeida AC, van Oort RJ & Wehrens XHT (2010). Transverse aortic constriction in mice. J Vis Exp 1729. [DOI] [PMC free article] [PubMed] [Google Scholar]
- Drazner MH (2011). The progression of hypertensive heart disease. Circulation 123, 327–334. [DOI] [PubMed] [Google Scholar]
- Eder P & Molkentin JD (2011). TRPC channels as effectors of cardiac hypertrophy. Circ Res 108, 265–272. [DOI] [PubMed] [Google Scholar]
- Fabiato A & Fabiato F (1979). Calcium and cardiac excitation‐contraction coupling. Annu Rev Physiol 41, 473–484. [DOI] [PubMed] [Google Scholar]
- Fauconnier J, Lacampagne A, Rauzier J‐M, Vassort G & Richard S (2005). Ca2+‐dependent reduction of IK1 in rat ventricular cells: a novel paradigm for arrhythmia in heart failure? Cardiovasc Res 68, 204–212. [DOI] [PubMed] [Google Scholar]
- Feldman AM, Weinberg EO, Ray PE & Lorell BH (1993). Selective changes in cardiac gene expression during compensated hypertrophy and the transition to cardiac decompensation in rats with chronic aortic banding. Circ Res 73, 184–192. [DOI] [PubMed] [Google Scholar]
- Gattoni S, Røe ÅT, Frisk M, Louch WE, Niederer SA & Smith NP (2016). The calcium‐frequency response in the rat ventricular myocyte: An experimental and modeling study. J Physiol 594, 4193–4224. [DOI] [PMC free article] [PubMed] [Google Scholar]
- Hanf R, Drubaix I, Marotte F & Lelievre LG (1988). Rat cardiac hypertrophy. Altered sodium‐calcium exchange activity in sarcolemmal vesicles. FEBS Lett 236, 145–149. [DOI] [PubMed] [Google Scholar]
- Hasenfuss G (1998). Alterations of calcium‐regulatory proteins in heart failure. Cardiovasc Res 37, 279–289. [DOI] [PubMed] [Google Scholar]
- Hasenfuss G, Schillinger W, Lehnart SE, Preuss M, Pieske B, Maier LS, Prestle J, Minami K & Just H (1999). Relationship between Na+‐Ca2+‐exchanger protein levels and diastolic function of failing human myocardium. Circulation 99, 641–648. [DOI] [PubMed] [Google Scholar]
- Hobai IA & Levi AJ (1999). Coming full circle: membrane potential, sarcolemmal calcium influx and excitation‐contraction coupling in heart muscle. Cardiovasc Res 44, 477–487. [DOI] [PubMed] [Google Scholar]
- Kaprielian R, Wickenden AD, Kassiri Z, Parker TG, Liu PP & Backx PH (1999). Relationship between K+ channel down‐regulation and [Ca2+]i in rat ventricular myocytes following myocardial infarction. J Physiol 517, 229–245. [DOI] [PMC free article] [PubMed] [Google Scholar]
- Keung EC (1989). Calcium current is increased in isolated adult myocytes from hypertrophied rat myocardium. Circ Res 64, 753–763. [DOI] [PubMed] [Google Scholar]
- Li L, Louch WE, Niederer SA, Aronsen JM, Christensen G, Sejersted OM & Smith NP (2012). Sodium accumulation in SERCA knockout‐induced heart failure. Biophys J 102, 2039–2048. [DOI] [PMC free article] [PubMed] [Google Scholar]
- Litwin SE, Katz SE, Weinberg EO, Lorell BH, Aurigemma GP & Douglas PS (1995). Serial echocardiographic‐Doppler assessment of left ventricular geometry and function in rats with pressure‐overload hypertrophy. Chronic angiotensin‐converting enzyme inhibition attenuates the transition to heart failure. Circulation 91, 2642–2654. [DOI] [PubMed] [Google Scholar]
- Luo M & Anderson ME (2013). Mechanisms of altered Ca2+ handling in heart failure. Circ Res 113, 690–708. [DOI] [PMC free article] [PubMed] [Google Scholar]
- Luo X, Hojayev B, Jiang N, Wang ZV, Tandan S, Rakalin A, Rothermel BA, Gillette TG & Hill JA (2012). STIM1‐dependent store‐operated Ca2+ entry is required for pathological cardiac hypertrophy. J Mol Cell Cardiol 52, 136–147. [DOI] [PMC free article] [PubMed] [Google Scholar]
- Maltsev VA, Sabbah HN & Undrovinas AI (2002). Down‐regulation of sodium current in chronic heart failure: effect of long‐term therapy with carvedilol. Cell Mol Life Sci 59, 1561–1568. [DOI] [PMC free article] [PubMed] [Google Scholar]
- Meszaros J, Ryder KO & Hart G (1996). Transient outward current in catecholamine‐induced cardiac hypertrophy in the rat. Am J Physiol Heart Circ Physiol 271, H2360–H2367. [DOI] [PubMed] [Google Scholar]
- Miyamoto MI, del Monte F, Schmidt U, DiSalvo TS, Kang ZB, Matsui T, Guerrero JL, Gwathmey JK, Rosenzweig A & Hajjar RJ (2000). Adenoviral gene transfer of SERCA2a improves left‐ventricular function in aortic‐banded rats in transition to heart failure. Proc Natl Acad Sci USA 97, 793–798. [DOI] [PMC free article] [PubMed] [Google Scholar]
- Momtaz A, Coulombe A, Richer P, Mercadier JJ & Coraboeuf E (1996). Action potential and plateau ionic currents in moderately and severely DOCA‐salt hypertrophied rat hearts. J Mol Cell Cardiol 28, 2511–2522. [DOI] [PubMed] [Google Scholar]
- Moore RL, Yelamarty RV, Misawa H, Scaduto RC, Pawlush DG, Elensky M & Cheung JY (1991). Altered Ca2+ dynamics in single cardiac myocytes from renovascular hypertensive rats. Am J Physiol Cell Physiol 260, C327–C337. [DOI] [PubMed] [Google Scholar]
- Movsesian MA & Schwinger RH (1998). Calcium sequestration by the sarcoplasmic reticulum in heart failure. Cardiovasc Res 37, 352–359. [DOI] [PubMed] [Google Scholar]
- Nand V & Doggrell SA (2000). Effects of azimilide on cardiovascular tissues from normo‐ and hypertensive rats. J Cardiovasc Pharmacol 36, 209–217. [DOI] [PubMed] [Google Scholar]
- Pieske B (2002). Rate dependence of [Na+]i and contractility in nonfailing and failing human myocardium. Circulation 106, 447–453. [DOI] [PubMed] [Google Scholar]
- Qin D, Zhang Z‐H, Caref EB, Boutjdir M, Jain P & El‐Sherif N (1996). Cellular and ionic basis of arrhythmias in postinfarction remodeled ventricular myocardium. Circ Res 79, 461–473. [DOI] [PubMed] [Google Scholar]
- Reinecke H, Studer R, Vetter R, Holtz J & Drexler H (1996). Cardiac Na+/Ca2+ exchange activity in patients with end‐stage heart failure. Cardiovasc Res 31, 48–54. [PubMed] [Google Scholar]
- Røe ÅT, Aronsen JM, Skårdal K, Hamdani N, Linke WA, Danielsen HE, Sejersted OM, Sjaastad I & Louch WE (2017). Increased passive stiffness promotes diastolic dysfunction despite improved Ca2+ handling during left ventricular concentric hypertrophy. Cardiovasc Res. https://doi.org/10.1093/cvr/cvx087. [DOI] [PMC free article] [PubMed] [Google Scholar]
- Rozanski GJ, Xu Z, Zhang K & Patel KP (1998). Altered K+ current of ventricular myocytes in rats with chronic myocardial infarction. Am J Physiol Hear Circ Physiol 274, H259–H265. [DOI] [PubMed] [Google Scholar]
- Santos PE, Barcellos LC, Mill JG & Masuda MO (1995). Ventricular action potential and L‐type calcium channel in infarct‐induced hypertrophy in rats. J Cardiovasc Electrophysiol 6, 1004–1014. [DOI] [PubMed] [Google Scholar]
- Scamps F, Mayoux E, Charlemagne D & Vassort G (1990). Calcium current in single cells isolated from normal and hypertrophied rat heart. Effects of beta‐adrenergic stimulation. Circ Res 67, 199–208. [DOI] [PubMed] [Google Scholar]
- Sham JS, Cleemann L & Morad M (1995). Functional coupling of Ca2+ channels and ryanodine receptors in cardiac myocytes. Proc Natl Acad Sci USA 92, 121–125. [DOI] [PMC free article] [PubMed] [Google Scholar]
- Shorofsky SR, Aggarwal R, Corretti M, Baffa JM, Strum JM, Al‐Seikhan BA, Kobayashi YM, Jones LR, Wier WG & Balke CW (1999). Cellular mechanisms of altered contractility in the hypertrophied heart: big hearts, big sparks. Circ Res 84, 424–434. [DOI] [PubMed] [Google Scholar]
- Shorofsky SR, Balke CW & Gwathmey JK (1998). Calcium channels in cardiac hypertrophy and heart failure. Heart Fail Rev 2, 163–171. [Google Scholar]
- Siri FM, Krueger J, Nordin C, Ming Z & Aronson RS (1991). Depressed intracellular calcium transients and contraction in myocytes from hypertrophied and failing guinea pig hearts. Am J Physiol Heart Circ Physiol 261, H514–H530. [DOI] [PubMed] [Google Scholar]
- Studer R, Reinecke H, Bilger J, Eschenhagen T, Böhm M, Hasenfuss G, Just H, Holtz J & Drexler H (1994). Gene expression of the cardiac Na+‐Ca2+ exchanger in end‐stage human heart failure. Circ Res 75, 443–453. [DOI] [PubMed] [Google Scholar]
- Tomaselli G (1999). Electrophysiological remodeling in hypertrophy and heart failure. Cardiovasc Res 42, 270–283. [DOI] [PubMed] [Google Scholar]
- Tomita F, Bassett AL, Myerburg RJ & Kimura S (1994). Diminished transient outward currents in rat hypertrophied ventricular myocytes. Circ Res 75, 296–303. [DOI] [PubMed] [Google Scholar]
- Wasserstrom JA, Sharma R, Kapur S, Kelly JE, Kadish AH, Balke CW & Aistrup GL (2009). Multiple defects in intracellular calcium cycling in whole failing rat heart. Circ Heart Fail 2, 223–232. [DOI] [PubMed] [Google Scholar]
- Wickenden AD, Kaprielian R, Kassiri Z, Tsoporis JN, Tsushima R, Fishman GI & Backx PH (1998). The role of action potential prolongation and altered intracellular calcium handling in the pathogenesis of heart failure. Cardiovasc Res 37, 312–323. [DOI] [PubMed] [Google Scholar]
- Wickenden AD, Kaprielian R, Parker TG, Jones OT & Backx PH (1997). Effects of development and thyroid hormone on K+ currents and K+ channel gene expression in rat ventricle. J Physiol 504, 271–286. [DOI] [PMC free article] [PubMed] [Google Scholar]
- Xiao Y‐F & Mcardle JJ (1994). Elevated density and altered pharmacologic properties of myocardial calicum current of the spontaneously hypertensive rat. J Hypertens 12, 783–790. [PubMed] [Google Scholar]


